early career teacher perceptions of leadership, … manuscript 030717.pdf · two dimensions of p-e...
TRANSCRIPT

Please do not cite without authors’ permission.
1
EARLY CAREER TEACHER PERCEPTIONS OF LEADERSHIP, LEVELS OF FIT,
AND ATTRITION IN HARD-TO-FILL VS. EASY-TO-FILL TEACHING POSITIONS
Frank Perrone
Peter Youngs
Dan Player
University of Virginia

Please do not cite without authors’ permission.
2
Introduction
The importance of quality teaching is irrefutable and the fact that teachers are the most
important school-level factor in student learning is well-established (e.g., Rivkin, Hanushek, &
Kain, 2005; Rockoff, 2004). Unfortunately, the United States has shifted from a period of teacher
surplus to teacher shortage (Westervelt, 2015) with high-poverty schools disproportionately and
experiencing this shortage (U.S. Department of Education, 2016). Teacher attrition plays a key
role in this teacher shortage while costing U.S. schools an estimated $2.2 billion annually
(Ingersoll & Perda, 2010) and disrupting student learning, teacher quality, and school
performance (Barnes, Crowe, & Schaefer, 2007; Grissmer & Kirby, 1997; Guarino, Santibanez,
& Daley, 2006; Ingersoll, 2001; Ronfeldt, Loeb, & Wyckoff, 2013). Attrition also has the most
detrimental effects on student learning in low-performing, high-poverty schools (Ronfeldt et al.,
2013), the same schools that generally have the most difficulty attracting qualified teachers (e.g.,
Engel & Finch, 2015; Goldhaber, Lavery, & Theobold, 2015).
One particular strain of teacher attrition research focuses on early career teachers (ECTs)
and for good reason: teachers with five or less years of teaching experience have the highest
attrition rates of teachers not eligible for retirement (Marvel et al., 2007). These ECT attrition
rates are especially high in low-achieving, high-poverty schools (e.g., Hanushek, Kain, &
Rivkin, 2004; Ingersoll, 2004), the same group of schools that also traditionally fills vacancies
with ECTs (e.g., Marinell & Coca, 2013). Because teacher effectiveness increases the most in the
early stages of a teacher’s career (e.g., Henry, Bastian, & Fortner, 2011; Papay & Kraft, 2015),
ECT turnover can translate into lost investment and potential, especially for high-poverty schools
that conventionally are more likely to hire ECTs while they struggle to retain and attract faculty.
As the U.S. Department of Education (2016) identifies a growing need for teachers, it
also reports that certain subject area positions are harder to fill than others. Prior research

Please do not cite without authors’ permission.
3
demonstrates that shortages in some areas, for instance science and math, are due to higher
attrition levels as opposed to inadequate teacher production (Ingersoll & May, 2012; Ingersoll &
Perda, 2010). Thus, it is critical for schools to keep teachers in these hard-to-staff positions,
especially ECTs in high-poverty, high-minority (HPHM) schools that traditionally struggle to
attract teachers to fill open positions.
While research tells us that numerous teacher and school characteristics and working
conditions predict teacher mobility, these relationships may be hinting at levels of teacher fit.
The sense of match between teacher and school can be situated within the overall concept of
person-environment (P-E) fit in industrial and organizational (I-O) psychology (Kristof, 1996).
Two dimensions of P-E fit receive substantial research attention: person-organization (P-O) fit
(the degree to which an employee’s preferences and values match those of the organization) and
person-job (P-J) fit (the degree to which an employee’s abilities match those of the position and
profession) (Kristof, 1996). Meta-analyses in other fields demonstrate a moderate correlation
between different measures of P-E fit and employee attrition (Hoffman & Woehr, 2006; Kristof-
Brown et al., 2005; Verquer, Beehr, & Wagner, 2003). In education, a small but growing
research base has shown moderate to strong correlations between P-O fit and teacher
commitment to the school (Chan et al., 2008; Pogodzinski, Youngs, & Frank, 2013) and actual
teacher mobility decisions (Player, Youngs, Perrone, & Grogan, under review).
Logic dictates that qualified beginning teachers in coveted subject areas and grade-levels
will have more teaching opportunities than their peers. It also seems reasonable to assume that a
teacher with more teaching job opportunities will choose to work in the school she feels is the
best fit for her. On the other hand, a school attempting to fill a traditionally easy-to-fill position
would likely have more candidates and more choice, and be more likely to hire a good fit. This

Please do not cite without authors’ permission.
4
study seeks to understand the relationships among school leadership, P-J fit, and teacher
retention in regards to beginning teachers filling hard-to-staff and easy-to-staff teaching
positions.
In the first section of this paper, we review previous literature focused on beginning
teacher attrition (i.e., teacher and school characteristics), principal leadership, hiring, and fit in
education. In the second section, we present my study’s hypotheses. In the third section of the
paper, we explain our sample, research methods, and analytic strategy. We then present our
findings and conclude by discussing the study’s implications.
Literature Review
Teacher Characteristics
Experience and Ethnicity. Though early career teacher attrition figures in the past may
have been exaggerated due to a lack of representative longitudinal data (Brown, 2015), teacher
attrition is nonetheless high for newer teachers; roughly 17% of teachers leave the profession
within their first five years on the job (Gray & Taie, 2015). Attrition rates traditionally taper off
after the first five years until the average teacher becomes eligible for retirement benefits (Allen,
2005). This early leaving is concerning not only because of the traditional problems with teacher
turnover (e.g., financial cost, time allocated to finding a replacement); teachers experience their
greatest gains in effectiveness during their first few years on the job (e.g., Boyd, Lankford, Loeb,
Rockoff, & Wyckoff, 2008; Henry et al., 2011; Papay & Kraft, 2015). Thus, early departure may
unduly harm HPHM schools as they not only tend to have higher turnover and more ECTs;
HPHM schools disproportionately replace leaving novices with other first-year teachers (e.g.,
Allensworth, Ponisciak, & Mazzeo, 2009; Marinell & Coca, 2013).

Please do not cite without authors’ permission.
5
Researchers have also paid substantial attention to entrance and retention patterns for
minority teachers. In the first decade of the 21st century, minority teacher production growth has
kept pace with growing minority student populations and exceeded that of white teachers
(Ingersoll & May, 2012). However, the minority teacher supply did not keep up with increases in
minority student populations due to higher minority teacher turnover. Achinstein, Ogawa,
Sexton, and Freitas (2010) and Ingersoll and May (2012) found that minority teachers are more
likely to begin teaching in HPHM schools, in which working conditions are, on average, more
difficult. Achinstein et al. (2010) also found that minority teachers of color are more likely than
white teachers to work and remain in HPHM urban schools that are difficult to staff. Similar
tendencies exist in terms of teacher and school location.
Geographic and Contextual Familiarity. Teachers tend to want to work in schools that
are in the same or similar geographic locations in which they grew up and they generally prefer
teaching students with whom they are culturally familiar (Cannata, 2010; Engel & Cannata,
2015; Reininger, 2012). For instance, Whipp and Geronime (2015) found that having attended an
urban school can predict working and staying in an urban school as a teacher for at least three
years. Unfortunately, relatively smaller percentages of teaching candidates come out of such
schools and neighborhoods (Donaldson, 2013; Reininger, 2012). The disadvantage these
teaching preferences have for high-poverty and high-minority schools is apparent.
School Characteristics
Teacher characteristics and school characteristics converge in much research, but in
general, teachers favor and sort into suburban, low-poverty, low-minority, and relatively higher-
performing schools (Boyd et al., 2013). This is reflected in the continued struggle for rural and
urban, high-poverty, high-minority, and/or lower-achieving schools to attract, hire, and retain

Please do not cite without authors’ permission.
6
teachers (e.g., Allen, 2005; Guarino et al., 2006; Goldhaber, Lavery, & Theobold, 2015; Sass,
Flores, Claeys, & Pérez, 2012). The relationships among these school characteristics are often
complicated and difficult to disentangle as urbanicity, minority enrollments, student poverty
rates, and school performance levels are often tied closely together.
Urbanicity. School urbanicity plays a large role in teacher recruitment and retention. As
teachers gain experience in rural and urban schools, they tend to move to suburban schools (e.g.,
Boyd, Lankford, Loeb, & Wyckoff, 2005; Cannata, 2010; Hanushek et al., 2004; Miller, 2012).
Exacerbating unequal distribution of teachers across school types, teachers with better
qualifications generally sort into suburban schools and districts (Boyd, Lankford, Loeb, &
Wyckoff, 2002; Goldhaber et al., 2015). Previously noted teacher inclination to teach in
geographically and ethnically close or familiar sites appears to be a driving force behind this
teacher movement (Boyd et al., 2005; Cannata, 2010; Reininger, 2012).
School Income Level. Schools serving low-poverty populations have long been known to
have lower attrition rates than those serving high-poverty populations (e.g., Ingersoll, 2001). In
2012-13, schools with relatively low rates of poverty (0-34% students eligible for free or
reduced-price lunch (FRL)) experienced 12.8% turnover while high-poverty schools (75-100%
FRL) saw a 22% teacher turnover rate that same year (U.S. Department of Education, 2014). To
better understand the compounding effects of a 20% attrition rate, Chicago Public Schools (CPS)
buildings with a 20% turnover rate often lose over half of their teaching faculty within a five-
year period (Achenstein, 2009). Many of these CPS schools lose over 50% of their teachers in
just three years. Regular high turnover rates can have a dramatic impact on school continuity and
culture.

Please do not cite without authors’ permission.
7
School Performance. Also often linked to school poverty, student composition, and
urbanicity, level of student achievement is known to predict teacher recruitment and turnover
(Borman & Dowling, 2008). High-stakes testing has exacerbated staffing problems in low-
performing institutions as low-performing schools have seen increased turnover after high-stakes
testing introduction (Boyd et al., 2008; Clotfelter et al., 2004). A similar difference is evident in
teacher recruitment today as CPS’ high-performing, high-minority urban schools receive more
applications than their low-performing neighbors (Engel & Finch, 2015). Though many CPS
schools might be traditionally labeled “hard-to-staff” because of school demographics, the
disparity in teacher applications - some schools received five applications for a single position
while others saw roughly 200 - shows that high-performing, HPHM schools may be easier to
staff than their low-performing within-district neighbors.
Principal Leadership
Principal leadership plays a key role in teacher attrition, both directly and indirectly.
Indirectly, the principal is largely responsible for many aspects of a teacher’s working conditions
that predict job satisfaction, burnout, and career intent (e.g., Grayson & Alvarez, 2008; Ingersoll
& May, 2012). Working conditions are increasingly accepted to be the most important factor in
teacher mobility (e.g., Johnson, Kraft, & Papay, 2012), research demonstrates that principal
leadership is the most prominent aspect of these working conditions.
Analyzing North Carolina’s rich 2006 administrative data and a comprehensive statewide
teacher survey, Ladd (2011) found that a measure of leadership was the aspect of teacher
working conditions most strongly tied to teacher retention. The survey had a statewide response
rate exceeding 70% and state data was used to track mobility for one year after survey
completion. Ladd’s linear probability regressions revealed that the higher quality of leadership

Please do not cite without authors’ permission.
8
reported by teachers, the more likely they were to plan to remain teaching, plan to remain at the
same school, and actually stay at the same school. Though the factor denoting leadership was
broadly defined due to the wide range of survey questions, the questions did focus on shared
vision, principal support for teachers, trust within the school, and group problem-solving and
decision-making. Because of the nature of the survey questions on leadership, Ladd linked
transformational leadership to higher teacher retention: “These findings are fully consistent with
a transformational model of school leadership” (p. 256). Ladd also found that the effect of
leadership on teacher retention was stronger than that of school poverty rates and ethnicity
compositions.
Using rich data in New York City, Boyd, Grossman, Ing, Lankford, Loeb, & Wyckoff
(2011) also found that perceptions of principal leadership were the strongest predictor of teacher
mobility. In addition to individual responses, the study accounted for other teacher perceptions of
working environment to ensure that individual teacher dissatisfaction did not impact ratings for
school leadership, school safety, faculty collegiality, autonomy, student demographics, and
school facilities to guard against biased individual responses. Both the initial survey to all NYC
beginning teachers and the subsequent follow-up survey to this subset received over 70%
response rates. The survey administered to all recent leaving NYC teachers had a response rate
of 61%. Boyd et al. found that both novice and veteran teacher perceptions of principal
leadership positively predicted retention. The researchers point to administrative support serving
as a critical component in teacher retention.
A number of other studies demonstrate a strong relationship between principal leadership
and teacher mobility. Other quantitative studies show that positive perceptions of leadership in
terms of support, recognition for faculty work, and disciplinary enforcement are strongly

Please do not cite without authors’ permission.
9
associated with teacher retention (e.g., Billingsley & Cross, 1992; Ingersoll, 2001; Johnson et al.,
2012; Marinell & Coca, 2013; Otto & Arnold, 2005). Many of the aforementioned aspects of
leadership can be considered traits and practices of transformational leaders as defined in Bass’
(1990) seminal work. Similar findings from these and other studies emphasize a strong
relationship between instructional leadership and teacher retention as well (e.g., Allensworth,
Ponisciak, & Mazzeo, 2009; Marinell & Coca, 2013). Repeatedly, research also shows that good
principal leadership mitigates the role that other demographic factors play in teacher retention
(Boyd et al., 2011; Gonzalez, Brown, & Slate, 2008; Johnson et al., 2012; Ladd, 2011; Torres,
2014; Waddell, 2010).
Hard-to-Staff Schools, Hard-to-Staff Positions, and Hiring Practices
Hard-to-Staff Schools. It is important to note that a school with low-performing, high-
minority, and/or high-poverty students is not necessarily “hard-to-staff.” Though many studies
have shown that high-poverty, high-minority, and/or low-performing status has a strong
relationship with hiring difficulty (e.g., Allen, 2005; Sass et al., 2012), not every school with
these characteristics faces a hurdle replacing departing teachers (e.g., Chenoweth, 2009; Opfer,
2011). Schools are often automatically and incorrectly considered “hard-to-staff” based solely on
having one or more of these characteristics (Opfer, 2011). There is no question, though, that
certain teaching positions are “hard-to-staff” when compared to others. A clear distinction should
be made between being a hard-to-staff school and specific teaching positions that are hard-to-
staff.
Hard-to-Staff Positions. While studies in the past have examined employment
opportunities for certain subject area teachers (e.g., math, science) both inside and outside of
education, beginning teachers have received less attention by subject taught. Evidence

Please do not cite without authors’ permission.
10
demonstrates that shortages of teachers in certain fields exist, especially for high-poverty schools
(U.S. Department of Education, 2016). These teacher shortage areas are typically hard-to-staff
for HPHM schools. Research also shows that teacher production has kept up with population
growth but that shortages exist because of higher attrition rates in coveted fields such as math
and science (Ingersoll & May, 2012; Ingersoll & Perda, 2010). Therefore, one can reasonably
expect beginning teachers certified in shortage areas (e.g., math, special education) to have
greater teaching opportunities than beginners in areas with surpluses (e.g., English, history).
Little is known, though, about differences in hiring processes by subject area or how well
teachers filling hard-to-staff positions fit their first schools.
Teacher Hiring. Many high-poverty urban districts face difficulties attracting qualified
teachers to fill vacancies created by attrition, especially ECT attrition (Goldhaber et al., 2015;
Engel & Finch, 2015; Neild, Useem, Travers, & Lesnick, 2003). These same schools generally
have small applicant pools as well as working conditions that are blamed for job dissatisfaction,
poor teacher-school matches, and attrition (Liu, Rosenstein, Swan, & Khalil, 2008; Neild et al.,
2003). Additionally, HPHM schools commonly hire later than their middle and low-poverty
counterparts (Levin, Mulhern, & Schunk, 2005; Papa & Dexter, 2008). Liu and Johnson (2006)
showed that later hiring often translates into “rushed” and “information-poor” interviewing in
which the candidate does not gain thorough knowledge of the school’s culture and working
conditions. Liu and Johnson also suggested that such “late, rushed, and information-poor” hiring
often results in poor teacher-school matches. While previous research examines hiring by school
type, it ignores teacher field and how hiring takes place for positions that are difficult to fill for
specific schools on a case-by-case basis.

Please do not cite without authors’ permission.
11
P-J Fit
A high concentration of the teacher attrition literature examines the relationships between
attrition and working conditions (e.g., Boyd et al., 2011; Ladd, 2011), school characteristics
(e.g., Horng, 2009; Johnson et al., 2012), and teacher characteristics (e.g., Borman & Dowling,
2008; Cannata, 2010). In many ways, this research unearths aspects of a teacher’s fit with the
school. For instance, teachers generally prefer to teach in schools similar to the ones they
attended as students (e.g., Cannata, 2010; Engel & Cannata, 2015) and Whipp and Geronime
(2015) found that attending an urban school predicts employment decisions in urban schools.
Therefore, an African American teacher who attended a predominantly African American, urban
school may feel more comfortable teaching in a school with similar demographics. In other
words, this teacher might be a better “fit” for an African American, urban school setting. Such
teacher preference melds with the concept of person-environment P-E fit.
In I-O psychology, person-environment (P-E) fit is the degree to which an employee and
his or her work environment match (Kristoff, 1996). Two domains of P-E fit have received more
attention in educational fit research: person-job (P-O) fit and person-organization (P-O) fit.
Borrowing from Harris and Rutledge’s (2010) applications of these two domains to the teaching
profession, P-J fit measures how well the teacher’s abilities match the teaching profession and
position while P-O fit measures the extent to which a teacher’s preferences and values match
those of the school. While research in other fields has demonstrated strong relationships between
fit and employee commitment, satisfaction, and retention, educational research on fit is still
largely in its infancy stages. In Singapore, Chan et al. (2008) found that P-O fit was strongly
correlated with teacher commitment. In the U.S., Pogodzinski et al. (2013) reported that higher
levels of P-O fit predicted both higher ECT job commitment and intent to remain teaching in the

Please do not cite without authors’ permission.
12
same school. Most recently and using data from the nationally representative 2011-12 Schools
and Staffing Survey (SASS) and 2012-13 Teacher Follow-up Survey (TFS), Player et al. (under
review) determined that low P-J fit predicted leaving the profession.
However, all of these studies focus on teacher fit and either career intent or career
decisions over a short period of time (generally one year and time point). Research has yet to
look at the effects of initial teacher fit on ECT career decisions taking place over consecutive
years. Research also has yet to examine how well beginning teachers fit their schools on a
national level, how principal leadership seems to affect beginning teacher fit, whether a school’s
difficulty level filling a position predicts beginning teacher fit, and if difficulty staffing a position
predicts turnover.
Research Questions and Hypotheses
1. Does teaching in a hard-to-fill position predict beginning perceptions of leadership or
levels of P-J fit?
H1: Teaching in a hard-to-fill position is expected to predict higher levels of
leadership as the principal may treat the respective teacher preferentially due to
difficulty replacing the teacher should he or she leave the school. Teaching in a hard-
to-fill position is not expected to predict beginning teacher P-J fit.
2. Do beginning teachers’ perceptions of leadership and levels of P-J fit in their first year
predict staying, moving, or leaving?
H2a: Higher levels of principal leadership are expected to predict higher rates of
staying and lower rates of moving and leaving. A good perception of leadership is
expected to increase a teacher’s desire to stay in the profession and in the same
school.

Please do not cite without authors’ permission.
13
H2b: Low levels of beginning teacher P-J fit is expected to predict higher levels of
teacher leaving but not staying or moving. A poor fit with the job and profession is
expected to result in a desire to leave the profession.
3. Does teaching in a hard-to-fill position predict beginning teacher staying, moving, or
leaving?
H3: Filling a hard-to-fill position is expected to predict lower rates of staying and
higher rates of moving and leaving. Teachers filling these positions are likely to have
more job choice within the teaching profession, thus more flexibility to move if they
desire. Additionally, many positions that are hard-to-staff may also be occupied by
teachers with more employment opportunities outside of education.
Methods
Data
This study employs the Beginning Teacher Longitudinal Study (BTLS). Administered as
part of the 2007-08 Schools and Staffing Survey (SASS), the nationally representative BTLS
consists of 1,770 regular full-time teachers who began teaching in the 2007-08 school year. The
BTLS follows this cohort over five years (2007-08 to 2011-12) and annually tracks the cohort’s
attitudes and employment statuses. The survey in 2007-08 consists of a rich set of questions
about teacher attitudes and work environments. The subsequent years’ surveys are briefer, asking
fewer and more general questions about changes in working conditions and attitudes as well as
tracking mobility. We merge the BTLS data with the 2007-08 SASS School Survey data to
determine how difficult each beginning teacher’s position was to fill. Lastly, we merge this
Please do not cite without authors’ permission.
14
dataset with the 2007-08 SASS Principal Survey data which provides characteristics for each
teacher’s principal.
We restrict our overall sample in the first BTLS wave to the 1,570 full-time, K-12 public
school teachers survey completers. Our longitudinal analyses use smaller samples as the number
of teachers who responded to the survey grew smaller with each additional year of data. Only
1,130 of the 1,570 regular full-time teachers in the first wave completed the survey across all five
consecutive years. In many cases, teachers stopped filling out the survey after leaving the
profession. However, one cannot determine whether or not the teacher stayed, moved, left, or
reentered the profession in years that the teacher did not fill out the survey. For this reason, we
exclude teachers who did not fill out the survey for three consecutive years prior to leaving in a
three-year sample of 1,360 teachers and a five-year sample of 1,130 teachers. We run three-year
analyses because these years represent the period of greatest teaching gains (Henry et al., 2011)
and cover the period for which teachers are generally labeled novices. The five-year analyses
make use of all available years of data and help inform a better understanding of longer term
trends. Appropriate probability weights are employed in all analyses to account for the SASS’
complex sample design.
Measures
Hard-to-Staff Positions. Teachers were separated into groups of easy-to-fill, somewhat
hard-to-fill, hard-to-fill, and other teaching positions by utilizing one item on the SASS School
Questionnaire. The survey item, “How easy or difficult was it to fill the vacancies for this school
year in each of the following fields?,” was assigned a categorical value (1=Position not offered at
school, 2=No vacancy this year, 3=Easy, 4=Somewhat difficult, 5=Very difficult, 6=Could not
fill vacancy) by the survey respondent for 12 teaching fields. We matched the school SASS

Please do not cite without authors’ permission.
15
responses for each field to each respective beginning teacher’s subject field. Next, we created
indicator variables that identify BTLS teacher positions as easy-to-fill (3=Easy), somewhat hard-
to-fill (4=Somewhat difficult), hard-to-fill (5=Very difficult; 6=Could not fill vacancy)1, and
other (1=Position not offered at school; 2=No vacancy this year). In many of the other
classifications, teacher field taught did not match any of 12 fields listed on SASS questionnaire2.
Principal Leadership and P-J Fit Measures. We created measures of fit using a
confirmatory factor analysis (CFA) approach on survey items we hypothesized to indicate
measures of principal leadership and P-J fit. (See Appendix Table for final survey items and
factor loadings.) To ensure consistency, some item responses were directionally recoded so that
the most positive potential attitudinal four-point Likert-scale responses were set equal to four and
the lowest set equal to one. One survey item, “I would certainly become a teacher if I had to go
back and start over,” had a five-point Likert scale response and was directionally recoded so that
the most positive answer was equal to five. The ordinal nature of the item responses necessitated
generalized structural equation modeling (GSEM).
Our final two-factor GSEM structure is made up of 9 items. Four items load onto the
leadership factor and five items load onto the PJ fit factor. All 9 items have a loading that is
higher than Comrey and Lee’s (1992) widely used criteria of 0.45 for “fair.” (See Appendix
Figure for structure and loadings.) In total, 8 of the 9 items exceed the threshold for “good”
(0.55) with 1 item meeting the “very good” criteria and 5 meeting the “excellent” criteria. We
1 We assigned teachers in subject areas that the schools listed as “Could not fill vacancy” as
“Very difficult-to-fill” under the assumption that the teacher filled the position after the school
year started, indicating serious difficulty filling the position. 2 Other corresponds with the teachers filling positions for which there was “No vacancy this
year” reported or who taught in fields not covered in the 12 categories on the SASS
questionnaire. Teachers in this other subgroup predominantly taught physical education and
health (n=YY, % of whole sample).

Please do not cite without authors’ permission.
16
triangulate our goodness of fit with a 2-index presentation approach reports Goodness-of-Fit
(GFI), Adjusted Goodness-of- Fit (AGFI), Comparative Fit Index (CFI), and Root Mean Squared
Error of Approximation (RMSEA). Our final model exceeds all of the adequate fit criteria (
(𝜒2(23, N=1,620 = 214.544, p<.001; CFI = 0.985; SRMR = 0.030; TLI = 0.973; and RMSEA =
0.050).
Least squares regressions were used to predict factor scores on all 1,620 full-time
beginning K-12 public school teachers who completed the first BTLS survey. The leadership and
P-J factors were then standardized to have means of 0 and standard deviations of 1 across this
base year sample to ease interpretation of later regression results.
Mobility. Mobility outcomes are measured using three binary outcome variables based on
mobility status collected over the 2008-09, 2009-2010, 2011-12, and 2012-13 BTLS waves.
These outcome variables indicate whether the teachers are movers (switch schools), leavers
(leave the profession), or turnovers (switch schools or leave the profession) at each of the four
mobility measurement time points. While some teachers left the profession only to return in later
survey years, we treat these teachers as leavers and do not account for their reentries into
teaching. We do this for two central reasons. One, this prevents us from inaccurately counting
turnovers who reentered and then turned over again as having multiple moves and/or leaves.
Such teachers could misleadingly inflate teacher moving and leaving rates. Second, our
longitudinal approaches, as described in the next section, require us to treat leaving as a terminal
outcome.
Analytical Approach
Research Question #1: Does teaching in an easy-to-fill, somewhat hard-to-fill, or hard-
to-fill position predict beginning teacher perceptions of leadership?

Please do not cite without authors’ permission.
17
We answer this question using the linear regression in Model 1 below:
𝑌𝑖 = 𝛽0 + 𝛽1𝐷𝑖𝑓𝑓𝐹𝑖𝑙𝑙𝑖𝑛𝑔𝑖 + 𝛽2𝑋𝑖 + 𝛽3𝑆𝑖 + 𝛾𝑠 + 𝜀𝑖 (1)
where Y is a measure of the variable of interest (leadership or P-J fit) for teacher 𝑖 in the first year
of the BTLS and 𝐷𝑖𝑓𝑓𝑆𝑡𝑎𝑓𝑓𝑖𝑛𝑔 is a vector of variables indicating the difficulty the school had
filling beginning teacher 𝑖’s position (i.e., easy-to-fill, somewhat hard-to-fill, hard-to-fill, other).
𝑋𝑖 is a vector of time invariant teacher characteristics recorded in the base year that includes
indicators for gender, age (over 30 years old), ethnicity (black, white, Hispanic), being the same
race as the other teachers, students, and principal at the school, holding a master’s degree in
education (M.Ed.), union membership, regular certification (i.e., not alternative), and subject
area taught (13 possible classifications in accordance with SASS School Questionnaire options
for filling different subject area positions), as well as a log of teaching salary and the number of
Individualized Education Plan (IEP) and Limited English Proficient (LEP) students in the base
year. 𝑆𝑖 is a vector of time invariant school characteristics that includes indicators for whether
the school had an induction program for new teachers, charter status, Title I status, school level
(i.e., elementary, middle, high, combined/other), and urban locale (i.e., urban, suburban, rural) as
well as the school percentages of minority students and minority teachers. Longitudinal
probability weights and base replicate weights for the first wave of the BTLS are utilized in this
model.
Research Question #2: Do beginning teachers’ perceptions of leadership and P-J fit in
their first year predict staying, moving, or leaving?
We answer this research question using two approaches. The first approach uses the
following model to determine the mobility (moving, leaving, and turnover) over three and five
year periods in a teacher’s career:

Please do not cite without authors’ permission.
18
𝑃𝑟(𝑚𝑜𝑏𝑖𝑙𝑖𝑡𝑦𝑖) = 𝛽1𝐿𝑒𝑎𝑑𝑒𝑟𝑠ℎ𝑖𝑝𝑖 + 𝛽2𝑃𝐽𝐹𝑖𝑡𝑖 + 𝛽3𝑋𝑖 + 𝛽4𝑆𝑖 + 𝜀𝑖 (2)
where 𝑚𝑜𝑏𝑖𝑙𝑖𝑡𝑦 represents the probability of moving (compared to staying and leaving), leaving
(compared to staying and moving), or turnover (compared to staying) for teacher i, over the three
and five year periods. 𝐿𝑒𝑎𝑑𝑒𝑟𝑠ℎ𝑖𝑝𝑖 is a measure of leadership and 𝑃𝐽𝐹𝑖𝑡𝑖 is a measure of P-J fit. 𝑋𝑖
and 𝑆𝑖 are the same time invariant vectors of teacher and school characteristics used in Model 1.
These control variables all have established relationships with teacher mobility. We also employed
models that added the 𝐷𝑖𝑓𝑓𝑆𝑡𝑎𝑓𝑓𝑖𝑛𝑔 indicators and these are noted in all of the results tables. We
employ appropriate longitudinal probability weights and base replicate weights contingent upon the
span of the sample (three-year or five-year).
We also use a single risk discrete-time survival analysis to account for the potential effect
that time has on attrition and a sample size that changes from year to year. Following Singer and
Willet (1993), this analysis builds upon the logistic regression in Model 2. The discrete-time survival
treats the data as a panel where each subject is observed until either 1) the observation period ends or
2) the teacher leaves the profession. Thus, the discrete-time survival analysis adds time parameters to
Model 1:
𝑃𝑟(𝑚𝑜𝑏𝑖𝑙𝑖𝑡𝑦𝑖𝑗) = 𝛼1 𝑇1𝑖𝑗 + 𝛼2 𝑇2𝑖𝑗 + 𝛼3 𝑇3𝑖𝑗 + 𝛼4 𝑇4𝑖𝑗 + 𝛽1𝐿𝑒𝑎𝑑𝑒𝑟𝑠ℎ𝑖𝑝𝑖 + 𝛽2𝑃𝐽𝐹𝑖𝑡𝑖 +
𝛽3𝑋𝑖 + 𝛽4𝑆𝑖 + 𝜀𝑖𝑗
(2)
In this equation, 𝑃𝑟(𝑚𝑜𝑏𝑖𝑙𝑖𝑡𝑦𝑖𝑗) is equal to zero if teacher i does not experience leaving, moving, or
a combination of the two in period j and equal to one if teacher i does make a corresponding decision
to not stay during time period j. It is important to note that though there are five years of data in the
BTLS, there are only four possible attrition points as teacher mobility is measured at the beginning
of the 2008-09, 2009-10, 2010-11, and 2011-12 survey waves. Thus, the discrete-time survival

Please do not cite without authors’ permission.
19
equation adds estimators for four parameters (𝛼1, 𝛼2, 𝛼3, 𝛼4) to time indicators (𝑇1𝑖𝑗, 𝑇2𝑖𝑗, 𝑇3𝑖𝑗,
𝑇4𝑖𝑗) that identify teacher i ‘s mobility by year j. In this equation, 𝑇1𝑖𝑗 indicates the time point at the
beginning of the 2008-09 school year and 𝑇4𝑖𝑗 represents the start of the 2011-12 school year. All
other controls are the same as those in Models 1 and 2.
Model 3 is then extended to include interactions between the variables of interest (leadership
and P-O fit) and year for further analysis and to check for other relationships with time. This fully
interactive model is as follows:
𝑃𝑟(𝑚𝑜𝑏𝑖𝑙𝑖𝑡𝑦𝑖𝑗) = 𝛼1 𝑇1𝑖𝑗+. . . 𝑇4𝑖𝑗 + 𝛽1𝐿𝑒𝑎𝑑𝑒𝑟𝑠ℎ𝑖𝑝𝑖 + 𝛽2𝐿𝑒𝑎𝑑𝑒𝑟𝑠ℎ𝑖𝑝𝑖 ∗ 𝑇1𝑖𝑗 + … 𝛽10𝑃𝐽𝐹𝑖𝑡𝑖 ∗
𝑇4𝑖𝑗 + 𝛽11𝑋𝑖 + 𝛽12𝑆𝑖 + 𝜀𝑖𝑗
(4)
As is common practice with categorical outcome variables and logistic regression, results for
Models 2, 3, and 4 are presented using odds ratios (OR)3. It is important to remember that the
leadership and P-J fit factors are standardized. Thus, ORs for indicate odds of a change per one
standard deviation.
One limitation to the discrete-time survival analysis is its inability to account for moving.
Moving is an intermediary outcome and the survival analysis is designed to measure terminal
outcome (in this case, leaving the profession). To partially account for this limitation, we run several
additional analyses in which turnover (either moving or leaving) is our outcome. This limitation to
3 ORs are exponentiated coefficient values that give the odds of one binary event occurring
relative to the alternative binary outcome. An OR of 1.0 indicates that the odds of both events
occurring in relation to the respective variable are the same. An OR greater than 1.0 means that
the outcome has greater odds of happening and an OR less than 1.0 means that the outcome has
lower odds of happening. For instance, if the outcome a logistic model is turnover and the odds
ratio reported for female is 1.2, a female teacher has 20 percent higher odds of turning over
relative to staying than a male teacher. An OR of 0.7 for female would indicate 30 percent lower
odds of a female teacher turning over relative to staying.

Please do not cite without authors’ permission.
20
the discrete-time survival approach is also why we use Model 2 despite the longitudinal nature of the
data.
In order to account for differences in sample sizes by year, we assigned the longitudinal
survey weight corresponding to the respective year of each mobility measurement to our analyses.
Finally, robust standard errors are clustered at the teacher level due to potentially correlated error
terms resulting from multiple observations for the same teachers.
Research Question #3: Does teaching in an easy-to fill, somewhat hard-to-fill, or hard-to-
fill position predict beginning teacher staying, moving, or leaving?
We apply Models 2, 3, and 4 to this research question as in the research question above
(RQ1) by substituting 𝐷𝑖𝑓𝑓𝑆𝑡𝑎𝑓𝑓𝑖𝑛𝑔𝑖 (a vector of indicators for the level of difficulty filling the
position) for 𝐿𝑒𝑎𝑑𝑒𝑟𝑠ℎ𝑖𝑝𝑖 and 𝑃𝐽𝐹𝑖𝑡𝑖 . We also ran models that included 𝐿𝑒𝑎𝑑𝑒𝑟𝑠ℎ𝑖𝑝𝑖 and 𝑃𝐽𝐹𝑖𝑡𝑖 as
well as models adding interactions between 𝐿𝑒𝑎𝑑𝑒𝑟𝑠ℎ𝑖𝑝𝑖 and 𝐷𝑖𝑓𝑓𝑖𝑐𝑢𝑙𝑡𝑖 in the fully interactive
Model 4.
Findings
Differences by Difficulty Filling the Position
Beginning teacher characteristics predictably varied by the level of difficulty a school had
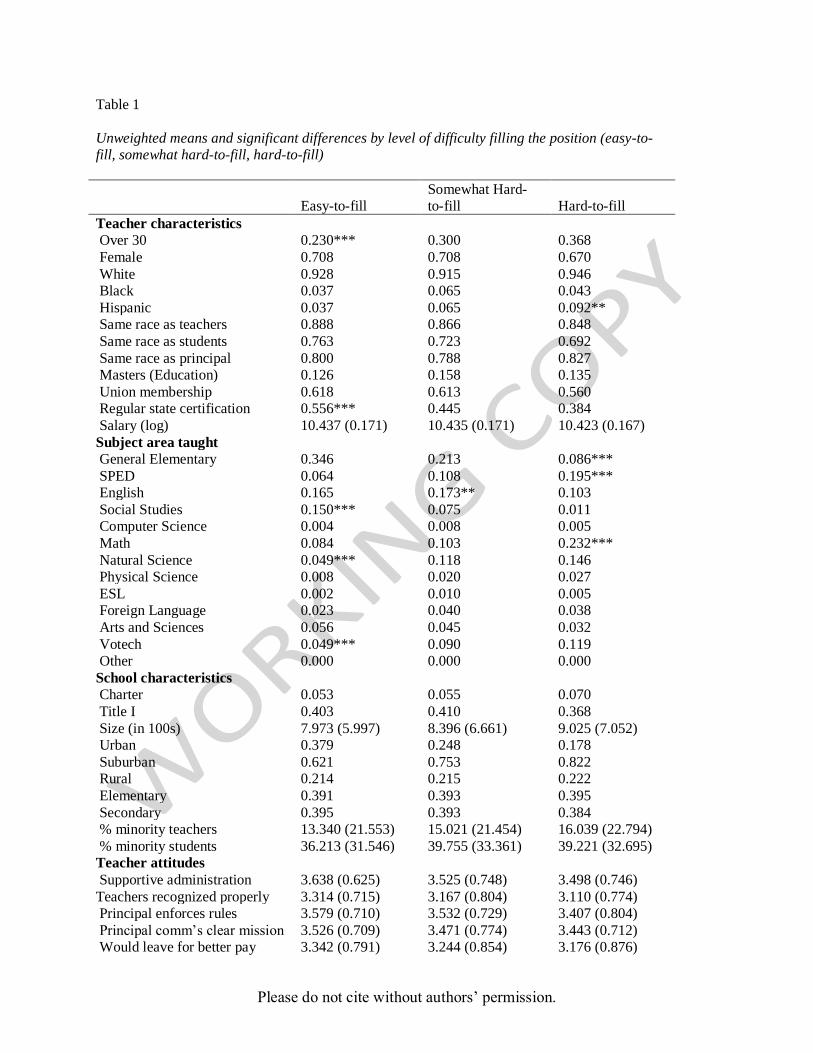
filling the position. This is evident as Table 1 provides unweighted descriptive statistics for the
three teacher groups of interest (easy-to-fill, somewhat hard-to-fill, hard-to-fill). One-way
ANOVAs and subsequent Tukey’s HSD tests were conducted to determine significant
differences among the three group means. Demographically, teachers occupying easy-to-fill (EF)
positions were significantly younger (23% under 30 years old opposed to 30% somewhat hard-
to-fill (SHF) and 37% hard-to-fill (HF)), less Hispanic (4% vs. 7% SHF and 9% HF), and more

Please do not cite without authors’ permission.
21
likely to hold regular certification (56% vs. 45% SHF and 38% HF) (see Table 1). EF teachers
were also more likely to teach social studies (15% vs. 8% SHF and 1% HF) and less likely to
teach natural sciences (5% vs. 12% SHF and 15% HF). Meanwhile, HF teachers were
significantly much less likely to teach general elementary classes (9% HF vs. 35% EF and 21%
SHF) while much more likely to fill special education (20% vs. 6% EF and 10% SHF) and math
(23% vs. 8% EF and 10% SHF) positions. EF teachers also had much higher levels of both P-O
fit (0.181 vs. -0.069 SHF and -0.211 HF) and P-J fit (0.175 vs. -0.031 SHF and -0.176 HF).
Responses to question items underlying the P-O and P-J fit factors were generally more positive
for easy-to-fill teachers as well.
A descriptive analysis of all full-time BTLS K-12 teachers can be seen in Table 2. For the
purposes of increased sample size and a comparable reference group in regression analyses, we
compared the group of teachers who filled positions for which recruitment was not necessary
with the other three teacher groups. Table 2 shows that these unmatched teachers are more likely
to be female, white, the same race as the principal, the same race as the student in their schools,
and teaching in a secondary school. They are also more likely to be black and elementary school
teachers in schools that have higher percentages of minority teachers and students. This group
does not significantly differ from the other three groups in any other key characteristics or
attitudes.
Difficulty Filling a Position, Leadership, and Fit
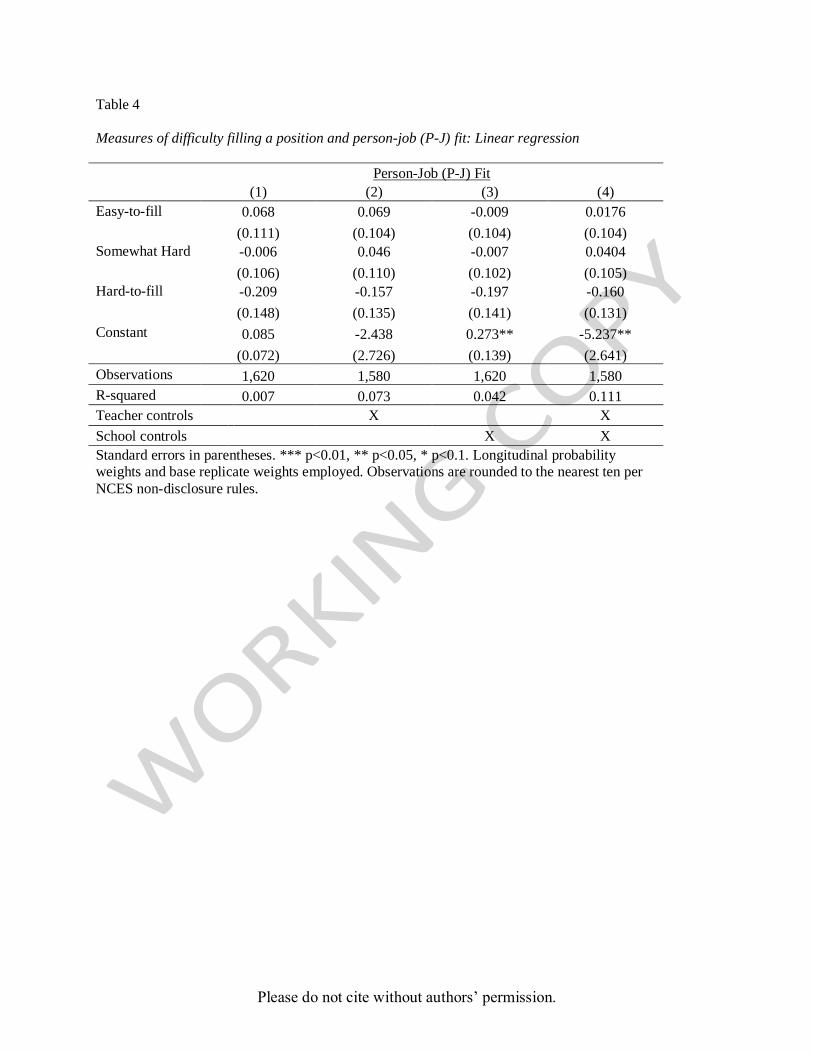
Tables 3 and 4 demonstrate that the level of difficulty a position did not predict either
leadership or P-J fit for a teacher in his or her first year, even absent teacher and school controls.
A closer look at the full model for the leadership outcome measure in Table 5 and the PJ fit
outcome measure in Table 6 does show that some controls were predictive. Namely, being

Please do not cite without authors’ permission.
22
Hispanic (0.630, p<0.01), working in a charter school (-0.526, p<0.01), and percent minority
student enrollment (-0.010, p<0.01) all significantly predicted teacher perceptions of leadership.
Meanwhile, being Hispanic (0.557, p<0.01), earnings (0.583, p<0.05), and percent minority
enrollment (-0.006, p<0.01) were all significantly related to measures of P-J fit. Additionally,
while difficulty filling a position did not predict either outcome variable, teaching English (-
0.418, p<0.01), natural sciences (-0.641, p<0.01), and physical sciences (-0.792, p<0.05) was
negatively associated with levels of P-J fit. When the significant controls were interacted with
various levels of difficulty filling the position, the interactions were generally not significant. In
each of the cases in which interactions were significant, the number of teachers fitting both the
respective characteristic (e.g., Hispanic, charter school) and teacher group (e.g., easy-to-fill,
hard-to-fill) was too small to properly inform any conclusions based on the results. Caution
should also be taken in significance of individual subject areas as, for instance, only
approximately 20 of the teachers taught in the physical sciences.
Leadership, Fit and Teacher Mobility
Moving. We explored leadership and fit’s relationships with teacher mobility first by
using logit regressions and second via discrete-time survival analyses. Final logit models for
cumulative moving are presented in Columns A and B of Table 7. The OR for leadership is a
highly significant 0.766 in the three-year sample and 0.688 in the five-year sample. Using results
from the more conservative three-year model, having a measure of leadership that is one
standard deviation higher than the mean in the first year translates into 23% lower odds of a
teacher moving schools relative to staying at the same school or leaving the profession. These
odds increase to roughly 31% when the time period is extended to include all five years of the
survey. P-J fit, on the other hand, does not have a significant relationship with teacher

Please do not cite without authors’ permission.
23
movement. Due to reasons stated in the Analytical Approach, we were unable to account for time
using a discrete-time survival analysis to analyze moving. Only leaving and turnover (either
moving or leaving where each has the same value and is terminal) can be used in the single risk
discrete-time survival analyses.
Leaving. Columns C and D of Table 7 report cumulative beginning teacher leaving
models. Leadership does not predict leaving using the logit model. However, P-J fit predicts
teacher leaving with an OR of 0.635 over three years and 0.654 over five years at highly
significant levels (p<0.01). This translates as a teacher with a level of P-J fit one standard
deviation above the average having a 66% lower odds of leaving the profession over the first
three years and 65% lower odds over the first five. Some of the different ORs among the two
samples may be attributable to additional movement as a function of time and the additional two
years of data. For this reason, we also employ the discrete-time survival approach.
Subsequent discrete-time survival analysis using the three-year and five-year samples are
seen in Tables 8 and 9, respectively. All four models indicate P-J fit as having a statistically
significant odds ratio ranging from 0.624 to 0.663. This includes the model that adds interactions
among measures of fit and year in Column B, the model interacting difficulty filling the position
and year in Column C, and the fully interactive model in Column D. Similar to the results for the
logit models reported in Table 7, P-J fit remains significant (p<0.05) across discrete-time
survival models (see Tables 8 and 9). Difficulty filling a position does not predict leaving by
itself or in an interaction with time in the three-year model. Somewhat hard-to-fill, though,
significantly interacts with 2008-09 (the second mobility time point) in the five-year model. This
is interpreted as occupying a somewhat hard-to-fill position predicting a 41% lower odds of
teacher leaving in the 2008-09 (second time point) relative to 2007-08 (the omitted first time

Please do not cite without authors’ permission.
24
point). A similar OR of 0.535 (p<0.05) is reported in the interaction between 2010-2011 and
somewhat hard-to-fill. However, only roughly 2 percent of BTLS teachers left the profession at
the second mobility time point compared to over 10 percent after the first year. Therefore, we
must interpret these results with some caution, especially when using the five-year sample that
has a mere 20 leavers in 2008-09. Confidence intervals for these two interactions require
interpretation with caution.
Turnover (Moving or Leaving). Lastly, we set out to determine how leadership and P-J
fit predict teacher turnover (moving or leaving) relative to staying. Columns E and F of Tables 8
and 9 reveal that leadership predicts a teacher ever having moved or left with high significance in
the three-year cumulative logit sample with an OR of 0.717 (p<0.01) and the five-year
cumulative sample at 0.720 (p<0.05). P-J fit had a marginally significant OR of 0.779 (p<0.01)
in the three-year sample and 0.758 (p<0.01) across five years. This general finding extends into
the three-year and five-year discrete-time survival analyses seen in Tables 10 and 11. Leadership
has a highly significant OR of 0.675 (p<0.01) in the fully-interactive three-year sample model
and a marginally significant 0.750 (p<0.10) in the fully-interactive five-year sample model. P-J
fit is not significant in the fully interactive three-year model seen in Column D of Table 10 but is
significant 0.730 (p<0.05) in Column D of Table 11 for the five-year sample.
Difficulty Filling Position and Teacher Mobility
We find no evidence that difficulty filling a teaching position predicts teacher moving or
leaving. We saw null results for difficulty filling a position consistently across all models.
Restricting the sample to only teachers filling positions that the school needed to actively recruit
for did not yield significance, either. This is similar to the relationship we found among levels of
difficulty filling a teaching position and measures of fit. While we also hypothesized that

Please do not cite without authors’ permission.
25
teaching “in-demand” subjects (i.e., those with national shortages) or specific subject areas
would interact with difficulty filling a position, the groups’ sizes were too small to make
meaning out of logits that incorporated those interactions.
Conclusion
These findings build upon research on the importance of leadership and teacher fit on
teacher mobility in K-12 education. This study’s findings reinforce those of others that have
determined the importance of principal leadership in teacher retention patterns overall as well as
for beginning teachers (e.g., Boyd et al., 2011; Ladd, 2011). Furthering suggestions made by
Ladd regarding teachers in general, the survey items comprising principal leadership in this study
may more specifically imply that indicators of strong transformational leadership are closely
related to ECT teacher mobility.
Previous research on beginning teacher fit indicated that better fit predicted greater intent
to stay but had not been able to determine whether or not this translated into actual mobility
(Pogodzinski et al., 2013). The first study to look at actual domestic teacher mobility in relation
to fit found that fit did predict staying, moving, and leaving in a one-year snapshot (Player et al.,
under review). This study contributes to the teacher P-E fit base by examining beginning teacher
turnover across multiple years. In doing so, this study confirms key findings from both
Pogodzinski et al. (2013) and Player et al. (under review). Specifically, we find that higher levels
of P-J fit in the first year predict lower levels of teacher leaving relative to staying and moving
over multiple years.
Surprising to the authors, difficulty filling the teaching position did not predict teacher
perceptions of leadership or levels of fit. Unfortunately, the sample size precludes us from
further examining potentially important interactions, such as hard-to-fill teaching position with

Please do not cite without authors’ permission.
26
math. We hypothesize that teachers filling easy-to-fill positions in in-demand subjects (e.g.,
STEM, SPED) would have better fit because the teacher is more likely to have greater K-12
teaching opportunities and interview earlier. It may be that more research is needed and that
another approach would be to concentrate on in-demand subjects and fit instead of hard-to-fill
teaching positions and fit as hard-to-fill teaching positions may leave more questions than
answers. Given current teacher shortage trends and the relationship fit has with attrition, such an
approach seems like a logical and worthwhile direction to take.

Please do not cite without authors’ permission.
References
Achinstein, B., Ogawa, R. T., Sexton, D., & Freitas, C. (2010). Retaining teachers of color: A
pressing problem and a potential strategy for “hard-to-staff” schools. Review of
Educational Research, 80(1), 71-107.
Allen, M. B. (2005). Eight questions on teacher recruitment and retention: What does the
research say? Education Commission of the States (NJ3).
Allensworth, E., Ponisciak, S., & Mazzeo, C. (2009). The schools teachers leave: Teacher
mobility in Chicago Public Schools. Chicago: Consortium on Chicago School Research -
University of Chicago.
Barnes G., Crowe E., & Schaefer B. (2007). The cost of teacher turnover in five school districts:
A pilot study. Washington, DC: National Commission on Teaching and America’s Future.
Bass, B. M. (1990). From transactional to transformational leadership: Learning to share the
vision. Organizational Dynamics, 18(3), 19-31.
Bland J. M. & Altman D. G. (2000) The odds ratio. British Medical Journal, 320, 1468.
Borman, G. D., & Dowling, N. M. (2008). Teacher attrition and retention: A meta-analytic and
narrative review of the research. Review of Educational Research, 78(3), 367-409.
Boyd, D., Grossman, P., Ing, M., Lankford, H., Loeb, S., & Wyckoff, J. (2011). The influence of
school administrators on teacher retention decisions. American Educational Research
Journal, 48(2), 303-333.
Boyd, D., Lankford, H., Loeb, S., Rockoff, J., & Wyckoff, J. (2008). The narrowing gap in New
York City teacher qualifications and its implications for student achievement in high‐
poverty schools. Journal of Policy Analysis and Management, 27(4), 793-818.

Please do not cite without authors’ permission.
Boyd, D., Lankford, H., Loeb, S., & Wyckoff, J. (2002). Initial matches, transfers, and quits:
Career decisions and the disparities in average teacher qualifications across schools.
Unpublished manuscript, University of Albany, SUNY.
Boyd, D., Lankford, H., Loeb, S., & Wyckoff, J. (2005). The draw of home: How teachers'
preferences for proximity disadvantage urban schools. Journal of Policy Analysis and
Management, 24(1), 113-132.
Boyd, D., Lankford, H., Loeb, S., & Wyckoff, J. (2013). Analyzing the determinants of the
matching of public school teachers to jobs: Disentangling the preferences of teachers and
employers. Journal of Labor Economics, 31(1), 83-117.
Brown, E. (2015, April 30). Study: Far fewer teachers are leaving the profession than previously
thought. The Washington Post. Retrieved from
https://www.washingtonpost.com/news/local/wp/2015/04/30/study-new-teacher-attrition-
is-lower-than-previously-thought/?utm_term=.467c373c013a#comments
Cannata, M. (2010). Understanding the teacher job search process: Espoused preferences and
preferences in use. Teachers College Record, 112(12), 2889-2934.
Chan, W.Y., Lau, S., Nie, Y., Lim, S., & Hogan, D. (2008). Organizational and personal
predictors of teacher commitment: The mediating role of teacher efficacy and
identification with school. American Educational Research Journal, 45(3), 597–630.
Chenoweth, K. (2009). How it’s being done: Urgent lessons from unexpected schools.
Cambridge: Harvard Education Press.
Clotfelter C. T., Ladd H. F., Vigdor J. L., Wheeler J. (2007). High-poverty schools and the
distribution of teachers and principals (CALDER Working Paper 1). Washington, DC:
Urban Institute. Retrieved September 19, 2015, from

Please do not cite without authors’ permission.
http://heinonline.org/HOL/Page?handle=hein.journals/nclr85&div=42&g_sent=1&collect
ion=journals
Costello, A. B., & Osborne, J. W. (2005). Best practices in exploratory factor analysis: Four
recommendations for getting the most from your analysis. Practical Assessment Research
& Evaluation, 10(7). Available online: http://pareonline.net/pdf/v10n7.pdf
Donaldson, M. L. (2013). Principals’ approaches to cultivating teacher effectiveness constraints
and opportunities in hiring, assigning, evaluating, and developing teachers. Educational
Administration Quarterly, 49(5), 838-882.
Engel, M., & Cannata, M. (2015). Localism and teacher labor markets: How geography and
decision-making may contribute to inequality. Peabody Journal of Education, 90(1), 84-
92.
Engel, M., & Finch, M. A. (2015). Staffing the Classroom: How urban principals find teachers
and make hiring decisions. Leadership and Policy in Schools, 14(1), 12-41.
Gonzalez, L., Brown, M. S., & Slate, J. R. (2008). Teachers who left the teaching profession: A
qualitative understanding. The Qualitative Report, 13(1), 1-11.
Gray, L., and Tie, S. (2015). Public School Teacher Attrition and Mobility in the First Five
Years: Results from the First Through Fifth Waves of the 2007–08 Beginning Teacher
Longitudinal Study (NCES 2015-337). U.S. Department of Education. Washington, DC:
National Center for Education Statistics. Retrieved from http://nces.ed.gov/pubsearch
Grayson, J. L., & Alvarez, H. K. (2008). School climate factors relating to teacher burnout: A
mediator model. Teaching and Teacher Education, 24(5), 1349-1363.
Grissmer, D., & Kirby, S. (1997). Teacher turnover and teacher quality. Teachers College
Record, 99(1), 45-56.

Please do not cite without authors’ permission.
Grogan, E., & Youngs, P. (2011). Fitting in: Person-organization, person-job, and person-group
fit as drivers of teacher mobility (Working Paper 21). Education Policy Center, Michigan
State University.
Guarino, C. M., Santibanez, L., & Daley, G. A. (2006). Teacher recruitment and retention: A
review of the recent empirical literature. Review of Educational Research, 76(2), 173-
208.
Henry, G. T., Bastian, K. C., & Fortner, C. K. (2011). Stayers and leavers: Early-career teacher
effectiveness and attrition. Educational Researcher, 40(6), 271-280.
Holgado–Tello, F. P., Chacón–Moscoso, S., Barbero–García, I., & Vila–Abad, E. (2010).
Polychoric versus Pearson correlations in exploratory and confirmatory factor analysis of
ordinal variables. Quality & Quantity, 44(1), 153-166.
Horng, E. L. (2009). Teacher tradeoffs: Disentangling teachers’ preferences for working
conditions and student demographics. American Educational Research Journal, 46(3),
690-717.
Ingersoll, R. M. (2001). Teacher turnover and teacher shortages: An organizational analysis.
American educational research journal, 38(3), 499-534.
Ingersoll, R. M., & May, H. (2012). The magnitude, destinations, and determinants of
mathematics and science teacher turnover. Educational Evaluation and Policy Analysis,
34(4), 435-464.
Ingersoll, R., & Perda, D. (2010). How high is teacher turnover and is it a problem? Philadelphia:
Consortium for Policy Research in Education, University of Pennsylvania.
Kristof, A. L. (1996). Person‐organization fit: An integrative review of its conceptualizations,
measurement, and implications. Personnel Psychology, 49(1), 1-49.

Please do not cite without authors’ permission.
Levin, J., Mulhern, J., & Schunck, J. (2005). Unintended consequences: The case for reforming
the staffing rules in urban teachers union contracts. Brooklyn, NY: The New Teacher
Project.
Liu, E., Rosenstein, J. G., Swan, A. E., & Khalil, D. (2008). When districts encounter teacher
shortages: The challenges of recruiting and retaining mathematics teachers in urban
districts. Leadership & Policy in Schools, 7(3), 296–323.
Marinell, W. H., & Coca, V. M. (2013). Who stays and who leaves? Findings from a three-part
study of teacher turnover in NYC middle schools. New York: The Research Alliance for
New York City Schools.
Marvel, J., Lyter, D.M., Peltola, P., Strizek, G.A., and Morton, B.A. (2007). Teacher Attrition
and Mobility: Results From the 2004–05 Teacher Follow-Up Survey. Washington, DC:
National Center for Education Statistics, Institute of Education Sciences, U.S.
Department of Education.
Miller, L. C. (2012). Situating the rural teacher labor market in the broader context: A
descriptive analysis of the market dynamics in New York state. Journal of Research in
Rural Education, 27(13), 1-31. Retrieved from http://jrre.psu.edu/articles/27-13.pdf.
Neild, R. C., Useem, E., Travers, E., & Lesnick, J. (2003). Once and for all: Placing a highly
qualified teacher in every Philadelphia classroom. Philadelphia: Research for Action.
Opfer, D. (2011). Defining and identifying hard-to-staff schools: The role of school
demographics and conditions. Educational Administration Quarterly, 47(4), 582-619.
Ost, B. (2014). How do teachers improve? The relative importance of specific and general
human capital. American Economic Journal: Applied Economics, 6(2): 127-51.
Please do not cite without authors’ permission.
Papay, J. P., & Kraft, M. A. (2015). Productivity returns to experience in the teacher labor
market: Methodological challenges and new evidence on long-term career improvement.
Journal of Public Economics, 130, 105-119.
Player, D., Youngs, P., Perrone, F., & Grogan, E. (2015). How fit is associated with teacher
mobility and attrition. Manuscript submitted for publication.
Pogodzinski, B., Youngs, P., & Frank, K. (2013). Collegial climate and novice teachers’ intent to
remain teaching. American Journal of Education, 120(1), 27-54.
Reininger, M. (2012). Hometown disadvantage? It depends on where you’re from: Teachers’
location preferences and the implications for staffing schools. Educational Evaluation
and Policy Analysis, 34(2), 127-145.
Rivkin, S. G., Hanushek, E. A., & Kain, J. F. (2005). Teachers, schools, and academic
achievement. Econometrica, 73(2), 417-458.
Rockoff, J. E. (2004). The impact of individual teachers on student achievement: Evidence from
panel data. The American Economic Review, 94(2), 247-252.
Ronfeldt, M., Loeb, S., & Wyckoff, J. (2013). How teacher turnover harms student achievement.
American Educational Research Journal, 50(1), 4-36.
Sass, D. A., Flores, B. B., Claeys, L., & Pérez, B. (2012). Identifying personal and contextual
factors that contribute to attrition rates for Texas public school teachers. Education Policy
Analysis Archives, 20(15).
Schonrock-Adema, J., Heijne-Penninga, M., Van Hell, E.A. & Cohen-Schotanus, J. (2009).
Necessary steps in factor analysis: Enhancing validation studies of educational
instruments. Medical Teacher, 31, 226-232.
Please do not cite without authors’ permission.
Singer, J. D., & Willett, J. B. (1993). It’s about time: Using discrete-time survival analysis to
study duration and the timing of events. Journal of Educational and Behavioral Statistics,
18(2), 155-195.
Torres, A. C. (2014). Is this work sustainable? Teacher turnover and perceptions of workload in
charter management organizations. Urban Education, 1-24.
U.S. Department of Education. (2014, September). National Center for Education Statistics,
Teacher Follow-up Survey (TFS), “Current and Former Teacher Data Files,” 2012–13.
U.S. Department of Education. (2016, August). Teacher shortage areas nationwide listing 1990-
1991 through 2016-2017. Washington, DC: Office of Postsecondary Education.
Retrieved from https://www2.ed.gov/about/offices/list/ope/pol/tsa.pdf
Waddell, J. H. (2010). Fostering relationships to increase teacher retention in urban schools.
Journal of Curriculum and Instruction, 4(1), 70-85.
Westervelt, E. (2015, August 19). Survey: N.C. teachers say high-stakes tests dominate classes.
Morning edition. In T. Wahl (Producer). Washington, D.C.: National Public Radio.
Retrieved October 11, 2015, from
http://www.npr.org/sections/ed/2015/08/19/432724094/teacher-shortage-or-teacher-
pipeline-problem
Whipp, J. L., & Geronime, L. (in press). Experiences that predict early career teacher
commitment to and retention in high-poverty urban schools. Urban Education,
0042085915574531
Please do not cite without authors’ permission.
Table 1
Unweighted means and significant differences by level of difficulty filling the position (easy-to-
fill, somewhat hard-to-fill, hard-to-fill)
Easy-to-fill
Somewhat Hard-
to-fill Hard-to-fill
Teacher characteristics
Over 30 0.230*** 0.300 0.368
Female 0.708 0.708 0.670
White 0.928 0.915 0.946
Black 0.037 0.065 0.043
Hispanic 0.037 0.065 0.092**
Same race as teachers 0.888 0.866 0.848
Same race as students 0.763 0.723 0.692
Same race as principal 0.800 0.788 0.827
Masters (Education) 0.126 0.158 0.135
Union membership 0.618 0.613 0.560
Regular state certification 0.556*** 0.445 0.384
Salary (log) 10.437 (0.171) 10.435 (0.171) 10.423 (0.167)
Subject area taught
General Elementary 0.346 0.213 0.086***
SPED 0.064 0.108 0.195***
English 0.165 0.173** 0.103
Social Studies 0.150*** 0.075 0.011
Computer Science 0.004 0.008 0.005
Math 0.084 0.103 0.232***
Natural Science 0.049*** 0.118 0.146
Physical Science 0.008 0.020 0.027
ESL 0.002 0.010 0.005
Foreign Language 0.023 0.040 0.038
Arts and Sciences 0.056 0.045 0.032
Votech 0.049*** 0.090 0.119
Other 0.000 0.000 0.000
School characteristics
Charter 0.053 0.055 0.070
Title I 0.403 0.410 0.368
Size (in 100s) 7.973 (5.997) 8.396 (6.661) 9.025 (7.052)
Urban 0.379 0.248 0.178
Suburban 0.621 0.753 0.822
Rural 0.214 0.215 0.222
Elementary 0.391 0.393 0.395
Secondary 0.395 0.393 0.384
% minority teachers 13.340 (21.553) 15.021 (21.454) 16.039 (22.794)
% minority students 36.213 (31.546) 39.755 (33.361) 39.221 (32.695)
Teacher attitudes
Supportive administration 3.638 (0.625) 3.525 (0.748) 3.498 (0.746)
Teachers recognized properly 3.314 (0.715) 3.167 (0.804) 3.110 (0.774)
Principal enforces rules 3.579 (0.710) 3.532 (0.729) 3.407 (0.804)
Principal comm’s clear mission 3.526 (0.709) 3.471 (0.774) 3.443 (0.712)
Would leave for better pay 3.342 (0.791) 3.244 (0.854) 3.176 (0.876)

Please do not cite without authors’ permission.
Less enthusiasm 3.387 (0.816) 3.245 (0.919) 3.106 (0.997)
Too tired to go to work 4.363 (0.877) 4.271 (0.993) 4.186 (1.058)
I would be a teacher again 3.450 (0.778) 3.303 (0.925) 3.214 (0.972)
Effort of teaching is worth it 3.401 (0.758) 3.273 (0.815) 3.186 (0.858)
Fit Factors
Leadership 0.100 (0.937) -0.055 (1.053) -0.173 (1.062)
P-J Fit 0.136 (0.901) -0.069(1.028) -0.221 (1.129)
Observations 490 400 190
Standard deviations are in parentheses and are not reported for binary variables. Statistical significance
based on ANOVAs. *** p<0.01, ** p<0.05, * p<0.1. Attitudinal responses coded so that positive answers
have higher values. Sample sizes rounded to nearest ten per NCES non-disclosure rules.

Please do not cite without authors’ permission.
Table 2
Unweighted means and significant differences by level of difficulty filling the position (other, easy-to-fill,
somewhat hard-to-fill, hard-to-fill)
Other Easy-to-fill
Somewhat
Hard-to-fill Hard-to-fill
Teacher characteristics
Over 30 0.330 0.230*** 0.300 0.368
Female 0.609** 0.708 0.708 0.670
White 0.861** 0.928 0.915 0.946
Black 0.116*** 0.037 0.065 0.043
Hispanic 0.055 0.037 0.065 0.092*
Same race as teachers 0.782*** 0.888 0.866 0.848
Same race as students 0.647** 0.763 0.723 0.692
Same race as principal 0.709** 0.800 0.788 0.827
Masters (in Education) 0.136 0.126 0.158 0.135
Union membership 0.545 0.618 0.613 0.560
Regular state certification 0.482 0.556*** 0.445 0.384
Salary (log) 10.422 (0.173) 10.437(0.171) 10.435(0.171) 10.423(0.167)
Subject area taught
General Elementary 0.102 0.346*** 0.213 0.086
SPED 0.097 0.064 0.108 0.195***
English 0.097 0.165 0.173** 0.103
Social Studies 0.075 0.150*** 0.075 0.011
Computer Science 0.014 0.004 0.008 0.005
Math 0.100 0.084 0.103 0.232***
Natural Science 0.072 0.049 0.118 0.146
Physical Science 0.017 0.008 0.020 0.027
ESL 0.003 0.002 0.010 0.005
Foreign Language 0.025 0.023 0.040 0.038
Arts and Sciences 0.061 0.056 0.045 0.032
Votech 0.127 0.049*** 0.090 0.119
Other 0.211*** 0.000 0.000 0.000
School characteristics
Charter 0.061 0.053 0.055 0.070
Title I 0.446 0.403 0.410 0.368
Size (in 100s) 7.773 7.973 (5.997) 8.396 (6.661) 9.025 (7.052)
Urban 0.258 0.379 0.248 0.178
Suburban 0.742 0.621 0.753 0.822
Rural 0.199 0.214 0.215 0.222
Elementary 0.476 0.391 0.393 0.395
Secondary 0.324 0.395 0.393 0.384
% minority teachers 19.021 (26.031) 13.340 (21.553) 15.021
(21.454) 16.039 (22.794)
% minority students 43.740**
(34.212) 36.213 (31.546)
39.755
(33.361) 39.221 (32.695)
Teacher attitudes
Supportive administration 3.535 (0.714) 3.638 (0.625) 3.525 (0.748) 3.498 (0.746)
Teachers recognized 3.244 (0.784) 3.314 (0.715) 3.167 (0.804) 3.110 (0.774)

Please do not cite without authors’ permission.
properly
Principal enforces rules 3.543 (0.710) 3.579 (0.710) 3.532 (0.729) 3.407 (0.804)
Principal comm’s clear
mission
3.559 (0.669) 3.526 (0.709) 3.471 (0.774) 3.443 (0.712)
Would leave for better pay 3.195 (0.920) 3.342 (0.791) 3.244 (0.854) 3.176 (0.876)
Less enthusiasm 3.304 (0.937) 3.387 (0.816) 3.245 (0.919) 3.106 (0.997)
Too tired to go to work 4.220 (1.027) 4.363 (0.877) 4.271 (0.993) 4.186 (1.058)
I would be a teacher again 3.457 (0.820) 3.450 (0.778) 3.303 (0.925) 3.214 (0.972)
Effort of teaching is worth it 3.312 (0.789) 3.401 (0.758) 3.273 (0.815) 3.186 (0.858)
Fit Factors
P-O Fit 0.014 (0.978) 0.100 (0.937) -0.055 (1.053) -0.173 (1.062)
P-J Fit 0.004 (1.004) 0.136 (0.901) -0.069(1.028) -0.221 (1.129)
Observations 360 490 400 190
Standard deviations are in parentheses and are not reported for binary variables. Statistical significance
based on ANOVAs. *** p<0.01, ** p<0.05, * p<0.1. Sample sizes rounded to nearest ten per NCES non-
disclosure rules.

Please do not cite without authors’ permission.
Table 3
Measures of difficulty filling a position and leadership: Linear regression
Leadership
(1) (2) (3) (4)
Easy-to-fill 0.136 0.136 0.104 0.133
(0.104) (0.104) (0.108) (0.110)
Somewhat Hard -0.059 -0.059 -0.028 -0.018
(0.115) (0.115) (0.111) (0.111)
Hard-to-fill -0.240 -0.240 -0.181 -0.186
(0.162) (0.162) (0.163) (0.151)
Constant 0.022 0.542 0.224 -1.794
(0.083) (2.656) (0.185) (2.693)
Observations 1,620 1,580 1,620 1,580
R-squared 0.015 0.083 0.062 0.141
Teacher controls X X
School controls X X
Standard errors in parentheses. *** p<0.01, ** p<0.05, * p<0.1. Longitudinal probability
weights and base replicate weights employed. Observations are rounded to the nearest ten per
NCES non-disclosure rules.
Please do not cite without authors’ permission.
Table 4
Measures of difficulty filling a position and person-job (P-J) fit: Linear regression
Person-Job (P-J) Fit
(1) (2) (3) (4)
Easy-to-fill 0.068 0.069 -0.009 0.0176
(0.111) (0.104) (0.104) (0.104)
Somewhat Hard -0.006 0.046 -0.007 0.0404
(0.106) (0.110) (0.102) (0.105)
Hard-to-fill -0.209 -0.157 -0.197 -0.160
(0.148) (0.135) (0.141) (0.131)
Constant 0.085 -2.438 0.273** -5.237**
(0.072) (2.726) (0.139) (2.641)
Observations 1,620 1,580 1,620 1,580
R-squared 0.007 0.073 0.042 0.111
Teacher controls X X
School controls X X
Standard errors in parentheses. *** p<0.01, ** p<0.05, * p<0.1. Longitudinal probability
weights and base replicate weights employed. Observations are rounded to the nearest ten per
NCES non-disclosure rules.

Please do not cite without authors’ permission.
Table 5
Influence of teacher and school factors on principal leadership
Leadership
Easy-to-fill 0.133
(0.110)
Somewhat Hard-to-fill -0.018
(0.111)
Hard-to-fill -0.186
(0.151)
Over 30 0.047
(0.080)
Female -0.063
(0.077)
White -0.222
(0.186)
Black 0.324*
(0.179)
Hispanic 0.630***
(0.170)
Same race as teachers 0.082
(0.140)
Teacher-student -0.159
(0.111)
Same race as principal 0.119
(0.109)
Masters (in Education) -0.233*
(0.127)
Union membership -0.125*
(0.071)
Regular certification -0.053
(0.073)
Salary (log) 0.251
(0.263)
General elementary -0.028
(0.192)
SPED -0.470*
(0.240)
English -0.372*
(0.207)
Social Studies -0.038
(0.218)
Computer -0.006
(0.309)
Math 0.003
(0.202)
Natural Sciences -0.245

Please do not cite without authors’ permission.
(0.222)
Physical Sciences -0.483
(0.388)
ESL 0.212
(0.584)
Language Arts -0.171
(0.257)
Art or Music 0.023
(0.225)
Votech 0.076
(0.204)
Charter -0.526***
(0.178)
Title I 0.130
(0.084)
School size (in 100s) -0.001
(0.006)
Elementary 0.066
(0.130)
Suburban -0.055
(0.111)
Rural -0.229*
(0.123)
% minority teachers 0.001
(0.002)
% minority students -0.010***
(0.002)
Observations 1,580
R-squared 0.141
p-values in parentheses
*** p<0.01, ** p<0.05, * p<0.1

Please do not cite without authors’ permission.
Table 6
Influence of teacher and school factors on P-J Fit
P-J Fit
Easy-to-fill 0.018
(0.104)
Somewhat hard-to-fill 0.040
(0.105)
Hard-to-fill -0.160
(0.131)
Over 30 0.042
(0.110)
Female -0.011
(0.090)
White -0.131
(0.241)
Black 0.061
(0.231)
Hispanic 0.557***
(0.179)
Same race as teachers 0.067
(0.156)
Teacher-student -0.060
(0.124)
Same race as principal -0.015
(0.158)
Masters (in Education) -0.288
(0.204)
Union membership 0.009
(0.073)
Regular certification 0.059
(0.078)
Salary (log) 0.583**
(0.250)
General elementary -0.207
(0.157)
SPED -0.390**
(0.163)
English -0.418***
(0.144)
Social Studies -0.357*
(0.206)
Computer -0.0188
(0.243)
Math -0.200
(0.172)
Natural Sciences -0.641***

Please do not cite without authors’ permission.
(0.202)
Physical Sciences -0.792**
(0.312)
ESL 0.175
(0.346)
Language Arts -0.416*
(0.220)
Art or Music -0.238
(0.182)
Votech -0.165
(0.175)
Charter -0.185
(0.169)
Title I -0.003
(0.082)
School size (in 100s) -0.006
(0.006)
Elementary 0.0309
(0.108)
Suburban -0.083
(0.093)
Rural -0.127
(0.107)
% minority teachers -0.004
(0.002)
% minority students -0.006***
(0.002)
Observations 1,580
R-squared 0.111
p-values in parentheses
*** p<0.01, ** p<0.05, * p<0.1

Please do not cite without authors’ permission.
Table 7
Cumulative attrition over three and five year spans as function of leadership, P-J fit, and difficulty
filling position: Logistic regression models
Moved Left Turnover
(1) (2) (3) (4) (5) (6)
3 yr 5 yr 3 yr 5 yr 3 yr 5 yr
Leadership 0.766** 0.688*** 0.889 1.007 0.717*** 0.720**
(0.038) (0.006) (0.347) (0.962) (0.005) (0.014)
P-J Fit 0.959 0.929 0.635*** 0.654*** 0.779* 0.758*
(0.733) (0.582) (0.001) (0.003) (0.052) (0.059)
Easy-to-fill 0.913 0.870 0.670 0.727 0.756 0.757
(0.749) (0.649) (0.215) (0.370) (0.309) (0.367)
SomewhatHard 1.207 1.015 0.929 1.171 1.116 1.068
(0.499) (0.960) (0.810) (0.628) (0.680) (0.826)
Hard-to-fill 1.095 0.969 0.687 0.761 0.947 0.964
(0.777) (0.928) (0.306) (0.492) (0.859) (0.912)
Observations 1,400 1,140 1,400 1,140 1,400 1,140
Standard errors in parentheses. *** p<0.01, ** p<0.05, * p<0.1. All models include controls for
teacher and school characteristics. Longitudinal probability weights and base replicate weights
employed. Observations are rounded to the nearest ten per NCES non-disclosure rules.

Please do not cite without authors’ permission.
Table 8
Three year discrete-time survival analysis of teacher leaving
Leaving
(1) (2) (3) (4)
2008-09 0.706 0.653 0.508 0.462
(0.171) (0.113) (0.146) (0.125)
Leadership 0.842 0.926 0.841 0.928
(0.225) (0.681) (0.217) (0.682)
P-J Fit 0.633*** 0.627** 0.631*** 0.624**
(0.004) (0.018) (0.003) (0.016)
Easy-to-fill 0.825 0.837 0.713 0.701
(0.678) (0.701) (0.554) (0.533)
Somewhat hard 1.056 1.055 0.915 0.912
(0.897) (0.899) (0.869) (0.864)
Hard-to-fill 1.312 1.329 1.030 1.082
(0.504) (0.488) (0.946) (0.855)
2008-09*Ldshp
0.787
0.781
(0.389)
(0.361)
2008-09*PJ fit
1.017
1.025
(0.957)
(0.937)
2008-09*Easy-to-
fil
1.469 1.591
(0.536) (0.459)
2008-
09*Somewhat
1.457 1.468
(0.595) (0.590)
2008-09*Hard-to-
fil
1.824 1.685
(0.421) (0.483)
Observations 2,440 2,440 2,440 2,440
Robust standard errors clustered at the teacher level. Robust p-values in parentheses.
*** p<0.01, ** p<0.05, * p<0.1. All models include controls for teacher and school characteristics.
Observations are rounded to the nearest ten per non-NCES disclosure rules.

Please do not cite without authors’ permission.
Table 9
Five year discrete-time survival analysis of teacher leaving
(1) (2) (3) (4)
VARIABLES Left Left Left Left
2008-09 0.745 0.649 0.658 0.559
(0.293) (0.141) (0.444) (0.338)
2009-10 1.024 0.886 1.624 1.366
(0.939) (0.678) (0.467) (0.611)
2010-11 0.880 0.786 0.637 0.570
(0.679) (0.434) (0.445) (0.341)
Leadership 1.034 1.233 1.034 1.244
(0.791) (0.301) (0.790) (0.273)
P-J Fit 0.648*** 0.617** 0.647*** 0.619**
(0.001) (0.028) (0.001) (0.028)
Easy-to-fill 0.835 0.872 0.920 0.885
(0.606) (0.696) (0.896) (0.850)
Somewhat Hard-to-fi 1.319 1.307 1.315 1.328
(0.369) (0.374) (0.666) (0.657)
Hard-to-fill 0.863 0.903 1.092 1.155
(0.704) (0.786) (0.872) (0.787)
2008-09*Leadership
0.589*
1.244
(0.053)
(0.762)
2009-10* Leadership
1.566
0.572
(0.302)
(0.486)
2010-11* Leadership
0.548**
1.642
(0.049)
(0.540)
2008-09*PJ fit
1.070
1.065
(0.834)
(0.939)
2009-10*PJ fit
0.616
0.634
(0.175)
(0.571)
2010-11*PJ fit
2.106**
1.669
(0.038)
(0.522)
2008-09*Easy-to-Fill
1.056 1.511
(0.938) (0.633)
2009-10*Easy-to-Fill
0.544 0.334
(0.467) (0.190)
2010-11*Easy-to-Fill
1.464 0.733
(0.639) (0.718)
2008-09*Somewhat
1.086 0.586**
(0.918) (0.050)
2009-10* Somewhat
0.597 1.541
(0.537) (0.304)
2010-11*Somewhat
1.912 0.535**
1.056 0.559

Please do not cite without authors’ permission.
2008-09*Hard-to-fill
(0.938) (0.338)
0.544 1.366
2009-10*Hard-to-fill
(0.467) (0.611)
1.464 0.570
2010-11*Hard-to-fill
(0.639) (0.341)
1.086 1.244
Observations 3,730 3,730 3,730 3,730
Robust standard errors clustered at the teacher level. Robust p-values in parentheses.
*** p<0.01, ** p<0.05, * p<0.1. All models include controls for teacher and school characteristics and
observations are rounded to the nearest ten per NCES non-disclosure rules.

Please do not cite without authors’ permission.
Table 10
Three year discrete-time survival analysis of teacher turnover (moving and leaving)
Turnover
(1) (2) (3) (4)
2008-09 0.699** 0.708* 0.857 0.900
(0.050) (0.057) (0.687) (0.777)
Leadership 0.743*** 0.676*** 0.740*** 0.675***
(0.008) (0.006) (0.008) (0.005)
P-J Fit 0.816* 0.790 0.820* 0.787
(0.086) (0.110) (0.094) (0.100)
Easy-to-fill 0.941 0.933 0.980 1.009
(0.826) (0.803) (0.951) (0.978)
Somewhat hard 0.898 0.894 1.121 1.135
(0.696) (0.684) (0.724) (0.702)
Hard-to-fill 1.302 1.271 1.344 1.280
(0.340) (0.389) (0.369) (0.456)
2008-09*Leadershi
1.343
1.337
(0.222)
(0.235)
2008-09*PJ fit
1.101
1.121
(0.664)
(0.610)
2008-09*Easy
0.907 0.828
(0.839) (0.690)
2008-09*Somewh
0.544 0.528
(0.275) (0.245)
2008-09*Hard
0.932 0.992
(0.902) (0.988)
Observations 2,260 2,260 2,260 2,260
Robust standard errors clustered at the teacher level. Robust p-values in parentheses.
*** p<0.01, ** p<0.05, * p<0.1. All models include controls for teacher and school characteristics and
observations are rounded to the nearest ten per non-NCES disclosure rules.

Please do not cite without authors’ permission.
Table 11
Five year discrete-time survival analysis of teacher turnover (moving and leaving)
(1) (2) (3) (4)
VARIABLES Turnover Turnover Turnover Turnover
2008-09 0.713* 0.722 0.925 0.958
(0.098) (0.106) (0.862) (0.922)
2009-10 0.639* 0.639* 1.310 1.259
(0.056) (0.052) (0.590) (0.638)
2010-11 0.600** 0.527*** 0.515 0.516
(0.042) (0.007) (0.190) (0.186)
Leadership 0.786*** 0.753* 0.791** 0.750*
(0.009) (0.072) (0.011) (0.067)
P-J Fit 0.774** 0.729** 0.773** 0.730**
(0.015) (0.045) (0.015) (0.044)
Easy-to-fill 0.886 0.887 1.189 1.218
(0.617) (0.622) (0.638) (0.597)
Somewhat Hard 1.128 1.102 1.397 1.413
(0.600) (0.673) (0.375) (0.366)
Hard-to-fill 1.067 1.056 1.453 1.394
(0.805) (0.835) (0.309) (0.366)
2008-09*Ldshp 1.282 1.376
(0.350) (0.216)
2009-10* Ldshp 1.110 1.169
(0.797) (0.656)
2010-11* Ldshp 0.754 0.747
(0.375) (0.354)
2008-09*PJ fit 1.117 1.084
(0.648) (0.733)
2009-10*PJ fit 0.722 0.740
(0.306) (0.225)
2010-11*PJ fit 1.981** 1.898**
(0.024) (0.031)
2008-09*Easy-to-fill 0.819 0.764
(0.713) (0.614)
2009-10*Easy-to-fill 0.343* 0.343*
(0.090) (0.093)
2010-11*Easy-to-fill 0.959 0.910
(0.949) (0.884)
2008-09*Somewhat 0.557 0.548
(0.355) (0.338)
2009-10* Somewha 0.427 0.480
(0.186) (0.254)
2010-11*Somewhat 1.780 1.387

Please do not cite without authors’ permission.
(0.409) (0.385)
2008-09*Hard-to-fill 0.776 0.879
(0.694) (0.840)
2009-10*Hard-to-fill 0.420 0.608
(0.201) (0.467)
2010-11*Hard-to-fill 0.707 0.811
(0.652) (0.794)
Observations 3,200 3,200 3,200 3,200
Robust standard errors clustered at the teacher level. Robust p-values in parentheses.
*** p<0.01, ** p<0.05, * p<0.1. All models include controls for teacher and school characteristics and
observations are rounded to the nearest ten per NCES non-disclosure rules.

Please do not cite without authors’ permission.
Appendix Table
Factor Loadings from Final Generalized Structural Equation Model
Leadership P-J Fit
The administration is supportive and encouraging 0.7324
Staff members at this school are recognized for a job well done 0.7386
My principal enforces school rules for student conduct and backs me up
when I need it
0.7918
The principal knows what kind of school he or she wants and has
communicated it to the staff
0.7230
The stress and disappointments in teaching at this school aren’t really
worth it
0.7146
I don't have as much enthusiasm now as when I began teaching 0.6852
I would certainly become a teacher if I had to go back and start over. 0.5269
I think about staying home from school because I’m just too tired to go 0.5788
I would leave as soon as possible for a higher paying job 0.5733
All factor loadings are standardized.
Fit statistics CFA: 𝜒2(23, N=1,620) = 104.53, p<.001; RMSEA = 0.047; SRMR = 0.031; CFI = 0.983;
and TLI = 0.973

Please do not cite without authors’ permission.
Appendix Figure
Final Generalized Structural Equation Model