early childhood education during the covid-19 pandemic
TRANSCRIPT

1
SUMMARY
The COVID-19 pandemic has disrupted the provision of early childhood education in Arkansas and across the United States. In partnership with the Arkansas Division of Child Care and Early Childhood Education (DCCECE), SRI International (SRI), and the National Center for Children in Poverty (NCCP) at Bank Street College of Education collected information on how Arkansas early childhood education (ECE) providers are implementing state COVID-19-related guidelines and coping with the challenges related to these guidelines.
We found that nearly all ECE programs are complying with DCCECE pandemic procedures. ECE program directors (center-based directors and home providers) generally supported the adoption of these procedures, but the operators of a substantial percentage of larger home-based programs raised concerns regarding the limitations on group sizes.
Many teachers reported a reduction in the frequency that children’s family members, other
teachers, or specialty teachers visited their classrooms. Some teachers also reported a reduction in classroom visits by therapists or special education personnel. Many teachers also reported attempting to reduce the transmission of the virus between children by adopting more directive classroom practices, such as restricting the number of children in each center or area and assigning children to specific activities. The adoption of these more directive practices was most common in Arkansas Better Chance (ABC), Head Start, or other school-based programs that served preschool-aged children.
Most teachers reported no pandemic-related changes in children’s positive social and learning behaviors, but some teachers did report that children displayed lower levels of engagement in learning and social activities as compared to before the pandemic. This includes children showing reduced levels of attention during group and individual activities and being less likely to engage in cooperative play with peers or make new friends.
Early childhood education during
the COVID-19 pandemic:
The experiences of Arkansas educators
Todd Grindal, Sheila Smith, Jennifer Nakamura, Maribel Granja
February 2021

2
ABOUT THIS STUDY
1 For the purposes of this report “Private center-based programs” include all center-based programs that are not classified as school-based, Head Start, or Arkansas Better Chance. Note that these programs may receive public funding through enrolling children supported by Child Care and Development Fund (CCDF) dollars.
The information in this memo is drawn from surveys and focus group interviews with the directors of center-based early care and education (ECE) programs, lead teachers working in center-based ECE programs, and the operators of home-based ECE programs. Center-based programs included private center-based programs1 as well as school-based preschools, Head Start, and Arkansas Better Chance (ABC) programs. The study team emailed surveys to a representative sample of 400 licensed center and home-based Arkansas ECE programs between October 21, 2020, and December 17, 2020. For center-based programs, the program director was invited to complete a survey and to provide contact information for the lead teachers at their program. If a program director provided contact information, all lead teachers at the center were also invited to complete a survey. Home providers were asked to complete one survey on behalf of their program. All survey respondents were given the opportunity to participate in a focus group session to provide additional context and information about their experiences.
Forty-eight percent (193) of program leaders, which include center-based directors and home providers, responded to the survey. Of the 242 center-based lead teachers who were invited to participate in the survey, 29 percent (71) submitted a response. In addition, 18 center-based directors who also serve as lead teachers completed the teacher survey for a total of 89 center-based lead teacher responses. Twenty-two directors, center-based teachers, and home providers participated in a focus group interview. Each region of
the state is proportionally represented in the survey sample. The information on survey questions related to program-level practices is generalizable to the population of Arkansas ECE programs. The information on classroom practices and child behavior is not generalizable beyond the sample of persons who responded to the survey. Additional details about the study methodology are provided in Appendix A.
This report was made possible by Grant Number HHS-2019-ACF-OPRE-YE-1591 from the Office of Planning, Research and Evaluation, Administration for Children and Families, U.S. Department of Health and Human Services. Its contents are solely the responsibility of the authors and do not necessarily represent the official views of the Office of Planning, Research and Evaluation, the Administration for Children and Families, or the U.S. Department of Health and Human Services. This study was conducted in partnership with staff from the DCCECE and University of Arkansas for Medical Sciences (UAMS).
Authors: Todd Grindal, Sheila Smith, Jennifer Nakamura, Maribel Granja
Contributing Researchers: Lori Hodge, Nia Hyatt, Sharon Mattke, Sophie Nguyen, Nancy Perez, Samantha Peyton, and Carolina Zamora
DCCECE and UAMS Partners: Paige Cox, Nicola Edge, and Rachel Machen
Suggested citation:Grindal, T. Smith, S., Nakamura, J., & Granja, M. (2021). Early childhood education during COVID-19: The experiences of Arkansas educators. SRI International.

3
ECE PROGRAM RESPONSES TO COVID-19 GUIDELINES
Nearly all2 ECE program directors reported complying with DCCECE pandemic procedures; the use of additional health and safety procedures was less common
The DCCECE provided ECE programs with health and safety procedures intended to reduce the spread of COVID-19.3 More than 9 out of 10 home and center-based ECE program directors4 reported consistent compliance with the guidelines that a) adults and children are screened for COVID-19 symptoms before entering the facility, b) the facility limits access to regular staff only, and c) adults wear a face mask when inside the facility. Nearly all ECE program directors reported that programs
2 We characterize survey responses in the following way: “Few” refers to less than 25 percent, “Some” refers to 26 to 50 percent, “Many” refers to 51 to 75 percent, “Most” refers to 76 to 90 percent, and “Nearly all” refers to 91 to 100 percent.
3 Survey questions referenced guidance published on July 21, 2020. These are provided in Appendix B.4 Throughout this document “ECE program directors” refers to center-based program directors and operators of home-based child
care programs.5 Data tables referenced in this report can be found in Appendix C.
require children to wash their hands upon entering the facility, and most of the center-based teachers and home providers reported requiring children to wash their hands “somewhat” or “much more often” throughout the day as compared to before the pandemic (see Appendix C, Tables C1a–C1d).5
Some ECE programs reported adopting health and safety procedures that go beyond those required by the state (see Exhibit 1). Most ECE program directors reported requiring children to use a personal set of supplies or be at least six feet apart while eating. Few ECE program directors (17 percent) reported requiring preschool-aged children to wear face masks when in the facility and almost no programs reported requiring infants or toddlers to wear face masks.
1% 4%
17%
48% 48% 49%
64% 67%77%
90% 89% 92%94% 97% 97%97% 98% 98%
0%
20%
40%
60%
80%
100%
Perc
enta
ge o
f ECE
pro
gram
di
rect
ors w
ho re
port
eng
agin
g in
pro
cedu
res “
Nea
rly a
ll of
th
e tim
e” o
r “Al
way
s”
Infants (n=104) Toddlers (n=124) Preschoolers (n=187)
DCCECE Pandemic Procedures
Bring or are served individual snacks and lunches
Wash hands or use hand sanitizer upon entering the building
Have their temperature taken before they enter the facility
Additional Safety Precautions
Children wear a face mask while inside the facility
Are required to be at least 6 feet apart while eating
Use a set of personal supplies and are asked not to share these
EXHIBIT 1: ECE program implementation of health and safety procedures by ages of children served
4
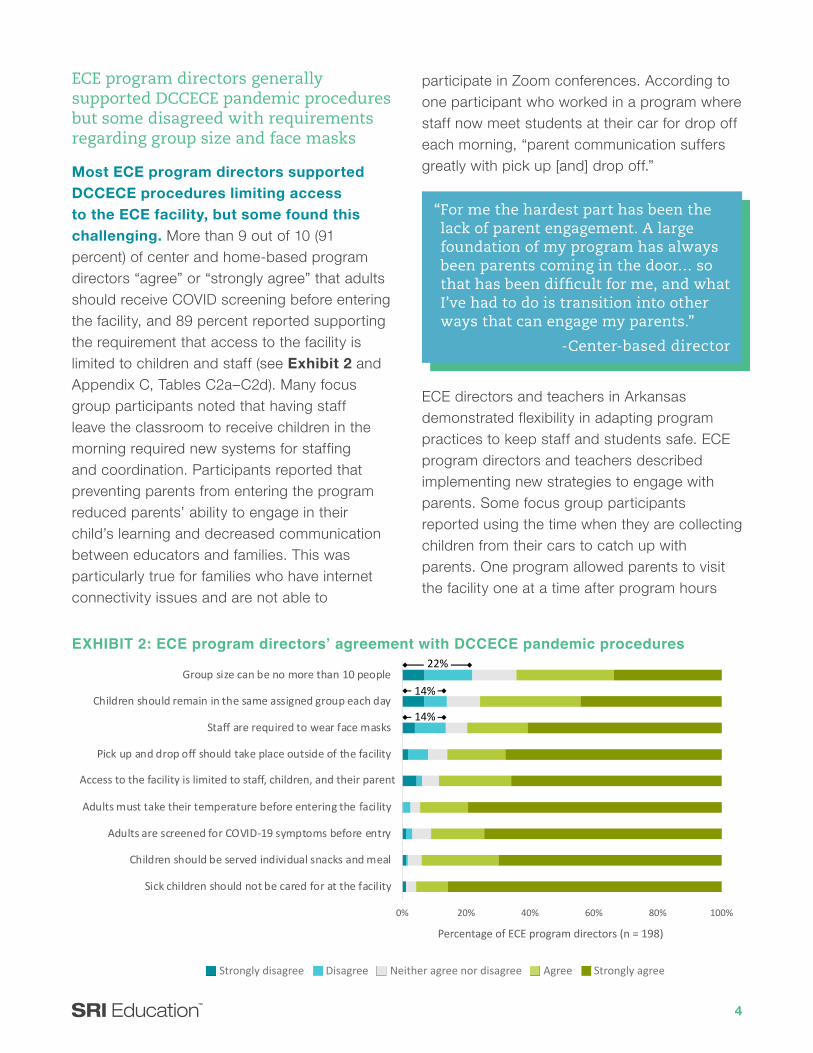
ECE program directors generally supported DCCECE pandemic procedures but some disagreed with requirements regarding group size and face masks
Most ECE program directors supported DCCECE procedures limiting access to the ECE facility, but some found this challenging. More than 9 out of 10 (91 percent) of center and home-based program directors “agree” or “strongly agree” that adults should receive COVID screening before entering the facility, and 89 percent reported supporting the requirement that access to the facility is limited to children and staff (see Exhibit 2 and Appendix C, Tables C2a–C2d). Many focus group participants noted that having staff leave the classroom to receive children in the morning required new systems for staffing and coordination. Participants reported that preventing parents from entering the program reduced parents’ ability to engage in their child’s learning and decreased communication between educators and families. This was particularly true for families who have internet connectivity issues and are not able to
participate in Zoom conferences. According to one participant who worked in a program where staff now meet students at their car for drop off each morning, “parent communication suffers greatly with pick up [and] drop off.”
ECE directors and teachers in Arkansas demonstrated flexibility in adapting program practices to keep staff and students safe. ECE program directors and teachers described implementing new strategies to engage with parents. Some focus group participants reported using the time when they are collecting children from their cars to catch up with parents. One program allowed parents to visit the facility one at a time after program hours
“ For me the hardest part has been the lack of parent engagement. A large foundation of my program has always been parents coming in the door… so that has been difficult for me, and what I’ve had to do is transition into other ways that can engage my parents.”
-Center-based director
Strongly disagree Disagree Neither agree nor disagree Agree Strongly agree
0% 20% 40% 60% 80% 100%
Sick children should not be cared for at the facility
Children should be served individual snacks and meal
Adults are screened for COVID-19 symptoms before entry
Adults must take their temperature before entering the facility
Access to the facility is limited to staff, children, and their…
Pick up and drop off should take place outside of the facility
Staff are required to wear face masks
Children should remain in the same assigned group each day
Group size can be no more than 10 people
Percentage of ECE program directors (n = 198)
22%
14%
14%
Access to the facility is limited to staff, children, and their parent
EXHIBIT 2: ECE program directors’ agreement with DCCECE pandemic procedures

5
since some parents had expressed concerns about not being able to see their child’s learning environment. This program also sent artwork home with the children so the parents can stay up-to-date on their children’s activities. A home provider at another program created weekly “learning stories” with pictures and stories for parents to read at home to give them a snippet of what their child has learned that week.
Despite this challenge, focus group participants recognized the importance of adhering to this guideline. Several stated that children’s family members had also adjusted to this change. According to one focus group participant, “We’ve done better about [parents] not coming into the building, they’re finally getting the understanding of ‘okay if we continue to do this, then it’s going to become a bigger issue and we may lose our child care.’”
Some ECE program directors did not support those guidelines that impacted conduct within the facility. Within-facility guidelines include requiring staff to wear face masks, keeping children in assigned groups, and limiting group sizes to 10 people. Limiting group sizes to 10 people (64 percent) received the lowest levels of agreement. Agreement was particularly low among home providers with only half (51 percent) reporting that they supported limiting the size of groups to 10 or more staff and children compared to 75 percent of ABC, Head Start, and school-based programs (see Appendix C, Tables C2a–C2e).
Group size limitations created a financial strain for some programs. One home provider reported, “In our association of family homes, we started out the year with 40 something homes and now there is only 20 something and
6 Throughout this document “ECE teachers” refers to lead center-based program teachers and home providers.
a lot of those have been permanently closed due to loss of income.” The reductions may be particularly challenging for larger home-based programs. Only 28 percent of home-based programs with a licensing capacity of greater than 10, which constitutes about half of all home-based programs, “agreed” or “strongly agreed” with this group size guideline.
ECE TEACHER PRACTICES IN COVID-19 CLASSROOMS
Many ECE teachers6 reported adopting more directive classroom practices
The pandemic has led to changes in instructional practices, classroom management procedures, and day-to-day interactions with children in the classroom (see Exhibit 3). In some cases, these changes led to an increase in ECE teachers’ use of directive behaviors and a reduction in children’s independence as compared to before the pandemic. Multiple focus group participants described implementing new procedures that involve separating children into small groups (often referred to as “pods”) and assigning them to specific activities or areas of the classroom throughout the day. According to one focus group respondent, “What we’ve done is we’ve separated the kiddos into groups…and then [teachers] have photographs of each child and they have a wall chart [with] all of the different learning centers outlined, and they have real pictures of real children in those centers. And so when it is time to make that transition… [the children] know by the pictures on the chart that they go to the block area.”
Many center-based teachers and home providers reported that, compared to before the pandemic, they are more likely to restrict the

6
number of children who can be in a given center or area (67 percent) or assign children to specific activities rather than permitting free exploration (56 percent).7 Many ECE teachers also reported engaging in more directive management of children’s interactions with one another. Seventy percent of ECE teachers reported an increase in how often they ask children to refrain from touching one another and 66 percent reported more frequently encouraging children to stay some distance away from each other during play. More than three quarters (81 percent) of ECE teachers working with preschool-aged children reported that they use at least one or more of these directive classroom practices “somewhat” or “much more often” now as compared to before the pandemic. More than a quarter (26 percent) of teachers reported increased use of all four directive practices (see Appendix C, Tables C3a–C3e).
Teachers in private center-based preschool programs were the least likely to have reported
7 Teachers who reported having never used a particular practice are not included in these calculations.
adopting more directive practices. Among those teachers who worked with preschool-aged students, less than half (47 percent) of center-based private teachers reported an increase in at least one of these more directive practices compared to 71 percent of home providers and 82 percent of teachers working in ABC, Head Start or school-based preschool programs (see Appendix C, Table C3e).
Adopting these more directive practices has been challenging for many ECE teachers. Among center-based preschool teachers who reported engaging in more directive practices during the pandemic (e.g., restricting the number of children who can be in each center or area, assigning children to specific activities) more than 50 percent reported that implementing these changes have been “somewhat” or “very difficult”. Encouraging children to stay away from each other and prohibiting them from touching each other were reported as difficult by the largest
0% 20% 40% 60% 80% 100%
Bring in therapists or special ed specialists
Bring in specialist teachers
Invite other teachers to visit the classroom
Invite family members to visit the classroom
Percentage of ECE teachers (n = 134)
Acce
ss to
the
prog
ram
Hug, pat, or hold a child
Assign children specific activities
Tell children to keep a distance during play
Restrict # of children in an area
Prohibit children from touching one another
Activ
ities
with
in th
e pr
ogra
m
67%
38%
70%
Much less often
Somewhat less often
About the same amount of time
Somewhat more often
Much more often
EXHIBIT 3: ECE teacher reported changes in classroom practices during the pandemic

7
percentage of teachers (81 percent and 77 percent, respectively) (see Appendix C, Table C4). Multiple focus group participants indicated that these changes represent a substantial departure from how they managed their classrooms and programs in the past. One program director stated, “Much of what is being asked of us is most decidedly counterintuitive. It flies in the face of developmentally appropriate practice, and so it’s a real struggle to balance what we know is best practice for serving the whole child in a setting, but we know that we must do it this way in order to reduce the possibility of COVID’s spread.”
Multiple focus group respondents felt that the children had responded well to the increased structure in their classroom. One focus group participant mentioned, “My teachers have actually been pleasantly surprised at how well the children are adapting and I think that has a lot to do with them being really intentional with the curriculum… [and] transition activities. In between changing centers, there’s a transition activity where the kids are all socially distanced, doing some type of exercise or some type of transition song or finger play and then moving on to the next one because you’ve got to have time for the teachers to sanitize everything in between groups.”
Many ECE teachers reported a reduction in other ECE staff who enter their classrooms. Among those ECE teachers who previously invited other ECE staff to visit their classroom, most reported that visits from other teachers or specialist teachers occurred less often this year (see Exhibit 3). Some teachers (38 percent) also reported a reduction in visits by therapists or special education teachers. This reduction was highest among teachers in home-based (58 percent) and private center-based
8 Phillips, D. A., & Shonkoff, J. P. (Eds.). (2000). From neurons to neighborhoods: The science of early childhood development. National Academies Press.
programs (56 percent). Fewer teachers in ABC, Head Start, and school-based programs reported reduced access to therapists or special education teachers (20 percent) (see Appendix C, Tables C3a–C3d). Limited access for therapists and special education teachers may mean that children are not able to receive all their Individualized Education Program / Individualized Family Service Plan designated services. Even if children are now able to access the intended services outside of the classroom, this change may make it more difficult for ECE teachers and special educators to coordinate their efforts. This reduction in coordination may then lead to fewer children being screened for eligibility to receive special education services.
Some teachers reported reducing the amount of physical contact with children, but many are maintaining the same level of contact as before the pandemic. Physical interactions with adults are key for helping young children in ECE classrooms regulate their emotions and engage in learning.8 Approximately 41 percent of the center-based teachers and home providers who responded to the survey indicated they “hug, pat, or hold” the children in their program “somewhat” or “much less” often than they did before the pandemic (see Exhibit 3). This change in teacher behavior was most common in ABC, Head Start, and

8
school-based programs where nearly half (49 percent) of teachers reported reducing physical contact with children compared to 37 percent of teachers from private center-based programs and 33 percent of home providers (see Appendix C, Tables C3a–C3d).
Although some ECE teachers indicated that they have reduced close contact with children, most reported that they continue to provide physical comfort when children are in distress. Surveyed ECE teachers were provided with a hypothetical scenario in which a tearful child was struggling to say goodbye to his parent. Most teachers (88 percent) reported that they would provide the child with some form of physical comfort in such a situation (see Appendix C, Table C5).9 One focus group participant stated, “I’m not going to ask their parents to stand outside and hand me their child that they just kissed all over. They’re going to hand me their infant, and I’m going to hold that baby in my arms and you better believe I’m going to nuzzle my baby infant the same that I would have done last year...”
9 The remaining 12 percent of respondents indicated that they would invite the child’s parent to stay in the classroom or provide the child with verbal reassurance.
Many center-based teachers and home providers reported high levels of stress
The demands on ECE teachers have increased during the pandemic. These include adjusting classroom routines, engaging in precautionary measures, increased cleaning, and worrying about the safety of themselves and their families. Forty percent of teachers and home providers reported that their job has been “very stressful” or “extremely” stressful over the last two weeks (see Exhibit 4). Levels of stress were generally consistent across program types (see Appendix C, Table C6).
Focus group respondents also described these new stressors. After discussing all the new practices that were being implemented in her program, such as taking children’s temperatures, completing paperwork, and cleaning after each child uses the restroom, one focus group respondent reflected, “It’s just a lot of work, as if we didn’t already have enough on us as it is.” Other participants expressed concern that all of the precautionary measures they are implementing, particularly increased cleaning, require additional resources and take
Extremely stressful 11%
Very stressful 29%
Moderately stressful 25%
A little stressful 26%
Not at all stressful 9%
Extremely stressful Very stressful Moderately stressful A little stressful Not at all stressful
EXHIBIT 4: Percentage of ECE teachers who reported that their job has been “very stressful” or “extremely stressful” over the last two weeks (n = 139)
9
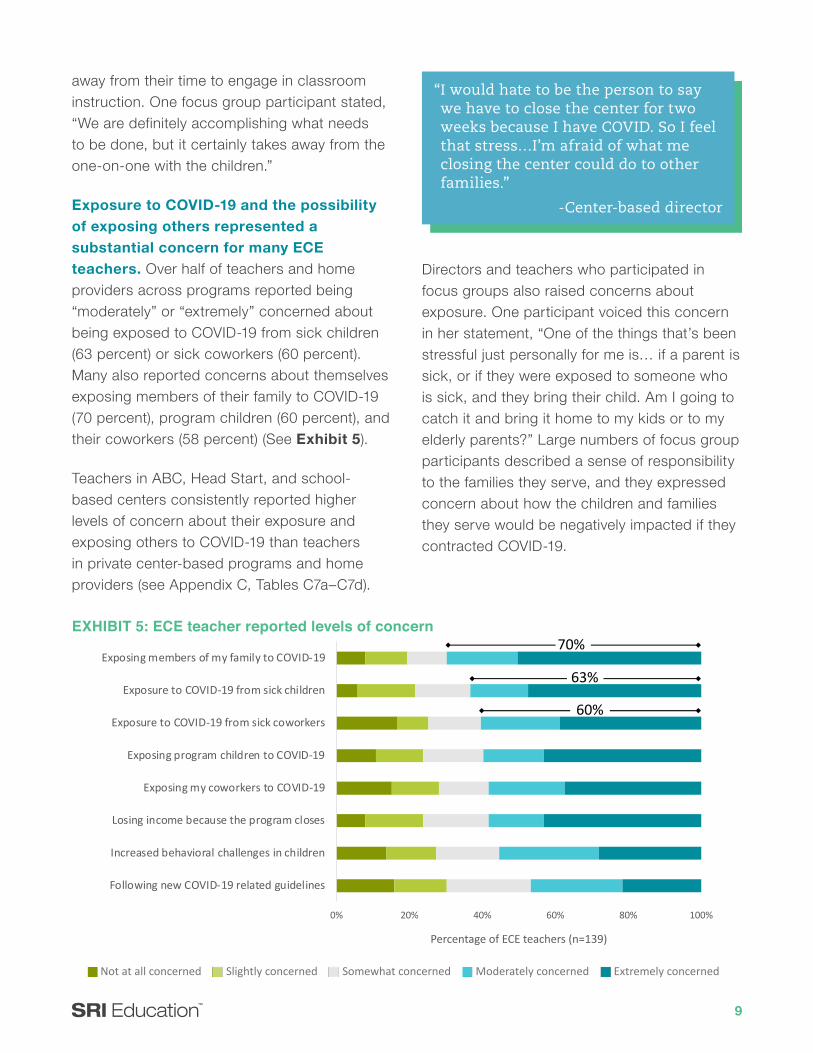
away from their time to engage in classroom instruction. One focus group participant stated, “We are definitely accomplishing what needs to be done, but it certainly takes away from the one-on-one with the children.”
Exposure to COVID-19 and the possibility of exposing others represented a substantial concern for many ECE teachers. Over half of teachers and home providers across programs reported being “moderately” or “extremely” concerned about being exposed to COVID-19 from sick children (63 percent) or sick coworkers (60 percent). Many also reported concerns about themselves exposing members of their family to COVID-19 (70 percent), program children (60 percent), and their coworkers (58 percent) (See Exhibit 5).
Teachers in ABC, Head Start, and school-based centers consistently reported higher levels of concern about their exposure and exposing others to COVID-19 than teachers in private center-based programs and home providers (see Appendix C, Tables C7a–C7d).
Directors and teachers who participated in focus groups also raised concerns about exposure. One participant voiced this concern in her statement, “One of the things that’s been stressful just personally for me is… if a parent is sick, or if they were exposed to someone who is sick, and they bring their child. Am I going to catch it and bring it home to my kids or to my elderly parents?” Large numbers of focus group participants described a sense of responsibility to the families they serve, and they expressed concern about how the children and families they serve would be negatively impacted if they contracted COVID-19.
0% 20% 40% 60% 80% 100%
Following new COVID-19 related guidelines
Increased behavioral challenges in children
Losing income because the program closes
Exposing my coworkers to COVID-19
Exposing program children to COVID-19
Exposure to COVID-19 from sick coworkers
Exposure to COVID-19 from sick children
Exposing members of my family to COVID-19
Percentage of ECE teachers (n=139)
60%
63%
70%
Not at all concerned Slightly concerned Somewhat concerned Moderately concerned Extremely concerned
EXHIBIT 5: ECE teacher reported levels of concern
“ I would hate to be the person to say we have to close the center for two weeks because I have COVID. So I feel that stress…I’m afraid of what me closing the center could do to other families.”
-Center-based director

10
Many programs have experienced staff, children, or parents testing positive for COVID-19. Many early childhood educators expressed concern about the financial strain of program closures. Sixty-six percent of ECE program leaders and teachers reported they have had a staff member, child in their program, or child’s family member test positive for COVID-19 (see Appendix C, Table C8). A program staff member, child, or family member testing positive for COVID-19 may result in a program temporarily closing. Many center-based teachers and home providers are worried about losing income due to program closures, with 58 percent reporting feeling “moderately” or “extremely” concerned (see Appendix C, Tables C7a–C7d). One focus group participant explained, “We closed down in March and we didn’t have a summer program that we normally have, so the loss of revenue has been very stressful for us.”
More home providers and teachers at private center-based programs expressed “moderate” to “extreme” levels of concern around losing income (65 percent and 62 percent, respectively) as compared to teachers at ABC, Head Start, and school-based programs (51 percent). This may be because 92 percent of teachers at ABC, Head Start, and school-based programs reported being offered paid sick leave while only 62 percent of private center-based teachers reported having that option. All home providers reported either being self-employed or not being offered paid sick leave which likely adds to their stress around losing income as well.
Many ECE teachers reported participating in online trainings but also expressed a strong interest in hearing from other ECE providers and receiving additional information on COVID-19 transmission
Center-based teachers and home providers reported accessing different types of support including professional development (PD) group trainings (63 percent), technical assistance (TA) (23 percent), one-on-one coaching (18 percent), and BehaviorHelp consultation (17 percent). Teachers in ABC, Head Start, and school-based programs were the most likely to access supports, except for one-on-one coaching where more teachers at private center-based programs reported receiving this support in the past month (28 percent versus 17 percent). Home providers reported accessing one-on-one coaching (11 percent) and BehaviorHelp consultation (9 percent) less than the other program types (see Appendix C, Tables C9a–C9d).
A large percentage of center-based teachers and home providers reported that hearing about the experiences of other ECE providers and receiving information on the transmission of COVID-19 would be most helpful for providing a safe and appropriate classroom environment during the pandemic (See Appendix C, Tables C9a–C9d). Focus group participants echoed the desire to learn from other early childhood educators on how to adhere to COVID-related guidelines and keep children safe while providing them with developmentally appropriate experiences. Participants across groups also expressed a need for additional guidance on how to respond to COVID-19 exposure and positive cases in their program and how to effectively communicate this information to parents. Some participants reported they were able to successfully use

11
the state-run phone hotline to answer their questions while others reported they were not able to receive consistent and direct answers, which led to confusion and frustration.
The extent to which center-based teachers and home providers reported that they would find other types of support helpful was less consistent. Eighty-one percent reported that DCCECE online trainings would be “somewhat” or “very helpful,” but private center-based teachers were less likely to report the trainings would be helpful (69 percent) when compared to home providers (84 percent) and teachers in ABC, Head Start, or school-based programs (86 percent). Fewer home providers and private center-based teachers expressed that they would find one-on-one coaching or mental health (MH) consultation helpful. However, a notable number of home providers responded that they did not know whether one-on-one coaching (36 percent) and MH consultation (43 percent) would be helpful. This may indicate that a substantial number of early childhood educators have not used these services or are not aware of available coaching or mental health services (See Appendix C, Tables C9a-C9d).
ECE TEACHERS’ PERCEPTIONS OF CHILDREN’S BEHAVIOR AND RELATED INSTRUCTIONAL PRACTICES
Most ECE teachers reported no changes in children’s positive social and learning behaviors, but some reported reduced engagement in learning and social activities
Center-based teachers and home providers reported that some children have demonstrated awareness of the pandemic through pretending blocks are thermometers and masks, asking questions about “the sickness”, or talking about having to limit attendance at their birthday party. They nevertheless reported that most children do not express concerns about COVID-19. Most ECE teachers reported that the pandemic has not changed the extent to which children engage in developmentally appropriate behaviors. More than 80 percent of center-based teachers and home providers indicated that the children in their programs “laugh and smile”, “sing or dance”, or “play make-believe” as much or more now compared to before the pandemic (see Exhibit 6).
However, some ECE teachers noted concerning changes in children’s behavior. More than a third of center-based teachers and home providers reported that children show reduced levels of attention during group activities (36 percent) and almost a quarter (23 percent) reported children show reduced attention during individual activities. Some also reported that their current cohort of children was less likely to engage in cooperative play with peers (29 percent) or make new friends (24 percent) as compared to the children in their classrooms before the pandemic (see Appendix C, Tables C10a–C10d). Teachers and home providers who indicated they use more practices that restrict children’s behavior during the pandemic (e.g., assigning

12
children to specific activities) were more likely to report that children “smile and laugh”, “sing and dance”, “engage in cooperative play”, “make new friends”, “have conversations with peers”, or “show strong attention during group activities”, “somewhat less” or “much less” than before the pandemic (see Appendix C, Table C11).
Many teachers of preschool-aged children reported having one or more children in their classroom with challenging behaviors in the past month
Nearly 60 percent of center-based teachers and home providers reported having preschool-aged children with challenging behavior, defined as “a repeated pattern of behavior” that makes it difficult for children to play and learn in the past month, with most reporting two children with these behaviors. Although reports of challenging behaviors were most common among educators of preschool-aged children, almost half of toddler educators (46 percent) and nearly a third
of infant educators (30 percent) reported having children with challenging behavior (see Appendix C, Table 12).
Compliance with COVID-19 rules and difficulties with attention were the most frequently reported challenging behaviors. Approximately 50 percent of center-based teachers and home providers reported that children’s disruptive behavior stemmed from the child’s inability to comply with COVID-19-related safety rules such as not touching others (see Exhibit 7, and Appendix C, Tables C13a–C13d). Some ECE teachers (46 percent) also reported that children’s difficulties with attention and activity (e.g., not paying attention or following routines) was another disruptive behavior. Two other disruptive behaviors occurring multiple times a week were reported by 20 percent or more of ECE teachers: a child threatening others’ safety or well-being (21 percent) and a child expressing anger toward others (22 percent).
Show excitement about learning
Strong attention for individual activities
Strong attention for group activities*
Lear
ning
Beh
avio
rs
0% 20% 40% 60% 80% 100%
Have conversations with peers*
Play pretend or make believe
Sing or dance just for fun*
Laugh and smile*
Make new friends*
Engage in cooperative play*
Percentage of ECE teachers (n = 136)
Soci
al b
ehav
iors
29%
36%
*Correlational analyses indicate a positive statistically significant association between reporting that children exhibit this behavior somewhat or much less often and the teacher’s reports of engaging in more directive instructional practices (i.e., restricting the number of children who can be in a given center or area, assigning children specific activities rather than permitting free exploration, asking children to refrain from touching one another, and encouraging children to stay some distance away from each other during play).
Much less often
Somewhat less often
About the same amount of time
Somewhat more often
Much more often
EXHIBIT 6: ECE teacher reported changes in children’s social and learning behaviors

13
Compliance with pandemic-related changes in classroom routines and rules was the most cited factor contributing to children’s challenging behavior. Over a third of center-based teachers and home providers (37 percent) reported that compliance with pandemic related changes in classroom routines and rules were “always” or “very often” a contributor to children’s challenging behavior. Nearly a third reported that two other factors always or very often contributed to challenging behavior; these were increased restrictions on children’s behavior (31 percent) and family problems, such as financial or parent mental health concerns (30 percent). (See Appendix C, Tables C14a–C14d.)
Most ECE teachers reported that they were able to manage children’s behavior, though some reported negative impacts of this behavior on other children and themselves. Eighty-three percent of center-based teachers and home providers “agreed” or “strongly agreed” that they could manage children’s challenging behavior. However, over
a quarter (28 percent) “agreed” or “strongly agreed” that children’s challenging behavior was a major frustration in their work, and a third (33 percent) “agreed” or “strongly agreed” that children’s challenging behavior interfered with their ability to support other children (see Appendix C, Tables C15a–C15d).
Over a quarter of ECE teachers reported using at least one exclusionary practice other than expulsion for preschoolers with challenging behavior; expulsion was less common
Center-based teachers and home providers who reported children with challenging behavior were asked about three types of exclusionary practices other than expulsion. These practices included requesting that a child be picked up early, attend a shortened day, or stay home one full day or more. Twenty-one percent of ECE teachers reported using exclusionary practices other than expulsion for toddlers with challenging behaviors, but only one teacher reported using exclusionary practices for an infant (8 percent).
0% 20% 40% 60% 80% 100%
Frequently appears worried
Refuses to eat or feed
Frequently upset/withdrawn
Threatens others safety and well-being
A child is angry towards others
Unable to comply with COVID regulations
Attention/activity problems
Percentage of ECE teachers (n=134)
60%
59%
This type of behavior did not cause a major disruption
About once a week
Less than once a week
Multiple times each week
Angry toward others
EXHIBIT 7: ECE teacher reported reports of child behaviors that caused a “major disruption” in their classroom over the past month

14
Among teachers who report having infants, toddlers, or preschoolers with challenging behaviors, 7 percent reported asking children to permanently leave their classroom. Although center-based teachers and home providers did not report that they asked for any infants to leave the program, they were almost evenly split in the percentages who expelled toddlers (7 percent) and preschoolers (6 percent) (see Appendix C, Table 16) (See Exhibit 8).
Aggression, anger, difficulty following routines and paying attention, and worry or distress were cited by teachers as reasons for asking a child to permanently leave a setting. Center-based teachers and home providers who reported permanently removing a child from their program selected multiple behaviors as contributors, with most reporting more than three behaviors (see Appendix C, Table C17). Inability to comply with COVID-19
10 Since 2015, Arkansas DCCECE has implemented a policy that requires CCDF-funded child care programs to call a centralized warm-line to request assistance when a child is at risk of expulsion due to behavior concerns. This support, called BehaviorHelp, assigns an early childhood mental health (ECMH) consultant or PD specialist to the program to help teachers use effective practices to address children’s challenging behavior and promote their social-emotional competencies. For more information see https://www.behaviorhelponline.org/
rules was cited by two teachers as a behavior of the children asked to be dismissed from the program. Although behavioral difficulties resulting in dismissal were often tied to externalizing behavior, all teachers cited “appears worried” or “upset/withdrawn” as behavior seen in expelled children. These teachers also tended to try to manage children’s challenging behavior without seeking assistance outside their program. Only one teacher out of five teachers who reported expelling a child indicated that they requested assistance through the state BehaviorHelp system.10 The most frequently reported strategies for addressing behavior difficulties were teachers’ use of practices learned in previous technical assistance and coaching (4 teachers) and talking with the child’s parent (4 teachers). None of the teachers used other assistance outside the program, such as requesting help from a TA provider or early intervention specialists (see Appendix C, Table C18).
8
14
22
18 18
57 6
0
5
10
15
20
25
Teachers who reported infants withchallenging behavior (n = 12)
Teachers who reported toddlers withchallenging behavior (n = 28)
Teachers who reported preschoolerswith challenging behavior (n = 65)
Perc
enta
ge o
f ECE
teac
hers
*
*ECE teachers who reported infants with challenging behavior did not report keeping them at home for a full day or more, having them attend a shortened day, or having them leave the classroom permanently†ECE teachers who reported toddlers with challenging behaviors did not report having them attend a shortened day
Pick up a child early on one or more days
Have the child leave the classroom permanently
Keep a child home for a full day or more
Have the child attend a shortened day
†
Exhibit 8: Percentage of teachers reporting use of exclusionary practices with children who exhibit challenging behaviors

15
CONSIDERATIONS The DCCECE adopted many strategies to address the needs of early care and education programs, teachers, children, and their families. In this section, we offer guiding questions to inform discussions about possible additional supports. In particular, the questions are concerned with recognizing ECE directors’ and teachers’ efforts to keep children safe, help teachers manage frustration related to COVID-19 safety practices and children’s behavior, help children experience high-quality settings that promote optimal development, and reduce teacher stress about COVID-19 transmission, financial difficulties, and uncertainty about public health-related issues.
• In view of results that suggest high compliance and support for DCCECE pandemic procedures, would it be useful to recognize this impressive effort by ECE programs and providers and highlight the benefits to programs and families? Early childhood educators may appreciate recognition of their extensive efforts to respond to the pandemic. This could be shared via newsletters, monthly calls, or other media outreach.
• To address teacher frustration about children’s challenging behavior and negative consequences for children (e.g., exclusionary practices), is it possible to provide additional outreach and individualized support to teachers and program leaders? TA providers, coaches, and consultants might do check-in phone calls to directors and home providers to inquire about staff needs; targeting settings that may be known to have quality, financial, or other concerns. ECE directors and teachers might be regularly encouraged to seek assistance and support from existing sources such as BehaviorHelp.
• Can DCCECE identify and share guidance with center-based lead teachers and home providers on reducing any unnecessary restrictive behavior and increasing children’s self-directed behavior and cooperative play while maintaining safety? Examples might include: (1) Public health guidance on the best way to form “pods” of children with a teacher and what behaviors are safe and permissible within a “pod” (e.g., can children choose their own activities within a pod?), and (2) Guidance on classroom routines that increase children’s attention and engagement in activities (e.g., ensuring adequate periods of uninterrupted play).
• Are there sufficient opportunities for ECE program directors and lead teachers to share ideas about coping with pandemic-related challenges? A substantial number of early childhood educators expressed an interest in connecting with their peers. This might be accomplished through (1) dedicating additional time in the currently scheduled monthly sessions for this type of sharing, or (2) scheduling sessions where teachers can pose challenges they face and receive ideas and support from peers (allowing for comments by DCCECE to ensure alignment with guidelines and desired practices).
• Are there additional methods to ensure that all ECE providers have up-to-date public health information (e.g., on conditions that require closure, vaccination availability) and information about financial supports when a setting is facing a possible shutdown or closure? Although many early childhood educators praised the responsiveness of state and local officials, some expressed confusion about public health procedures. The DCCECE might explore additional ways to inform and respond to emerging questions from educators.

1
Appendices Contents
Appendix A: Methodology ............................................................................................................. 2
Director, Lead Teacher, and Home Provider Survey ................................................................ 2
Virtual Focus Groups ................................................................................................................ 4
Appendix B: DCCECE COVID-19 Guidelines ............................................................................... 6
Appendix C: Data tables ............................................................................................................... 8

2
Appendix A: Methodology
Director, Lead Teacher, and Home Provider Survey The sample design used in this study was a two-stage stratified cluster design. This approach permits the research team to report findings about programs that are generalizable to the population, specifically for survey questions where all ECE program directors (i.e., center-based directors and home providers) provided one response on behalf of their program. Findings related to teacher practices and child behaviors are not generalizable beyond the sample.
The first stage consisted of a sample of early childhood programs; the second stage consisted of samples of the program leaders and teachers in the sampled programs. The first stage of design required the team to sample programs using disproportionate stratified sampling (Daniel, 2012). First, the early childhood programs in Arkansas were separated into mutually exclusive, homogeneous groups (strata). The strata in this study were program type: (1) ABC, Head Start, and school-based, (2) private center-based, and (3) home-based early childhood programs. In disproportionate sampling, the probability of an early childhood program being selected from a stratum is not proportional to the number of programs in the strata. The research team elected to use disproportionate sampling because the number of home-based programs was comparatively smaller in the population which might prevent this program type from being adequately represented in the survey if a proportionate sampling approach was used. Therefore, the research team oversampled home-based early childhood programs to ensure the survey results included a sufficient sample of home-based early childhood programs. The research team selected a stratified random sample of 150 ABC, Head Start, and school-based programs, 150 private center-based programs, and 100 licensed family child care home providers to participate in the study.
The second stage of the stratified cluster design involved selecting ECE program directors and teachers from each program to participate in the survey. The research team asked one center-based director from each early childhood program that was selected in the first stage to complete a survey. The team sent the directors of center-based programs a director version of the survey which included asking them to provide the contact information for lead teachers at their center. Directors took approximately 25 minutes to complete the survey. The team sent a teacher version of the survey to center-based lead teachers on a rolling basis as the director of their center provided their contact information. Also, directors who also serve as lead teachers had the opportunity to complete the teacher survey in addition to the director survey. For directors that completed the teacher version of the survey, all duplicate items between the two surveys were removed. Home providers were sent one teacher version of the survey to complete on behalf of their program. Lead teachers and home providers took approximately 30 minutes to complete the teacher version of the survey.
The director and teacher surveys were designed in partnership with SRI, NCCP, and the DCCECE. Survey items addressed child care providers’ experiences implementing COVID-19

3
guidelines, their personal well-being, and the behaviors of children in their programs. Surveys were launched on a rolling basis from October through December 2020. The survey completion rates are as follows: 89 directors of ABC, Head Start, and school-based programs and 57 lead teachers; 61 directors of private center-based programs and 32 lead teachers; and 43 home providers. The completion rates are detailed further in Figure A1.
Figure A1: Survey response sample
The age groups served by center-based lead teachers and home providers who completed all or part of the survey (n = 144) was as follows: preschoolers only (n = 68); infants, toddlers, and preschoolers (n = 39); toddlers and preschoolers (n = 16); toddlers only (n = 11); infants and toddlers (n = 8); and infants only (n = 2). The geographic distribution of survey respondents was similar to that of the population of Arkansas licensed childcare providers (see Table A1).
Table A1: Regional distribution of licensed child care providers in the respondent sample and population
Survey Sample Population (%) (%)
Region 1 16 17
Region 2 24 21
Region 3 17 19
Region 4 18 17
Region 5 17 18
Region 6 8 9
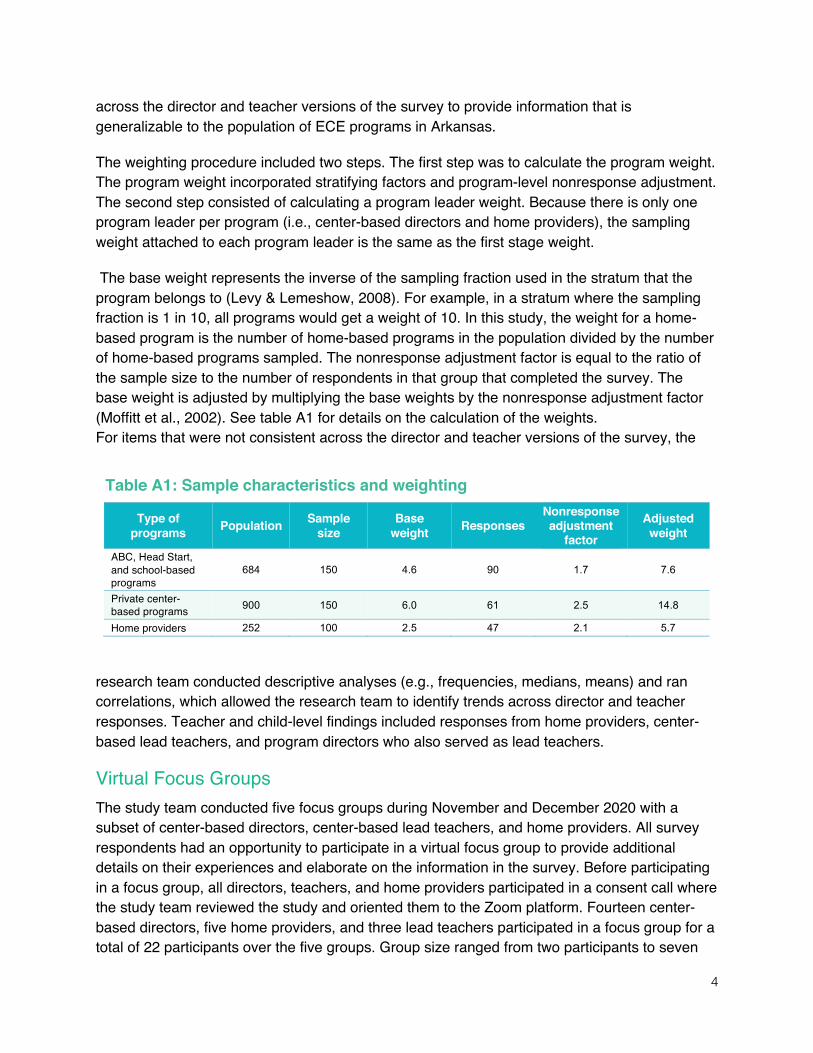
To account for differential probabilities of selection due to the nature of the study design and to ensure accurate survey estimates, the research team computed weights for site-level findings. Because center-based directors completed the director version of the survey and home providers completed the teacher version, the weights were applied to items that were consistent
4
across the director and teacher versions of the survey to provide information that is generalizable to the population of ECE programs in Arkansas.
The weighting procedure included two steps. The first step was to calculate the program weight. The program weight incorporated stratifying factors and program-level nonresponse adjustment. The second step consisted of calculating a program leader weight. Because there is only one program leader per program (i.e., center-based directors and home providers), the sampling weight attached to each program leader is the same as the first stage weight.
The base weight represents the inverse of the sampling fraction used in the stratum that the program belongs to (Levy & Lemeshow, 2008). For example, in a stratum where the sampling fraction is 1 in 10, all programs would get a weight of 10. In this study, the weight for a home-based program is the number of home-based programs in the population divided by the number of home-based programs sampled. The nonresponse adjustment factor is equal to the ratio of the sample size to the number of respondents in that group that completed the survey. The base weight is adjusted by multiplying the base weights by the nonresponse adjustment factor (Moffitt et al., 2002). See table A1 for details on the calculation of the weights. For items that were not consistent across the director and teacher versions of the survey, the
research team conducted descriptive analyses (e.g., frequencies, medians, means) and ran correlations, which allowed the research team to identify trends across director and teacher responses. Teacher and child-level findings included responses from home providers, center-based lead teachers, and program directors who also served as lead teachers.
Virtual Focus Groups The study team conducted five focus groups during November and December 2020 with a subset of center-based directors, center-based lead teachers, and home providers. All survey respondents had an opportunity to participate in a virtual focus group to provide additional details on their experiences and elaborate on the information in the survey. Before participating in a focus group, all directors, teachers, and home providers participated in a consent call where the study team reviewed the study and oriented them to the Zoom platform. Fourteen center-based directors, five home providers, and three lead teachers participated in a focus group for a total of 22 participants over the five groups. Group size ranged from two participants to seven
Table A1: Sample characteristics and weighting
Type of programs Population Sample
size Base
weight Responses Nonresponse adjustment
factor Adjusted weight
ABC, Head Start, and school-based programs
684 150 4.6 90 1.7 7.6
Private center-based programs 900 150 6.0 61 2.5 14.8
Home providers 252 100 2.5 47 2.1 5.7

5
participants. After each focus group, the research team met to discuss key themes that emerged during the focus group and determined areas where the findings aligned with or diverged from the survey findings. The research team used the recordings of the focus groups to verify the illustrative quotes included in the report.
References
Daniel, J. (2012). Choosing the type of probability sampling. In Daniel, J. Sampling essentials: Practical guidelines for making sampling choices (pp. 125-174). SAGE Publications. https://doi.org/10.4135/9781452272047
Levy, P. S. & Lemeshow, S. (2008). Sampling of populations: Methods and applications (4th edition). Wiley & Sons.
Moffitt, R. A., Citro, C. F., & Ploeg, M. V. (2002). Studies of welfare populations: Data collection and research issues. National Academies Press.

6
Appendix B: DCCECE COVID-19 Guidelines

7

8
Appendix C: Data tables
Table C1a: Percentage of ECE program directors who report implementing procedures to reduce the spread of COVID 19 “All the time” or “Most of the time”– All center-based directors and home providers
Infants
(n = 104) Toddlers (n = 124)
Preschoolers (n = 187)
Adults (n = 194)
% % % % SE Parent pick up and drop off take place outside of the facility – – – 89.1 2.5
Parents asked about children's COVID-19 symptoms before the child enters the facility
– – – 93.3 2.1
Adults are asked about COVID-19 symptoms before entering the facility – – – 96.5 1.5
Adults other than regular staff are not permitted in the building – – – 93.1 1.9
Have their temperature taken before they enter the facility 97.0 97.8 98.1 97.8 1.1
Wear a face mask while inside the facility 1.1 4.4 16.9 96.9 1.5
Wash hands or use hand sanitizer upon entering the building 94.0 97.5 96.9 – –
Bring or are served individual snacks and lunches 89.8 89.0 92.4 – –
Are required to be at least 6 feet apart while eating 47.5 48.3 48.7 – –
Use a set of personal supplies and are asked not to share these 64.4 66.8 76.6 – –
Note: Findings specific to adults are generalizable to the population of ECE programs in Arkansas. The standard error (SE) an indication of how close the sample survey estimate is to the result that would have been obtained from a survey of the population. Findings related to infants, toddlers, and preschoolers are not generalizable beyond the sample.

9
Table C1b: Percentage of ECE program directors who report implementing procedures to reduce the spread of COVID 19 “All the time” or “Most of the time”– Directors of ABC, Head Start, and school-based programs
Infants (n = 26)
Toddlers (n = 29)
Preschoolers (n = 86)
Adults (n = 88)
% % % % SE Parent pick up and drop off take place outside of the facility – – – 95.5 2.2
Parents asked about children's COVID-19 symptoms before the child enters the facility
– – – 97.7 1.6
Adults are asked about COVID-19 symptoms before entering the facility – – – 98.9 1.1
Adults other than regular staff are not permitted in the building – – – 97.7 1.6
Have their temperature taken before they enter the facility 100.0 100.0 98.8 98.9 1.1
Wear a face mask while inside the facility 0.0 0.0 30.6 100.0 0.0
Wash hands or use hand sanitizer upon entering the building 100.0 100.0 98.8 - -
Bring or are served individual snacks and lunches 96.2 100.0 97.6 - -
Are required to be at least 6 feet apart while eating 73.1 71.4 57.1 - -
Use a set of personal supplies and are asked not to share these 88.5 93.1 92.9 - -
Note: Findings specific to adults are generalizable to the population of ECE programs in Arkansas. The standard error (SE) an indication of how close the sample survey estimate is to the result that would have been obtained from a survey of the population. Findings related to infants, toddlers, and preschoolers are not generalizable beyond the sample.
10
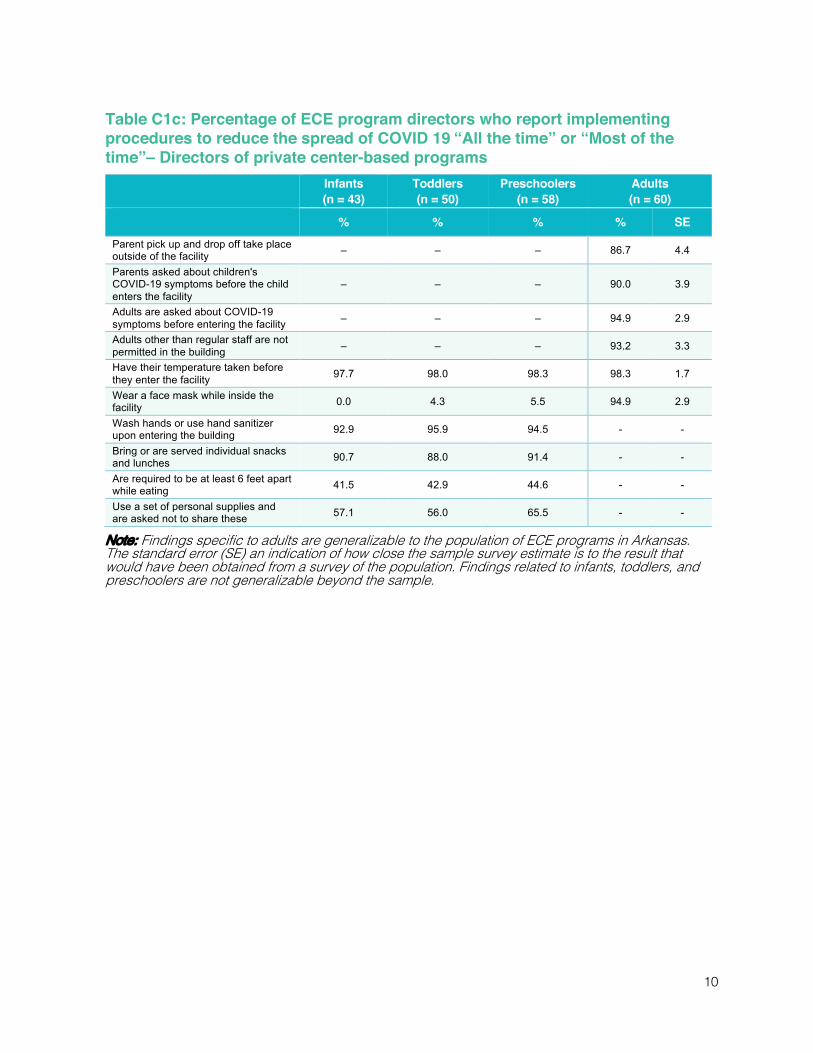
Table C1c: Percentage of ECE program directors who report implementing procedures to reduce the spread of COVID 19 “All the time” or “Most of the time”– Directors of private center-based programs
Infants (n = 43)
Toddlers (n = 50)
Preschoolers (n = 58)
Adults (n = 60)
% % % % SE Parent pick up and drop off take place outside of the facility – – – 86.7 4.4
Parents asked about children's COVID-19 symptoms before the child enters the facility
– – – 90.0 3.9
Adults are asked about COVID-19 symptoms before entering the facility – – – 94.9 2.9
Adults other than regular staff are not permitted in the building – – – 93.2 3.3
Have their temperature taken before they enter the facility 97.7 98.0 98.3 98.3 1.7
Wear a face mask while inside the facility 0.0 4.3 5.5 94.9 2.9
Wash hands or use hand sanitizer upon entering the building 92.9 95.9 94.5 - -
Bring or are served individual snacks and lunches 90.7 88.0 91.4 - -
Are required to be at least 6 feet apart while eating 41.5 42.9 44.6 - -
Use a set of personal supplies and are asked not to share these 57.1 56.0 65.5 - -
Note: Findings specific to adults are generalizable to the population of ECE programs in Arkansas. The standard error (SE) an indication of how close the sample survey estimate is to the result that would have been obtained from a survey of the population. Findings related to infants, toddlers, and preschoolers are not generalizable beyond the sample.

11
Table C1d: Percentage of ECE program directors who report implementing procedures to reduce the spread of COVID 19 “All the time” or “Most of the time”– Home providers
Infants (n = 35)
Toddlers (n = 45)
Preschoolers (n = 43)
Adults (n = 47)
% % % % SE Parent pick up and drop off take place outside of the facility – – – 80.4 5.9
Parents asked about children's COVID-19 symptoms before the child enters the facility
– – – 93.6 3.6
Adults are asked about COVID-19 symptoms before entering the facility – – – 95.7 3.0
Adults other than regular staff are not permitted in the building – – – 80.4 5.9
Have their temperature taken before they enter the facility 91.4 95.6 95.3 93.5 3.6
Wear a face mask while inside the facility 5.7 8.9 18.6 95.7 3.0
Wash hands or use hand sanitizer upon entering the building 91.4 100.0 100.0 - -
Bring or are served individual snacks and lunches 80.0 82.2 81.4 - -
Are required to be at least 6 feet apart while eating 39.4 44.4 39.5 - -
Use a set of personal supplies and are asked not to share these 62.9 75.6 72.1 - -
Note: Findings specific to adults are generalizable to the population of ECE programs in Arkansas. The standard error (SE) an indication of how close the sample survey estimate is to the result that would have been obtained from a survey of the population. Findings related to infants, toddlers, and preschoolers are not generalizable beyond the sample.

12
Table C2a: ECE program director level of agreement with DCCECE COVID-19 guidelines – All center-based directors and home providers
Strongly
agree Agree Neither
agree nor disagree
Disagree Strongly disagree
% SE % SE % SE % SE % SE Group size can be no more than 10 people, including staff and children (n = 188)
33.8 3.6 30.5 3.7 13.8 2.8 15.0 2.9 6.9 2.0
Children should remain in the same assigned group each day (n = 188)
44.2 3.9 31.4 3.7 10.4 2.5 7.1 1.9 6.8 2.1
Parent pick up and drop off should take place outside of the facility (n = 190)
67.7 3.6 18.2 2.9 6.0 2.0 6.2 2.0 1.8 0.7
Access to the facility is limited to staff, children, and their parent/guardian (n = 191)
65.9 3.6 22.6 3.3 5.3 1.7 1.8 0.8 4.5 1.5
Adults must take their temperature before entering the facility (n = 191)
79.5 3.1 15.0 2.7 2.9 1.4 2.3 1.1 0.3 0.3
Adults are screened for COVID-19 symptoms before entering the facility (n = 190)
74.3 3.4 16.7 2.9 5.9 1.8 2.0 1.1 1.1 0.9
Staff are required to wear face masks (n = 189) 60.8 3.8 18.9 3.1 6.7 2.0 9.7 2.4 4.0 1.3
Children should be served individual snacks and meal (n = 191)
69.9 3.6 24.1 3.3 4.3 1.6 0.6 0.4 1.1 0.9
Sick children should not be cared for at the facility (n = 189)
85.7 2.7 9.9 2.4 3.2 1.3 0.0 0.0 1.1 0.9
Note: Findings are generalizable to the population of ECE programs in Arkansas. The standard error (SE) an indication of how close the sample survey estimate is to the result that would have been obtained from a survey of the population. The numbers may not add to 100 due to rounding to the nearest tenths place.

13
Table C2b: ECE program director level of agreement with DCCECE COVID-19 guidelines – Directors of ABC, Head Start, and school-based programs
Strongly
agree Agree Neither
agree nor disagree
Disagree Strongly disagree
% SE % SE % SE % SE % SE Group size can be no more than 10 people, including staff and children (n = 88)
47.7 5.4 27.3 4.8 10.2 3.2 10.2 3.2 4.5 2.2
Children should remain in the same assigned group each day (n = 88)
54.5 5.3 27.3 4.8 8.0 2.9 5.7 2.5 4.5 2.2
Parent pick and drop off should take place outside of the facility (n = 87)
74.7 4.7 19.5 4.3 1.1 1.1 4.6 2.3 0.0 0.0
Access to the facility is limited to staff, children, and their parent/guardian (n = 88)
69.3 4.9 21.6 4.4 3.4 1.9 2.3 1.6 3.4 1.9
Adults must take their temperature before entering the facility (n = 88)
79.5 4.3 14.8 3.8 3.4 1.9 2.3 1.6 0.0 0.0
Adults are screened for COVID-19 symptoms before entering the facility (n = 88)
75.0 4.6 17.0 4.0 5.7 2.5 2.3 1.6 0.0 0.0
Staff are required to wear face masks (n = 88) 69.3 4.9 17.0 4.0 3.4 1.9 6.8 2.7 3.4 1.9
Children should be served individual snacks and meal (n = 88)
72.7 4.8 25.0 4.6 2.3 1.6 0.0 0.0 0.0 0.0
Sick children should not be cared for at the facility (n = 87)
83.9 4.0 11.5 3.4 4.6 2.3 0.0 0.0 0.0 0.0
Note: Findings are generalizable to the population of ABC, Head Start, and school-based programs in Arkansas. The standard error (SE) an indication of how close the sample survey estimate is to the result that would have been obtained from a survey of the population.

14
Table C2c: ECE program director level of agreement with DCCECE COVID-19 guidelines – Directors of private center-based programs
Strongly
agree Agree Neither
agree nor disagree
Disagree Strongly disagree
% SE % SE % SE % SE % SE Group size can be no more than 10 people, including staff and children (n = 59)
25.4 5.7 33.9 6.2 16.9 4.9 16.9 4.9 6.8 3.3
Children should remain in the same assigned group each day (n = 59)
40.7 6.5 33.9 6.2 11.9 4.2 5.1 2.9 8.5 3.7
Parent pick up and drop off should take place outside of the facility (n = 59)
67.8 6.1 13.6 4.5 10.2 4.0 8.5 3.7 0.0 0.0
Access to the facility is limited to staff, children, and their parent/guardian (n = 59)
69.5 6.0 22.0 5.4 5.1 2.9 0.0 0.0 3.4 2.4
Adults must take their temperature before entering the facility (n = 59)
83.1 4.9 11.9 4.2 3.4 2.4 1.7 1.7 0.0 0.0
Adults are screened for COVID-19 symptoms before entering the facility (n = 59)
76.3 5.6 15.3 4.7 5.1 2.9 1.7 1.7 1.7 1.7
Staff are required to wear face masks (n = 59) 57.6 6.5 20.3 5.3 8.5 3.7 11.9 4.2 1.7 1.7
Children should be served individual snacks and meal (n = 59)
71.2 5.9 22.0 5.4 5.1 2.9 0.0 0.0 1.7 1.7
Sick children should not be cared for at the facility (n = 59)
86.4 4.5 10.2 4.0 1.7 1.7 0.0 0.0 1.7 1.7
Note: Findings are generalizable to the population of private center-based programs in Arkansas. The standard error (SE) an indication of how close the sample survey estimate is to the result that would have been obtained from a survey of the population.

15
Table C2d: ECE program director level of agreement with DCCECE COVID-19 guidelines – Home providers
Strongly
agree Agree Neither
agree nor disagree
Disagree Strongly disagree
% SE % SE % SE % SE % SE Group size can be no more than 10 people, including staff and children (n = 41)
24.4 6.8 26.8 7.0 12.2 5.2 22.0 6.5 14.6 5.6
Children should remain in the same assigned group each day (n = 41)
26.8 7.0 34.1 7.5 12.2 5.2 19.5 6.3 7.3 4.1
Parent pick up and drop off should take place outside of the facility (n = 44)
47.7 7.6 31.8 7.1 4.5 3.2 2.3 2.3 13.6 5.2
Access to the facility is limited to staff, children, and their parent/guardian (n = 44)
43.2 7.6 27.3 6.8 11.4 4.8 6.8 3.8 11.4 4.8
Adults must take their temperature before entering the facility (n = 44)
65.9 7.2 27.3 6.8 0.0 0.0 4.5 3.2 2.3 2.3
Adults are screened for COVID-19 symptoms before entering the facility (n = 43)
65.1 7.4 20.9 6.3 9.3 4.5 2.3 2.3 2.3 2.3
Staff are required to wear face masks (n = 42) 47.6 7.8 19.0 6.1 9.5 4.6 9.5 4.6 14.3 5.5
Children should be served individual snacks and meal (n = 44)
56.8 7.6 29.5 7.0 6.8 3.8 4.5 3.2 2.3 2.3
Sick children should not be cared for at the facility (n = 43)
88.4 4.9 4.7 3.2 4.7 3.2 0.0 0.0 2.3 2.3
Note: Findings are generalizable to the population of ECE programs in Arkansas. The standard error (SE) an indication of how close the sample survey estimate is to the result that would have been obtained from a survey of the population.

16
Table C3a: ECE teacher changes to classroom activities – All center-based lead teachers and home providers
Much more often
Somewhat more often
About the same
amount of time
Somewhat less often
Much less often
% % % % % Gather all children together as a group (n = 129) 3.9 2.3 36.4 21.7 35.7
Restrict the number of children who can be in a given center or area (n = 123)
53.7 13.0 25.2 5.7 2.4
Assign children specific activities (n = 103) 28.2 28.2 34.0 5.8 3.9
Prohibit children from touching one another (n = 120) 42.5 27.5 22.5 3.3 4.2
Encourage children to stay some distance away from each other during play (n = 115)
39.1 27.0 26.1 4.3 3.5
Hug, pat or hold a child (n = 132) 6.8 3.0 49.2 14.4 26.5 Require children to clean their hands (n = 134) 69.4 16.4 14.2 0.0 0.0
Spend time outside with the children (n = 134) 38.8 15.7 42.5 3.0 0.0
Bring in specialist teachers to lead classroom activities (n = 65) 3.1 1.5 10.8 4.6 80.0
Bring in therapists or special education specialists to work with a child (n = 102)
2.9 98.0 57.8 8.8 29.4
Invite other teachers to visit my classroom (n = 87) 1.1 0.0 9.2 5.7 83.9
Invite a child’s family members to visit the classroom (n = 107) 1.9 0.0 93.0 3.7 93.5

17
Table C3b: ECE teacher changes to classroom activities – Lead teachers in ABC, Head Start, and school-based programs
Much more often
Somewhat more often
About the same
amount of time
Somewhat less often
Much less often
% % % % % Gather all children together as a group (n = 53) 5.7 1.9 22.6 18.9 50.9
Restrict the number of children who can be in a given center or area (n = 55)
72.7 9.1 12.7 1.8 3.6
Assign children specific activities (n = 39) 38.5 28.2 18.0 10.3 5.1
Prohibit children from touching one another (n = 53) 50.9 28.3 15.1 1.9 3.8
Encourage children to stay some distance away from each other during play (n = 53)
52.8 24.5 18.9 3.8 0.0
Hug, pat or hold a child (n = 55) 9.1 0.0 41.8 12.7 36.4 Require children to clean their hands (n = 56) 71.4 12.5 16.1 0.0 0.0
Spend time outside with the children (n = 56) 37.5 5.4 53.6 3.6 0.0
Bring in specialist teachers to lead classroom activities (n = 29) 3.4 0.0 10.3 3.5 82.8
Bring in therapists or special education specialists to work with a child (n = 51)
3.9 2.0 74.5 5.9 13.7
Invite other teachers to visit my classroom (n = 44) 0.0 0.0 6.8 6.8 86.4
Invite a child’s family members to visit the classroom (n = 49) 2.0 0.0 0.0 0.0 98.0

18
Table C3c: ECE teacher changes to classroom activities – Lead teachers in private center-based programs
Much more often
Somewhat more often
About the same
amount of time
Somewhat less often
Much less often
% % % % % Gather all children together as a group (n = 32) 6.3 3.1 59.4 12.5 18.8
Restrict the number of children who can be in a given center or area (n = 29)
34.5 10.3 41.4 13.8 0.0
Assign children specific activities (n = 24) 8.3 29.2 54.2 4.2 4.2
Prohibit children from touching one another (n = 27) 22.2 29.6 37.0 11.1 0.0
Encourage children to stay some distance away from each other during play (n = 24)
16.7 25.0 50.0 4.2 4.2
Hug, pat or hold a child (n = 32) 3.1 6.3 53.1 28.1 9.4 Require children to clean their hands (n = 33) 54.6 30.3 15.2 0.0 0.0
Spend time outside with the children (n = 33) 36.4 27.3 33.3 3.0 0.0
Bring in specialist teachers to lead classroom activities (n = 22) 4.6 0.0 9.1 9.1 77.3
Bring in therapists or special education specialists to work with a child (n = 27)
3.7 0.0 40.7 14.8 40.7
Invite other teachers to visit my classroom (n = 27) 3.7 0.0 11.1 7.4 77.8
Invite a child’s family members to visit the classroom (n = 28) 3.6 0.0 0.0 0.0 96.4

19
Table C3d: ECE teacher changes to classroom activities – Home providers
Much more often
Somewhat more often
About the same
amount of time
Somewhat less often
Much less often
% % % % % Gather all children together as a group (n = 44) 0.0 2.3 36.4 31.8 29.6
Restrict the number of children who can be in a given center or area (n = 39)
41.0 20.5 30.8 5.1 2.6
Assign children specific activities (n = 40) 30.0 27.5 37.5 2.5 2.5
Prohibit children from touching one another (n = 40) 45.0 25.0 22.5 0.0 7.5
Encourage children to stay some distance away from each other during play (n = 38)
34.2 31.6 21.1 5.3 7.9
Hug, pat or hold a child (n = 45) 6.7 4.4 55.6 6.7 26.7 Require children to clean their hands (n = 45) 77.8 11.1 11.1 0.0 0.0
Spend time outside with the children (n = 45) 42.2 20.0 35.6 2.2 0.0
Bring in specialist teachers to lead classroom activities (n = 14) 0.0 7.1 14.3 0.0 78.6
Bring in therapists or special education specialists to work with a child (n = 24)
0.0 0.0 41.7 8.3 50.0
Invite other teachers to visit my classroom (n = 16) 0.0 0.0 12.5 0.0 87.5
Invite a child’s family members to visit the classroom (n = 30) 0.0 0.0 3.3 13.3 83.3

20
Table C3e: Percent of ECE teachers of preschool-aged children implementing directive instructional practices “somewhat” or “much more” often
One directive
practice Two directive
practices Three directive
practices All four
directive practices
% % % % Center-based lead teachers and home providers working with preschool-aged students (n = 134)
17.2 11.9 26.1 26.1
Note: Directive instructional practices include: restricting the number of children who can be in a given center or area, assigning children to specific activities rather than permitting free exploration, asking children to refrain from touching one another, and encouraging children to stay some distance away from each other during play.
Table C4: ECE teacher difficulty in implementing changes to classroom activities – All center-based lead teachers and home providers
Very easy Somewhat easy
Neither difficult nor
easy Somewhat
difficult Very difficult
% % % % % Restrict the number of children who can be in a given center or area (n = 81)
8.6 23.5 8.6 46.9 12.3
Assign children specific activities (n = 56) 5.4 17.9 17.9 41.1 17.9
Prohibit children from touching one another (n = 83) 1.2 15.7 6.0 30.1 47.0
Encourage children to stay some distance away from each other during play (n = 75)
2.7 9.3 6.7 30.7 50.7

21
Table C5: ECE teacher response to a scenario about comforting a distressed child– Center-based lead teachers and home providers serving infants and toddlers
Suggest that
Chase go home and try
again tomorrow
Pick Chase up, give him hug, and tell him mom will be here to pick
him up at the end of the day
Invite his mother to sit in the
classroom until Chase feels comfortable
None of the
above
% % % % All center-based teachers and home providers serving infants and toddlers (n = 69)
0.0 88.4 4.4 7.3
Note: Survey respondents were asked to respond to the following scenario: “Chase is a two-year-old who is fairly new to your program. He is having a hard time separating from his mother in the morning and he cries while holding her leg. You talk to Chase about the activities he enjoys, but your attempts to help Chase feel more comfortable leaving his mother to start the day do not work. This morning is the toughest so far and his mother is getting tearful as well. How would you respond?”
Table C6: ECE teacher job stress in the last two weeks – All center-based lead teachers and family home providers
Not at all stressful
A little stressful
Moderately stressful
Very stressful
Extremely stressful
% % % % % ABC, Head Start, and school-based lead teachers (n = 59) 6.8 25.4 28.8 23.7 15.3
Private center-based lead teachers (n = 34) 2.9 26.5 29.4 35.3 5.9
Home providers (n = 46) 15.2 26.1 17.4 30.4 10.9
All center-based lead teachers and home providers (n = 139) 8.6 25.9 25.2 28.8 11.5

22
Table C7b: ECE teachers’ levels of concern – Lead teachers in ABC, Head Start, and school-based programs
Not at all
concerned Slightly
concerned Somewhat concerned
Moderately concerned
Extremely concerned
% % % % % Losing income because the program closes (n = 59) 6.8 23.7 18.6 17.0 33.9
Exposing program children to COVID-19 (n = 59) 6.8 11.9 17.0 11.9 52.5
Exposing my coworkers to COVID-19 (n = 59) 5.1 15.3 15.3 17.0 47.5
Exposing members of my family to COVID-19 (n = 59) 3.4 10.2 8.5 15.3 62.7
Being exposed to COVID-19 from sick children (n = 59) 1.7 13.6 17.0 11.9 55.9
Being exposed to COVID-19 from sick coworkers (n = 59) 1.7 11.9 17.0 18.6 50.9
Following new COVID-19 related guidelines (n = 59) 15.3 11.9 22.0 28.8 22.0
Children experiencing increased behavioral challenges due to COVID-19-related stressors (n = 59)
10.2 13.6 11.9 32.2 32.2
Table C7a: ECE teachers’ levels of concern – All center-based lead teachers and home providers
Not at all
concerned Slightly
concerned Somewhat concerned
Moderately concerned
Extremely concerned
% % % % % Losing income because the program closes (n = 139) 7.9 15.8 18.0 15.1 43.2
Exposing program children to COVID-19 (n = 139) 10.8 12.9 16.5 16.5 43.2
Exposing my coworkers to COVID-19 (n = 139) 15.1 12.9 13.7 20.9 37.4
Exposing members of my family to COVID-19 (n = 139) 7.9 11.5 10.8 19.4 50.4
Being exposed to COVID-19 from sick children (n = 139) 5.8 15.8 15.1 15.8 47.5
Being exposed to COVID-19 from sick coworkers (n = 139) 16.5 8.6 14.4 21.6 38.8
Following new COVID-19 related guidelines (n = 139) 15.8 14.4 23.0 25.2 21.6
Children experiencing increased behavioral challenges due to COVID-19-related stressors (n = 139)
13.7 13.7 17.3 27.3 28.1

23
Table C7c: ECE teachers’ levels of concern – Lead teachers in private center-based programs
Not at all
concerned Slightly
concerned Somewhat concerned
Moderately concerned
Extremely concerned
% % % % % Losing income because the program closes (n = 34) 5.9 14.7 17.7 17.7 44.1
Exposing program children to COVID-19 (n = 34) 11.8 14.7 17.7 26.5 29.4
Exposing my coworkers to COVID-19 (n = 34) 11.8 11.8 17.7 32.4 26.5
Exposing members of my family to COVID-19 (n = 34) 5.9 14.7 14.7 23.5 41.2
Being exposed to COVID-19 from sick children (n = 34) 8.8 20.6 17.7 23.5 29.4
Being exposed to COVID-19 from sick coworkers (n = 34) 11.8 11.8 17.7 32.4 26.5
Following new COVID-19 related guidelines (n = 34) 11.8 14.7 23.5 35.3 14.7
Children experiencing increased behavioral challenges due to COVID-19-related stressors (n = 34)
8.8 8.8 20.6 38.2 23.5
Table C7d: ECE teachers’ levels of concern – Home providers
Not at all concerned
Slightly concerned
Somewhat concerned
Moderately concerned
Extremely concerned
% % % % % Losing income because the program closes (n = 46) 10.9 6.5 17.4 10.9 54.4
Exposing program children to COVID-19 (n = 46) 15.2 13.0 15.2 15.2 41.3
Exposing my coworkers to COVID-19 (n = 46) 30.4 10.9 8.7 17.4 32.6
Exposing members of my family to COVID-19 (n = 46) 15.2 10.9 10.9 21.7 41.3
Being exposed to COVID-19 from sick children (n = 46) 8.7 15.2 10.9 15.2 50.0
Being exposed to COVID-19 from sick coworkers (n = 46) 39.1 2.2 8.7 17.4 32.6
Following new COVID-19 related guidelines (n = 46) 19.6 17.4 23.9 13.0 26.1
Children experiencing increased behavioral challenges due to COVID-19-related stressors (n = 46)
21.7 17.4 21.7 13.0 26.1
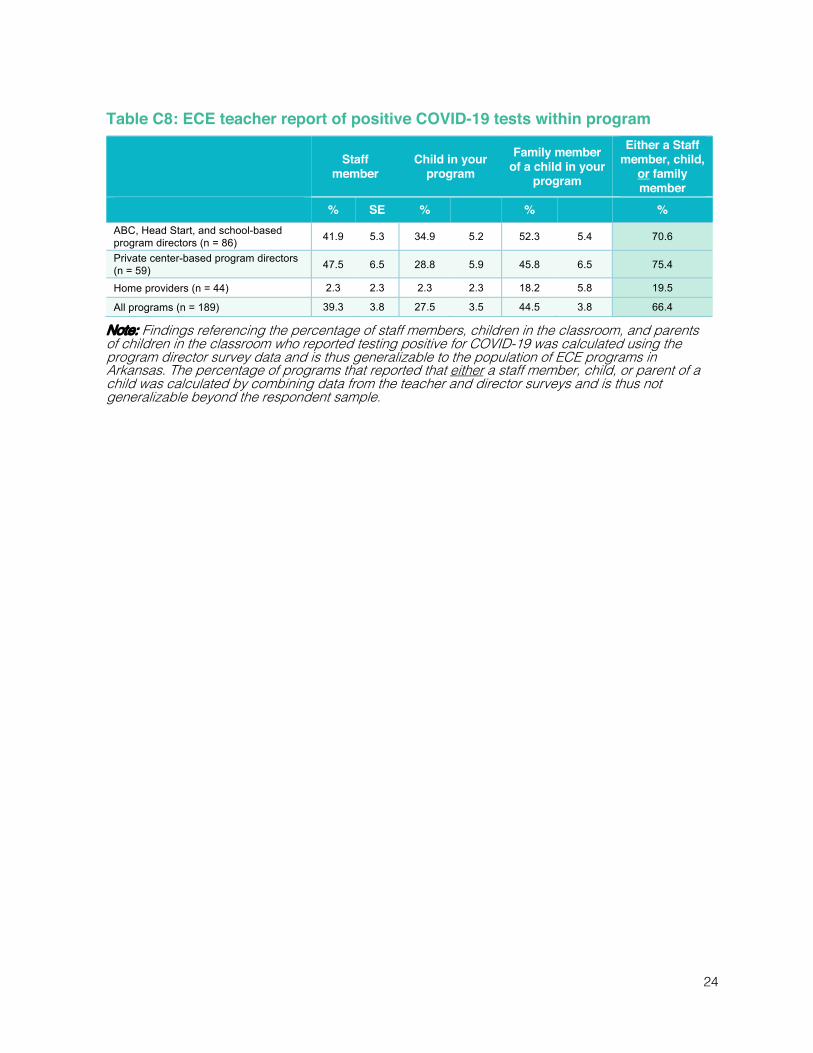
24
Table C8: ECE teacher report of positive COVID-19 tests within program
Staff member
Child in your program
Family member of a child in your
program
Either a Staff member, child,
or family member
% SE % % % ABC, Head Start, and school-based program directors (n = 86) 41.9 5.3 34.9 5.2 52.3 5.4 70.6
Private center-based program directors (n = 59) 47.5 6.5 28.8 5.9 45.8 6.5 75.4
Home providers (n = 44) 2.3 2.3 2.3 2.3 18.2 5.8 19.5
All programs (n = 189) 39.3 3.8 27.5 3.5 44.5 3.8 66.4
Note: Findings referencing the percentage of staff members, children in the classroom, and parents of children in the classroom who reported testing positive for COVID-19 was calculated using the program director survey data and is thus generalizable to the population of ECE programs in Arkansas. The percentage of programs that reported that either a staff member, child, or parent of a child was calculated by combining data from the teacher and director surveys and is thus not generalizable beyond the respondent sample.

25
Table C9a: ECE teacher utilization of different supports and level of helpfulness – All center-based teachers and home providers
Very helpful
Somewhat helpful
Neither helpful
nor unhelpful
Somewhat unhelpful
Very unhelpful
I don’t know
Used supports
in the last
month % % % % % % %
Have you received any of the following types of supports over the last month? Professional development group trainings (online or in person) (n = 133)
- - - - - - 63.2
BehaviorHelp consultation (n = 133) - - - - - - 16.5
Technical assistance (n = 133) - - - - - - 23.3
One-on-one coaching from an expert teacher (n = 133)
- - - - - - 18.0
How helpful are the following types of information/assistance in supporting you to provide a safe and appropriate classroom/home environment?
One-on-one coaching from an expert teacher (n = 133)
24.1 27.1 22.6 1.5 3.8 21.1 -
Support from a Mental Health Consultant to address challenges with a particular child or family (n = 131)
23.7 31.3 16.8 1.5 2.3 24.4 -
Information about how COVID-19 is transmitted in early childhood education settings (n = 133)
52.6 30.8 8.3 75.0 2.3 5.3 -
Hearing from other early childhood teachers (n = 133)
48.9 41.4 4.5 1.5 1.5 2.3 -
Online trainings from the DCCECE (n = 133) 45.9 35.3 6.8 3.8 1.5 6.8 -

26
Table C9b: ECE teacher utilization of different supports and level of helpfulness – Lead teachers in ABC, Head Start, and school-based programs
Very helpful
Somewhat helpful
Neither helpful
nor unhelpful
Somewhat unhelpful
Very unhelpful
I don’t know
Used supports
in the last
month % % % % % % %
Have you received any of the following types of supports over the last month? Professional development group trainings (online or in person) (n = 57)
- - - - - - 64.9
BehaviorHelp consultation (n = 57) - - - - - - 24.6
Technical assistance (n = 57) - - - - - - 26.3
One-on-one coaching from an expert teacher (n = 57)
- - - - - - 17.5
How helpful are the following types of information/assistance in supporting you to provide a safe and appropriate classroom/home environment?
One-on-one coaching from an expert teacher (n = 57)
24.6 38.6 22.8 0.0 3.5 10.5 -
Support from a Mental Health Consultant to address challenges with a particular child or family (n = 56)
32.1 42.9 12.5 0.0 3.6 8.9 -
Information about how COVID-19 is transmitted in early childhood education settings (n = 57)
50.9 33.3 7.0 0.0 3.5 5.3 -
Hearing from other early childhood teachers (n = 57)
56.1 38.6 5.3 0.0 0.0 0.0 -
Online trainings from the DCCECE (n = 57) 47.4 38.6 8.8 3.5 0.0 1.8 -

27
Table C9c: ECE teacher utilization of different supports and level of helpfulness – Lead teachers in private center-based programs
Very helpful
Somewhat helpful
Neither helpful
nor unhelpful
Somewhat unhelpful
Very unhelpful
I don’t know
Used supports
in the last
month % % % % % % %
Have you received any of the following types of supports over the last month? Professional development group trainings (online or in person) (n = 32)
- - - - - - 62.5
BehaviorHelp consultation (n = 32) - - - - - - 12.5
Technical assistance (n = 32) - - - - - - 21.9
One-on-one coaching from an expert teacher (n = 32)
- - - - - - 28.1
How helpful are the following types of information/assistance in supporting you to provide a safe and appropriate classroom/home environment?
One-on-one coaching from an expert teacher (n = 32)
21.9 25.0 21.9 6.3 6.3 18.8 -
Support from a Mental Health Consultant to address challenges with a particular child or family (n = 31)
19.4 29.0 16.1 6.5 3.2 25.8 -
Information about how COVID-19 is transmitted in early childhood education settings (n = 32)
46.9 34.4 12.5 3.1 3.1 0.0 -
Hearing from other early childhood teachers (n = 32)
37.5 50.0 3.1 3.1 3.1 3.1 -
Online trainings from the DCCECE (n = 32) 28.1 40.6 6.3 3.1 6.3 15.6 -
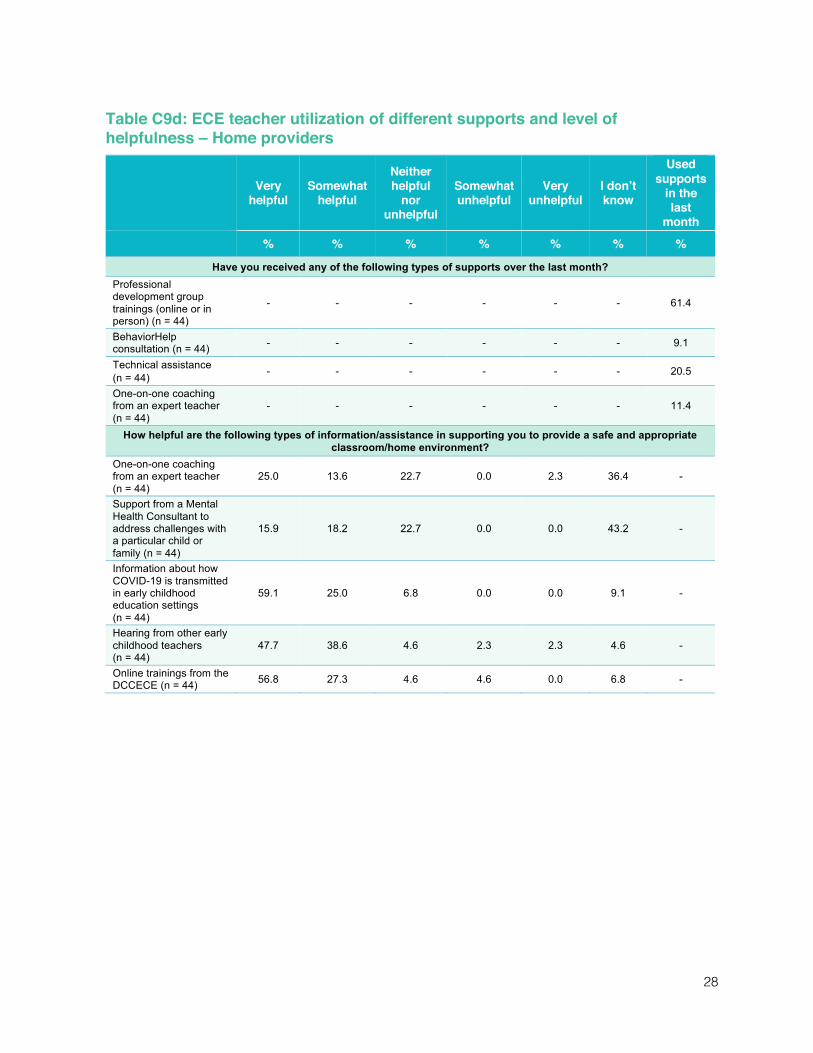
28
Table C9d: ECE teacher utilization of different supports and level of helpfulness – Home providers
Very helpful
Somewhat helpful
Neither helpful
nor unhelpful
Somewhat unhelpful
Very unhelpful
I don’t know
Used supports
in the last
month % % % % % % %
Have you received any of the following types of supports over the last month? Professional development group trainings (online or in person) (n = 44)
- - - - - - 61.4
BehaviorHelp consultation (n = 44) - - - - - - 9.1
Technical assistance (n = 44) - - - - - - 20.5
One-on-one coaching from an expert teacher (n = 44)
- - - - - - 11.4
How helpful are the following types of information/assistance in supporting you to provide a safe and appropriate classroom/home environment?
One-on-one coaching from an expert teacher (n = 44)
25.0 13.6 22.7 0.0 2.3 36.4 -
Support from a Mental Health Consultant to address challenges with a particular child or family (n = 44)
15.9 18.2 22.7 0.0 0.0 43.2 -
Information about how COVID-19 is transmitted in early childhood education settings (n = 44)
59.1 25.0 6.8 0.0 0.0 9.1 -
Hearing from other early childhood teachers (n = 44)
47.7 38.6 4.6 2.3 2.3 4.6 -
Online trainings from the DCCECE (n = 44) 56.8 27.3 4.6 4.6 0.0 6.8 -

29
Table C10a: ECE teachers observed changes in children’s behavior – All center-based lead teachers and home providers
Much more often
Somewhat more often
About the same
amount of time
Somewhat less often
Much less often
% % % % % Children laugh and smile (n = 136) 2.9 2.9 77.2 15.4 1.5
Children sing or dance just for fun (n = 136) 4.4 3.7 75.7 11.0 5.1
Children engage in cooperative play (n = 136) 4.4 2.9 64.0 19.9 8.8
Children play pretend or make believe (n = 136) 4.4 4.4 75.7 11.0 4.4
Children make new friends (n = 136) 3.7 2.9 69.9 14.7 8.8
Children engage in active play when outdoors (running jumping, skipping) (n = 136)
9.6 8.8 79.4 1.5 0.7
Children have conversations with each other (n = 136) 4.4 2.2 80.9 11.0 1.5
Children show strong attention during a group activity (n = 135) 4.4 2.2 57.8 26.7 8.9
Children show strong attention during an individual activity (n = 135)
4.4 3.0 69.6 15.6 7.4
Children show excitement about learning (n = 135) 4.4 3.7 78.5 10.4 3.0

30
Table C10b: ECE teachers’ observed changes in children’s behavior – Lead teachers in ABC, Head Start, and school-based programs
Much more often
Somewhat more often
About the same
amount of time
Somewhat less often
Much less often
% % % % % Children laugh and smile (n = 58) 5.2 5.2 69.0 19.0 1.7
Children sing or dance just for fun (n = 58) 5.2 8.6 62.1 15.5 8.6
Children engage in cooperative play (n = 58) 6.9 3.5 56.9 20.7 12.1
Children play pretend or make believe (n = 58) 8.6 5.2 63.8 15.5 6.9
Children make new friends (n = 58) 6.9 3.5 62.1 20.7 6.9
Children engage in active play when outdoors (running jumping, skipping) (n = 58)
12.1 8.6 77.6 1.7 0.0
Children have conversations with each other (n = 58) 6.9 3.5 74.1 13.8 1.7
Children show strong attention during a group activity (n = 58) 6.9 1.7 48.3 36.2 6.9
Children show strong attention during an individual activity (n = 58)
6.9 3.5 67.2 15.5 6.9
Children show excitement about learning (n = 58) 6.9 5.2 72.4 12.1 3.5

31
Table C10c: ECE teachers’ observed changes in children’s behavior – Lead teachers in private center-based programs
Much more often
Somewhat more often
About the same
amount of time
Somewhat less often
Much less often
% % % % % Children laugh and smile (n = 33) 0.0 0.0 81.8 18.2 0.0
Children sing or dance just for fun (n = 33) 3.0 0.0 84.9 9.1 3.0
Children engage in cooperative play (n = 33) 0.0 3.0 72.7 21.2 3.0
Children play pretend or make believe (n = 33) 0.0 6.1 81.8 12.1 0.0
Children make new friends (n = 33) 0.0 3.0 78.8 6.1 12.1
Children engage in active play when outdoors (running jumping, skipping) (n = 33)
6.1 12.1 81.8 0.0 0.0
Children have conversations with each other (n = 33) 0.0 0.0 87.9 9.1 3.0
Children show strong attention during a group activity (n = 33) 0.0 6.1 60.6 18.2 15.2
Children show strong attention during an individual activity (n = 33)
0.0 3.0 66.7 21.2 9.1
Children show excitement about learning (n = 33) 0.0 3.0 84.9 9.1 3.0
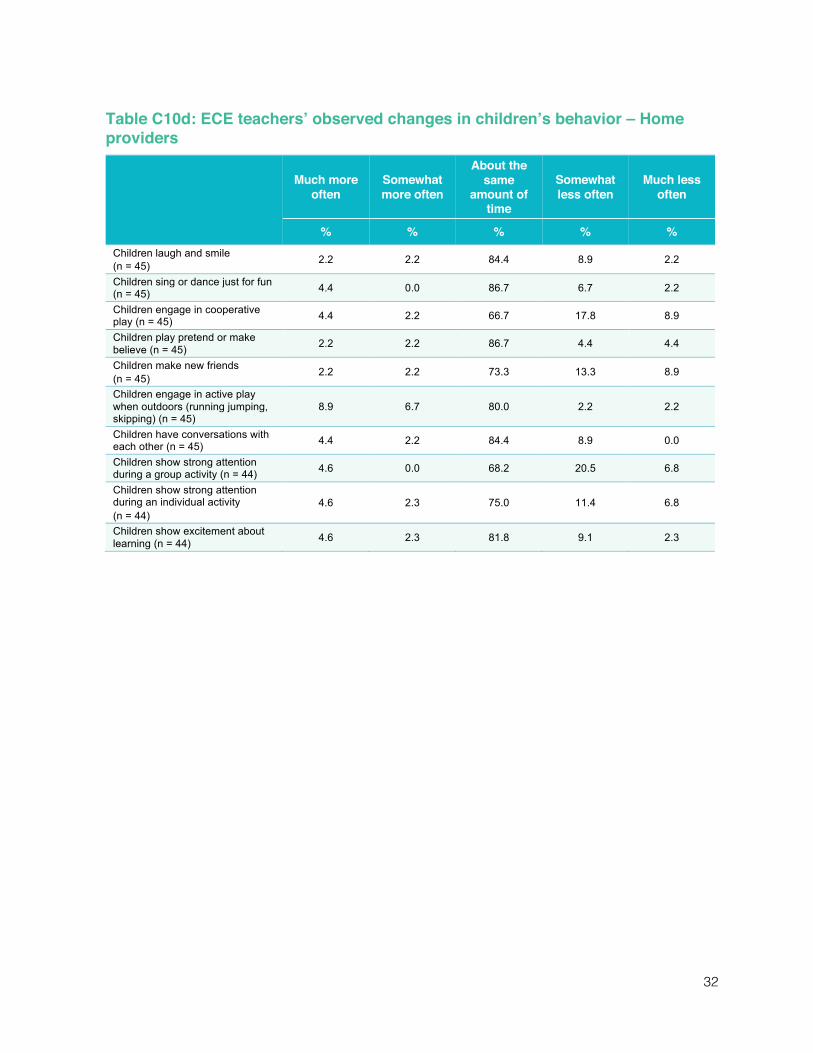
32
Table C10d: ECE teachers’ observed changes in children’s behavior – Home providers
Much more often
Somewhat more often
About the same
amount of time
Somewhat less often
Much less often
% % % % % Children laugh and smile (n = 45) 2.2 2.2 84.4 8.9 2.2
Children sing or dance just for fun (n = 45) 4.4 0.0 86.7 6.7 2.2
Children engage in cooperative play (n = 45) 4.4 2.2 66.7 17.8 8.9
Children play pretend or make believe (n = 45) 2.2 2.2 86.7 4.4 4.4
Children make new friends (n = 45) 2.2 2.2 73.3 13.3 8.9
Children engage in active play when outdoors (running jumping, skipping) (n = 45)
8.9 6.7 80.0 2.2 2.2
Children have conversations with each other (n = 45) 4.4 2.2 84.4 8.9 0.0
Children show strong attention during a group activity (n = 44) 4.6 0.0 68.2 20.5 6.8
Children show strong attention during an individual activity (n = 44)
4.6 2.3 75.0 11.4 6.8
Children show excitement about learning (n = 44) 4.6 2.3 81.8 9.1 2.3
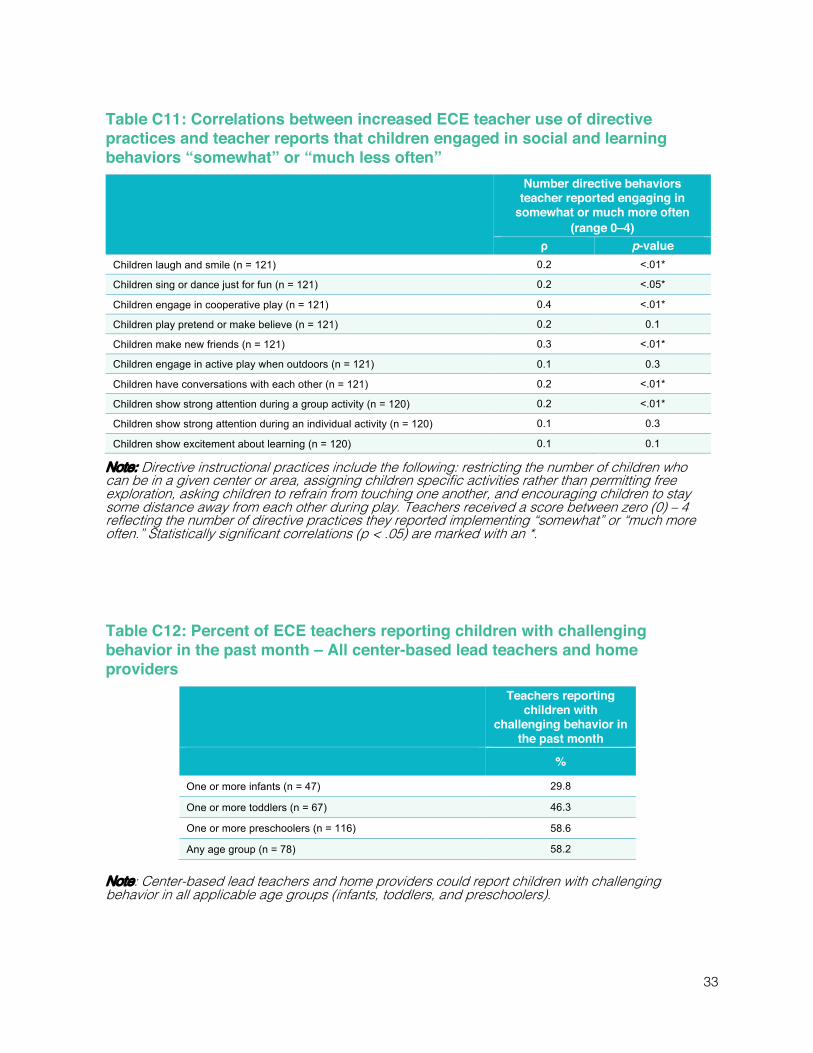
33
Table C12: Percent of ECE teachers reporting children with challenging behavior in the past month – All center-based lead teachers and home providers
Teachers reporting
children with challenging behavior in
the past month %
One or more infants (n = 47) 29.8
One or more toddlers (n = 67) 46.3
One or more preschoolers (n = 116) 58.6
Any age group (n = 78) 58.2
Note: Center-based lead teachers and home providers could report children with challenging behavior in all applicable age groups (infants, toddlers, and preschoolers).
Table C11: Correlations between increased ECE teacher use of directive practices and teacher reports that children engaged in social and learning behaviors “somewhat” or “much less often”
Number directive behaviors teacher reported engaging in
somewhat or much more often (range 0–4)
ρ p-value Children laugh and smile (n = 121) 0.2 <.01*
Children sing or dance just for fun (n = 121) 0.2 <.05*
Children engage in cooperative play (n = 121) 0.4 <.01*
Children play pretend or make believe (n = 121) 0.2 0.1
Children make new friends (n = 121) 0.3 <.01*
Children engage in active play when outdoors (n = 121) 0.1 0.3
Children have conversations with each other (n = 121) 0.2 <.01*
Children show strong attention during a group activity (n = 120) 0.2 <.01*
Children show strong attention during an individual activity (n = 120) 0.1 0.3
Children show excitement about learning (n = 120) 0.1 0.1
Note: Directive instructional practices include the following: restricting the number of children who can be in a given center or area, assigning children specific activities rather than permitting free exploration, asking children to refrain from touching one another, and encouraging children to stay some distance away from each other during play. Teachers received a score between zero (0) – 4 reflecting the number of directive practices they reported implementing “somewhat” or “much more often.” Statistically significant correlations (p < .05) are marked with an *.

34
Table C13b: Percent of ECE teachers reporting child behaviors that caused a “major disruption” in the past month – Lead teachers in ABC, Head Start, and school-based programs
Multiple times
each week About once a
week Less than
once a week Did not cause a significant disruption
% % % % A child is unable to comply with COVID-19-related safety regulations (n = 58) 53.5 6.9 6.9 32.8
A child threatens others safety and well-being (n = 58) 25.9 10.3 19.0 44.8
A child is angry towards others (n = 58) 27.6 13.8 17.2 41.4 A child has attention/activity problems (n = 58) 51.7 12.1 3.5 32.8
A child is frequently upset/withdrawn (n = 58) 19.0 22.4 15.5 43.1
A child refuses to eat or feed (n = 58) 8.6 12.1 13.8 65.5 A child frequently appears worried (n = 58) 5.2 6.9 29.3 58.6
Table C13a: Percent of ECE teachers reporting child behaviors that caused a “major disruption” in the past month – All center-based lead teachers and home providers
Multiple times
each week About once a
week Less than
once a week Did not cause a significant disruption
% % % % A child is unable to comply with COVID-19-related safety regulations (n = 134) 50.7 8.2 7.5 33.6
A child threatens others safety and well-being (n = 134) 20.9 14.2 18.7 46.3
A child is angry towards others (n = 134) 22.4 14.9 17.2 45.5
A child has attention/activity problems (n = 134) 46.3 13.0 8.2 32.1
A child is frequently upset/withdrawn (n = 134) 17.2 15.7 17.9 49.3
A child refuses to eat or feed (n = 134) 8.2 13.4 18.7 59.7
A child frequently appears worried (n = 134) 3.0 10.4 30.6 56.0

35
Table C13c: Percent of ECE teachers reporting child behaviors that caused a “major disruption” in the past month – Lead teachers in private center-based programs
Multiple times
each week About once a
week Less than
once a week Did not cause a significant disruption
% % % % A child is unable to comply with COVID-19-related safety regulations (n = 32) 50.0 9.4 9.4 31.3
A child threatens others safety and well-being (n = 32) 28.1 18.8 18.8 34.4
A child is angry towards others (n = 32) 28.1 15.6 15.6 40.6 A child has attention/activity problems (n = 32) 50.0 18.8 6.3 25.0
A child is frequently upset/withdrawn (n = 32) 6.3 21.9 21.9 50.0
A child refuses to eat or feed (n = 32) 0.0 18.8 28.1 53.1 A child frequently appears worried (n = 32) 3.1 15.6 28.1 53.1
Table C13d: Percent of ECE teachers reporting child behaviors that caused a “major disruption” in the past month – Home providers
Multiple times
each week About once a
week Less than
once a week Did not cause a significant disruption
% % % % A child is unable to comply with COVID-19-related safety regulations (n = 44) 47.7 9.1 6.8 36.4
A child threatens others safety and well-being (n = 44) 9.1 15.9 18.2 56.8
A child is angry towards others (n = 44) 11.4 15.9 18.2 54.6 A child has attention/activity problems (n = 44) 36.4 11.4 15.9 36.4
A child is frequently upset/withdrawn (n = 44) 22.7 2.3 18.2 56.8
A child refuses to eat or feed (n = 44) 13.6 11.4 18.2 56.8 A child frequently appears worried (n = 44) 0.0 11 34 55

36
Table C14a: ECE teachers reported contributors to children’s challenging behavior – All center-based lead teachers and home providers
Never Rarely Sometimes Very often Always
% % % % % Children experiencing grief/loss (n = 133) 24.8 37.6 25.6 9.8 2.3
Children's difficulty separating from family after being home (n = 132)
9.1 27.3 35.6 22.0 6.1
Increased restrictions on behavior (such as limitations on sharing materials, close-up play with peers prohibited) (n = 133)
15.0 21.1 33.1 26.3 4.5
Changes in classroom routines/rules (such as teachers wearing masks, parents not allowed in the building) (n = 132)
15.9 19.7 27.3 26.5 10.6
Family problems such as financial or parent mental health concerns (n = 132)
19.7 22.7 28.0 25.8 3.8
Table C14b: ECE teachers’ reported contributors to children’s challenging behavior – Lead teachers in ABC, Head Start, and school-based programs
Never Rarely Sometimes Very often Always
% % % % % Children experiencing grief/loss (n = 57) 19.3 40.4 22.8 15.8 1.8
Children's difficulty separating from family after being home (n = 56)
12.5 25.0 28.6 26.8 7.1
Increased restrictions on behavior (such as limitations on sharing materials, close-up play with peers prohibited) (n = 57)
10.5 19.3 29.8 35.1 5.3
Changes in classroom routines/rules (such as teachers wearing masks, parents not allowed in the building) (n = 56)
16.1 19.6 23.2 30.4 10.7
Family problems such as financial or parent mental health concerns (n = 56)
5.4 21.4 32.1 37.5 3.6

37
Table C14d: ECE teachers’ reported contributors to children’s challenging behavior – Home providers
Never Rarely Sometimes Very often Always
% % % % % Children experiencing grief/loss (n = 44) 29.6 38.6 25.0 4.6 2.3
Children's difficulty separating from family after being home (n = 44)
9.1 31.8 43.2 11.4 4.6
Increased restrictions on behavior (such as limitations on sharing materials, close-up play with peers prohibited) (n = 44)
13.6 22.7 34.1 27.3 2.3
Changes in classroom routines/rules (such as teachers wearing masks, parents not allowed in the building) (n = 44)
18.2 20.5 25.0 29.6 6.8
Family problems such as financial or parent mental health concerns (n = 44)
34.1 22.7 20.5 20.5 2.3
Table C14c: ECE teachers’ reported contributors to children’s challenging behavior – Lead teachers in private center-based programs
Never Rarely Sometimes Very often Always
% % % % % Children experiencing grief/loss (n = 32) 28.1 31.3 31.3 6.3 3.1
Children's difficulty separating from family after being home (n = 32)
3.1 25.0 37.5 28.1 6.3
Increased restrictions on behavior (such as limitations on sharing materials, close-up play with peers prohibited) (n = 32)
25.0 21.9 37.5 9.4 6.3
Changes in classroom routines/rules (such as teachers wearing masks, parents not allowed in the building) (n = 32)
12.5 18.8 37.5 15.6 15.6
Family problems such as financial or parent mental health concerns (n = 32)
25.0 25.0 31.2 12.5 6.3

38
Table C15b: ECE teachers’ ability to manage challenging behaviors – Lead teachers in ABC, Head Start, and school-based programs
Strongly
agree Agree Neither
agree nor disagree
Disagree Strongly disagree
% % % % % Children's challenging behavior interfered with my ability to support the children in my classroom (n = 58)
15.5 19.0 25.9 15.5 24.1
I was generally able to manage children's challenging behavior (n = 58)
25.9 58.6 6.9 8.6 25.9
Children's challenging behavior was a major frustration in my work (n = 58)
10.3 15.5 22.4 27.6 24.1
I could not get help addressing children's challenging behavior (n = 58)
1.7 13.8 15.5 36.2 32.8
Table C15a: ECE teachers’ ability to manage challenging behaviors – All center-based lead teachers and home providers
Strongly
agree Agree Neither
agree nor disagree
Disagree Strongly disagree
% % % % % Children's challenging behavior interfered with my ability to support the children in my classroom (n = 134)
11.9 20.9 22.4 20.9 23.9
I was generally able to manage children's challenging behavior (n = 134)
24.6 58.2 10.4 6.7 0.0
Children's challenging behavior was a major frustration in my work (n = 134)
8.2 19.4 28.4 23.9 20.1
I could not get help addressing children's challenging behavior (n = 134)
2.2 9.7 25.4 32.1 30.6

39
Table C15d: ECE teachers’ ability to manage challenging behaviors – Home providers
Strongly
agree Agree Neither
agree nor disagree
Disagree Strongly disagree
% % % % % Children's challenging behavior interfered with my ability to support the children in my classroom (n = 44)
9.1 22.7 18.2 22.7 27.3
I was generally able to manage children's challenging behavior (n = 44)
27.3 63.6 4.6 4.6 27.3
Children's challenging behavior was a major frustration in my work (n = 44)
6.8 22.7 29.6 22.7 18.2
I could not get help addressing children's challenging behavior (n = 44)
4.6 6.8 34.1 27.3 27.3
Table C15c: ECE teachers’ ability to manage challenging behaviors – Lead teachers in private center-based programs
Strongly
agree Agree Neither
agree nor disagree
Disagree Strongly disagree
% % % % % Children's challenging behavior interfered with my ability to support the children in my classroom (n = 32)
9.4 21.9 21.9 28.1 18.8
I was generally able to manage children's challenging behavior (n = 32)
18.8 50.0 25.0 6.3 18.8
Children's challenging behavior was a major frustration in my work (n = 32)
6.3 21.9 37.5 18.8 15.6
I could not get help addressing children's challenging behavior (n = 32)
0.0 6.3 31.3 31.3 31.3
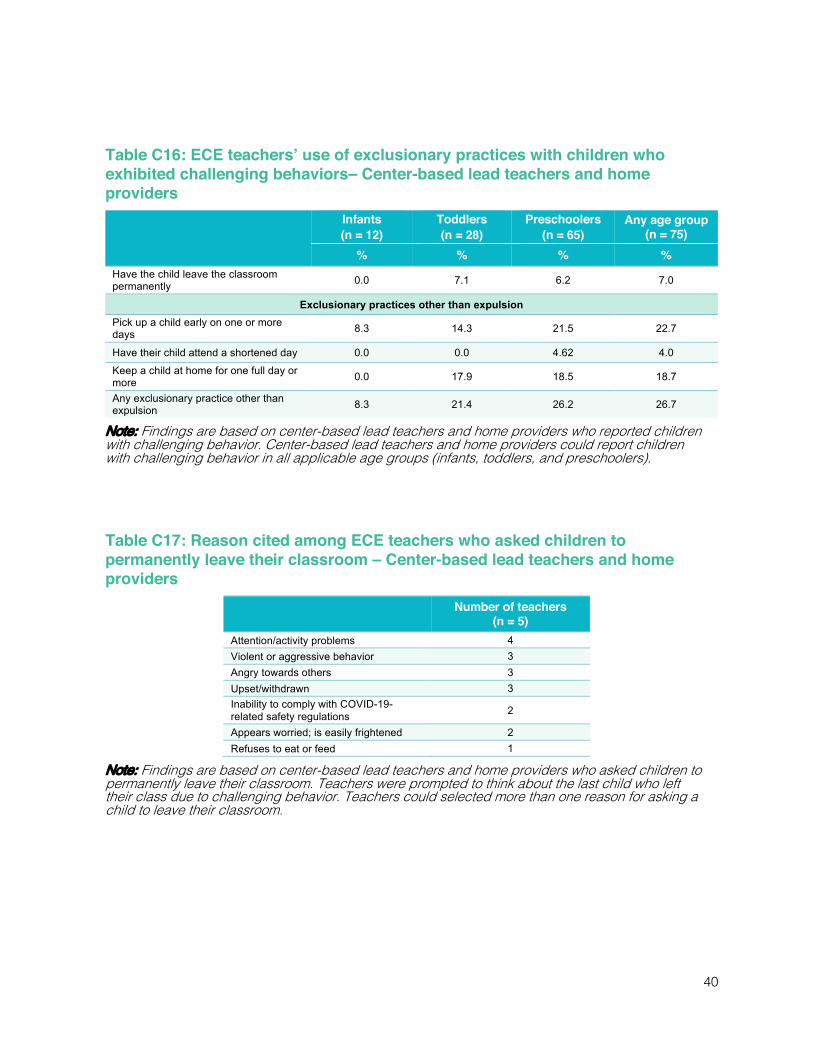
40
Table C16: ECE teachers’ use of exclusionary practices with children who exhibited challenging behaviors– Center-based lead teachers and home providers
Infants (n = 12)
Toddlers (n = 28)
Preschoolers (n = 65)
Any age group (n = 75)
% % % % Have the child leave the classroom permanently 0.0 7.1 6.2 7.0
Exclusionary practices other than expulsion Pick up a child early on one or more days 8.3 14.3 21.5 22.7
Have their child attend a shortened day 0.0 0.0 4.62 4.0 Keep a child at home for one full day or more 0.0 17.9 18.5 18.7
Any exclusionary practice other than expulsion 8.3 21.4 26.2 26.7
Note: Findings are based on center-based lead teachers and home providers who reported children with challenging behavior. Center-based lead teachers and home providers could report children with challenging behavior in all applicable age groups (infants, toddlers, and preschoolers).
Table C17: Reason cited among ECE teachers who asked children to permanently leave their classroom – Center-based lead teachers and home providers
Number of teachers
(n = 5) Attention/activity problems 4 Violent or aggressive behavior 3 Angry towards others 3 Upset/withdrawn 3 Inability to comply with COVID-19-related safety regulations 2
Appears worried; is easily frightened 2 Refuses to eat or feed 1
Note: Findings are based on center-based lead teachers and home providers who asked children to permanently leave their classroom. Teachers were prompted to think about the last child who left their class due to challenging behavior. Teachers could selected more than one reason for asking a child to leave their classroom.

41
Table C18: Strategies utilized by ECE teachers who asked a child to permanently leave their classroom – Center-based lead teachers and home providers
Number of teachers
(n = 5) Called child’s parent(s)/guardian(s) to talk with them 4
Tried to use practices learned from earlier training/coaching/consultation 4
Asked for assistance from program director 2
Asked for assistance from other early childhood educators 1
Asked child’s parent(s)/guardian(s) to come in to talk 1
Requested assistance from BehaviorHelp 1
Requested an evaluation by Early Intervention or Preschool Special Education
0
Asked for help from a trainer or technical assistance provider 0
Note: Findings are based on center-based lead teachers and home providers who asked children to permanently leave their classroom. Teachers were prompted to think about the last child who left their class due to challenging behavior. Teachers could select all strategies they used to address the behavioral challenges.

SRI Education, a division of SRI International, is tackling the most complex issues in education to identify trends, understand outcomes, and guide policy and practice. We work with federal and state agencies, school districts, foundations, nonprofit organizations, and businesses to provide research-based solutions to challenges posed by rapid social, technological and economic change. SRI International is a nonprofit research institute whose innovations have created new industries, extraordinary marketplace value, and lasting benefits to society.
Silicon Valley(SRI International Headquarters)333 Ravenswood AvenueMenlo Park, CA [email protected]
Washington, D.C.1100 Wilson Boulevard, Suite 2800Arlington, VA 22209+1.703.524.2053
www.sri.com/education
© 2021 SRI International. All rights reserved. SRI International® is a registered trademark and SRI Education™ is a trademark of SRI International. All other trademarks are the property of their respective owners.
STAY CONNECTED