early experiences with ktau on the ibm blue gene / l a. nataraj, a. malony, a. morris, s. shende...
Post on 21-Dec-2015
217 views
TRANSCRIPT
Early Experiences with KTAU on the IBM Blue Gene / L
A. Nataraj, A. Malony, A. Morris, S. Shende{anataraj,malony,sameer,amorris}@cs.uoregon.edu
Performance Research LabUniversity of Oregon
EuroPar 2006 Early Experiences with KTAU on the IBM BG/L 2
Outline
Motivations Objectives ZeptoOS project KTAU Architecture KTAU on Blue Gene / L Experiments and experience KTAU improvements Future work Acknowledgements
EuroPar 2006 Early Experiences with KTAU on the IBM BG/L 3
Motivation
Application performance is a consequence of User-level execution OS-level operation
Good tools exist for observing user-level performance User-level events Communication events Execution time measures Hardware performance
Fewer tools exist to observe OS-level aspects Ideally would like to do both simultaneously
OS-level influences on application performance
EuroPar 2006 Early Experiences with KTAU on the IBM BG/L 4
Scale and Performance Sensitivity
HPC systems continue to scale to larger processor counts Application performance more performance sensitive OS factors can lead to performance bottlenecks
[Petrini’03, Jones’03, …] System/application performance effects are complex Isolating system-level factors is non-trivial
Require comprehensive performance understanding Observation of all performance factors Relative contributions and interrelationship Can we correlate OS and application performance?
EuroPar 2006 Early Experiences with KTAU on the IBM BG/L 5
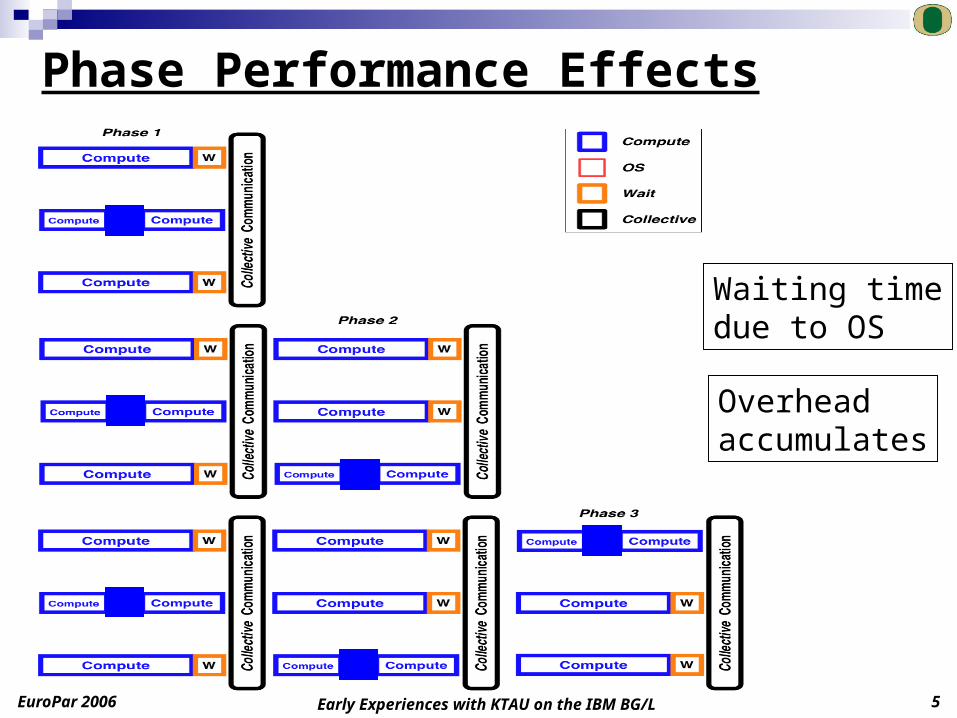
Phase Performance Effects
Waiting timedue to OS
Overheadaccumulates
EuroPar 2006 Early Experiences with KTAU on the IBM BG/L 6
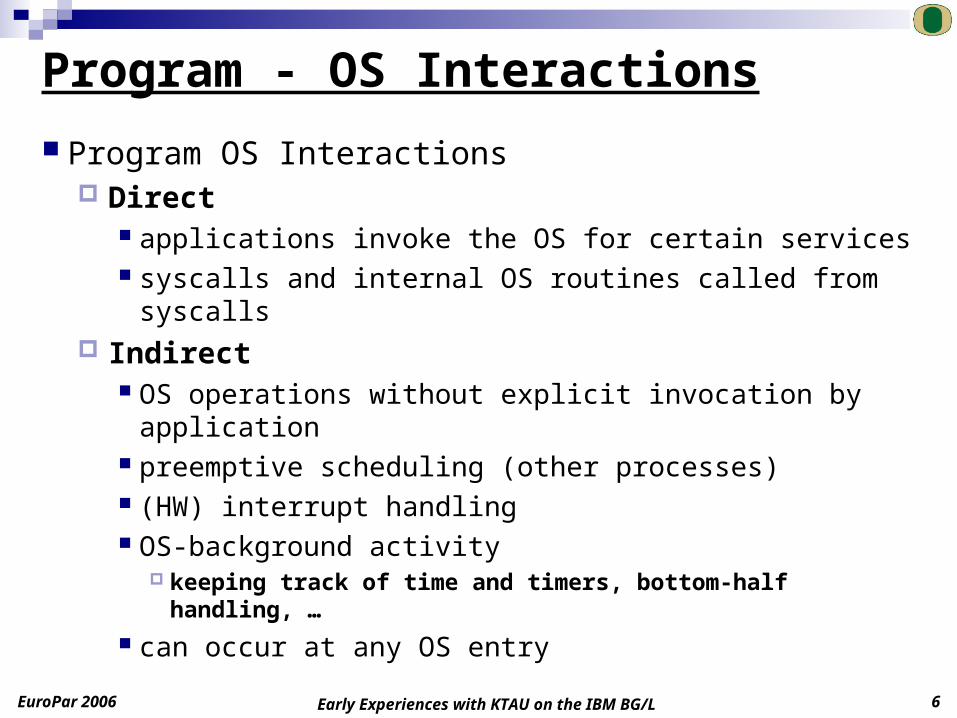
Program - OS Interactions
Program OS Interactions Direct
applications invoke the OS for certain services syscalls and internal OS routines called from syscalls
Indirect OS operations without explicit invocation by application preemptive scheduling (other processes) (HW) interrupt handling OS-background activity
keeping track of time and timers, bottom-half handling, …
can occur at any OS entry
EuroPar 2006 Early Experiences with KTAU on the IBM BG/L 7
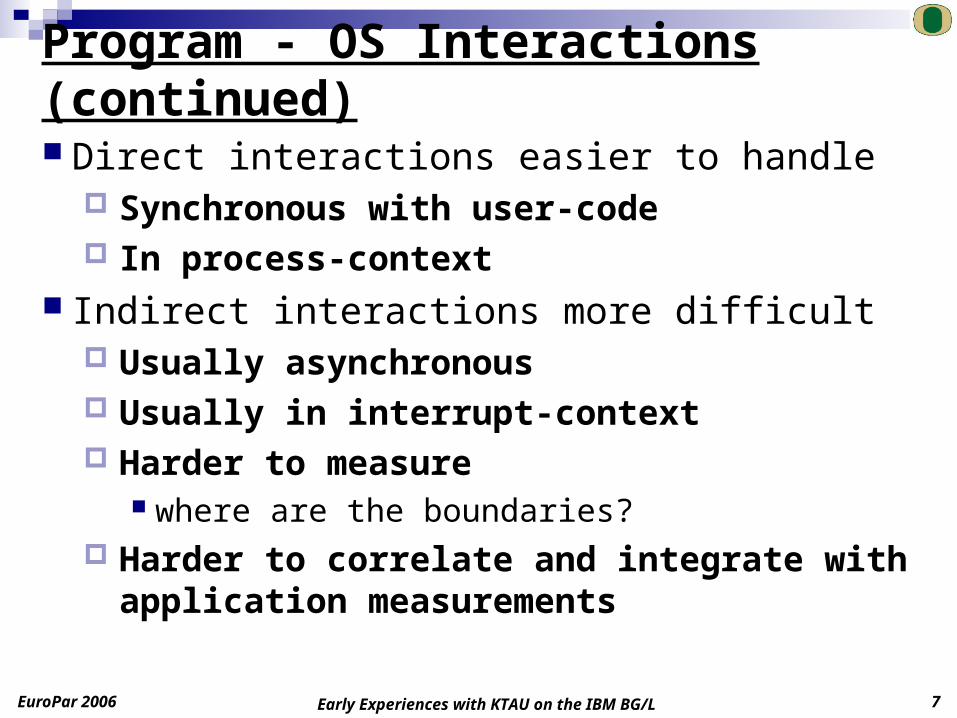
Program - OS Interactions (continued)
Direct interactions easier to handle Synchronous with user-code In process-context
Indirect interactions more difficult Usually asynchronous Usually in interrupt-context Harder to measure
where are the boundaries? Harder to correlate and integrate with application
measurements
EuroPar 2006 Early Experiences with KTAU on the IBM BG/L 8
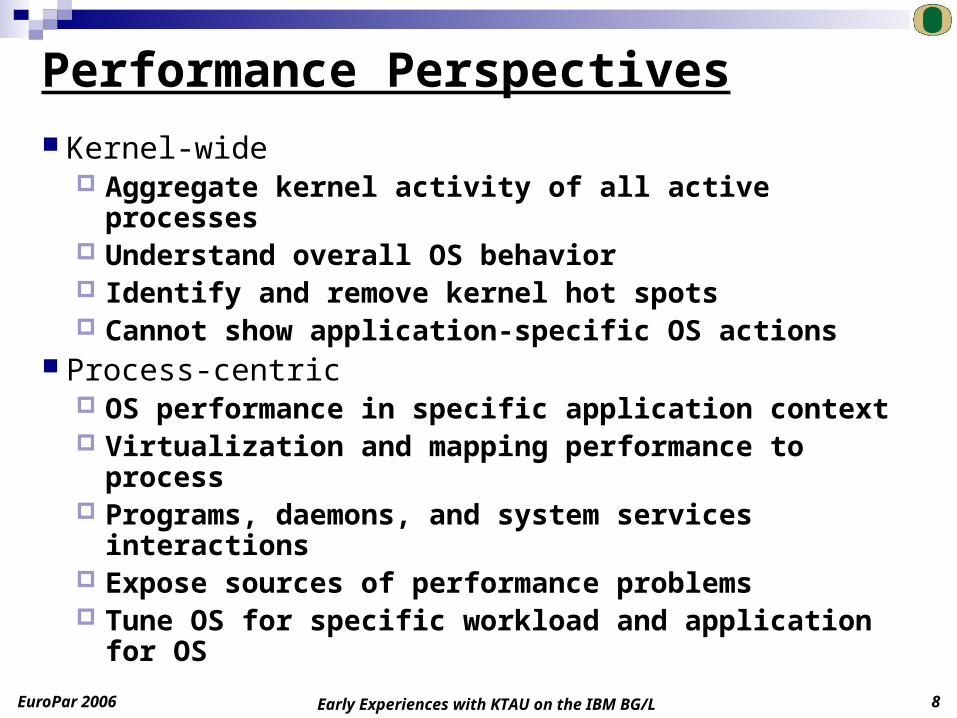
Performance Perspectives
Kernel-wide Aggregate kernel activity of all active processes Understand overall OS behavior Identify and remove kernel hot spots Cannot show application-specific OS actions
Process-centric OS performance in specific application context Virtualization and mapping performance to process Programs, daemons, and system services interactions Expose sources of performance problems Tune OS for specific workload and application for OS
EuroPar 2006 Early Experiences with KTAU on the IBM BG/L 9
Existing Approaches
User-space only measurement tools Many tools only work at user-level Cannot observe system-level performance influences
Kernel-level only measurement tools Most only provide the kernel-wide perspective
lack proper mapping/virtualization Some provide process-centric views
cannot integrate OS and user-level measurements
EuroPar 2006 Early Experiences with KTAU on the IBM BG/L 10
Existing Approaches (continued)
Combined or integrated user/kernel measurement tools A few tools allow fine-grained measurement Can correlate kernel and user-level performance Typically focus only on direct OS interactions Indirect interactions not normally merged Do not explicitly recognize parallel workloads
MPI ranks, OpenMP threads, …
Need an integrated approach to parallel performance observation and analyses that support both perspectives
EuroPar 2006 Early Experiences with KTAU on the IBM BG/L 11
High-Level Objectives
Support low-overhead OS performance measurement at multiple levels of function and detail
Provide both kernel-wide and process-centric perspectives of OS performance
Merge user-level and kernel-level performance information across all program-OS interactions
Provide online information and the ability to function without a daemon where possible
Support both profiling and tracing for kernel-wide and process-centric views in parallel systems
Leverage existing parallel performance analysis tools Support for observing, collecting and analyzing parallel data
EuroPar 2006 Early Experiences with KTAU on the IBM BG/L 12
ZeptoOS
DOE OS/RTS for Extreme Scale Scientific Computation Effective OS/Runtime for petascale systems Funded ZeptoOS project
Argonne National Lab and University of Oregon
What are the fundamental limits and advanced designs required for petascale Operating System Suites? Behaviour at large scales Management and optimization of OS suites Collective operations Fault tolerance OS performance analysis
EuroPar 2006 Early Experiences with KTAU on the IBM BG/L 13
ZeptoOS and TAU/KTAU
Lots of fine-grained OS measurement is required for each component of the ZeptoOS work
How and why do the various OS source and configuration changes affect parallel applications?
How do we correlate performance data between OS components Parallel application and OS
Solution: TAU/KTAU An integrated methodology and framework to
measure performance of applications and OS kernel
EuroPar 2006 Early Experiences with KTAU on the IBM BG/L 14
ZeptoOS Strategy
“Small Linux on big computers” IBM BG/L and other systems (e.g., Cray XT3)
Argonne Modified Linux on BG/L I/O nodes (ION) Modified Linux for BG/L compute nodes (TBD) Specialized I/O daemon on I/O node (ZOID) (TBD)
Oregon KTAU
integration of TAU infrastructure in Linux Kernel integration with ZeptoOS and installation on BG/L ION port to other 32-bit and 64-bit Linux platforms
EuroPar 2006 Early Experiences with KTAU on the IBM BG/L 15
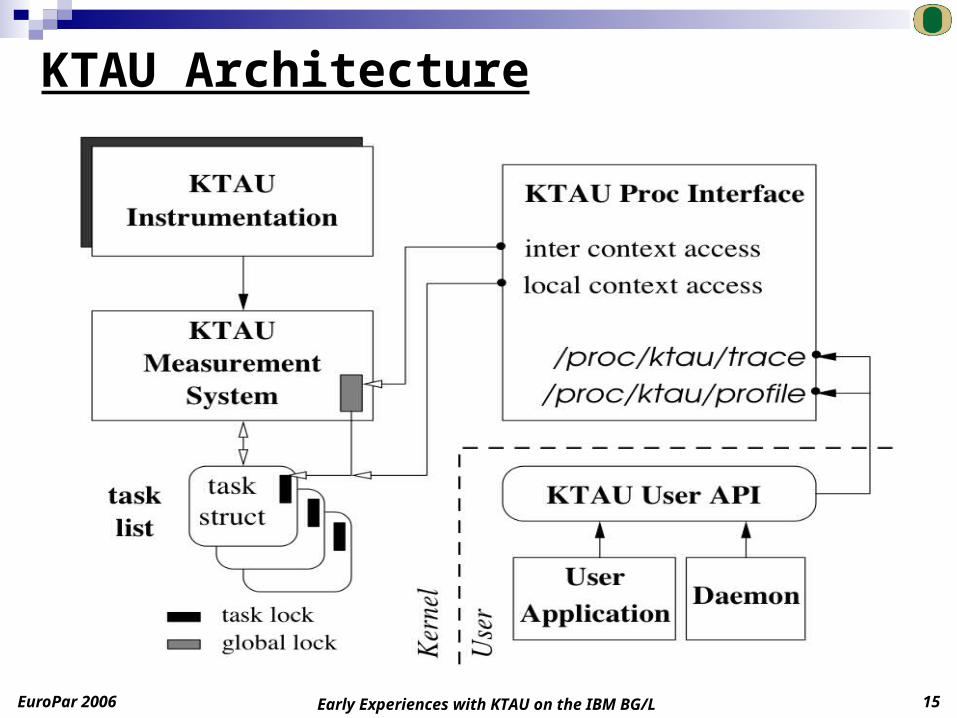
KTAU Architecture
EuroPar 2006 Early Experiences with KTAU on the IBM BG/L 16
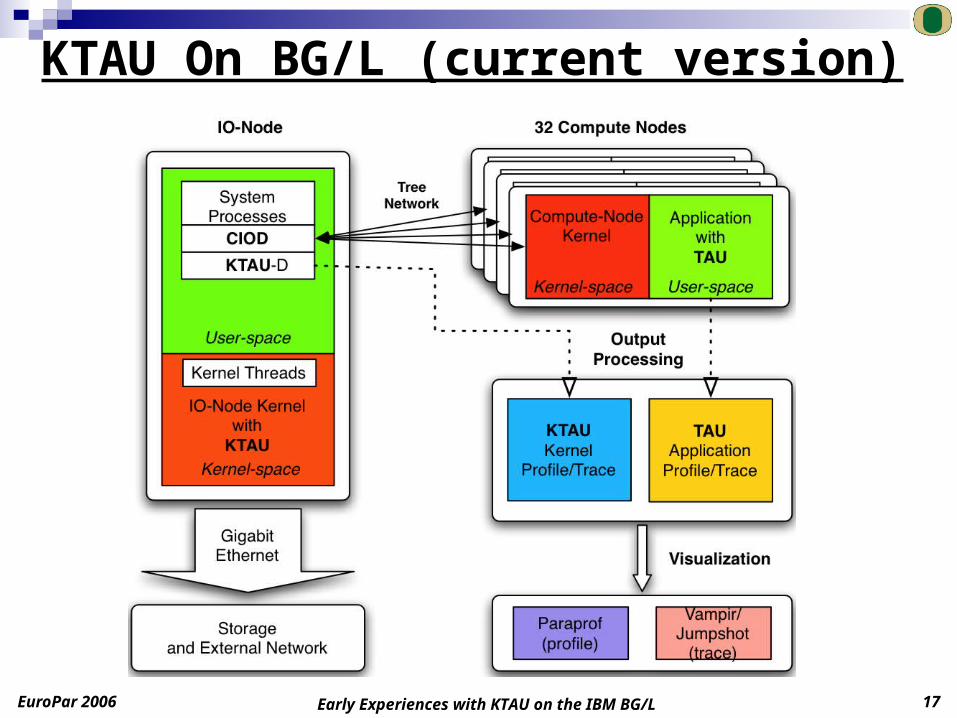
KTAU On BG/L’s ZeptoOS
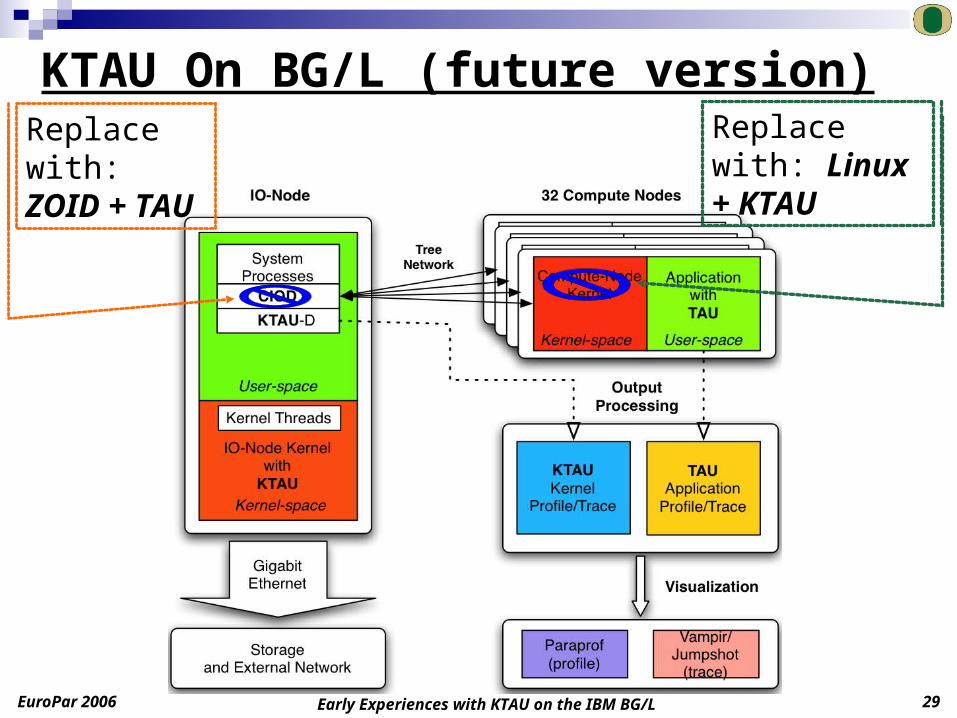
I/O Node Open source modified Linux Kernel (2.4, 2.6) Control I/O Daemon (CIOD) handles I/O syscalls
from compute nodes in process set
Compute Node IBM proprietary (closed-source) light-weight kernel No scheduling or virtual memory support Forwards I/O syscalls to CIOD on I/O node
KTAU on I/O Node Integrated into ZeptoOS configuration and build system Require KTAU-D (daemon) (CIOD is closed-source) KTAU-D periodically monitors KTAU measurements
system-wide or individual process
EuroPar 2006 Early Experiences with KTAU on the IBM BG/L 17
KTAU On BG/L (current version)
EuroPar 2006 Early Experiences with KTAU on the IBM BG/L 18
Early Experiences on BG/L
Validate and verify KTAU system Show kernel-wide and process-specific perspectives Run benchmark experiments
Argonne iotest benchmark MPI-based benchmark (open/write/read/close) aggregate bandwidth numbers varying block-sizes, number of nodes, and iterations observe functional and performance behavior
Apply KTAU to ZeptoOS problems Accurate identification of “noise” sources
Argonne Selfish benchmark identify “detours” (noise events) in user-space
EuroPar 2006 Early Experiences with KTAU on the IBM BG/L 19
Experiment Setup (Parameters)
KTAU: Enable all instrumentation points Number of kernel trace entries per proces = 10K
KTAU-D: System-wide tracing Accessing trace every 1 second and dump trace output
to a file in user’s home directory through NFS IOTEST:
Running with default parameters (blocksize = 16MB)
EuroPar 2006 Early Experiences with KTAU on the IBM BG/L 20
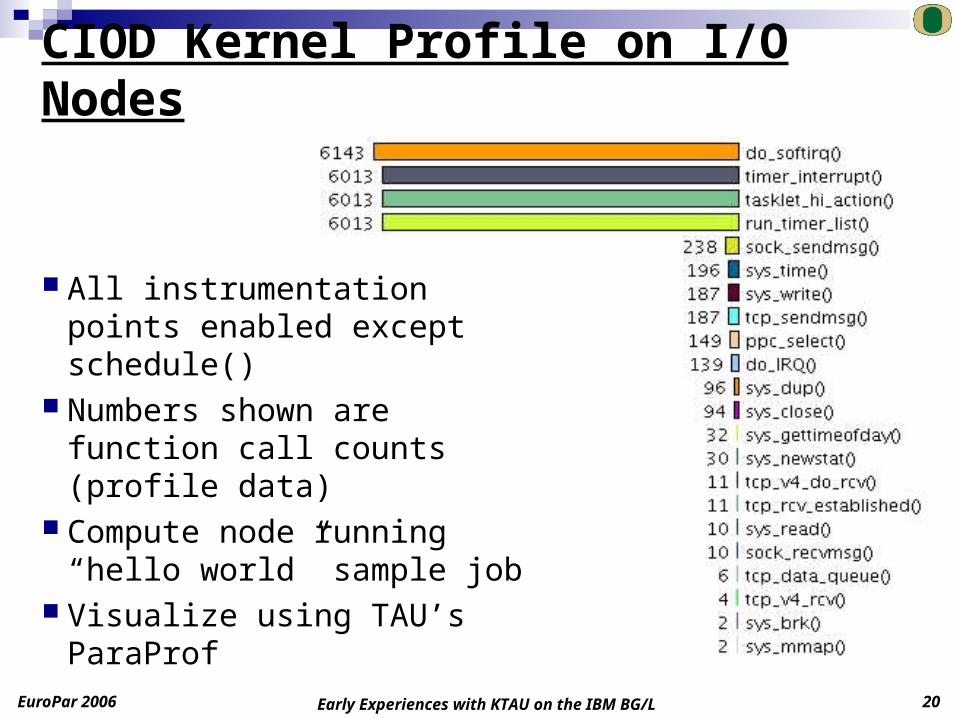
CIOD Kernel Profile on I/O Nodes
All instrumentation points enabled except schedule()
Numbers shown are function call counts (profile data)
Compute node running “hello world” sample job
Visualize using TAU’s ParaProf
EuroPar 2006 Early Experiences with KTAU on the IBM BG/L 21
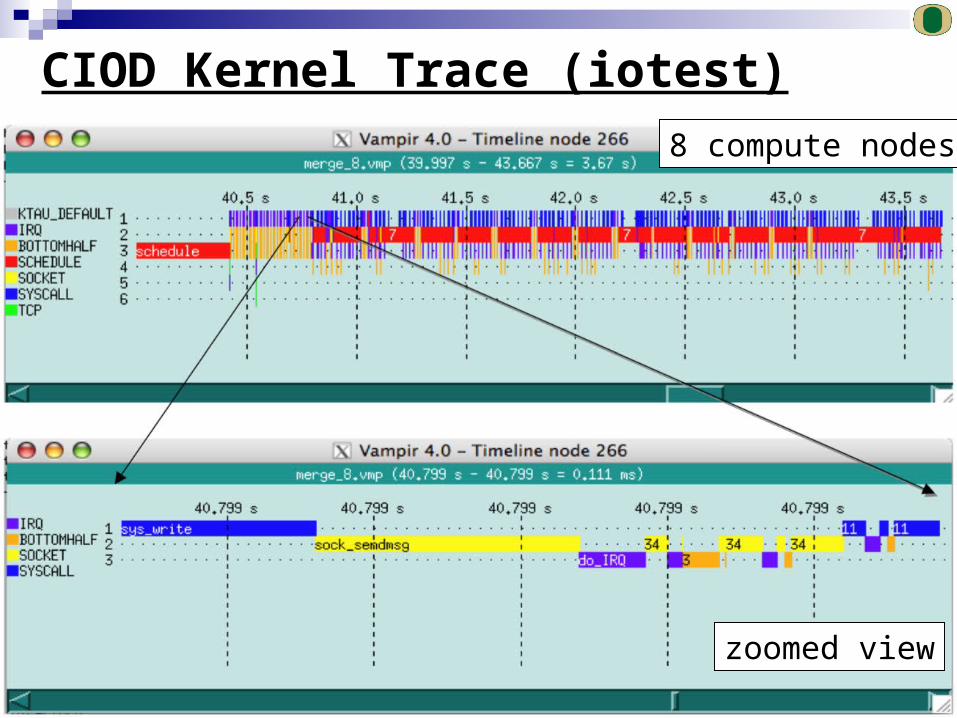
CIOD Kernel Trace (iotest)
8 compute nodes
zoomed view
EuroPar 2006 Early Experiences with KTAU on the IBM BG/L 22
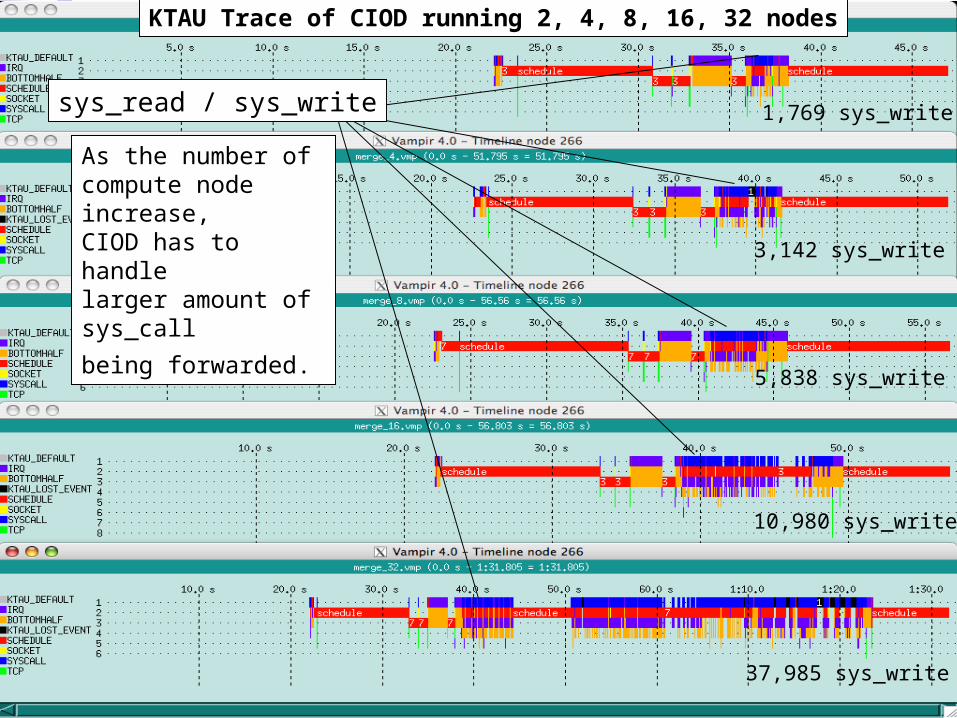
sys_read / sys_write
KTAU Trace of CIOD running 2, 4, 8, 16, 32 nodes
As the number of compute node increase, CIOD has to handle larger amount of sys_call
being forwarded.
1,769 sys_write
3,142 sys_write
5,838 sys_write
10,980 sys_write
37,985 sys_write
EuroPar 2006 Early Experiences with KTAU on the IBM BG/L 23
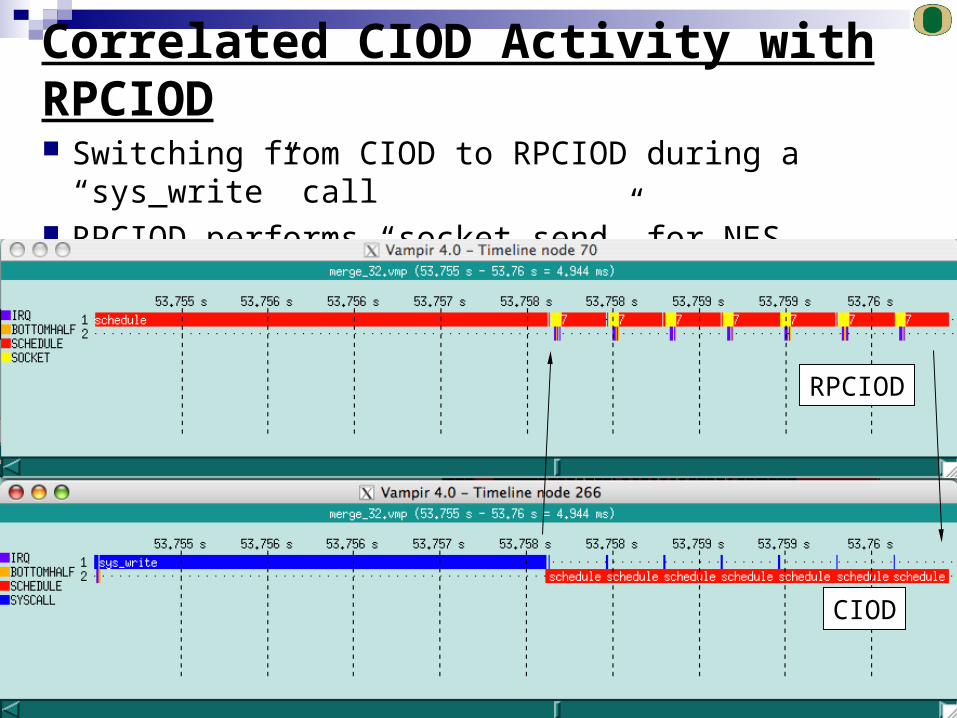
Correlated CIOD Activity with RPCIOD
Switching from CIOD to RPCIOD during a “sys_write” call RPCIOD performs “socket_send” for NFS read/write and IRQ
RPCIOD
CIOD
EuroPar 2006 Early Experiences with KTAU on the IBM BG/L 24
Recent Work on ZeptoOS Project
Accurate Identification of “noise” sources Modified Linux on BG/L should be efficient Effect of OS “noise” on synchronization / collectives What OS aspects induce what types of interference
code paths configurations devices attached
Requires user-level and OS measurement If can identify noise sources, then can remove or
alleviate interference
EuroPar 2006 Early Experiences with KTAU on the IBM BG/L 25
Approach
ANL Selfish benchmark to identify “detours” Noise events in user-space Shows durations and frequencies of events Does NOT show cause or source Runs a tight loop with an expected (ideal) duration
logs times and duration of detours
Use KTAU OS-tracing to record OS activity Correlate time of occurrence
uses same time source as Selfish benchmark Infer type of OS-activity (if any) causing the “detour”
EuroPar 2006 Early Experiences with KTAU on the IBM BG/L 26
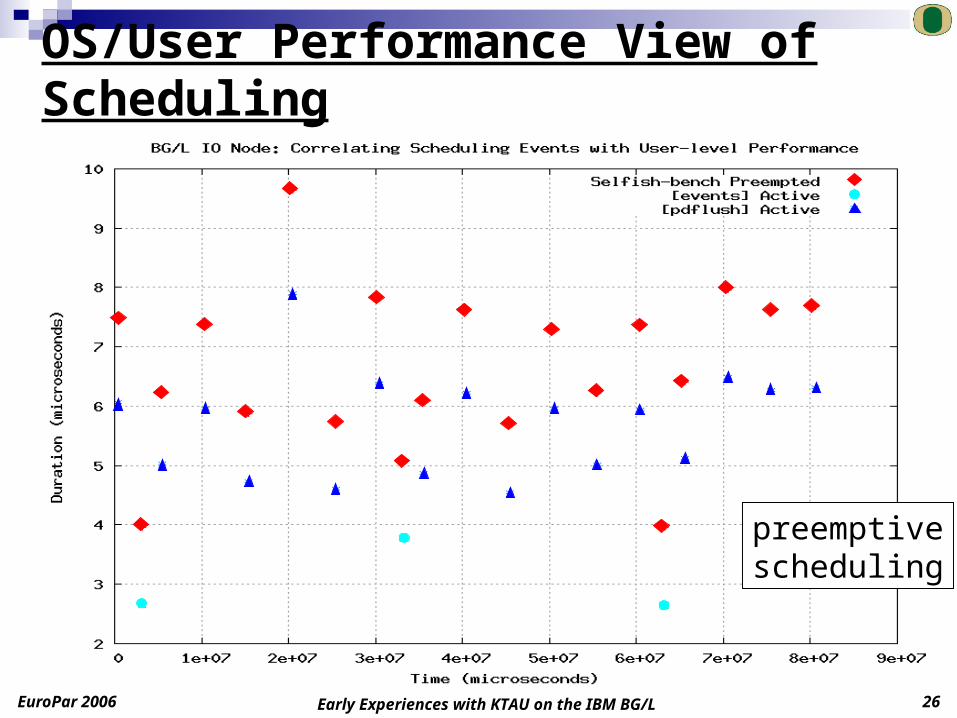
OS/User Performance View of Scheduling
preemptivescheduling
EuroPar 2006 Early Experiences with KTAU on the IBM BG/L 27
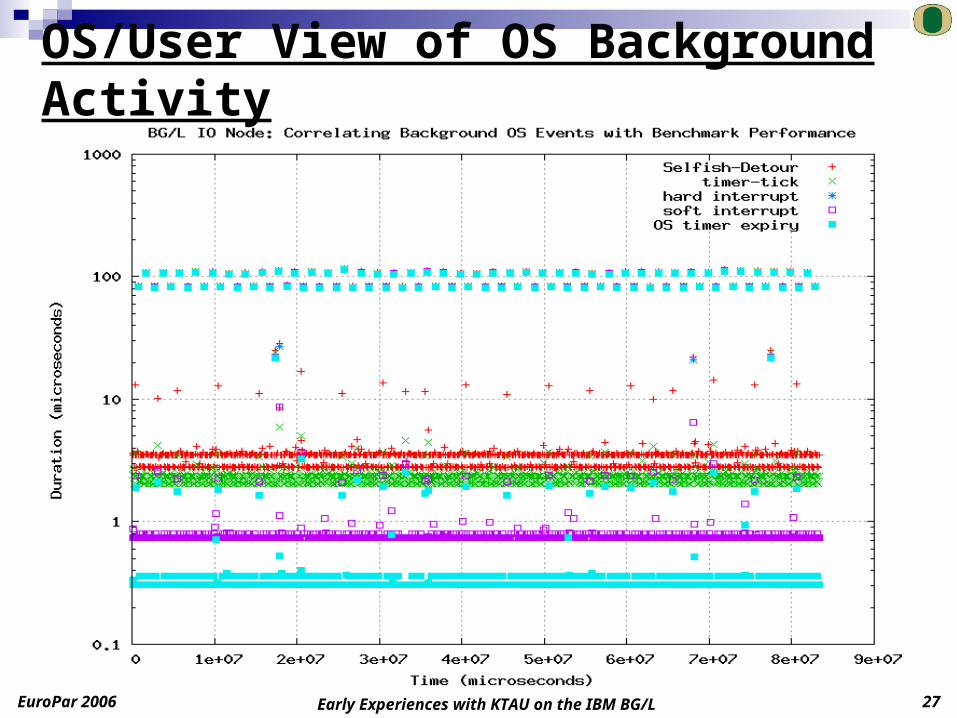
OS/User View of OS Background Activity
EuroPar 2006 Early Experiences with KTAU on the IBM BG/L 28
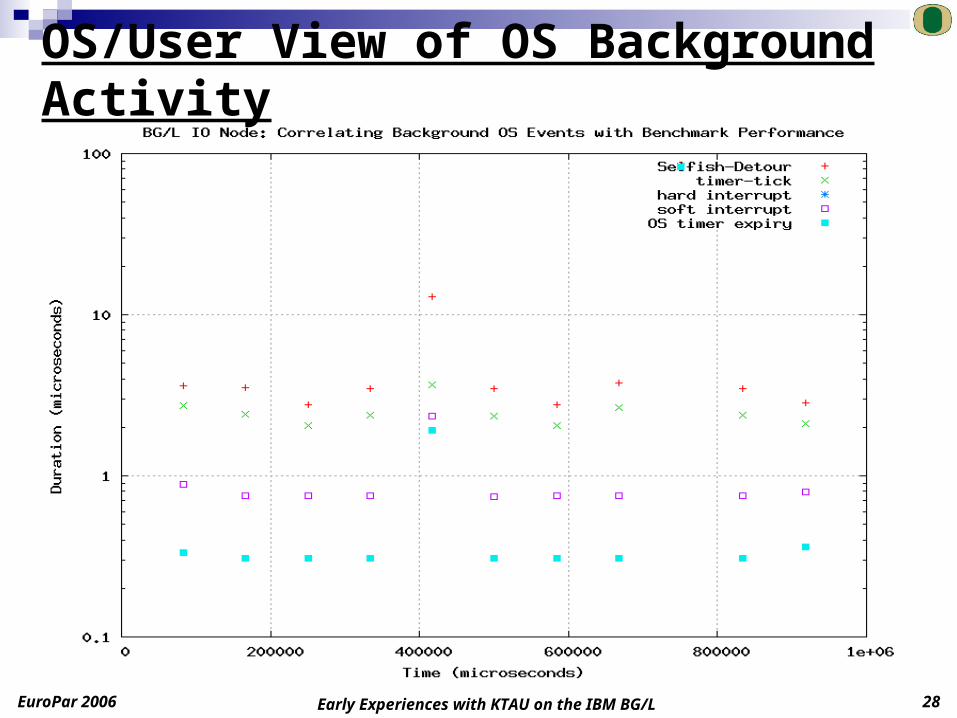
OS/User View of OS Background Activity
EuroPar 2006 Early Experiences with KTAU on the IBM BG/L 29
Replace with: ZOID + TAU
Replace with: Linux + KTAU
KTAU On BG/L (future version)

EuroPar 2006 Early Experiences with KTAU on the IBM BG/L 30
Future Work
Dynamic measurement control Improve performance data sources Improve integration with TAU’s user-space capabilities
Better correlation of user and kernel performance Full callpaths and phase-based profiling Merged user/kernel traces (already available)
Integration of TAU and KTAU with Supermon Porting efforts to IA-64, PPC-64, and AMD Opteron ZeptoOS characterization efforts
BGL I/O node Dynamically adaptive kernels
EuroPar 2006 Early Experiences with KTAU on the IBM BG/L 31
Acknowledgements
Department of Energy’s Office of Science National Science Foundation University of Oregon (UO) Core Team
Aroon Nataraj, PhD Student Prof. Allen D Malony Dr. Sameer Shende, Senior Scientist Alan Morris, Senior Software Engineer Suravee Suthikulpanit , MS Student (Graduated)
Argonne National Lab (ANL) Contributors Pete Beckman Kamil Iskra Kazutomo Yoshii