earning presentation for six months ended september 30, 2021
TRANSCRIPT

Earning Presentation
for Six months ended September 30, 2021
November 11, 2021
This presentation contains forward looking statements that are based on current
expectations and assumptions.
Actual results could differ materially due to risks and uncertainties, which includes, but not
limited to, currency fluctuation and competitive activity.
2
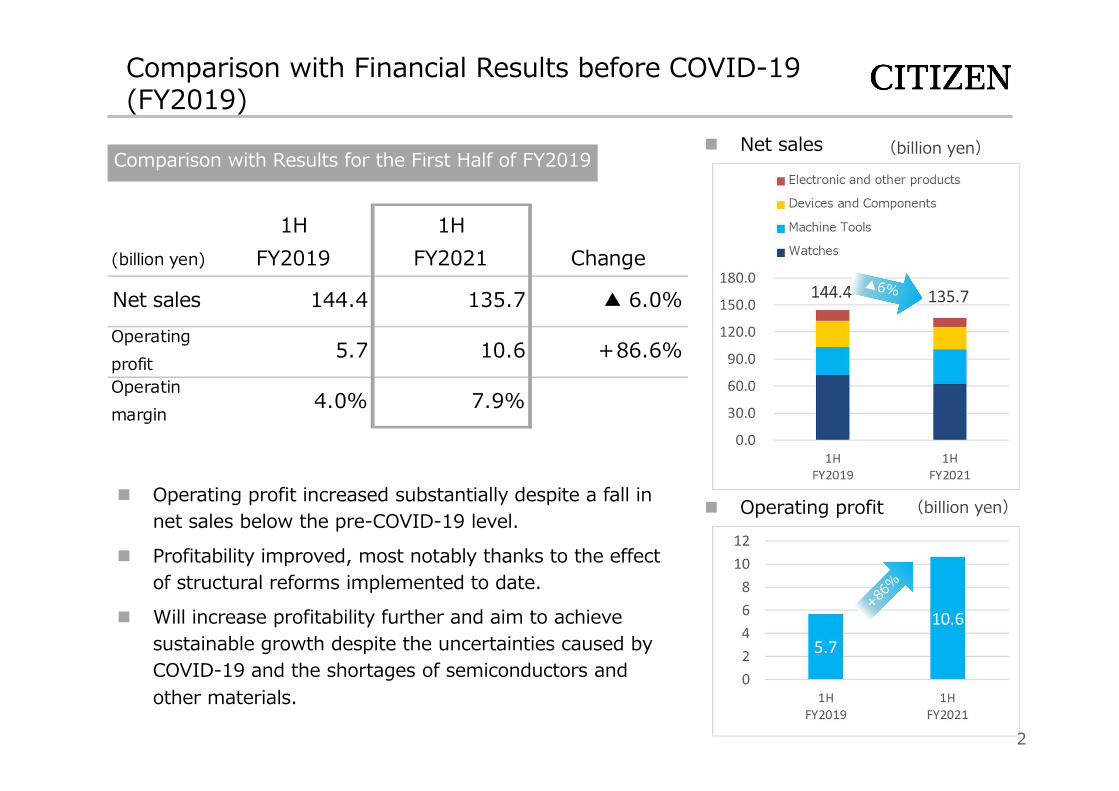
Comparison with Financial Results before COVID-19 (FY2019)
Net sales
Operating profit
Comparison with Results for the First Half of FY2019 (billion yen)
(billion yen)
(billion yen)
1HFY2019
1HFY2021 Change
Net sales 144.4 135.7 ▲ 6.0%Operatingprofit
5.7 10.6 +86.6%Operatinmargin
4.0% 7.9%
Operating profit increased substantially despite a fall in net sales below the pre-COVID-19 level.
Profitability improved, most notably thanks to the effect of structural reforms implemented to date.
Will increase profitability further and aim to achieve sustainable growth despite the uncertainties caused by COVID-19 and the shortages of semiconductors and other materials.

Initiatives in Watches Segment
North American market
Domestic market
3
* Local currency-denominated sales(CITIZEN and Bulova brands)
North American direct sales website (official Citizen Watch America website)
Sales in the North American market
Mechanical model of 「The CITIZEN」 Caliber 0200 「CITIZEN Series 8」 Mechanical Watch Brand
In the North American market, sales both on the internet and at physical stores continued to recover.
Enhancing the direct sales website among online shopping channels in particular contributed to financial recovery.
Sales during the fiscal year under review have been at a level exceeding the pre-Covid-19 level (FY2019).
Released a mechanical model of 「The CITIZEN」 equipped with Caliber 0200 and the mechanical watch brand, 「CITIZEN Series 8」, in August.
Released products priced higher than the median price range of 「The CITIZEN」 brand in the past to create new demand.
Will further strengthen mechanical watches in the medium to long term.

Received a record level of orders recently. The Company also decided to increase the production capacity of the Thai factory to ensure a strong business base for further growth.
Raised the monthly production to 350 units, up 50% from the past capacity of the Thai factory.
Enhanced both manufacturing and sales by building a new showroom.
Initiatives in Machine Tools Segment
Entire view of the Thai factory in the Machine Tools segment (the front side on the right is a showroom building and the back side on the left is an extension)
New showroom building scheduled for construction
Overview of factory extensionExtended floor area: 4,275 sq. meters, total floor area: 4,475 sq. meters (total floor area after extension: 27,488 sq. meters),construction starts: December 2021, completion: November 2022
Showroom buildingBuilding area: 1,000 sq. meters, total floor area: 1,848 sq. meters, construction starts: May 2021, completion: December 2021
Increase in Production Capacity of Thai Factory
4

Financial Results for 2Q of FY 2021
6
Key Notes
FY2021 Forecast
Financial results for 1H of FY2021
The mainstay Watches segment and Machine Tools segment have remained strong from the first quarter.
The recovery in markets and measures to raise profit contributed to a significant increase in operating profit.
Full-year forecasts were revised upward based on the results for the first half of FY2021.
Net sales: 273.0 billion yen (up 5.0 billion yen from previous forecast)Operating profit: 17.2 billion yen (up 3.4 billion yen from previous forecast)
7
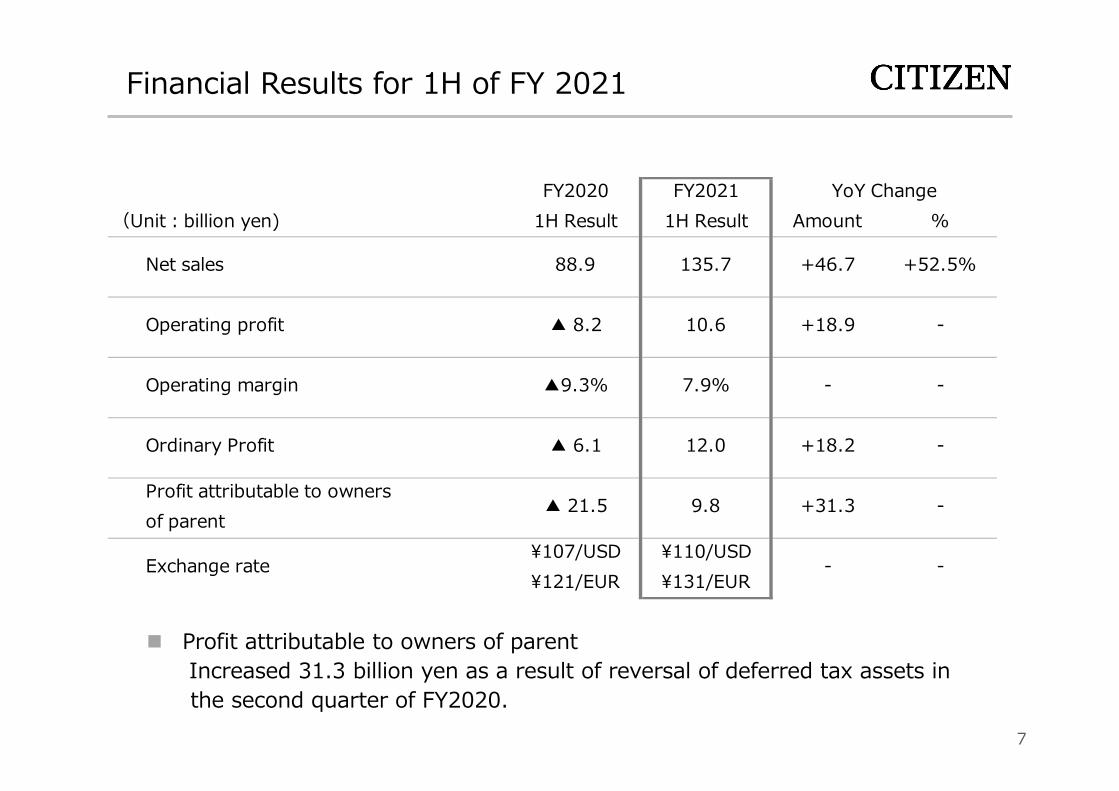
Financial Results for 1H of FY 2021
FY2020 FY20211H Result 1H Result Amount %
¥107/USD ¥110/USD¥121/EUR ¥131/EUR
(Unit︓billion yen)YoY Change
Net sales 88.9 135.7 +46.7 +52.5%
Operating profit ▲ 8.2 10.6 +18.9 -
Profit attributable to owners▲ 21.5 9.8 +31.3 -
of parent
Operating margin ▲9.3% 7.9% - -
Ordinary Profit ▲ 6.1 12.0 +18.2 -
Exchange rate - -
Profit attributable to owners of parentIncreased 31.3 billion yen as a result of reversal of deferred tax assets in the second quarter of FY2020.

8
1H21 Result by Business Segments
FY2020 FY20211H Result 1H Result Amount %
▲ 5.3 4.8(▲14.1%) (7.8%)
0.5 5.8(2.9%) (15.4%)▲ 1.0 1.5
(▲5.1%) (6.0%)▲ 0.1 0.7
(▲2.1%) (7.6%)
▲ 8.2 10.6(▲9.3%) (7.9%)
Consolidated Total +18.9 -
■ Electronic and Other Products +0.9 -
Eliminations or general corporate ▲ 2.1 ▲ 2.3 ▲ 0.1 -
■ Machine Tools +5.2 +894.5%
■ Devices and Components +2.6 -
Operating Profit(Unit: billion yen, %:operating margin)
■ Watches +10.2 -
Consolidated Total 88.9 135.7 +46.7 +52.5%
■ Electronic and Other Products 8.8 9.8 +1.0 +11.4%
■ Devices and Components 21.3 25.5 +4.2 +19.7%
+62.8%
■ Machine Tools 20.7 38.3 +17.5 +84.7%
Net sales(Unit: billion yen)
YoY change
■ Watches 38.1 62.0 +23.9
9
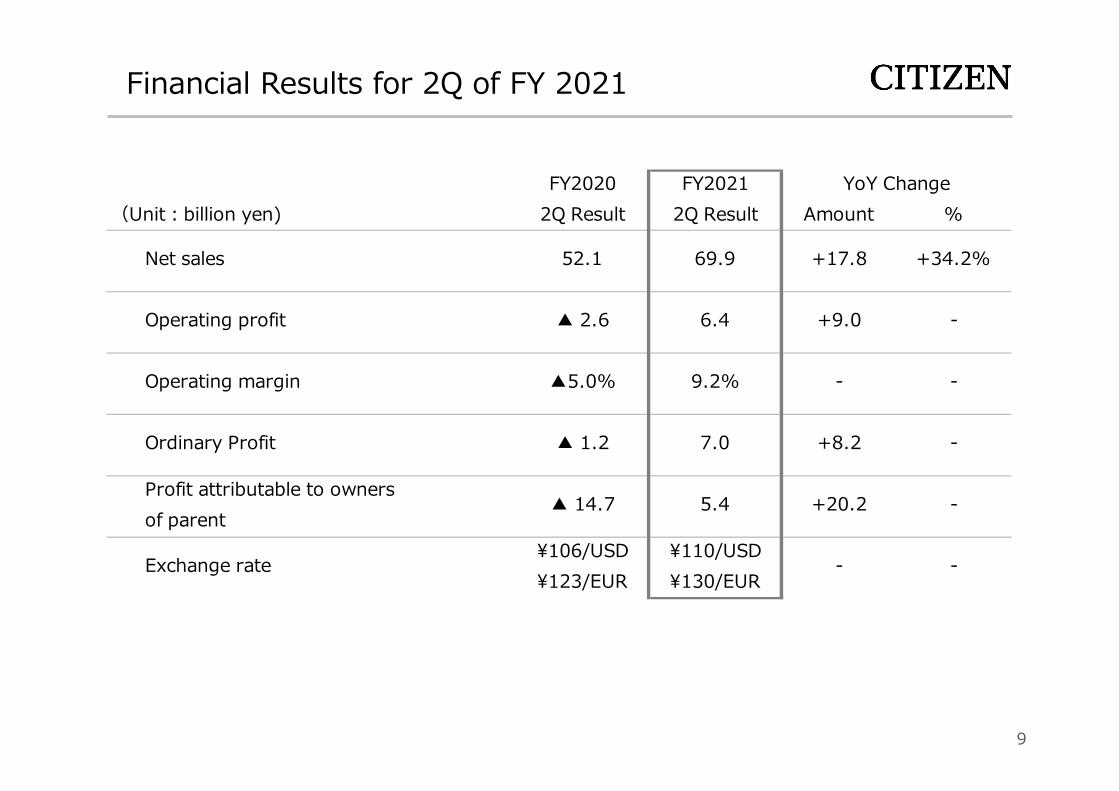
Financial Results for 2Q of FY 2021
FY2020 FY20212Q Result 2Q Result Amount %
¥106/USD ¥110/USD¥123/EUR ¥130/EUR
Ordinary Profit ▲ 1.2 7.0 +8.2
Operating profit ▲ 2.6 6.4 +9.0
(Unit︓billion yen)
Net sales 52.1 69.9 +17.8
YoY Change
-
+34.2%
-
-
-
-Exchange rate -
Profit attributable to owners▲ 14.7 5.4 +20.2
of parent
Operating margin ▲5.0% 9.2% -

10
2Q Result by Business Segments
FY2020 FY20212Q Result 2Q Result Amount %
▲ 1.5 3.3(▲6.0%) (10.1%)
0.2 3.2(2.1%) (16.3%)▲ 0.3 0.5
(▲3.0%) (4.8%)0.1 0.3
(2.7%) (7.8%)
▲ 2.6 6.4(▲5.0%) (9.2%)
Net sales(Unit: billion yen)
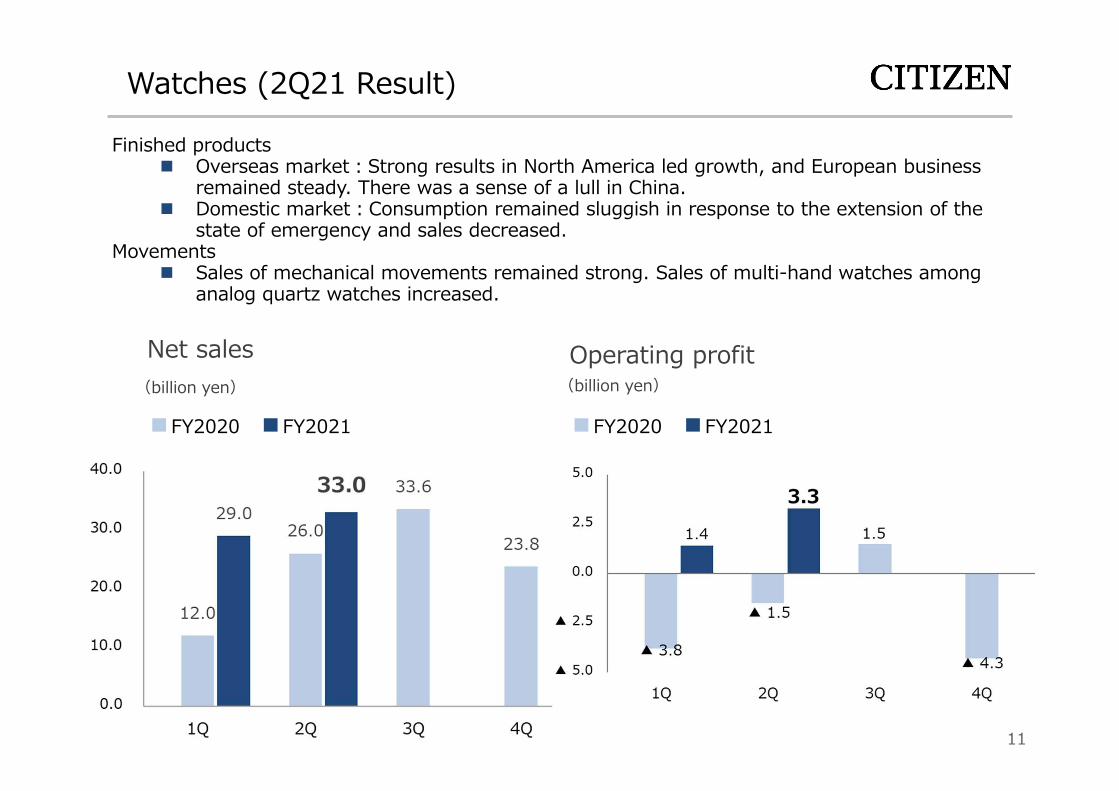
■ Watches 26.0 33.0 +6.9
YoY change
■ Devices and Components 10.8 12.4 +1.5 +14.0%
+26.7%
■ Machine Tools 10.6 19.6 +8.9 +84.3%
Operating Profit(Unit: billion yen, %:operating margin)
■ Watches +4.9
■ Machine Tools +2.9
+8.0%
Consolidated Total 52.1 69.9 +17.8 +34.2%
■ Electronic and Other Products 4.5 4.9 +0.3
-
+1364.0%
-
+213.9%
-Consolidated Total +9.0
Eliminations or general corporate ▲ 1.0 ▲ 1.0 ▲ 0.0 -
■ Devices and Components +0.9
■ Electronic and Other Products +0.2
11
Watches (2Q21 Result)
Finished products Overseas market︓Strong results in North America led growth, and European business
remained steady. There was a sense of a lull in China. Domestic market︓Consumption remained sluggish in response to the extension of the
state of emergency and sales decreased.Movements
Sales of mechanical movements remained strong. Sales of multi-hand watches among analog quartz watches increased.
Operating profit(billion yen)
Net sales(billion yen)
■FY2020 ■FY2021 ■FY2020 ■FY2021

Watches Net sales growth rate by region
12
Rate of change year on year and from the same period the year before last
Rate of change year on year (1H of FY2020)
* The rate of change in total sales of CITIZEN brand watches and BULOVA brand watches only for North America. For other regions, the rate of change only in sales of CITIZEN brand watches.* Other Asian regions are the Asian regions excluding China.* Rate of change based on local currency
The recovery trend is maintained despite differences among regions due to economic resumption.
North America: Steady sales growth is maintained thanks to a recovery in sales on the internet and at physical stores.
Europe: Sales recovered in major regions as economic activities resumed.
China: The growth rate decreased due to a fall in business confidence.
Japan: A moderate recovery was maintained.

Watches Online sales
Online sales Rate of change year on year
13
2Q
● Japan ▲9% Consumer confidence decreased due to the extension of a state of emergency, despite strong sales of limited edition products.
● America +29% Enhanced online sales activities contributed to continuous strong sales at direct sales outlets, particularly of limited edition products. Existing online sales channels also grew.
● China ▲25% Sales decreased due to a fall in consumer confidence and reduced online shopping as a result of resurgence in COVID-19 cases.
Percentage of sales from online sales
* Change is of the CITIZEN brand only in Japan and China Regarding North America, the change is of the CITIZEN brand and the BULOVA brand combined* Both change and percentage of sales from online sales are on a local-currency basis.

Watches Topics
14
New Products Launched in November 2021
Shop Disney 1st Anniversary CITIZEN Disney CollectionNine limited models in collaboration with Disney, Pixar, Marvel, and Star Wars
CITIZEN xC 25th Anniversary Limited Model
Bulova Lunar Pilot Chronograph

15
Machine Tools (2Q21 Result)
Net sales Operating profit(billion yen) (billion yen)
■FY2020 ■FY2021 ■FY2020 ■FY2021
Domestic market︓Sales increased thanks to a recovery in orders received from a wide range of industries such as semiconductors, construction equipment, and housing facilities.
Overseas market︓Sales continued to be strong in China. Sales also increased in Europe due to robust demand for capital investment, which drove orders.

16
Machine Tools Changes in monthly orders received (units)
2Q
● Total +87%Orders received remained at a high level despite a slowdown from the level in the first quarter.
● Japan +155%While the recovery had been slow, orders from industries such as automobiles, semiconductors, and construction equipment tended to increase.
● America +102% Active capital investment particularly in medical-service related industries continued.
● Europe +122% Strong demand in automobile and various other industries continued.
● Asia +57%Orders received increased overall, including IT- and smartphone-related products.
Rate of change year on year(three-month moving average of the numbers of units in orders received)
Rate of change year on year (Quarterly number of units in orders received)

17
Devices and Components (2Q21 Result)
Net sales Operating profit(billion yen) (billion yen)
■FY2020 ■FY2021 ■FY2020 ■FY2021
Precision machining components:An increase in sales of auto parts was secured despite concerns over reduced production of automobiles by manufacturers. Sales of switches decreased due to a fall in sales of those for smartphones.
Opto-devices:Sales of LEDs for lighting products recovered in the European, US, and Chinese markets.

FY 2021 Forecasts
19
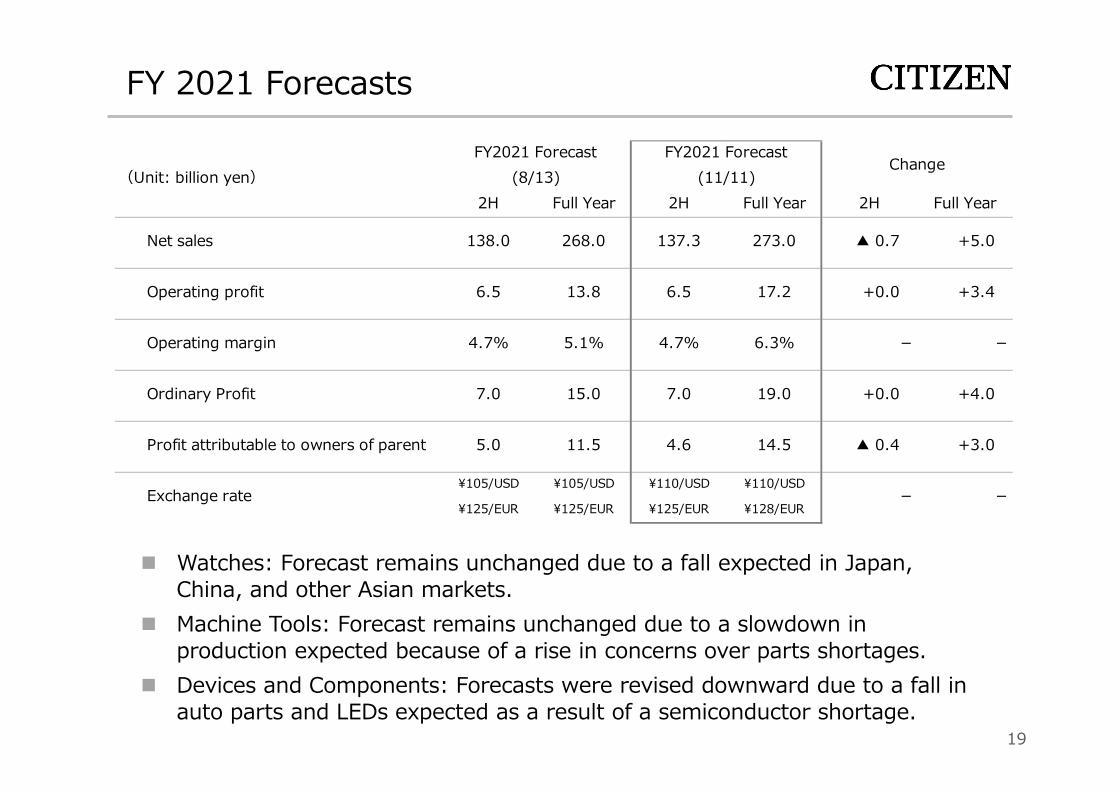
FY 2021 Forecasts
2H Full Year 2H Full Year 2H Full Year
¥105/USD ¥105/USD ¥110/USD ¥110/USD
¥125/EUR ¥125/EUR ¥125/EUR ¥128/EUR
+3.0
Exchange rate - -
Profit attributable to owners of parent 5.0 11.5 4.6 14.5 ▲ 0.4
15.0 7.0 19.0 +0.0 +4.0
6.3% - -
Ordinary Profit 7.0
+3.4
Operating margin 4.7% 5.1% 4.7%
Operating profit 6.5 13.8 6.5 17.2 +0.0
268.0 137.3 273.0 ▲ 0.7 +5.0Net sales 138.0
FY2021 Forecast FY2021 ForecastChange
(Unit: billion yen) (8/13) (11/11)
Watches: Forecast remains unchanged due to a fall expected in Japan, China, and other Asian markets.
Machine Tools: Forecast remains unchanged due to a slowdown in production expected because of a rise in concerns over parts shortages.
Devices and Components: Forecasts were revised downward due to a fall in auto parts and LEDs expected as a result of a semiconductor shortage.
20
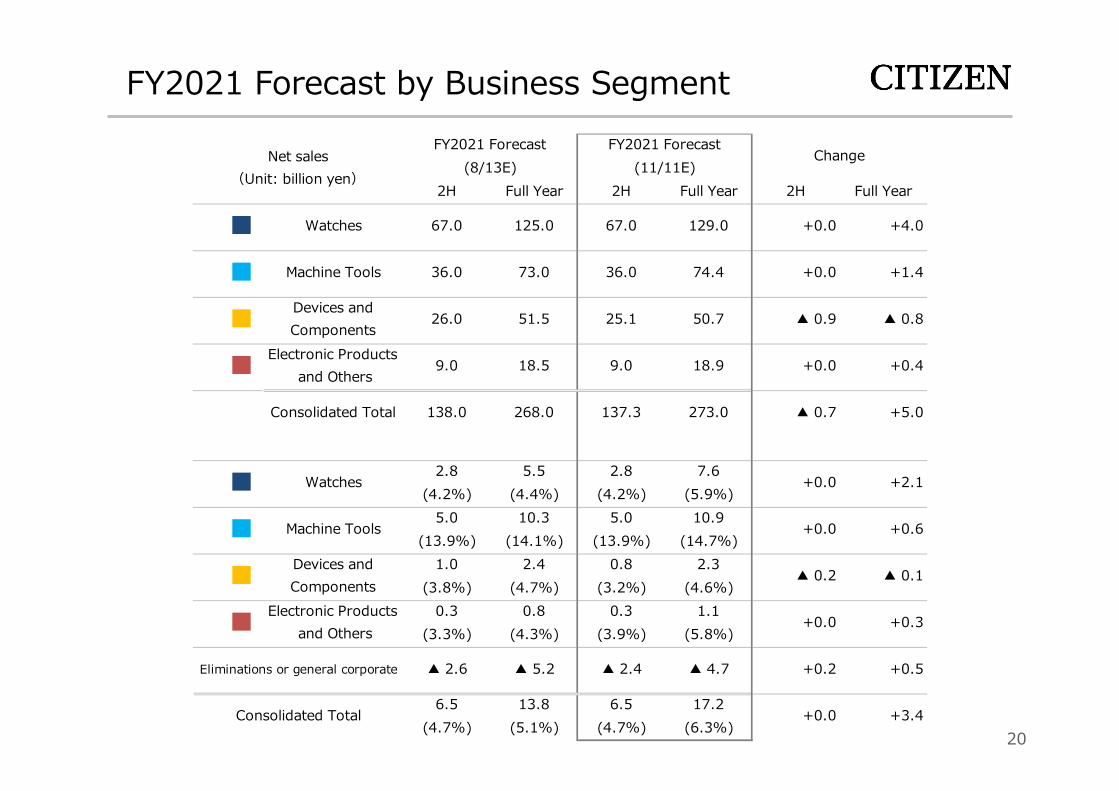
FY2021 Forecast by Business Segment
2H Full Year 2H Full Year 2H Full Year
2.8 5.5 2.8 7.6(4.2%) (4.4%) (4.2%) (5.9%)
5.0 10.3 5.0 10.9(13.9%) (14.1%) (13.9%) (14.7%)
1.0 2.4 0.8 2.3(3.8%) (4.7%) (3.2%) (4.6%)
0.3 0.8 0.3 1.1(3.3%) (4.3%) (3.9%) (5.8%)
6.5 13.8 6.5 17.2(4.7%) (5.1%) (4.7%) (6.3%)
+3.4
▲ 4.7 +0.2 +0.5
Consolidated Total +0.0
▲ 0.1
■ Electronic Products and Others
+0.0 +0.3
Eliminations or general corporate ▲ 2.6 ▲ 5.2 ▲ 2.4
+0.6
■ Devices andComponents
▲ 0.2
■ Watches +0.0 +2.1
■ Machine Tools +0.0
▲ 0.9 ▲ 0.8
■ Electronic Products and Others
9.0 18.5 9.0 18.9
■ Devices andComponents
26.0 51.5 25.1 50.7
+5.0Consolidated Total 138.0 268.0 137.3 273.0 ▲ 0.7
+0.0 +0.4
■ Machine Tools 36.0 73.0 36.0 74.4 +0.0 +1.4
Watches 67.0 125.0 67.0 129.0 +0.0
FY2021 Forecast FY2021 ForecastChange
(8/13E) (11/11E)Net sales
(Unit: billion yen)
■ +4.0


22
Operating performance by segment for 1H of FY2021(Compared to FY2019)
Reference
FY2019 FY20211H Result 1H Result Amount %
3.4 4.8(4.8%) (7.8%)
4.5 5.8(14.8%) (15.4%)
0.7 1.5(2.6%) (6.0%)
0.0 0.7(0.6%) (7.6%)
5.7 10.6(4.0%) (7.9%)
Consolidated Total +4.9 +86.6%
■ Electronic and Other Products +0.6 -
Eliminations or general corporate ▲ 3.1 ▲ 2.3 +0.7 -
■ Machine Tools +1.3 +28.9%
■ Devices and Components +0.7 +103.1%
Operating Profit(Unit: billion yen, %:operating margin)
■ Watches +1.3 +40.4%
Consolidated Total 144.4 135.7 ▲ 8.6 ▲6.0%
■ Electronic and Other Products 11.8 9.8 ▲ 2.0 ▲17.0%
■ Devices and Components 29.3 25.5 ▲ 3.8 ▲13.0%
■ Machine Tools 30.8 38.3 +7.4 +24.1%
Net sales(Unit: billion yen)
YoY change
■ Watches 72.3 62.0 ▲ 10.3 ▲14.2%
23
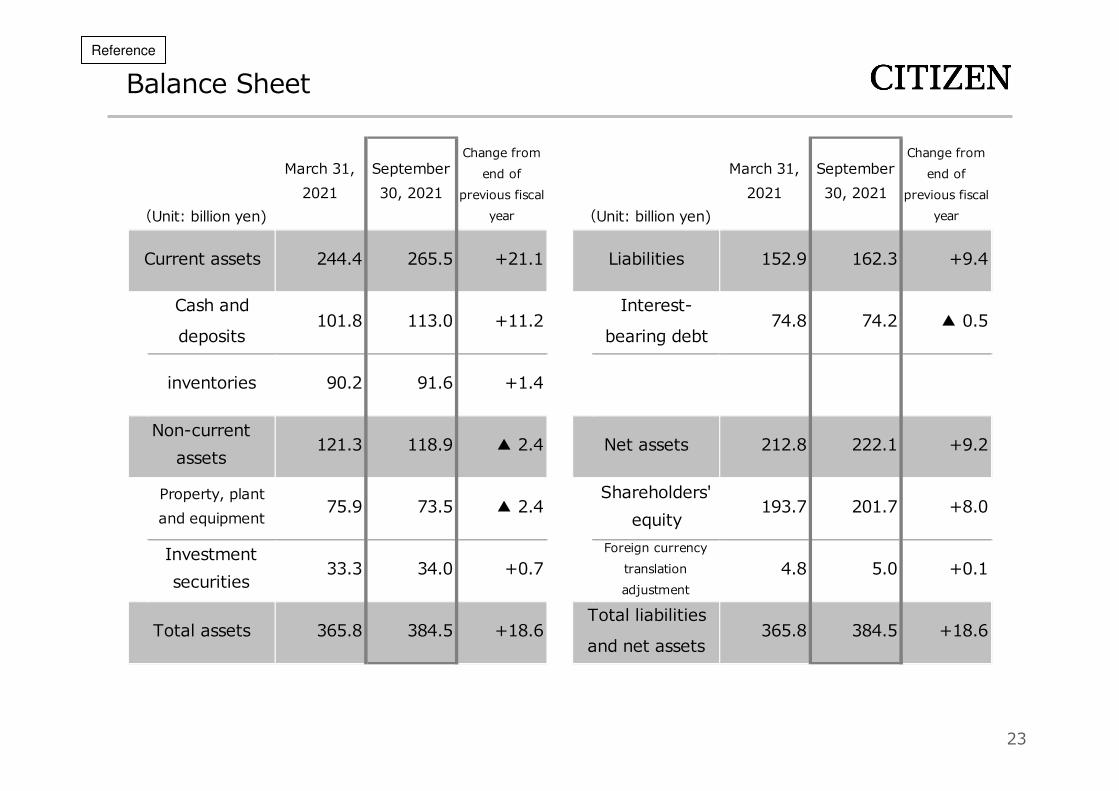
Balance SheetReference
Cash and Interest-deposits bearing debt
384.5 +18.6and net assets
Total assets 365.8 384.5 +18.6Total liabilities
365.8
201.7 +8.0
Investmentsecurities
33.3 34.0 +0.7Foreign currency
translationadjustment
4.8 5.0 +0.1
Property, plantand equipment
75.9 73.5 ▲ 2.4Shareholders'
equity193.7
Non-currentassets
121.3 118.9 ▲ 2.4 Net assets 212.8 222.1 +9.2
inventories 90.2 91.6 +1.4
+9.4
101.8 113.0 +11.2 74.8 74.2 ▲ 0.5
(Unit: billion yen) (Unit: billion yen)
Current assets 244.4 265.5 +21.1 Liabilities
March 31,2021
September30, 2021
Change fromend of
previous fiscalyear
March 31,2021
September30, 2021
Change fromend of
previous fiscalyear
152.9 162.3

24
Statement of Cash FlowReference
2H20 1H21 YoY(Unit: billion yen) Change
+10.8Balance of cashand cashequivalents
99.5 110.3
11.1 ▲ 3.0
Cash flow fromfinancialactivities
▲ 15.0 ▲ 1.5 +13.5
14.1Free cash flow
▲ 0.2
Cash flow frominvestingactivities
▲ 1.1 ▲ 3.9 ▲ 2.8
Cash flow fromoperatingactivities
15.3 15.1
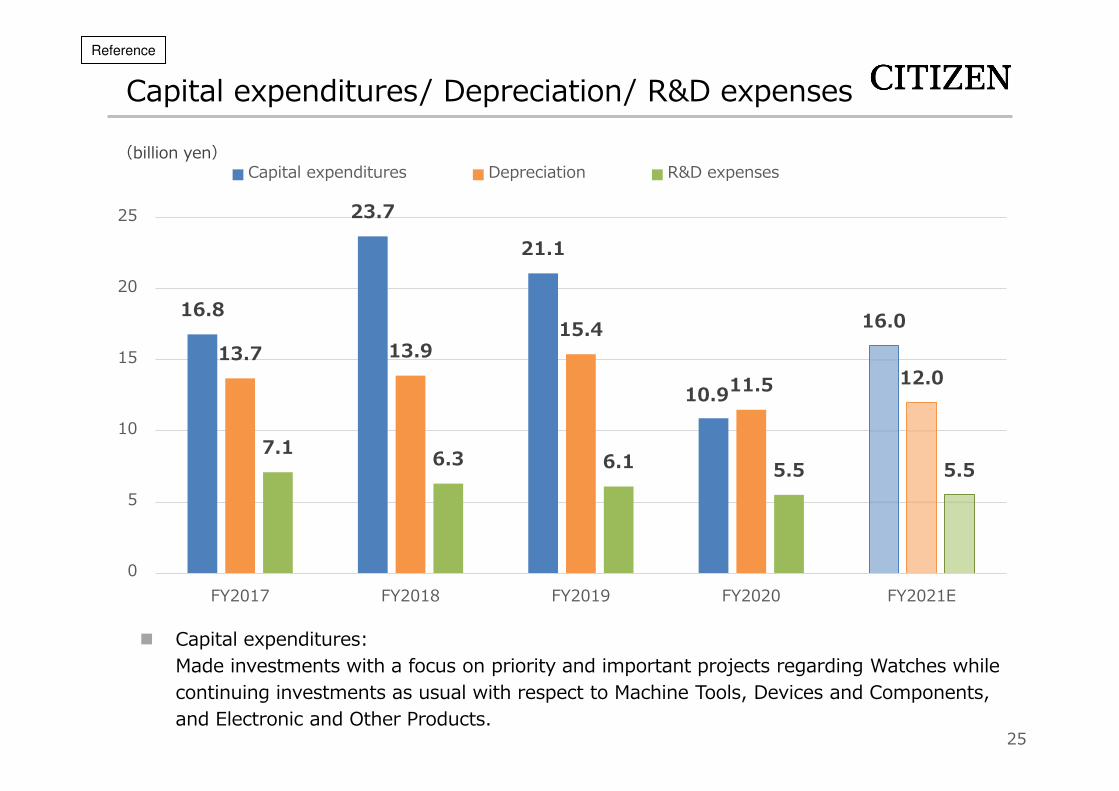
16.8
23.7
21.1
10.9
16.0 13.7 13.9
15.4
11.5 12.0
7.1 6.3 6.1 5.5 5.5
0
5
10
15
20
25
FY2017 FY2018 FY2019 FY2020 FY2021E
Capital expenditures Depreciation R&D expenses
25
Capital expenditures/ Depreciation/ R&D expensesReference
(billion yen)
Capital expenditures:Made investments with a focus on priority and important projects regarding Watches while continuing investments as usual with respect to Machine Tools, Devices and Components, and Electronic and Other Products.