earnings announcement for fy2017 ended march …...120 0 6,000 12,000 investment trusts foreign...
TRANSCRIPT

April 27, 2018
SMBC Nikko Securities Inc.
Earnings Announcement for FY2017 ended
March 31, 2018 (JGAAP)

The information contained in this document is based on data available as of April 27, 2018 and this document is intended to provide information on the business results of
SMBC Nikko Securities Inc. Any information and opinions contained in this document reflect our judgment as of the date of preparation of the document (April 27, 2018)
and are subject to change without notice. No guarantees, representations or warranties are made as to the accuracy or completeness of such information.
(*) Information in this document is presented on a consolidated basis unless otherwise specified.
1
[ Reference Data ]
Consolidated Business Results (Quarterly Trend) 19
Non-consolidated Business Results (Quarterly Trend) 20
Operational Indicators-1 21
Operational Indicators-2 22
Operational Indicators-3 23
(*) Information in this document includes SMBC Friend Securities Co. Ltd.’s financial result from this quarter(January. 2018 ~ March. 2018) in both consolidated and
non-consolidated basis. The financial results of the previous quarter and before (April. 2017 ~ December. 2017), does not include SMBC Friend Securities Co.
Ltd.’s financial result.
(*) SMBC Nikko Securities Inc. has merged with SMBC Friend Securities Co. Ltd. as of January 1, 2018.
Summary of business results for the FY ended Mar. 2018 2
Net operating revenue / Product sales 3
Business Results (Quarterly Trend) 4
Equity brokerage commissions 5
Commissions on investment trusts and fund wrap 6
Net trading income 7
Underwriting commissions (Equities / Bonds) 8
M&A 9
Business collaboration with Sumitomo Mitsui Banking Corporation 10
【Reference】 Sum of bank-securities retail investment assets 11
SG&A 12
Balance Sheet / Capital Adequacy Ratio 13
Client Assets / Net Inflow of Assets 14
Business Trends of Overseas Offices 15
Overseas Network 16
Topics 17

Summary of business results for the FY ended Mar. 2018
2 (*1) profit attributable to owners of parent
(*2) Source: prepared by SMBC Nikko based on the information published by THOMSON REUTERS
(*3) Source: prepared by SMBC Nikko based on the information published by THOMSON REUTERS
(*4) Source: THOMSON REUTERS, M&A announced deals with any Japanese involvement
FY ended
Mar. 2018
Net operating revenue : ¥ 357.3 B (+9% Y on Y), Ordinary income : ¥ 94.9 B (+19%), Profit (*1) : ¥ 63.7 B (+36%)
Along with the global rise of stock prices, expansion of equities’ income and continuous growth of fund wrap commission etc. has contributed to
increase in income and profit. Net operating revenue recorded the highest ever since joining the SMBC group.
Equity brokerage amount was ¥ 32.7 trillion (+23%).
Aggregated sales of products was ¥ 10.2 trillion (-1%). Sale of domestic bonds was ¥ 3.5 trillion (-18%), but foreign bonds were ¥ 3.0 trillion (+8%),
and investment trusts was ¥ 2.8 trillion (+19%).
Underwriting commission was ¥ 31.7 B (-28%).
League table rankings for Apr. 2017 - Mar. 2018
5th place (*2) in Global Equity & Equity-Related-Japan
4th place (*3) in All Bonds in Yen
7th place (*4) in terms of value and 1st in terms of number of deals for M&A announced deals
SG&A was ¥ 267.6 B (+7%).
As of the end of Mar. 2018, total assets was ¥ 10.6 trillion, net assets was ¥ 818.7 B. Net assets has surged from the previous period due to merger
with SMBC Friend Securities Co. Ltd.
Capital adequacy ratio (non-consolidated) was 447%, reflecting a sound financial base of the company.
FY ended
Mar. 2018 4Q
Net operating revenue : ¥ 94.8 B (-3% Q on Q), Ordinary income : ¥ 22.5 B (-26%), Profit (*1) : ¥ 14.1 B (-31%)
Aggregated sales of products was ¥ 2.7 trillion (-0%), domestic bonds was ¥ 677.3 B (-32%), foreign bonds was ¥ 755.7 B (+3%) and investment
trusts was ¥ 1,013 B (+53%).
Operating revenue 109.7 104.6 -5% 361.2 397.4 +10%
Net operating revenue 97.6 94.8 -3% 326.7 357.3 +9%
SG&A 68.2 74.6 +9% 250.9 267.6 +7%
Ordinary income / loss 30.5 22.5 -26% 80.0 94.9 +19%
Income before taxes 29.5 18.3 -38% 66.4 88.9 +34%
Profit / loss(*1) 20.6 14.1 -31% 46.9 63.7 +36%
Total assets (Tril l ions of yen) 11.3 10.6 -0.6 11.6 10.6 -0.9
Total net assets (Bill ions of yen) 588.4 818.7 +230.2 544.2 818.7 +274.4
Mar.-end '18
Billions of YenFY2017
Dec.-end '17 Y on YQ on Q Mar.-end '17 Mar.-end '18
Q on Q Y on Y3Q 4Q Mar. 31 2017
FY ended FY ended
Mar. 31 2018

Net operating revenue Product Sales(*3)
Net operating revenue for this quarter was ¥ 94.8 B (-3% Q on Q), aggregated sales of products was ¥ 2,665.2 B (-0%). Due to the negative market conditions, equity brokerage commissions has declined which resulted as a decrease in net operating revenue. However, the aggregated sales of products has landed on a similar basis as the previous quarter due to the merger with SMBC Friend Securities Co. Ltd.
For the FY2017 ended Mar. 2018, net operating revenue was ¥ 357.3 B (+9% Y on Y), aggregated sales of products were ¥ 10,204.7 B (-1%).
Net operating revenue recorded the highest ever since joining the SMBC group.
(*1) Fund wrap fee was separated from “other commissions” and presented as “fund wrap fee and agency commissions” from FY 2017 1Q, and FY 2016 was adjusted retrospectively.
Agency commissions include custody fee.
(*2) other sales minus cost of sales (*3) including sale of fund wrap from FY 2017 1Q
(*4) Sale of foreign bonds includes already-issued bonds and yen-denominated foreign bonds.
【non-consolidated】
(Billions of yen)
(Billions of yen)
Net operating revenue / Product sales
3
0
200
400
Equity brokerage commissions Subscription commissions
on investment trusts
Fund wrap fee and agency commissions
on investment trusts (*1)Underwriting commissions Other commissions Net trading income
0
60
120
0
6,000
12,000
Investment trusts Foreign bonds(*4) Domestic bonds Subscription of equities Variable annuities/insurances
0
2,000
4,000
FY2017 FY ended FY ended
1Q 2Q 3Q 4Q Mar. 31 2017 Mar. 31 2018
Equity brokerage commissions 8.6 8.5 12.4 11.0 -11% 31.1 40.7 +31%
Subscription commissions
on investment trusts10.0 9.5 12.3 15.6 +27% 35.6 47.5 +33%
Fund wrap fee and agency commissions
on investment trusts (*1)11.7 12.8 14.0 15.2 +9% 41.8 53.8 +29%
Underwriting commissions 5.6 6.8 10.1 9.0 -11% 43.9 31.7 -28%
Other commissions 5.5 5.8 7.2 6.9 -5% 24.5 25.5 +4%
Net trading income 38.0 34.7 40.4 34.0 -16% 135.3 147.3 +9%
Net financial incomes 2.1 4.2 0.6 2.5 4.0x 10.7 9.5 -11%
Net sales (*2) 0.2 0.2 0.2 0.1 -27% 3.4 0.9 -72%
Total 82.1 82.7 97.6 94.8 -3% 326.7 357.3 +9%
Q on Q Y on YFY2017 FY ended FY ended
1Q 2Q 3Q 4Q Mar. 31 2017 Mar. 31 2018
Inv estment trusts 550.7 566.0 661.3 1,013.0 +53% 2,353.6 2,790.9 +19%
Fund wrap 105.6 102.4 136.9 65.3 -52% 345.0 410.1 +19%
Foreign bonds(*4) 787.3 725.2 735.8 755.7 +3% 2,781.0 3,004.0 +8%
Domestic bonds 1,041.6 773.9 991.7 677.3 -32% 4,268.5 3,484.4 -18%
(Retail - targeted JGBs) (129.1) (175.0) (132.7) (198.7) (+50%) (844.1) (635.5) (-25%)
Subscription of equities 35.8 156.6 119.5 136.5 +14% 495.5 448.3 -10%
Variable annuities/insurances 8.5 16.6 24.2 17.5 -27% 34.8 66.8 +92%
Total 2,529.5 2,340.6 2,669.3 2,665.2 -0% 10,278.4 10,204.7 -1%
Q on Q Y on Y

Net operating revenue SG&A
Ordinary income Profit (*)
Business Results (Quarterly Trend)
4
(Billions of yen) (Billions of yen)
(Billions of yen) (Billions of yen)
(*) profit attributable to owners of parent
73.6 75.478.0
99.5
82.1 82.7
97.6 94.8
0
30
60
90
120
FY20161Q 2Q 3Q 4Q
FY20171Q 2Q 3Q 4Q
58.8 60.7 61.5
69.8
62.3 62.468.2
74.6
0
20
40
60
80
FY20161Q 2Q 3Q 4Q
FY20171Q 2Q 3Q 4Q
15.7 15.7 17.1
31.3
20.9 20.9
30.5
22.5
0
25
50
FY20161Q 2Q 3Q 4Q
FY20171Q 2Q 3Q 4Q
10.7 11.2
4.2
20.6
14.4 14.3
20.6
14.1
0
25
50
FY20161Q 2Q 3Q 4Q
FY20171Q 2Q 3Q 4Q

Equity brokerage amount for this quarter was ¥ 8,846.7 B (-4% Q on Q), and equity brokerage commissions was ¥ 11.0 B (-11%).
Due to negative market condition, equity brokerage commissions and equity brokerage amount has both downfallen.
For the FY2017 ended Mar. 2018, equity brokerage amount was ¥ 32,739.5 B (+23% Y on Y), and equity brokerage commissions was ¥ 40.7 B (+31%).
Equity brokerage commissions Equity brokerage amount / TSE share
Equity brokerage commissions
5
【non-consolidated】
(*1) Adjusted brokerage commissions / brokerage amounts (Scope: cash and margin transactions)
(*2) All stock exchanges
(*3) Total of 1st and 2nd sections of Tokyo and Nagoya stock exchanges
(Billions of yen) (Billions of yen)
FY2017 FY ended FY ended
1Q 2Q 3Q 4Q Mar. 31 2017 Mar. 31 2018
Equity brokerage Commissions 8.6 8.5 12.4 11.0 -11% 31.1 40.7 +31%
Equity commissions rate(*1) 10.8bp 10.6bp 12.3bp 11.7bp - 0.6bp 10.3bp 11.4bp 1.1bp
Q on Q Y on Y
0
25
50
0
7.5
15.0
FY2017 FY ended FY ended
1Q 2Q 3Q 4Q Mar. 31 2017 Mar. 31 2018
Equity brokerage amount (*2) 7,295.9 7,354.1 9,242.7 8,846.7 -4% 26,555.0 32,739.5 +23%
TSE share 1.85% 1.95% 2.04% 1.95% -0.09pt 1.84% 1.95% +0.12pt
Retail market share (*3) 3.64% 3.48% 3.83% 4.09% +0.26pt 3.14% 3.78% +0.64pt
Q on Q Y on Y
1.84% 1.95%
0
20,000
40,000
Equity brokerage amount (*2) TSE share
1.85% 1.95% 2.04% 1.95%
0
6,000
12,000

Client Assets of Fund wrap (*2) Sales / Client Assets of Investment trusts Subscription commissions (*1)
Sale of investment trusts for this quarter was ¥ 1,013 B (+53% Q on Q), subscription commissions on investment trusts was 15.6 B (+27%). Due to the enforced sales platform by the merger with SMBC Friend Securities Co. Ltd, sales of equity investment trusts has increased.
For the FY2017 ended Mar. 2018, sale of investment trusts was ¥ 2,790.9 B (+19% Y on Y), subscription commissions on investment trusts was ¥ 47.5 B (+33%). The positive market conditions has led the increase in sales and subscription commissions of stock investment trusts. Fund wrap fee and agency commissions has also grown steadily up to ¥ 53.8 B (+29%).
Commissions on investment trusts and fund wrap
6 (*1) Subscription commissions include fund wrap fee from FY 2017 1Q. Agent commissions include custody fee.
(*2) “Client assets of fund wrap” represents aggregate all our client assets of fund wrap.
(Billions of yen)
(Billions of yen)
(Billions of yen)
FY2017 FY ended FY ended
1Q 2Q 3Q 4Q Mar. 31
2017
Mar. 31
2018
Subscription
commissions10.0 9.5 12.3 15.6 +27% 35.6 47.5 +33%
Fund wrap fee and
agency commissions11.7 12.8 14.0 15.2 +9% 41.8 53.8 +29%
Q on Q Y on Y
0
20
40
0
60
120
Fund wrap fee andagency commissions
Subscription commissions
FY2016 FY2017
1Q 2Q 3Q 4Q 1Q 2Q 3Q 4Q
869.3 1,004.3 1,151.8 1,233.3 1,385.3 1,521.6 1,722.2 1,745.3
0
1,000
2,000
FY2017 FY ended FY ended
1Q 2Q 3Q 4Q Mar. 31
2017
Mar. 31
2018
Sale of investment
trusts550.7 566.0 661.3 1,013.0 +53% 2,353.6 2,790.9 +19%
Sale of fund wrap 105.6 102.4 136.9 65.3 -52% 345.0 410.1 +19%
Q on Q Y on Y
8,090.2
10,698.2
0
2,000
4,000
Sale of fund wrap
Sale of investment trusts
Client Assets of Investment trusts
8,384.0 8,611.1
9,700.6
10,698.2
0
750
1,500

Net trading income (adjusted net financial income) Sale of foreign bonds
Net trading income (adjusted net financial income) for this quarter was ¥ 36.1 B (-11% Q on Q). Net trading income of equities decreased due to negative market condition. Sales of foreign bonds continued to remain at a high level, equaling the previous quarter.
For the FY2017 ended Mar. 2018, net trading income (adjusted net financial income) was ¥ 155.0 B (+8% Y on Y).
Net trading income
7
(Billions of yen)
【non-consolidated】
(Billions of yen)
・Net trading income (adjusted net financial income) is supplemented with the ex dividend, etc.
(*1) including dividend from trading position, etc.
(*2) including interest income from trading position
(*3) excluding funding costs
FY2016 FY ended FY ended
1Q 2Q 3Q 4Q Mar. 31 2016 Mar. 31 2017
Equities, etc.(*1) 9.5 10.3 14.8 10.1 -32% 27.0 44.8 1.7X
(div idend,etc) (0.9) (4.7) (1.3) (2.8) 2.2X (10.0) (9.9) (-1%)
Bonds, others(*2) 30.1 28.3 25.8 26.0 +1% 117.0 110.2 -6%
(interest) (0.6) (-0.8) (-1.1) (-0.8) (-) (-1.3) (-2.2) (-)
Total(*3) 39.6 38.6 40.6 36.1 -11% 144.0 155.0 +8%
Q on Q Y on Y
00
30
60
0
100
200
Bonds, others(*2) Equities, etc.(*1)
FY2017 FY ended FY ended
1Q 2Q 3Q 4Q Mar. 31 2017 Mar. 31 2018
787.3 725.2 735.8 755.7 +3% 2,781.0 3,004.0 +8%
Q on Q Y on Y
0
600
1,200
0
2,000
4,000

Underwriting commissions (Equities / Bonds) Global Equity & Equity-Related-Japan (*2) Apr. 2017 - Mar. 2018
Underwriting commissions for this quarter was ¥ 9.0 B (-11% Q on Q).
For Apr. 2017 - Mar. 2018, book runner in Global Equity & Equity-Related-Japan: 5th place holding 11.4% market share, underwriter in IPO: 3rd place in terms of number of deals and 4th place in terms of proceeds, lead manager in All Bonds in Yen: 4th place holding 17.2% market share.
Underwriting commissions (Equities / Bonds)
8 (*1) including revenues related to securitization arrangements
(*2) (*3) prepared by SMBC Nikko based on the information published by THOMSON REUTERS (including overseas entities)
(*4) prepared by SMBC Nikko based on the information published by THOMSON REUTERS (corporate bonds, FILP agency/municipality bonds(proportional shares as lead manager),samurai bonds)
All Bonds in Yen (*4) Apr. 2017 - Mar. 2018
【non-consolidated】
(Billions of yen)
IPO (*3) Apr. 2017 - Mar. 2018
0
7.5
15.0
0
30
60
Equit ies Bonds Subscription and Distribution commissions (EQs/Bonds)
Others(1*) Rank Book runner Mkt.Share(%)
1 Nomura 1,113.7 24.2%
2 Daiwa 863.2 18.7%
3 Mizuho 668.6 14.6%
4 Mitsubishi UFJ Morgan Stanley 594.9 13.0%
5 SMBC Nikko 524.6 11.4%
Proceeds
(bill of yen)
Rank Manager Mkt.Share(%)
1 Mitsubishi UFJ Morgan Stanley 3,586.1 20.0%
2 Mizuho 3,557.6 19.9%
3 Nomura 3,389.8 18.9%
4 SMBC Nikko 3,084.6 17.2%
5 Daiwa 2,909.9 16.2%
Proceeds
(bill of yen)
1 Nomura 20
2 Mizuho Financial Group 17
3 Sumitomo Mitsui Financial Group 15
4 Daiw a Securities Group Inc 13
5 SBI Holdings 6
Rank Book runner No. DealsProceeds
(bill of yen)
1 Nomura 113.8
2 Daiw a Securities Group Inc 109.1
3 Morgan Stanley 79.1
4 Sumitomo Mitsui Financial Group 65.5
5 Mizuho Financial Group 57.3
Rank Underw riter
FY2017 FY ended FY ended
1Q 2Q 3Q 4Q Mar. 31 2017 Mar. 31 2018
Underwriting commissions 5.6 6.8 10.1 9.0 -11% 43.9 31.7 -28%
Equities 1.6 3.9 6.1 6.3 +2% 24.5 18.0 -27%
Bonds 3.8 2.7 3.8 2.7 -30% 18.8 13.1 -30%
Subscription and Distribution
commissions (EQs/Bonds)0.5 0.7 0.5 0.8 +56% 4.5 2.7 -39%
Others(1*) 0.9 0.4 0.2 0.4 +42% 1.0 2.0 +94%
Q on Q Y on Y

Financial Advisor Rank value basis Apr. 2017 - Mar. 2018
For Apr. 2017 - Mar. 2018 in the league table of M&A financial advisor for Japanese involvement announced deals: With 248 deals acquired in total, ranked 7th in terms of value (market share 9.1%) and 1st in terms of number of deals (market share 6.4%).
Source: THOMSON REUTERS, any Japanese involvement announced
M&A
9
Mitsubishi Corporation (MC)
/ Mitsubishi Motors Corporation MC completed tender offer for Mitsubishi Motors
through MAI Corporation, a wholly-owned subsidiary of MC.
(SMBC Nikko serves as advisor MC and TOB agent for MAI Corporation.)
Tokai Carbon / SGL GE Holding GmbH (Showa Denko)
SHOWA DENKO K.K. agreed to transfer SGL GE’s US business to Tokai Carbon Co., Ltd,.
(SMBC Nikko and Moelis & Company serve as advisor for Showa Denko.)
HKE Holdings G.K. (Kohlberg Kravis Roberts & Co. L.P.)
/ Hitachi Kokusai Electric Inc. HKE Holdings G.K., an entity owned by KKR investment funds completed tender offer for
Hitachi Kokusai, a subsidiary of Hitachi, to make Hitachi Kokusai a wholly-owned subsidiary.
(SMBC Nikko serves as advisor for KKR and TOB agent for HKE Holdings.)
Sawai Pharmaceutical / Upsher‐Smith Laboratories
Sawai Pharmaceutical Co., Ltd. announced the signing of an agreement to acquire all the equity interest in the generic pharmaceuticals business of Upsher‐Smith Laboratories, Inc. through the
new subsidiary in the US. (SMBC Nikko serves as advisor for Sawai
Pharmaceutical.)
Major announced deals Apr. 2017 – Mar. 2018
Toyota / Mazda Toyota Motor Corporation and Mazda Motor
Corporation signed an agreement to enter a
business and capital alliance. The companies
mutually acquired shares : Mazda acquired Toyota
shares through a disposition of treasury stock
implemented by Toyota, and Toyota acquired
shares of common stock issued by Mazda.
(SMBC Nikko serves as advisor for Mazda.)
Kao USA Inc. (Kao) / Oribe Hair Care, LLC
Kao acquired Oribe Hair Care, LLC through Kao USA Inc., a subsidiary of Kao in US. (SMBC Nikko and SMBC Nikko securities
America serve as advisor for Kao.)
Financial Advisor No. of deals Apr. 2017 - Mar. 2018
Rank AdvisorRank value
(bill of yen)
Mkt.Share
(%)
1 Nomura 6,766.8 31.3%
2 Morgan Stanley 6,403.2 29.7%
3 Goldman Sachs 5,313.0 24.6%
4 Credit Suisse 3,240.6 15.0%
7 Sumitomo Mitsui Financial Group 1,966.3 9.1%
Rank Advisor No. DealsMkt.Share
(%)
1 Sumitomo Mitsui Financial Group 248 6.4%
2 Mizuho Financial Group 218 5.7%
3 Nomura 108 2.8%
4 Kaede Group 60 1.6%
5 KPMG 54 1.4%

Corporate clients (No. of deals) (*3)
Collaboration with SMBC kept on track as the number of individual customers’ accounts and the referral of corporate clients grew steadily.
Business collaboration with Sumitomo Mitsui Banking Corporation
10
【non-consolidated】
Asset management (Referral service and financial products intermediary service (*1)) Investment banking (Referral service)
Individual customer (No. of accounts) (*2) Corporate clients (No. of deals)
Note) No. of accounts shows the number of the accounts existed at the end of respective quarters. No. of deals shows accumulated acquired deals in either asset management or investment banking since its inception.
(*2) The number of accounts at the end of each quarter with regards to individual customer who either was referred by SMBC to SMBC Nikko or opened an account with SMBC Nikko
via SMBC's financial products intermediary service.
(*3) The number of the accumulated acquired deals on asset management with corporate clients via SMBC's referral services and financial products intermediary services on
behalf of SMBC Nikko since the inception of respective services.
(*1) Financial products intermediary services by SMBC: SMBC Nikko commissions SMBC to solicit and intermediate securities transactions to customers.
220,000
260,000
300,000
340,000
380,000
420,000
FY20161Q 2Q 3Q 4Q
FY20171Q 2Q 3Q 4Q
0
5,000
10,000
15,000
20,000
25,000
30,000
35,000
FY20161Q 2Q 3Q 4Q
FY20171Q 2Q 3Q 4Q
0
2,000
4,000
6,000
8,000
10,000
FY20161Q 2Q 3Q 4Q
FY20171Q 2Q 3Q 4Q

【Reference】 Sum of bank-securities retail investment assets
11
In retail business, sum of bank-securities investment assets trends upward.
(*1) Sum of retail investment assets (foreign deposit, investment trusts, single premium life insurance) change of SMBC and investment assets (net inflow of assets) change at the sales
division (retail) of Nikko (*2) cumulative amount since FY 2013 1Q
(*3) Sum of retail investment assets (foreign deposit, investment trusts, single premium life insurance) of SMBC and investment assets (client assets) at the sales division (including other
than retail) of Nikko (*4) The amount of investment assets of former SMBC Friend Securities Co. Ltd are included since FY 2015 1Q
Increase in balance of bank-securities retail investment assets (*1) Balance of bank-securities retail investment assets (*3)
(Billions of yen) (Billions of yen) (Billions of yen)
+0
+1,000
+2,000
+3,000
+4,000
+0
+100
+200
+300
+400
+500
+600
1Q 2Q 3Q 4Q 1Q 2Q 3Q 4Q 1Q 2Q 3Q 4Q
FY2015 FY2016 FY2017
increase in balance of bank-securities
retail investment assets
(lhs)
increase in balance of bank-securities
retail investment assets(total (*2),rhs)
20,000
25,000
30,000
35,000
40,000
45,000
50,000
55,000
FY20151Q 2Q 3Q 4Q
FY20161Q 2Q 3Q 4Q
FY20171Q 2Q 3Q 4Q
Nikko(*4) SMBC

SG&A for this quarter was ¥ 74.6 B (+9% Q on Q). Expenses has increased due to the merger with SMBC Friend Securities Co. Ltd.
For the FY2017 ended Mar. 2018, SG&A was ¥ 267.6 B (+7% Y on Y), personnel expenses linked to company operations have increased.
SG&A
12
(Billions of yen)
0
50
100
0
150
300
Trading related expenses Personnel expenses Real estate expenses
Outsourcing and stationery expenses Depreciation and amortizat ion Other
(単位:億円) FY2017 FY ended FY ended
(Billions of yen) 1Q 2Q 3Q 4Q Mar. 31 2017 Mar. 31 2018
Trading related expenses 9.3 9.8 11.2 12.2 +9% 43.6 42.7 -2%
Personnel expenses 29.5 30.2 32.9 35.6 +8% 116.8 128.5 +10%
Real estate expenses 5.5 5.3 5.6 6.5 +16% 21.2 23.1 +9%
Office cost 6.6 6.6 7.2 7.4 +3% 25.1 28.0 +11%
Depreciation and amortization 5.9 6.0 6.1 6.4 +5% 23.8 24.7 +4%
Other 5.2 4.1 4.9 6.1 +24% 20.2 20.4 +1%
SG&A / Fixed expense 62.3 62.4 68.2 74.6 +9% 250.9 267.6 +7%
SG&A / Net operating revenue 76% 75% 70% 79% +9pt 77% 75% - 2pt
Q on Q Y on Y

Balance Sheet / Capital Adequacy Ratio
13
【non-consolidated】
【non-consolidated】
Variance
Current assets 11,429.1 10,379.8 -1,049.3
Trading products 4,058.3 3,179.7 -878.5
Loans secured by securities 5,233.1 5,027.7 -205.4
Other current assets 2,137.6 2,172.3 +34.6
Noncurrent assets 258.3 311.8 +53.5
Tangible assets 25.3 27.3 +1.9
Intangible assets 78.4 74.2 -4.2
Investments and other assets 154.4 210.3 +55.8
Total assets 11,687.4 10,691.6 -995.7
Current liabilities 10,354.9 9,079.5 -1,275.3
Trading products 2,571.5 2,494.6 -76.8
Loans payable secured by securities 5,444.1 5,006.0 -438.1
Short-term loans pay able / Commercial papers 1,438.4 729.8 -708.6
Other current liabilities 900.8 849.0 -51.7
788.2 793.3 +5.1
Total liabilities 11,143.1 9,872.9 -1,270.2
Total net assets 544.2 818.7 +274.4
Total liabilities and net assets 11,687.4 10,691.6 -995.7
Noncurrent liabilities /
Reserves under the special laws
(Billions of Yen) Mar.17 Mar.18Variance
Basic items 496.1 735.7 +239.6
Supplementary items 117.9 149.1 +31.1
Deductible assets 158.6 166.0 +7.3
Net capital 455.4 718.8 +263.3
Risk total 137.6 160.9 +23.2
Market Risk 57.1 62.4 +5.3
Counterparty Risk 21.3 24.2 +2.9
Basic Risk 59.2 74.2 +14.9
Capital Adequacy Ratio 331% 447% +116 pt
(Billions of Yen) Mar.17 Mar.18
Credit ratings on Long Term (as of April 27, 2018)
Moody's S&P R&I JCR
A1 A AA- AA
[ Stable ] [ Positive ] [ Stable ] [ Stable]
Total net assets has increased massively due to the merger with SMBC Friend Securities Co. Ltd, on January 1, 2018.
The increase in the Basic items has resulted for the Capital Adequacy Ratio to grow +116pt from the previous fiscal year.

Client Assets / Net Inflow of Assets
14
(Billions of yen)
(Trillions of yen)
【non-consolidated】
(*) From FY 2017 2Q, net inflow (outflow) of assets was adjusted retrospectively from FY2016 1Q to FY 2017 1Q.
FY2016 FY2017
Jun. Sep. Dec. Mar. Jun. Sep. Dec. Mar.
Equity 21.0 22.5 25.1 25.7 26.8 28.4 31.0 34.0
Bond 14.9 15.3 15.4 15.9 16.0 16.2 16.0 16.4
Investment trust 7.1 7.4 8.1 8.1 8.4 8.6 9.7 10.7
Others 0.3 0.4 0.4 0.4 0.4 0.4 0.4 0.5
Client assets 43.3 45.5 49.0 50.0 51.6 53.6 57.2 61.6
(Billions of yen) 1Q 2Q 3Q 4Q 1Q 2Q 3Q 4Q
Net inf low (outf low) of assets <sales div ision>(*) 438.2 513.2 98.0 252.4 82.4 376.8 167.1 264.8
Inflow of assets 1,410.2 1,348.0 1,107.3 1,575.8 1,096.8 1,475.0 1,437.7 1,766.9
Outflow of assets -972.0 -834.8 -1,009.3 -1,323.4 -1,014.4 -1,098.2 -1,270.6 -1,502.1
(Trillions of yen)
0
0
350
700Net inflow of assets
0
20
40
60
80
Equity Bond Investment trust Others
Overall client assets at the end of Mar. 2018 was ¥ 61.6 trillion (+8% Q on Q). Thanks to the merger with SMBC Friend Securities Co. Ltd as well as the ongoing customer platform expansion, the overall client assets has surged +23% Y on Y.
Net inflow of assets at sales division for this quarter was ¥ 264.8 B.
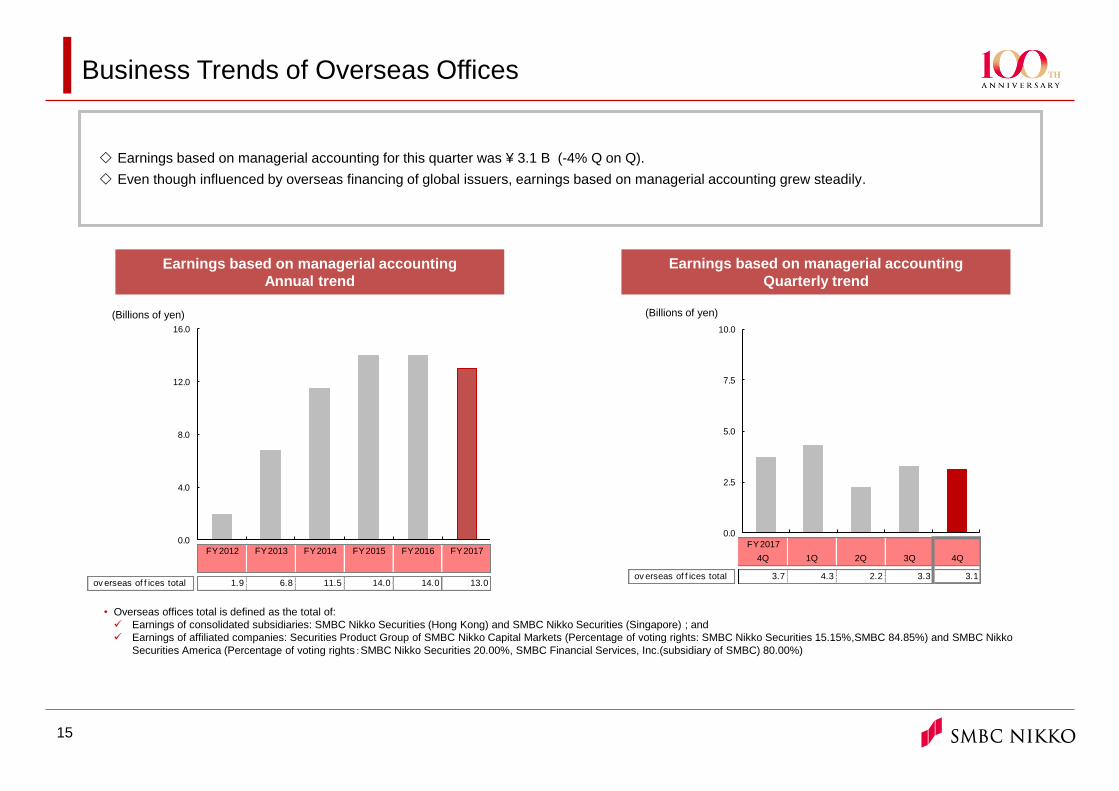
Business Trends of Overseas Offices
15
Earnings based on managerial accounting for this quarter was ¥ 3.1 B (-4% Q on Q).
Even though influenced by overseas financing of global issuers, earnings based on managerial accounting grew steadily.
Earnings based on managerial accounting
Annual trend
Earnings based on managerial accounting
Quarterly trend
• Overseas offices total is defined as the total of:
Earnings of consolidated subsidiaries: SMBC Nikko Securities (Hong Kong) and SMBC Nikko Securities (Singapore) ; and
Earnings of affiliated companies: Securities Product Group of SMBC Nikko Capital Markets (Percentage of voting rights: SMBC Nikko Securities 15.15%,SMBC 84.85%) and SMBC Nikko
Securities America (Percentage of voting rights:SMBC Nikko Securities 20.00%, SMBC Financial Services, Inc.(subsidiary of SMBC) 80.00%)
(Billions of yen) (Billions of yen)
FY2017
4Q 1Q 2Q 3Q 4Q
ov erseas of f ices total 3.7 4.3 2.2 3.3 3.1
0.0
2.5
5.0
7.5
10.0
FY2012 FY2013 FY2014 FY2015 FY2016 FY2017
ov erseas of f ices total 1.9 6.8 11.5 14.0 14.0 13.0
0.0
4.0
8.0
12.0
16.0

Shanghai
Jakarta
Sydney
New York
Luxembourg
Hong Kong
San Francisco
Singapore
Japanese equity brokerage
Fixed-income sales and trading Coverage of bond underwriting M&A advisory
Market entry consulting for Japanese
companies in Greater China
IR arrangement
SMBC Nikko Capital Markets
Japanese equity and fixed-income
sales and trading
Equity and bond underwriting
M&A advisory
IR arrangement
Swap related business
Fund custody
Fund administration
Japanese equity and fixed-income brokerage
M&A advisory
Private wealth business
IR arrangement
Indonesian equity brokerage
Equity and bond underwriting
M&A advisory
Market entry consulting for Japanese
companies in Indonesia
Asset management business
Japanese / US equity brokerage
M&A advisory
IR arrangement
Fund management
Japanese / US equity brokerage Fixed-income sales and trading Equity and bond underwriting Structured finance M&A advisory IR arrangement
Coverage of bond underwriting
Overseas Network
16
M&A advisory related services
Note:SMBC Nikko Capital Markets, SMBC Nikko Securities America and Nikko Securities Indonesia are SMBC Nikko’s affiliated companies.
London
SMBC Nikko Bank (Luxembourg)
SMBC Nikko Investment Fund Management Company
SMBC Nikko Investment
Consulting (Shanghai)
SMBC Nikko Securities America (San Francisco Branch)
SMBC Nikko Securities America
SMBC Nikko Securities (Hong Kong)
SMBC Nikko Securities (Singapore)
SMBC Nikko Capital Markets (Sydney Office)
Nikko Securities Indonesia
Mumbai
Seoul
Manila Bangkok
Alliance in M&A advisory, DCM and IPO business
Alliance in M&A advisory and DCM business
Alliance in M&A advisory
Kotak Mahindra Group (Mumbai)
Market entry consulting for Japanese companies in Vietnam
Petro Vietnam Securities (Hanoi)
Alliance in M&A advisory and DCM/ECM business
Phatra Securities (Bangkok)
First Metro Securities (Manila)
KB Securities (Seoul)
Business Partners (Asia) Business Partners (Americas)
New York
Rio de Janeiro
Alliance in M&A advisory
Moelis & Company (New York)
Collaboration in various business worldwide
Citigroup (New York)
Alliance in M&A advisory
BTG Pactual (Rio de Janeiro)
Hanoi
SMBC Nikko Group Company
SMBC Nikko Business Partner

Topics
17
Promotion of Health and Productivity Management
Base up on the Entry level salary
SMBC Nikko has executed an Exclusive Agreement with Loup
Ventures, an independent research firm focused in the technology
sector, to strengthen US equity research service to Japanese clients.
Enforcement of US Technology Sector equity research service
SMBC Nikko is going to raise the entry level salary as of July, 2018 in
order to recruit talented personnel's. Comprehensive staffs will be
paid JPY287k per month, and Regional specific staffs will be
JPY267k per month. Furthermore, second year staffs will have a base
up as well.
SMBC Nikko has officially announced a “Declaration of Health &
Productivity Management” as of 1st April, 2018. As health promotion
of our employees is one of our business challenges, efforts shall be
made to maintain and enhance health of employees and their families.
To promote the health and productivity management for sure, CHO
(Chief Health Officer) was appointed on the same day.
On 20th February, 2018, SMBC Nikko was recognized as one of the
“outstanding health and productivity management organizations
(White 500)”, a good company engaged in health and productivity
management under the “Certified Health & Productivity Management
Organization Recognition Program”, organized by the
Ministry of Economy, Trade
and Industry and the Nippon
Kenko Kaigi.
Analyst Rankings
At the 30th Nikkei the Veritas Analyst Ranking, SMBC Nikko ranked
4th as a broker (3rd in previous year), and four analysts ranked 1st in
the industry sectors. (two analysts in previous year).
Hiroshi Hasegawa, transportation analyst, was the youngest analyst
to be prized in all sector.
SMBC Nikko ranked 3rd as a broker (4th in previous year) at the 23rd
Nikkei Veritas Analyst Rankings for Bond/Currency Analysts and
Economists”, and two analysts ranked 1st in different categories. (one
analyst in previous year)
At Institutional Investor “2018 All-Japan Research Team", ranked 4th
in the category of firm (3rd in previous year), and 3rd for two years in a
row in analyst ranking. 6 teams were selected as top analysts in the
category of industry. (3 teams in previous year)
・Auto Parts : Kunihiro Matsumoto
・REIT : Hiroshi Torii
・Trading Companies : Akira Morimoto
・Transportation/warehousing : Hiroshi Hasegawa
・Auto Parts : Kunihiro Matsumoto
・REIT : Hiroshi Torii
・Steel/Non-ferrous Metals : Atsushi Yamaguchi
・Real Estate/Housing : Junichi Tazawa & Hiroki Kawashima
・Trading Companies : Akira Morimoto
・Transportation/warehousing : Hiroshi Hasegawa
・Bond Analyst : Chotaro Morita
・Securitizing Analyst : Tomohiro Miyasaka

Reference Data

Consolidated Business Results (Quarterly Trend)
19
(Millions of yen) 1Q 2Q 3Q 4Q Total 1Q 2Q 3Q 4Q Total
Operating revenue 81,013 82,070 87,298 110,849 361,232 91,483 91,543 109,773 104,605 397,405
Commissions received 35,335 42,582 40,261 58,983 177,163 41,726 43,495 56,257 57,984 199,464
Brokerage commissions 7,390 6,753 10,167 9,136 33,447 9,165 8,821 12,822 11,785 42,595
Underwriting and distribution
commissions7,518 12,182 6,237 18,061 43,999 5,659 6,820 10,180 9,078 31,739
Flotation and distribution fees 7,529 9,192 8,854 14,687 40,263 10,656 10,304 12,948 16,585 50,495
Other commissions 12,898 14,452 15,002 17,098 59,452 16,243 17,549 20,306 20,534 74,633
Net trading income 36,757 27,294 35,706 35,621 135,379 38,008 34,770 40,493 34,057 147,329
Equities 4,313 161 5,756 6,741 16,972 8,568 5,569 13,506 7,234 34,879
Bonds / Others 32,444 27,132 29,950 28,880 118,407 29,439 29,200 26,987 26,823 112,450
Financial revenue 5,385 8,511 7,633 10,731 32,262 9,600 10,988 10,669 9,740 40,998
Other sales 3,534 3,683 3,696 5,512 16,426 2,148 2,288 2,352 2,822 9,611
Financial expenses 4,653 4,101 6,269 6,506 21,530 7,462 6,769 10,025 7,156 31,414
Cost of sales 2,674 2,547 2,943 4,767 12,932 1,856 2,057 2,090 2,631 8,636
Net operating revenue 73,685 75,422 78,085 99,576 326,769 82,164 82,716 97,657 94,816 357,354
SG&A 58,814 60,720 61,599 69,830 250,965 62,353 62,418 68,254 74,637 267,664
Operating income / loss 14,870 14,701 16,485 29,745 75,804 19,811 20,297 29,402 20,178 89,690
Ordinary income / loss 15,750 15,750 17,195 31,368 80,064 20,960 20,938 30,531 22,552 94,982
Extraordinary income / loss -497 298 -11,277 -2,103 -13,578 -372 -517 -931 -4,210 -6,032
Income before income taxes 15,252 16,049 5,917 29,265 66,485 20,587 20,420 29,599 18,342 88,950
Income taxes 4,499 4,760 1,632 8,635 19,526 6,093 6,054 8,918 4,169 25,237
Profit / loss 10,753 11,289 4,285 20,630 46,958 14,493 14,365 20,681 14,172 63,712
Profit attributable to owners of parent 10,750 11,281 4,279 20,631 46,943 14,491 14,365 20,677 14,170 63,705
FY2016 FY2017
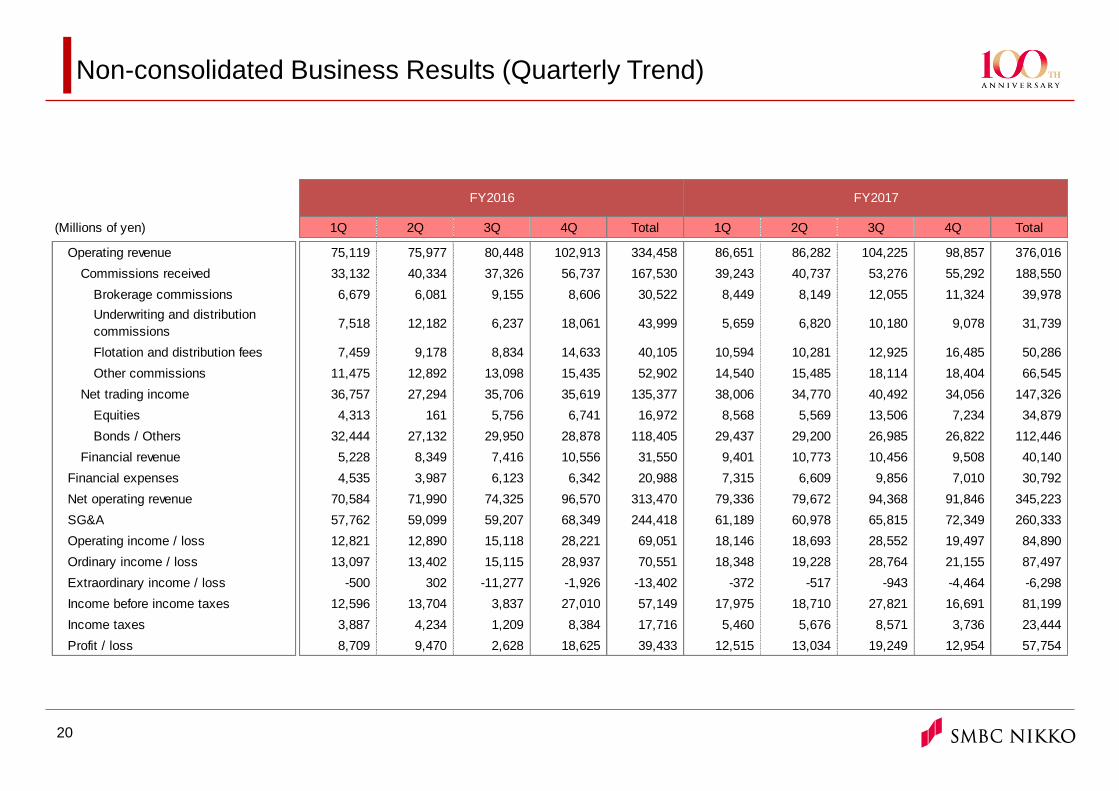
Non-consolidated Business Results (Quarterly Trend)
20
(Millions of yen) 1Q 2Q 3Q 4Q Total 1Q 2Q 3Q 4Q Total
Operating revenue 75,119 75,977 80,448 102,913 334,458 86,651 86,282 104,225 98,857 376,016
Commissions received 33,132 40,334 37,326 56,737 167,530 39,243 40,737 53,276 55,292 188,550
Brokerage commissions 6,679 6,081 9,155 8,606 30,522 8,449 8,149 12,055 11,324 39,978
Underwriting and distribution
commissions7,518 12,182 6,237 18,061 43,999 5,659 6,820 10,180 9,078 31,739
Flotation and distribution fees 7,459 9,178 8,834 14,633 40,105 10,594 10,281 12,925 16,485 50,286
Other commissions 11,475 12,892 13,098 15,435 52,902 14,540 15,485 18,114 18,404 66,545
Net trading income 36,757 27,294 35,706 35,619 135,377 38,006 34,770 40,492 34,056 147,326
Equities 4,313 161 5,756 6,741 16,972 8,568 5,569 13,506 7,234 34,879
Bonds / Others 32,444 27,132 29,950 28,878 118,405 29,437 29,200 26,985 26,822 112,446
Financial revenue 5,228 8,349 7,416 10,556 31,550 9,401 10,773 10,456 9,508 40,140
Financial expenses 4,535 3,987 6,123 6,342 20,988 7,315 6,609 9,856 7,010 30,792
Net operating revenue 70,584 71,990 74,325 96,570 313,470 79,336 79,672 94,368 91,846 345,223
SG&A 57,762 59,099 59,207 68,349 244,418 61,189 60,978 65,815 72,349 260,333
Operating income / loss 12,821 12,890 15,118 28,221 69,051 18,146 18,693 28,552 19,497 84,890
Ordinary income / loss 13,097 13,402 15,115 28,937 70,551 18,348 19,228 28,764 21,155 87,497
Extraordinary income / loss -500 302 -11,277 -1,926 -13,402 -372 -517 -943 -4,464 -6,298
Income before income taxes 12,596 13,704 3,837 27,010 57,149 17,975 18,710 27,821 16,691 81,199
Income taxes 3,887 4,234 1,209 8,384 17,716 5,460 5,676 8,571 3,736 23,444
Profit / loss 8,709 9,470 2,628 18,625 39,433 12,515 13,034 19,249 12,954 57,754
FY2016 FY2017

Operational Indicators -1
21
Sales of Products
Market Share
【non-consolidated】
Source: prepared by SMBC Nikko based on the information published by THOMSON REUTERS
Source: prepared by SMBC Nikko based on the information published by THOMSON REUTERS
Source: prepared by THOMSON REUTERS
(Billions of yen) 1Q 2Q 3Q 4Q Total 1Q 2Q 3Q 4Q Total
Investment trusts 561.9 583.2 560.6 647.9 2,353.6 550.7 566.0 661.3 1,013.0 2,790.9
(Equity investment trusts) ( 392.8 ) ( 471.3 ) ( 420.0 ) ( 512.4 ) ( 1,796.4 ) ( 453.7 ) ( 462.0 ) ( 542.0 ) ( 859.5 ) ( 2,317.2 )
(Foreign registered investment trusts) ( 68.4 ) ( 80.5 ) ( 74.5 ) ( 108.3 ) ( 331.8 ) ( 71.1 ) ( 88.3 ) ( 102.8 ) ( 136.6 ) ( 398.9 )
Fund wrap 74.8 93.1 92.1 84.9 345.0 105.6 102.4 136.9 65.3 410.1
Foreign bonds (*1) 657.0 638.8 690.4 794.8 2,781.0 787.3 725.2 735.8 755.7 3,004.0
(Foreign currency bonds) ( 214.0 ) ( 219.8 ) ( 239.9 ) ( 202.2 ) ( 875.9 ) ( 221.2 ) ( 256.6 ) ( 153.4 ) ( 226.5 ) ( 857.6 )
Domestic bonds 1,021.8 1,357.8 794.8 1,094.1 4,268.5 1,041.6 773.9 991.7 677.3 3,484.4
(Retail target JGBs) ( 132.0 ) ( 184.4 ) ( 178.3 ) ( 349.4 ) ( 844.1 ) ( 129.1 ) ( 175.0 ) ( 132.7 ) ( 198.7 ) ( 635.5 )
Public offering 51.1 117.5 88.8 238.0 495.5 35.8 156.6 119.5 136.5 448.3
Annuity / insurance 10.0 4.3 11.6 8.9 34.8 8.5 16.6 24.2 17.5 66.8
Total (*2) 2,376.5 2,794.9 2,238.4 2,868.7 10,278.4 2,529.5 2,340.6 2,669.3 2,665.2 10,204.7
(*1) Foreign bonds sales include already-issued bonds and yen-denominated foreign bonds.
(*2) include sale of fund w rap from FY 2017 1Q
FY2017FY2016
1Q 2Q 3Q 4Q 1Q 2Q 3Q 4Q
ECM Global Equity (*1) 19.9% 19.3% 18.6% 19.0% 9.9% 6.2% 8.6% 11.4%
DCM All bonds in Yen (*2) 20.4% 18.2% 16.8% 17.2% 19.5% 16.1% 16.9% 17.2%
M&A Japan related (*3) 6.7% 14.7% 15.0% 14.3% 14.8% 9.1% 9.1% 9.1%
( *1 ) Global Equity & Equity-Related-Japan : Book runner
( *2 ) All Bonds in Yen, Lead manager
( *3 ) Any Japanese involvement announced : Rank value
FY2016 FY2017
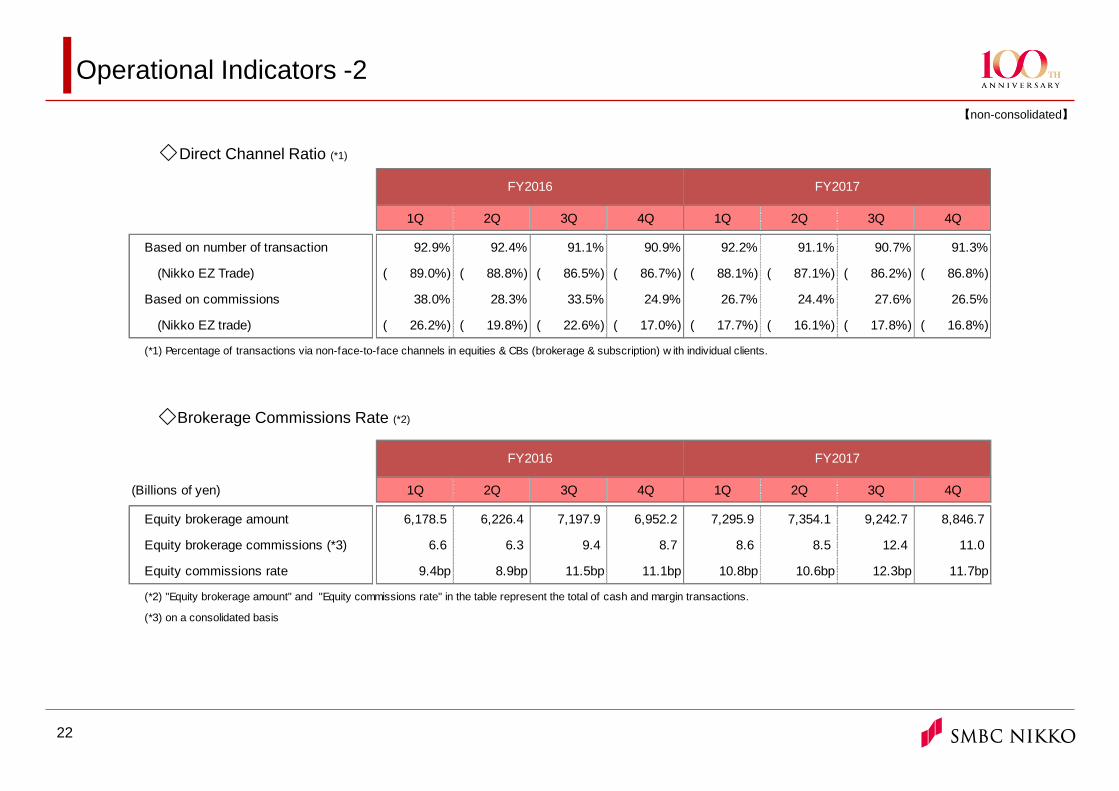
Direct Channel Ratio (*1)
Brokerage Commissions Rate (*2)
Operational Indicators -2
22
【non-consolidated】
1Q 2Q 3Q 4Q 1Q 2Q 3Q 4Q
Based on number of transaction 92.9% 92.4% 91.1% 90.9% 92.2% 91.1% 90.7% 91.3%
(Nikko EZ Trade) 89.0%) ( 88.8%) ( 86.5%) ( 86.7%) ( 88.1%) ( 87.1%) ( 86.2%) ( 86.8%) (
Based on commissions 38.0% 28.3% 33.5% 24.9% 26.7% 24.4% 27.6% 26.5%
(Nikko EZ trade) 26.2%) ( 19.8%) ( 22.6%) ( 17.0%) ( 17.7%) ( 16.1%) ( 17.8%) ( 16.8%) (
(*1) Percentage of transactions via non-face-to-face channels in equities & CBs (brokerage & subscription) w ith individual clients.
FY2017FY2016
(Billions of yen) 1Q 2Q 3Q 4Q 1Q 2Q 3Q 4Q
Equity brokerage amount 6,178.5 6,226.4 7,197.9 6,952.2 7,295.9 7,354.1 9,242.7 8,846.7
Equity brokerage commissions (*3) 6.6 6.3 9.4 8.7 8.6 8.5 12.4 11.0
Equity commissions rate 9.4bp 8.9bp 11.5bp 11.1bp 10.8bp 10.6bp 12.3bp 11.7bp
(*2) "Equity brokerage amount" and "Equity commissions rate" in the table represent the total of cash and margin transactions.
(*3) on a consolidated basis
FY2016 FY2017

Number of Accounts
Number of Branches
Number of Employees
Operational Indicators -3
23
【non-consolidated】
• Overseas offices total is defined as the total of: Employees of consolidated subsidiaries which are SMBC Nikko Securities (Hong Kong) and SMBC Nikko Securities (Singapore) . Employees of affiliated companies which are Securities Product Group of SMBC Nikko Capital Markets and SMBC Nikko Securities America.
【non-consolidated】
(Thousands of accounts) Jun.16 Sep.16 Dec.16 Mar.17 Jun.17 Sep.17 Dec.17 Mar.18
Total accounts 2,739 2,759 2,775 2,801 2,813 2,829 2,838 3,327
Cash management accounts 2,405 2,426 2,446 2,473 2,486 2,500 2,512 2,851
Newly opened accounts 33 39 37 42 31 30 30 41
Jun.16 Sep.16 Dec.16 Mar.17 Jun.17 Sep.17 Dec.17 Mar.18
Number of branches 123 124 124 124 124 124 123 148
Jun.16 Sep.16 Dec.16 Mar.17 Jun.17 Sep.17 Dec.17 Mar.18
Number of employees 10,352 10,325 10,198 10,112 10,698 10,559 10,456 11,987
Number of 4 overseas employees 443 457 467 480 491 524 556 579
FY2017
FY2016 FY2017
FY2016
FY2017FY2016
