earnings conference call third quarter...
TRANSCRIPT

Earnings Conference CallThird Quarter 2007
November 20, 2007

2
Safe Harbor Statement
The Private Securities Litigation Reform Act of 1995 (the “Act”) provides protection from liability in private lawsuits for “forward-looking” statements made by public companies under certain circumstances, provided that the public company discloses with specificity the risk factors that may impact its future results. We want to take advantage of the “safe harbor” provisions of the Act. Certain statements made during this presentation are ‘forward-looking’ statements under the Act. Except for historical financial and business performance information, statements made during this presentation should be considered ‘forward-looking’ as referred to in the Act. Much of the information that looks towards future performance of our company is based on various factors and important assumptions about future events that may or may not actually come true. As a result, our operations and financial results in the future could differ materially and substantially from those we have discussed in the forward-looking statements made during this presentation. Certain risks and uncertainties are detailed from time to time in our filings with the United States Securities and Exchange Commission (“SEC”). You are strongly urged to review all such filings for a more detailed discussion of such risks and uncertainties. During portions of today’s presentation, we may refer to results which are not GAAP numbers. A reconciliation of non-GAAP numbers to GAAP results is available on our web site at www.officedepot.com.

3
Third Quarter 2007 Summary
• Total company sales grew 2% versus the third quarter of 2006
• Reported GAAP and adjusted diluted earnings per share of $0.43
• Third quarter 2007 adjusted earnings per share down 9% versus same period one year ago
• Benefited by low adjusted effective tax rate
• Operating earnings impacted by weak late quarter performance in North American Retail and International
• Reducing costs and discretionary spending across the entire organization
• Continued focus on targeting profitable growth

4
Company Action Plan
• In North American Retail, we’re improving our offering to the small business customer and moderating capital spending– Reducing new store openings – moving to about 70 in 2007 with
a new target of about 75 for 2008
– Continuing with M2 store remodels – a critical investment in our future
• In North American Business Solutions, we’re refocusing our efforts on winning the profitable small and mid-sized customers
• In International, we’re focused on the United Kingdom
• Increasing private brand penetration a key initiative
• Share repurchases as a good use of excess cash
• Continuing to review our overall capital structure

5
North American Retail – Results
-190 bps6.4%4.5%Division Operating Margin
-30%$ 114$ 80Division Operating Profit
3%-5%Comparable Sales
0%$ 1,768$ 1,772Sales
B/WQ3 06Q3 07in millions, except ratios and statistics
6
North American Retail - Results
• Sales in our North American Retail Division flat, comparable store sales down 5% for the quarter
• Operating profit of $80M, down 30% for the quarter after 14 quarters of growth– Highly promotional with disappointing sales and margin impacts
• Competitive Back-to-School season• Inventory clearance activities• Sales mix shift to lower margin technology from furniture and
supplies– Vendor program support was less than expected due to
challenging business environment– De-leveraging property costs with negative comparable sales– Offset partially by managing variable costs aggressively while
improving customer service scores in our stores
• All comparable sales decline due to reduced store traffic
7
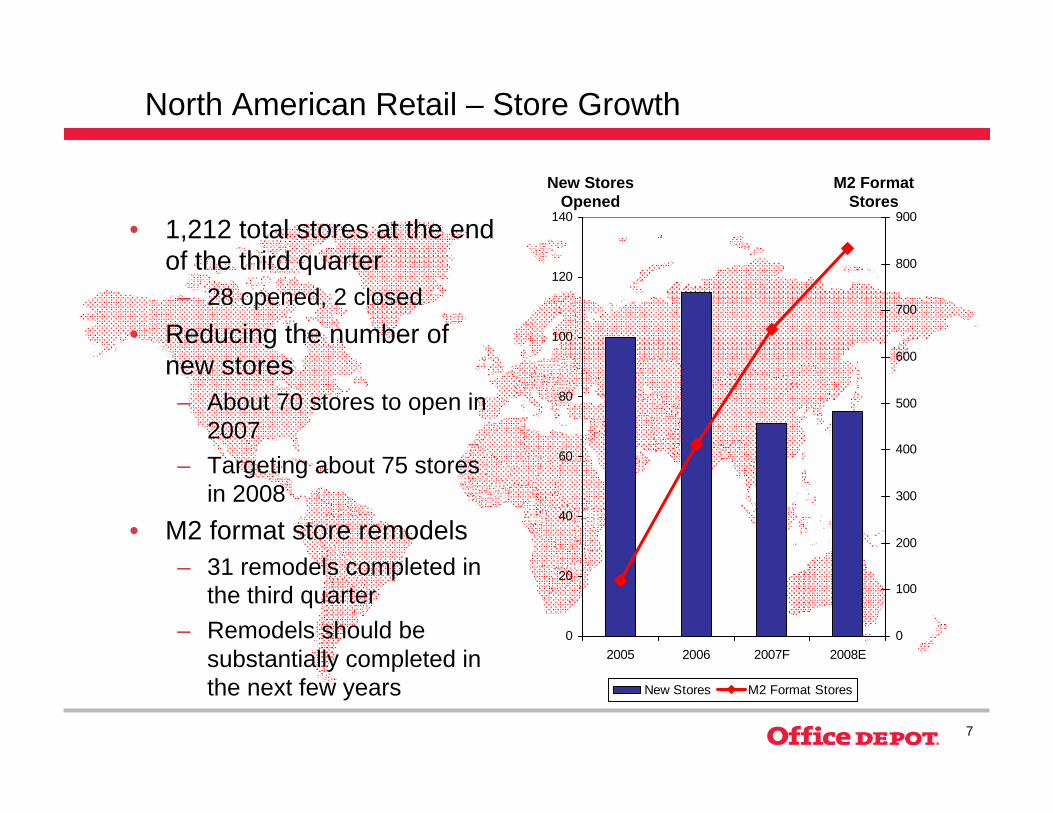
• 1,212 total stores at the end of the third quarter– 28 opened, 2 closed
• Reducing the number of new stores – About 70 stores to open in
2007– Targeting about 75 stores
in 2008• M2 format store remodels
– 31 remodels completed in the third quarter
– Remodels should be substantially completed in the next few years
0
20
40
60
80
100
120
140
2005 2006 2007F 2008E0
100
200
300
400
500
600
700
800
900
New Stores M2 Format Stores
North American Retail – Store Growth
New Stores Opened
M2 Format Stores

8
1) Expand private brand– Increasing penetration in
major product categories– Customer service program for
private branded products2) Emphasize loyalty program
– Relaunch Worklife Rewards– Best loyalty program in the
industry for our small business customers
3) Enhance Design, Print and Ship offering– Growing at a rapid pace – Xerox Certified Print
Specialists
North American Retail – Action Plan

9
North American Retail – Action Plan (cont’d)
4) Refine assortment to offer better value proposition for very small business customers– Greater options for smaller pack sizes, entry price points, bonus
packs in Supplies5) Expand exclusive offerings to address small business
customer needs– Includes Tech Depot service offering and small business
financing6) Increase store productivity by further reducing and simplifying
store operational tasks– Reinforced with guaranteed low-price value proposition
7) Manage marketing spend to target most valuable customers through the highest returning vehicles– Increasing direct mail and e-mail
10
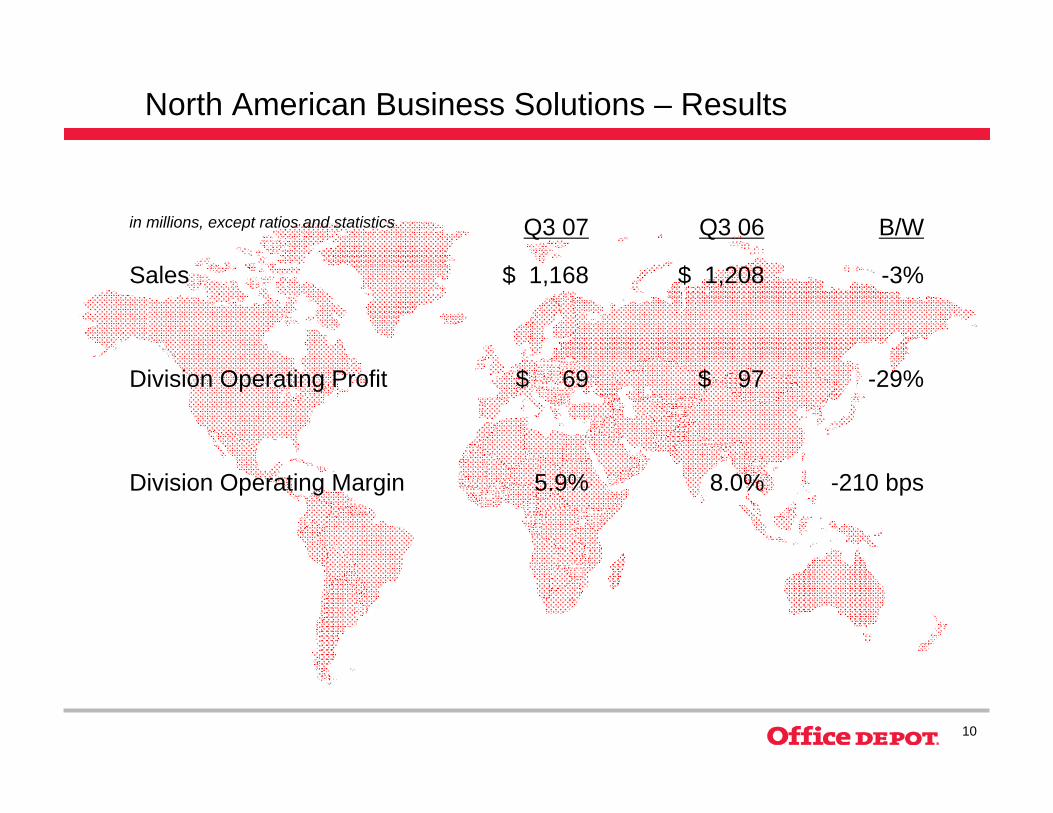
North American Business Solutions – Results
-210 bps8.0%5.9%Division Operating Margin
-29%$ 97$ 69Division Operating Profit
-3%$ 1,208$ 1,168Sales
B/WQ3 06Q3 07in millions, except ratios and statistics

11
North American Business Solutions - Results
• Sales in our North American Business Solutions Division were down 3% for the quarter– Small to mid-size customer loss
– Partially offset by 8% sales growth with national account Contract customers and double-digit growth in sales to public sector
• Operating profit of $69M, down 29% for the quarter– Greater large Contract customer mix negatively impacted
margins
– Growth in private brand, lower performance-based variable pay and contract pricing management were offset by continued impacts of cost increases, including paper-related products

12
Jan Feb March April May June July Aug Sep
Sale
s pe
r Bus
ines
s D
evel
opm
ent M
anag
erNorth American Business Solutions – Initiatives
New Contract sales force additions are on track
2007
2006

13
North American Business Solutions – Issues
1) Direct channel - losing sales in small-sized customer base
2) Allied customer and key sales people recovery continues
3) Largest but lowest margin customers have been growing at the fastest rate
4) Coverage and retention issues exist with small to medium-sized customers
5) Existing incentive system limits accountability and P&L responsibility
6) Strong focus on acquiring new customers but not enough emphasis on growing positions with existing customers
7) Sales organization is often engaged in non-productive activities
8) Need more effective marketing

14
North American Business Solutions – Action Plan
1) Restore growth to the small to mid-sized customer base– Reorganizing mix of Business Development Managers and
Account Managers to increase coverage– Developing a detailed behavior-based contact strategy
2) Partnering with vendors– Creating specific account and coverage plans, new catalog and
internet layouts, and new solution-based programs3) Developing comprehensive behavior-based segmentation
program for every customer segment – The right contact strategy (catalog, direct mail, e-mails)
4) Implemented Northeast turnaround strategy – Focuses on continued rejuvenation of the former Allied
business
15
North American Business Solutions – Action Plan (cont’d)
5) Launching new strategy for telephone account managers to reenergize small customer growth – New hiring standards and key performance metrics, revised
training programs, and comprehensive marketing support6) Minimizing Contract sales organization’s engagement in non-
productive administrative activities – Launching three initiatives to limit Contract sales organization’s
time spent on non-customer-facing activities7) Launching a revised marketing, merchandising, field sales
and inside sales operational structure – New marketing structure/leadership will own and drive
accountability for overall product, segment and business strategy
– Testing incremental customer contact strategy in fourth quarter

16
International – Results
-160 bps6.3%4.7%Division Operating Margin
-14%$ 55$ 47Division Operating Profit
9%5%Change in Local Currency Sales
13%$ 882$ 995Sales
B/WQ3 06Q3 07In millions, except ratios and statistics
17
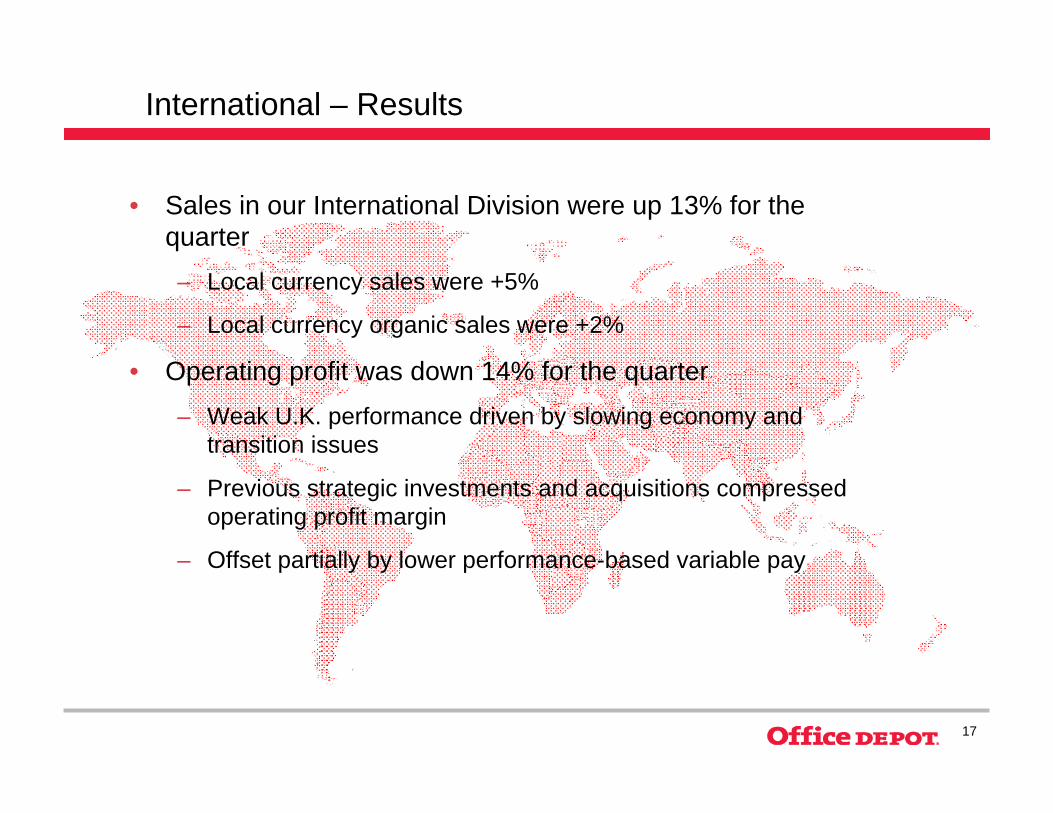
International – Results
• Sales in our International Division were up 13% for the quarter– Local currency sales were +5%
– Local currency organic sales were +2%
• Operating profit was down 14% for the quarter– Weak U.K. performance driven by slowing economy and
transition issues
– Previous strategic investments and acquisitions compressed operating profit margin
– Offset partially by lower performance-based variable pay
18
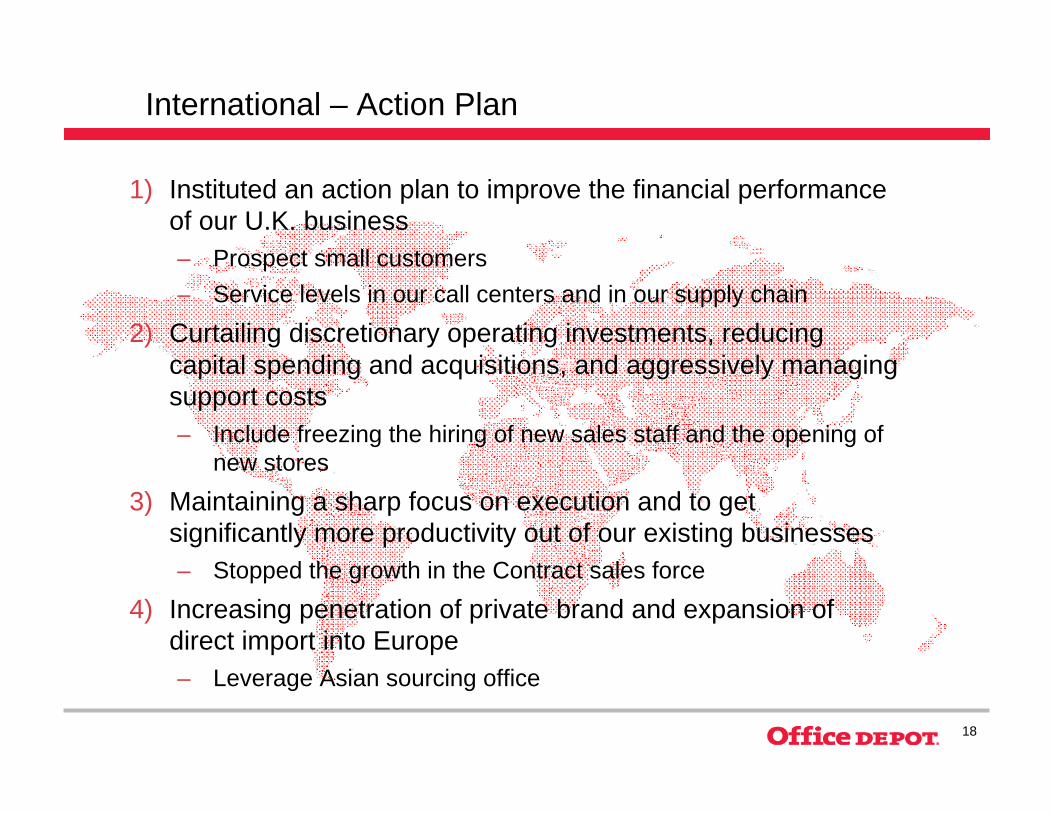
International – Action Plan
1) Instituted an action plan to improve the financial performance of our U.K. business– Prospect small customers– Service levels in our call centers and in our supply chain
2) Curtailing discretionary operating investments, reducing capital spending and acquisitions, and aggressively managing support costs– Include freezing the hiring of new sales staff and the opening of
new stores 3) Maintaining a sharp focus on execution and to get
significantly more productivity out of our existing businesses– Stopped the growth in the Contract sales force
4) Increasing penetration of private brand and expansion of direct import into Europe – Leverage Asian sourcing office
19
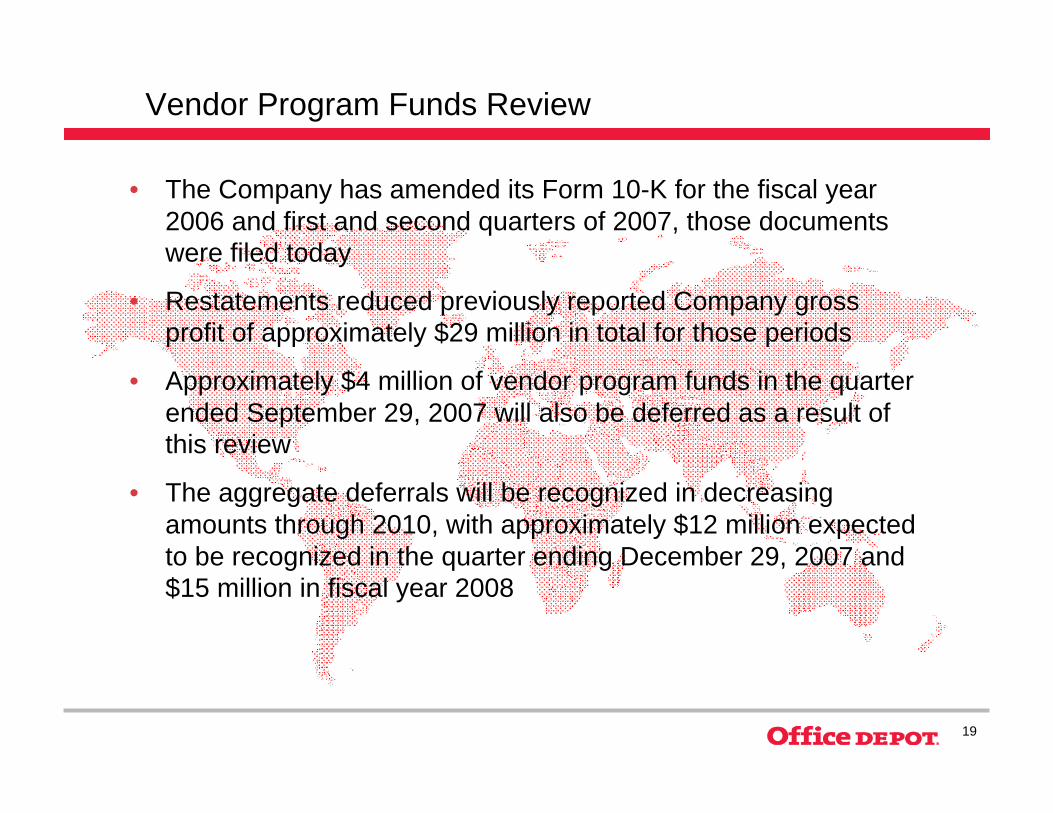
Vendor Program Funds Review
• The Company has amended its Form 10-K for the fiscal year 2006 and first and second quarters of 2007, those documents were filed today
• Restatements reduced previously reported Company gross profit of approximately $29 million in total for those periods
• Approximately $4 million of vendor program funds in the quarter ended September 29, 2007 will also be deferred as a result of this review
• The aggregate deferrals will be recognized in decreasing amounts through 2010, with approximately $12 million expected to be recognized in the quarter ending December 29, 2007 and $15 million in fiscal year 2008

20
2007 Private BrandDirect Import
Centralization Supply ChainProcurement
IT Conversion MarginCompression
2012
+150bps
+120bps+60bps
+40bps -70bps
Global Margin Improvement Initiative (2007 – 2012)

21
-50 bps0%25.7%$ 99025.2%$ 992Operating Expense1
-80 bps--14.7%--13.9%ROIC1
---9%$ 0.47--$ 0.43EPS1
---4%$ 0.45--$ 0.43EPS – GAAP
---4%284.9--274.4Diluted Shares
-30 bps-9%3.3%$ 1293.0%$ 117Net Earnings - GAAP
-50 bps-13%3.5%$ 1343.0%$ 117Net Earnings1
-180 bps-35%5.1%$ 1973.3%$ 128EBIT1
--2%$ 3,857--$ 3,935Sales
bps%% SalesAmount% SalesAmount
B/WQ3 06Q3 07in millions, except ratios, returns and per share data
1Non-GAAP numbers. A reconciliation of GAAP to non-GAAP numbers can be found on the Office Depot web site at www.officedepot.com.
Consolidated Financials - Third Quarter 2007

22
$ 271$ 14 $ 6$ 251$ 2$ 4Non-Cash
$ 190$ 60 $ 11$ 119$ 3$ (3)Cash
Cash Flow Impact
$ 461$ 74$ 17$ 370$ 5$ 1Income Statement Charges
Total2008Q4 2007Program to Date20062007
Q3in millions
Charges
During the third quarter of 2005, we announced a number of material charges relating to asset impairments, exit costs and other operating decisions (the “Charges”). This announcement followed a wide-ranging assessment of assets and commitments which began in the second quarter of 2005. We indicated that these actions would continue to impact our results for several years, and expenses associated with future activities would be recognized as the individual plans are implemented and the applicable accounting recognition criteria are met. As with any estimate, the amounts may change when expenses are incurred. From inception through the end of the third quarter of 2007, we have recorded $370 million of Charges.

23
Cash Flow Highlights
-79%$ 575$ 121Free Cash Flow (Before Share Repurchases)
-77%$ 871$ 200Share Repurchases
53%$ 218 $ 334CAPEX
-76%$ 200$ 48Acquisitions
-6%$ 773$ 726EBITDA1
1%$ 205$ 206Depreciation & Amortization
-43%$ 792$ 455Net Cash Provided by Operating Activities
% ChangeQ3 YTD 06Q3 YTD 07in millions
1Non-GAAP numbers. A reconciliation of GAAP to non-GAAP numbers can be found on the Office Depot web site at www.officedepot.com.
24
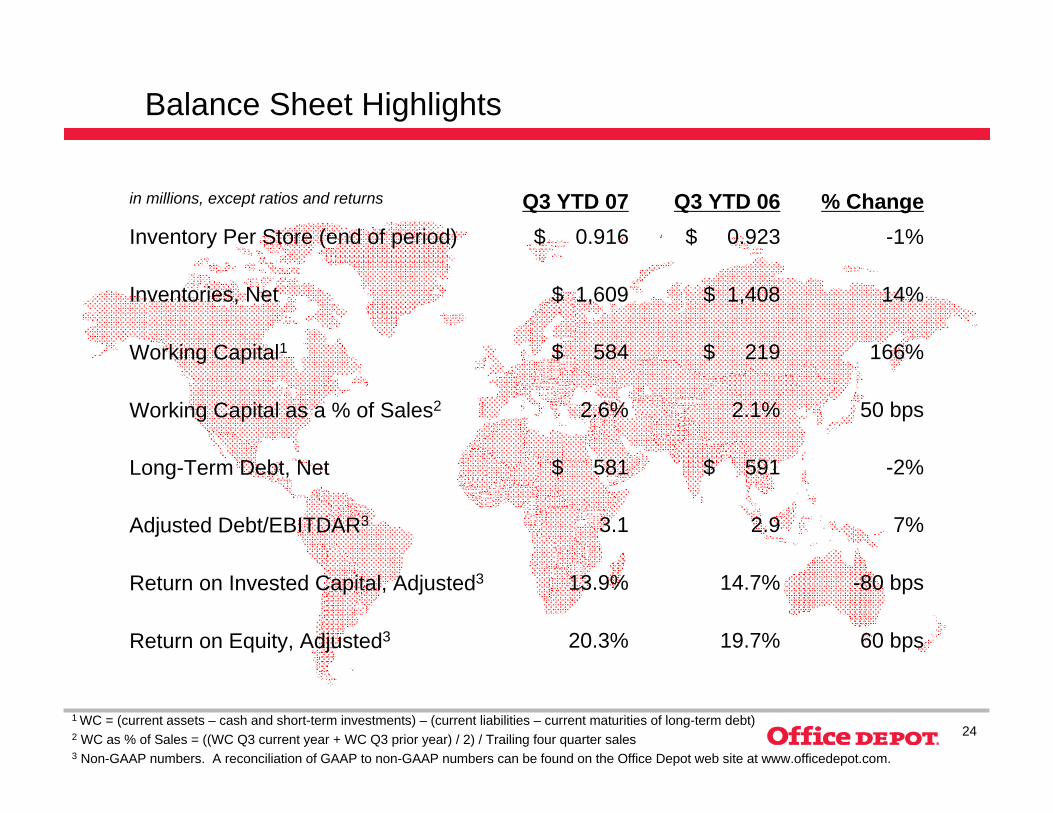
Balance Sheet Highlights
-80 bps14.7%13.9%Return on Invested Capital, Adjusted3
50 bps2.1%2.6%Working Capital as a % of Sales2
60 bps19.7%20.3%Return on Equity, Adjusted3
7%2.93.1Adjusted Debt/EBITDAR3
-2%$ 591$ 581Long-Term Debt, Net
166%$ 219$ 584Working Capital1
14%$ 1,408$ 1,609Inventories, Net
-1%$ 0.923$ 0.916Inventory Per Store (end of period)% ChangeQ3 YTD 06Q3 YTD 07in millions, except ratios and returns
1 WC = (current assets – cash and short-term investments) – (current liabilities – current maturities of long-term debt)2 WC as % of Sales = ((WC Q3 current year + WC Q3 prior year) / 2) / Trailing four quarter sales3 Non-GAAP numbers. A reconciliation of GAAP to non-GAAP numbers can be found on the Office Depot web site at www.officedepot.com.
25
Strategic Priorities
• Economic environment remains uncertain so we’re focusing on things we can control– Reducing capital spending
– Moderating discretionary spending
– Driving cash flow generation
• North American Retail – Improving store productivity
• North American Business Solutions– Profitably growing market share with small to medium size
customers
• International– Improving cost structure and profitably grow market share
• Reviewing capital structure options

26
Outlook
• Fourth quarter outlook– Sales to date in North America have been softer than third quarter
– Continued margin decline versus a year ago
– No tax benefit anticipated
– More significant earnings per share decline likely
• Longer term, business model can deliver improved results– Mid-single digit top-line growth
– Mid-teens earnings per share growth, with some margin growth however
– Total Margin expansion possible of up to 300 basis points
27
Q & A

28
Appendix

29
-80 bps--13.9%ROIC1
60 bps----20.3%ROE1
--11%--$ 1.95EPS1
---6%--277.7Diluted Shares
0 bps4%3.5%$ 541Net Earnings1
-40 bps-5%4.8%$ 746EBIT1
--4%--$ 15,504Sales
bps%% SalesAmount
B/W(Previous)
Trailing Four Quarters (Ending Q3’07)
in millions, except ratios, returns and per share data
1Non-GAAP numbers. A reconciliation of GAAP to non-GAAP numbers can be found on the Office Depot web site at www.officedepot.com.
Consolidated Financials – Trailing Four Quarters

Earnings Conference CallThird Quarter 2007
November 20, 2007