earnings of 1h fy2010/3...imaging color paper and chemicals photofinishing equipment labs and fdi...
TRANSCRIPT

FORWARD-LOOKING STATEMENTSForward-looking statements such as those relating to earnings forecasts and other projections contained in thismaterial are management’s current assumptions and beliefs based on currently available information. Such forward-looking statements are subject to a number of risks, uncertainties and other factors. Accordingly, actual results maydiffer materially from those projected due to various factors.
FORWARD-LOOKING STATEMENTSForward-looking statements such as those relating to earnings forecasts and other projections contained in thismaterial are management’s current assumptions and beliefs based on currently available information. Such forward-looking statements are subject to a number of risks, uncertainties and other factors. Accordingly, actual results maydiffer materially from those projected due to various factors.
October 30, 2009
Earnings of 1H FY2010/3Earnings of 1H FY2010/3(April 1 (April 1 -- September 30, 2009)September 30, 2009)

11
Revenue and profit down amid an operating environment that continued to be harsh, reflecting the worldwide economic recession
The implementation of structural reform measuresproceeded ahead of the planned schedule
Performance Summary for 1H FY2010/3
1H FY2009/3(Apr. - Sep. 2008)
1H FY2010/3(Apr. - Sep. 2009)
Change
Amount %
Revenue 100.0% 1,338.4 100.0% 1,043.5 (294.9) (22.0)
Operating Income Before Restructuring and Other Charges 6.4% 85.3 2.5% 26.6 (58.7) (68.8)
Restructuring and Other Charges 0.3% 4.1 3.3% 35.2 31.1 -
Operating Income AfterRestructuring and Other Charges 6.1% 81.2 (0.8%) (8.6) (89.8)
-
Income Before Income Taxes 6.1% 81.7 (0.8%) (8.0) (89.7) -
Net Income Attributable to FUJIFILM Holdings 3.4% 45.3 (0.5%) (5.4) (50.7) -
Net Income Attributable to FUJIFILM Holdings per Share ¥89.97 ¥(11.07) ¥(101.04)
Exchange Rates US$€
¥106¥163
¥96¥133
¥(10)¥(30)
(Billions of yen)
(Billions of yen)

22
(Billions of yen)85.3
-19.3
Raw materials prices
Exchange ratesfluctuations
Less profit bydecrease in demand
1H FY2009/3(Apr.-Sep., ‘08)
Analysis of Operating Income Before Restructuring and Other Charges in 1H FY2010/3(Change from previous fiscal year)
-44.7
26.6+5.3
Performance Summary for 1H FY2010/3
1H FY2010/3(Apr.-Sep., ‘09)
Imaging Solutions: - 0.8Information Solutions: -24.3Document Solutions: -19.6

33
1Q FY2009/3 (Apr. - Jun. 2008)
2Q FY2009/3 (Jul. - Sep. 2008) %
1Q FY2010/3(Apr. - Jun. 2009)
2Q FY2010/3(Jul - Sep. 2009) %
Revenue 100.0% 653.7 100.0% 684.7 4.8 100.0% 502.4 100.0% 541.1 7.7
Operating Income Before Restructuring and Other Charges 7.3% 47.6 5.5% 37.7 -21.0 1.5% 7.6 3.5% 19.0 151.9
Restructuring and Other Charges 0.3% 1.7 0.3% 2.4 - 2.0% 10.3 4.6% 24.9 -
Operating Income AfterRestructuring and Other Charges 7.0% 45.9 5.2% 35.3 -23.1 -0.5% -2.7 -1.1% -5.9 -
Income Before Income Taxes 8.4% 55.0 3.9% 26.7 -51.4 0.2% 1.2 -1.7% -9.2 -
Net Income Attributable to FUJIFILM Holdings 4.9% 31.9 2.0% 13.4 -57.9 -0.1% -0.7 -0.9% -4.7 -
Net Income Attributable to FUJIFILM Holdings per Share ¥63.31 ¥26.66
¥(36.65)¥(1.42) ¥(9.65)
¥(8.23)
Exchange Rates US$
€
¥104
¥163
¥108
¥162
¥4
¥(1)¥97
¥133
¥94
¥133
¥(3)
-
Major improvement in operating income before restructuring and other charges because of the effectiveness of structural reforms
Performance Summary for 2Q
(Billions of yen)

44
1H FY'08/3 1H FY'09/3 1H FY'10/3
0.2
1H FY'08/3 1H FY'09/3 1H FY'10/3
ImagingSolutions
InformationSolutions
DocumentSolutions
9.7
50.5
16.4
76.6
7.2
34.7
14.6
56.7
4.1
15.3
21.2
40.6
20.2
49.8
38.8
109.0
12.3
55.0
38.0
105.6
11.4
48.5
33.6
93.7ImagingSolutions
InformationSolutions
DocumentSolutions
Corporate
Capital Expenditure
Billions of yen
Depreciation & Amortization
0.3 0.2
Decrease in capital expenditure and depreciation & amortization
Capital Expenditure and Depreciation & Amortization
0.2Corporate
-28%
-11.9
55
151.0133.1
113.6
86.9
37.446.2
119.9
1H FY' 08/3 1H FY' 09/3 1H FY' 10/3
179.4
59.5
From operating activities ■From investing activities ■Free cash flow
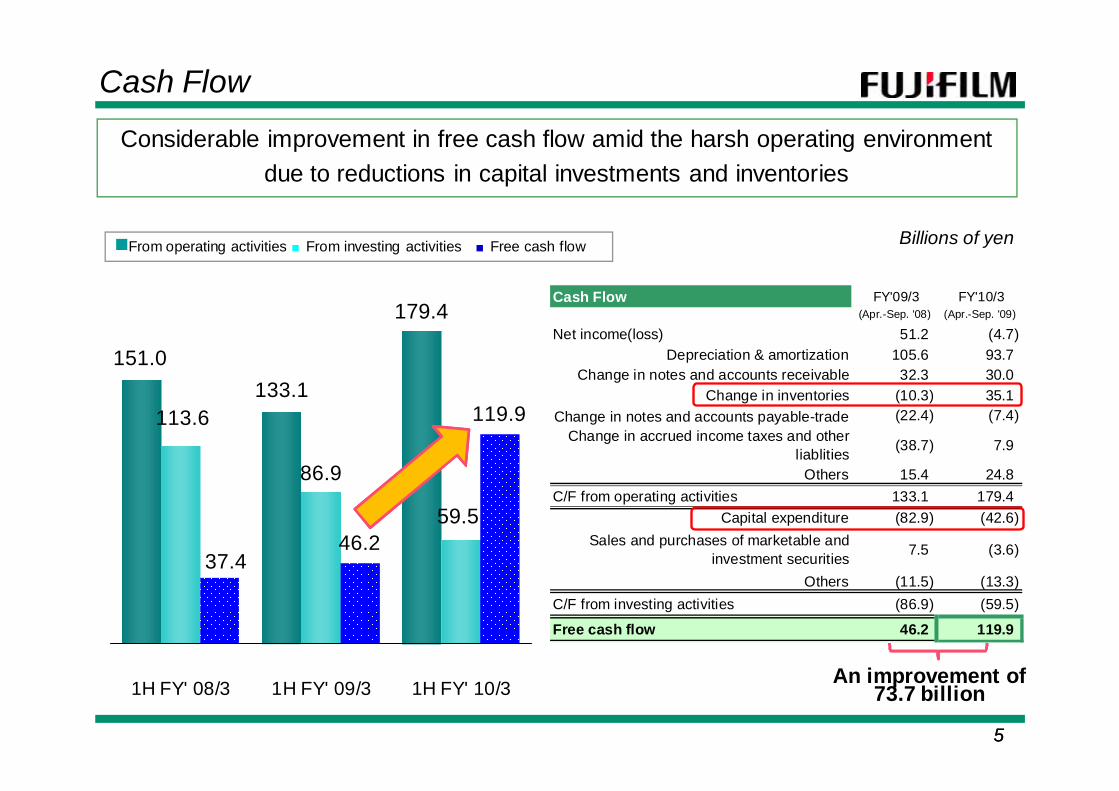
Considerable improvement in free cash flow amid the harsh operating environment due to reductions in capital investments and inventories
Cash Flow
Billions of yen
An improvement of 73.7 billion
Cash Flow FY'09/3 FY'10/3(Apr.-Sep. '08) (Apr.-Sep. '09)
Net income(loss) 51.2 (4.7)Depreciation & amortization 105.6 93.7
Change in notes and accounts receivable 32.3 30.0Change in inventories (10.3) 35.1
Change in notes and accounts payable-trade (22.4) (7.4)Change in accrued income taxes and other
liablities (38.7) 7.9
Others 15.4 24.8C/F from operating activities 133.1 179.4
Capital expenditure (82.9) (42.6)Sales and purchases of marketable and
investment securities 7.5 (3.6)
Others (11.5) (13.3)C/F from investing activities (86.9) (59.5)
Free cash flow 46.2 119.9
66
169.4
231.1
-7.5
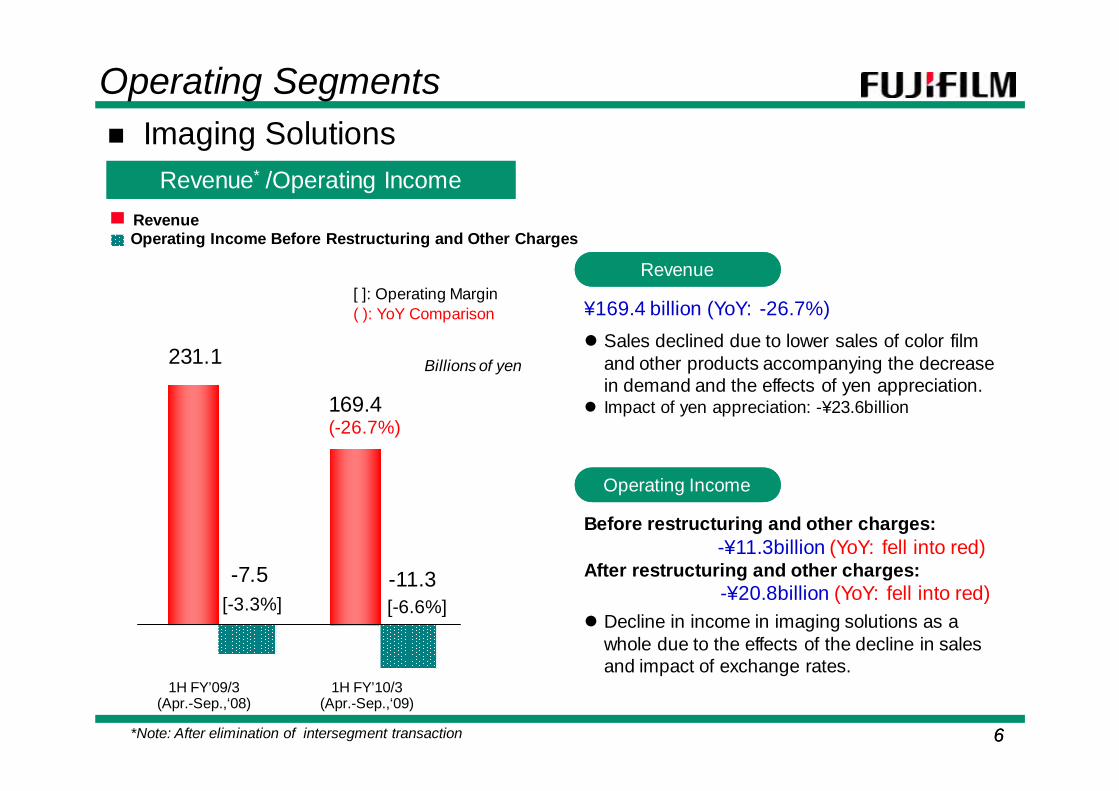
Imaging Solutions
Sales declined due to lower sales of color film and other products accompanying the decrease in demand and the effects of yen appreciation.Impact of yen appreciation: -¥23.6billion
¥169.4 billion (YoY: -26.7%)
RevenueRevenue
Operating IncomeOperating Income
Operating Segments
Billions of yen
*Note: After elimination of intersegment transaction
Revenue* /Operating IncomeRevenue* /Operating Income
Before restructuring and other charges: -¥11.3billion (YoY: fell into red)
After restructuring and other charges: -¥20.8billion (YoY: fell into red)
(-26.7%)
[-3.3%]Decline in income in imaging solutions as a whole due to the effects of the decline in sales and impact of exchange rates.
[-6.6%]
[ ]: Operating Margin( ): YoY Comparison
RevenueOperating Income Before Restructuring and Other Charges
-11.3
1H FY’09/3(Apr.-Sep.,‘08)
1H FY’10/3(Apr.-Sep.,‘09)

77
Color Films and OthersColor Films and Others
Color Filmsand Others
ElectronicImaging
Color Paperand Chemicals
PhotofinishingEquipment
Labs andFDi services
Operating Segments Imaging Solutions
Billions of yen
29.5
56.4
17.938.0
67.1
231.1
Sub-segment RevenueSub-segment Revenue¥17.9billion (YoY: -39%)
13%
Electronic ImagingElectronic Imaging
Color Paper and ChemicalsColor Paper and Chemicals
¥50.6billion (YoY: -25%)
¥42.6billion (YoY: -24%)
Continued revenue decrease due to market shrinkage
17%
%: Proportion of sub-segment revenue
8%
29%
24% Although revenues declined because of yen appreciation and declines in unit prices, this business returned to profitability on an operational basis owing to reductions in manufacturing costs, cuts in fixed costs, decrease in inventories, and other factors.On a world wide basis, sales volume of digital cameras during 1H FY’10/3 amounted to approximately 4.0 million units.Aimed for differentiation through high-value-added products, as typified by FinePix F70EXR and FinePix REAL 3D System, while also developing the lineup of entry-level models with strengthened cost-competitiveness, such as the A170 and A220. Expanded sales especially in the BRICs, etc.
.
169.417.911%
42.625%
11.5 7%28.9
17%
50.630%
1H FY’09/3(Apr.-Sep.,‘08)
1H FY’10/3(Apr.-Sep.,‘09)
Expanding marketing promotion measures related to high-value-added print offerings, such as photo books and on-line photo servicesImplemented measures to increase market share in major countries

88
Information SolutionsOperating Segments
*Note:After elimination of intersegment transaction
RevenueRevenue
Operating IncomeOperating Income
Revenue* /Operating IncomeRevenue* /Operating Income
Decrease in mainstay product and decrease in income due to the effects of yen appreciation
430.1
49.8
21.3
(-20.6%)
[9.2%]
¥430.1billion (YoY: -20.6%)Decline in revenues because of the decrease in revenues of the graphic arts and optical devices businesses as a result of the impact of the global recession Impact of yen appreciation: -¥29.0 billion
541.5
(-57.4%)[4.9%]
Billions of yen
[ ]: Operating Margin( ): YoY Comparison
Before restructuring and other charges: ¥21.3billion (YoY: -57.4%)
After restructuring and other charges: ¥4.9billion (YoY: -89.7%)
RevenueOperating Income Before Restructuring and Other Charges
1H FY’09/3(Apr.-Sep.,‘08)
1H FY’10/3(Apr.-Sep.,‘09)

99
Medical Systems / Life SciencesMedical Systems / Life Sciences
Graphic ArtsGraphic Arts
Operating Segments Information Solutions
Medical Systems/ Life Sciences
GraphicArts
FPD Materials
RecordingMedia
Office& Industry
[Optical Devices]
Billions of yen
133.7
150.3
115.2
38.998.6
Sales declined as the effects of the economic downturn continued. Demand for printing plate materials showed a recovery trend in China and Southeast Asia.In digital printing field, robust sales of wide-format inkjet systems.
Manufacturers of polarizing plates and panels completed inventory adjustments, and, in part because of the demand stimulus policies of the Chinese government, sales of FUJITAC and WV Film recovered. Initiated full-scale operations at the No. 9 WV Film manufacturing plant in July 2009.
FPD MaterialsFPD Materials
Although the effects of the global economic downturn are expected to persist in the optical device field, orders for camera phone lens units are on a recovery trend.
Office & IndustryOffice & Industry
541.5
Sub-segment RevenueSub-segment Revenue
25%
¥119.9billion (YoY: -10%)
¥111.8billion (YoY: -26%)
¥106.9billion (YoY: -7%)
¥63.5billion (YoY: -36%)
28%
21%
7%
[52.8]18%
%: Proportion of sub-segment revenue
430.1
119.928%
111.826%
106.925%
24.7 6%63.5
15%[28.7]
Sales declined due to the economic downturn, lower demand for film as a result of the impact of last year’s revision to the national healthcare reimbursement system in Japan, and other factors.Strengthening marketing programs centered on compact FCRs in newly industrialized countries markets .Continued robust sales of SYNAPSE and other medical-use picture archiving and communication systems.
1H FY’09/3(Apr.-Sep.,‘08)
1H FY’10/3(Apr.-Sep.,‘09)

1010
Document Solutions
Revenues declined because of the impact of slack demand, mainly in industrialized countries, combined with adverse foreign currency effects, but a recovery trend has emerged in China and certain other parts of Asia. Impact of yen appreciation: -¥24.5 billion
Income declined because of a substantial drop in gross profit, despite initiatives to strengthen the management of direct selling costs along with the drop in sales as well as measures to increase the efficiency of SG&A.
Operating Segments
¥444.0billion (YoY:-21.5% )
*Note:After elimination of intersegment transaction
RevenueRevenue
Operating IncomeOperating Income
Revenue* /Operating IncomeRevenue* /Operating Income
444.0
18.6
45.1
(-21.5%)
565.8
[7.9%]
(-58.6%)[4.2%]
Billions of yen
[ ]: Operating Margin( ): YoY Comparison
Before restructuring and other charges: ¥18.6billion (YoY: -58.6%)
After restructuring and other charges: ¥9.3billion (YoY: -77.7%)
RevenueOperating Income Before Restructuring and Other Charges
1H FY’09/3(Apr.-Sep.,‘08)
1H FY’10/3(Apr.-Sep.,‘09)

1111
Sales volume in Japan decreased due to the impact of restrained corporate investments along with the deterioration of economic conditions. However, the copy volume is increasing gradually. Although exports to U.S.-based Xerox Corporation decreased, within the Asia-Oceania region, sales volume in the Chinese market is rising.
Operating Segments Document Solutions
Billions of yen
Office ProductsOffice Products
Office PrintersOffice Printers
Production ServicesProduction Services
Global ServicesGlobal Services
Sales volume declined along with the decrease in total demand accompanying the drop in the domestic market and exports to U.S.-based Xerox Corporation.In the Asia-Oceania region, sales volume increasedsubstantially in China and Australia.
Revenues of the “700 Digital Color Press” light production color system were favorable.Sales volume in the Asia-Oceania region is increasing, led by revenues from light production color systems.
The impact of deteriorating economic conditions decreased sales. However, sales increases were achieved regarding managed print service.
Sub-segment RevenueSub-segment Revenue
%: Proportion of sub-segment revenue
¥242.3billion (YoY: -22%)
¥71.0 billion (YoY: -26%)
¥57.5 billion (YoY: -20%)
¥36.4billion (YoY: -11%)
565.8
OfficeProducts
OfficePrinters
444.0
312.3
55%
96.217%
71.613%
40.77%
242.3
55%
71.016%
57.513%
36.4 8%
1H FY’10/3(Apr.-Sep.,‘09)
ProductionServices
GlobalServices
1H FY’09/3(Apr.-Sep.,‘08)

12
Progress toward implementation of Progress toward implementation of structural reforms and growth strategystructural reforms and growth strategy

13
Structural reforms are proceeding smoothly ahead of the planned schedule in the first half of the fiscal year.
Management innovation activities
Reduction in personnel in companies in Japan and overseas, closure and consolidation of development laboratories, partial suspension of color paper production at the Netherland plant.
Centralization of administrative functions of local subsidiaries in regional headquarters in Europe, the United States, China, the rest of Asia, and other areas
Substantial reductions in fixed costs, mainly in the photo business, and other measures (in all divisions of all Group companies in Japan and overseas)
1H
Imaging 9.5Information 16.4Document 9.3Total Expense 35.2
(Billions of yen)
Scheduled to record structural reform expenses of ¥110 billion in the second half of the fiscal year
Reduction in personnel in companies in Japan and overseas, reduction of asset
Personnel
6.510.48.5
25.4
Facilities
3.06.00.89.8
【Breakdown of expenses】
Imaging/ Information DocumentAccelerate and expand management
innovation activities
• Realign and integrate R&D functions
• Promote optimization of manufacturing functions and additional reductions to cost of sales
• Expand scope of management innovation activities to overseas regions
Progress of the structural reforms

14
Improve profitability in digital camera business
FinePixF70EXR
As a result of thoroughgoing cost cuts and strengthening of product lineups, the outlook is for a major improvement in profitability in FY10/3.
Cost competitiveness
Strong product lineup
Realize large reduction in costs by more than 20%• Reposition our own plant in China as the core plant and thereby increase the
internal production ratio
Outlook is for sales volume of 9 million units or more, which will be above the originally planned level.
• Expand diversity of product lineup through strategy of increasing value added and differentiating products, and the launching of low-priced models
Innovative technologies(3D system、Super CCD EXR)For low-priced, NIEs model: Customized model strategy by sales region 「A170」 the model designed for NICs
10M、3X Zoom
• Direct procurement of parts from local vendors in China
3D DSC
• Strengthen relationships with original design manufacturer (ODM) partners• Substantially reduce inventories by shortening lead times for production and
procurement (maintain 1.5 months of inventories or less)

15
Speed up launching of products for regions where Company market share is low and NIEs
Document Solution
Medical Systems
•In the BRICs, upgrade systems for direct sales from sales companies. •Orders for low-priced models for the NIEs are holding strong.
Digital Cameras
Graphic Arts
*Compared with the first half of the previous fiscal year
1.5X
Strengthen sales capabilities in NIEsEstablish direct sales structure centering on medical and graphic arts business in BRICs
Promote greater sales in NIEs
DSC sales unit in BRICs
Dry film sales volume China +27%*
India +44%*
•Launching of FCR “Prima” model produced in China•Promoting switch over from competitor’s in the dry film field.
CTP sales volume China +21%*•Launch CTP for NIEs through production in China
MFP +8%*
Printer +73%*
Sales unit in China
•Sales volume, principally of monochrome Multi-Function Peripherals, recovering along with the economic recovery in China and the rest of the Asian region

16
Expanding pharmaceuticals business through Toyama Chemical Co., Ltd.
Sales of Toyama Chemical expanded 1.5-fold in the first half of the fiscal year *
Notice of Start of Phase III Clinical Trials of T-705 as a treatment for influenza infections in Japan (Oct. 29 2009~)
Effectiveness already confirmed among seasonal influenza patients in Phase II clinical trials
Effectiveness against the new strain of influenza (swine flu) confirmed in trials on animals in Japan
Preparations under way for clinical trials on H5N1 avian influenza patients in Vietnam
As the spread of influenza infection becomes a social issue, the Company is promoting preparationfor quick start-up of production on its own responsibilities
Zosyn (launched in FY09/3) and Geninax (launched in FY08/3) achieved steady sales growth.
Toyama Works, R&D and production center for Toyama Chemical
※Implementation of clinical trials is also scheduled in South Korea and Taiwan.
Expand life science business
First confirmation on human beings of the effectiveness of the RNA polymerase inhibitor mechanism, which differs from the mechanism of current drugs
Zosyn: pharmaceuticals applicable to the treatment of blood poisoning, pyelonephritis, complex cystitis, and pneumonia Geninax: pharmaceuticals applicable to the treatment of respiratory and otological infections
*Compared with the first half of the previous fiscal year
Ozex 10% fine granules for children obtained approval for manufacturing in October 2009
New options for treatment of pneumonia and otitis media in children-areas where progress is stalled
17
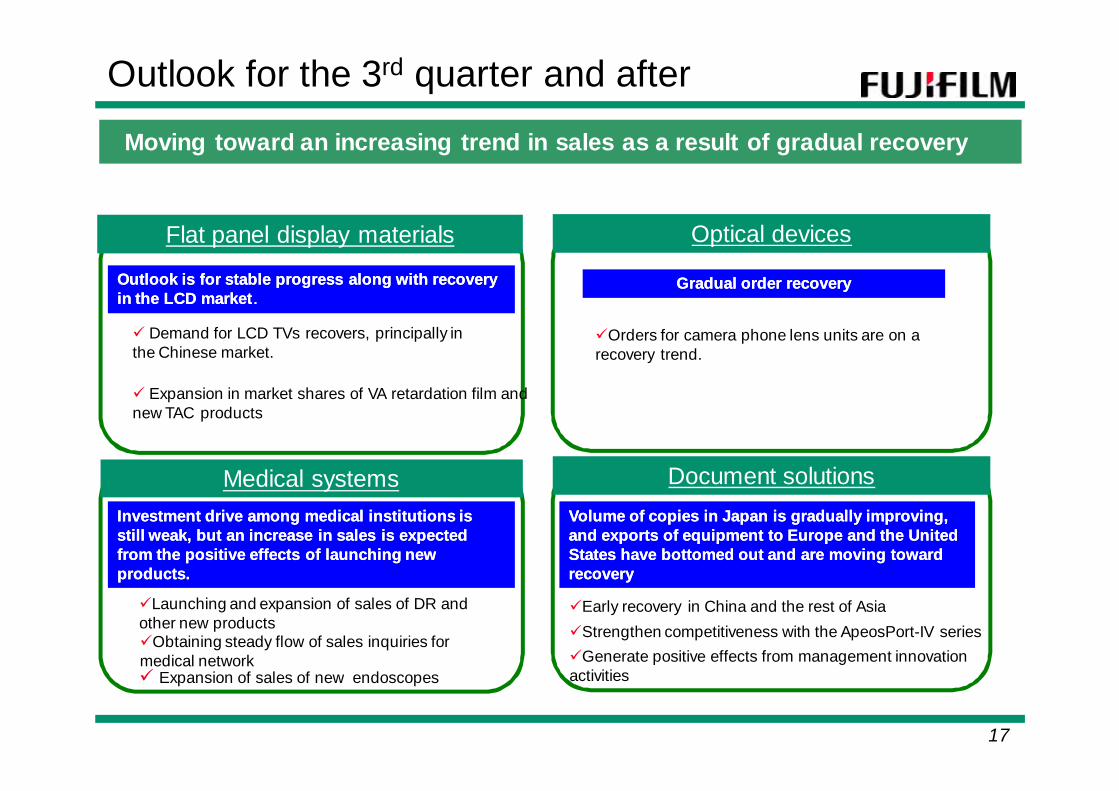
Outlook for the 3rd quarter and after
Moving toward an increasing trend in sales as a result of gradual recovery
Flat panel display materials
Medical systems
Demand for LCD TVs recovers, principally in the Chinese market.
Expansion in market shares of VA retardation film and new TAC products
Obtaining steady flow of sales inquiries for medical network
Expansion of sales of new endoscopes
Optical devices
Orders for camera phone lens units are on a recovery trend.
Gradual order recoveryGradual order recoveryOutlook is for stable progress along with recovery Outlook is for stable progress along with recovery in the LCD marketin the LCD market..
Investment drive among medical institutions is Investment drive among medical institutions is still weak, but an increase in sales is expected still weak, but an increase in sales is expected from the positive effects of launching new from the positive effects of launching new products.products.
Launching and expansion of sales of DR and other new products
Document solutions
Early recovery in China and the rest of Asia Strengthen competitiveness with the ApeosPort-IV seriesGenerate positive effects from management innovation
activities
Volume of copies in Japan is gradually improving, Volume of copies in Japan is gradually improving, and exports of equipment to Europe and the United and exports of equipment to Europe and the United States have bottomed out and are moving toward States have bottomed out and are moving toward recoveryrecovery

18
FY2009/3(Actual)
FY2010/3(Plan)
Change%
Imaging 410.4 350.0 (14.7)Information 946.1 950.0 +0.4Document 1,077.8 1,000.0 (7.2)
Revenue 100.0% 2,434.3 100.0% 2,300.0 (5.5)
Operating Income Before Restructuring and Other Charges 2.9% 70.8 2.4% 55.0 (22.3)Restructuring and Other Charges 33.5 145.0 -Operating Income AfterRestructuring and Other Charges 1.5% 37.3 (3.9)% (90.0) -Income Before Income Taxes 0.4% 9.4 (4.0)% (93.0) -Net Income Attributable toFUJIFILM Holdings 0.4% 10.5 (2.6)% (60.0)
-
Net Income Attributable to FUJIFILM Holdings per Share
¥21.10 ¥(122.80) ¥(143.90)
Exchange RatesUS$
€¥101¥145
¥93*¥132*
¥(8)¥(13)
Billions of yen
Forecast for FY2010/3 (April ’09 - March ’10)
*3QFY’10/3~ US$:¥90 €:¥130

1919
Imaging Solutions
*Note: After elimination of intersegment transaction
Revenue* /Operating IncomeRevenue* /Operating Income
119.0
89.180.3
-4.4
Color Filmsand Others
ElectronicImaging
Color Paperand Chemicals
PhotofinishingEquipment
Labs andFDi services
Billions of yen
14.1
Appendix
(-25.2%)
119.0
YoY
-37%-22%
-38%-20%
12%
29.5
9.4
19.7
35.3
25%
8%
17%
30% -28%
Sub-segment RevenueSub-segment Revenue
[-4.9%]
80.38.9 11%
19.726%
5.6 7%13.2
16%
25.131%
%: Proportion of sub-segment revenue
-6.9
Billions of yen
[ ]: Operating Margin( ): YoY Comparison
RevenueOperating Income Before Restructuring and Other Charges
[-6.6%] [-8.6%]
1Q FY’10/3(Apr.-Jun.,‘09)
1Q FY’10/3(Apr.-Jun.,‘09)
2Q FY’09/3(Jul.-Sep.,‘08)2Q FY’09/3
(Jul.-Sep.,‘08)
-7.8
89.19.0
22.926%
15.718%
25.529%
10%
5.9 7%
2Q FY’10/3(Jul.-Sep.,‘09)2Q FY’10/3
(Jul.-Sep.,‘09)

2020
225.6204.5
276.3
13.5
7.8
23.5
Information Solutions
*Note:After elimination of intersegment transaction
Revenue* /Operating IncomeRevenue* /Operating Income
[8.5%]
(-18.4%)
Medical Systems/ Life Sciences
GraphicArts
FPD Materials
RecordingMediaOffice
& Industry
Billions of yen
276.3
72.7
YoY
-10%
-24%
-4%
-39%
-30%
Appendix
6%
26%
55.320%
19.7 26%49.9
18%
204.5
Sub-segment RevenueSub-segment Revenue
[Optical Devices][26.8]
[6.0%]
54.227%
34.914%
53.724%
28.6
26%
[12.7]
53.826%
%: Proportion of sub-segment revenue
Billions of yen
[ ]: Operating Margin( ): YoY Comparison
[3.8%]
1Q FY’10/3(Apr.-Jun.,‘09)
2Q FY’09/3(Jul.-Sep.,‘08)
2Q FY’10/3(Jul.-Sep.,‘09)
1Q FY’10/3(Apr.-Jun.,‘09)
2Q FY’09/3(Jul.-Sep.,‘08)
2Q FY’10/3(Jul.-Sep.,‘09)
(-42.7%)
225.6
76.4
28%
7%12.7
16%[16.0]
65.7
29%
53.2
58.0
12.0 5%
RevenueOperating Income Before Restructuring and Other Charges

2121
Document Solutions
*Note:After elimination of intersegment transaction
Revenue* /Operating IncomeRevenue* /Operating Income
Billions of yen
Appendix
Sub-segment RevenueSub-segment Revenue
YoY%: Proportion of sub-segment revenue
Billions of yen
[ ]: Operating Margin( ): YoY Comparison
RevenueOperating Income Before Restructuring and Other Charges
226.4217.6
289.4
10.77.9
23.1[7.9%]
(-21.8%)
[4.7%]
[3.6%] (-53.6%)
1Q FY’10/3(Apr.-Jun.,‘09)
2Q FY’09/3(Jul.-Sep.,‘08)
2Q FY’10/3(Jul.-Sep.,‘09)
1Q FY’10/3(Apr.-Jun.,‘09)
2Q FY’09/3(Jul.-Sep.,‘08)
2Q FY’10/3(Jul.-Sep.,‘09)
OfficeProducts
OfficePrinters
ProductionServices
GlobalServices
217.6
122.654%
33.817%
37.4
22.512%
8%
157.0
56%49.3
26.916.2
16%
12%
7%
289.4
-24%
-25%
-18%-10%
226.4
119.7
37.253%
30.614%
9%
16%
20.2

2222
215.4 215.0 183.1
327.2 326.5
247.0
Overseas revenue, % compositionDomestic revenue
ImagingImaging InformationInformation DocumentDocument
60.3%
342.1 329.5 284.3
231.6 236.3
159.7
60.3% 41.8%40.4%
AppendixRevenue from Overseas(1H Apr.-Sep.)
Billions of yen
57.4% 36.0%
1H FY’08/3 1H FY’09/3 1H FY’10/3 1H FY’08/3 1H FY’09/3 1H FY’10/3
57.7 45.9 40.6
234.0185.2
128.8
80.2%80.1%
76.0%
1H FY’08/3 1H FY’09/3 1H FY’10/3

2323
Capital Expenditure*Appendix
10.4 9.7 8.9
31.1
14.58.5
2.8
2.54.0
28.319.9
44.3
Imaging SolutionsInformation SolutionsDocument Solutions
■ Corporate
2Q(July - September)
2Q(July - September)
*Note: Figures do not include amounts for rental equipment handled by the Document Solutions segment.
16.4 14.6 21.2
50.5
34.715.3
9.7
7.2
4.1
56.7
40.6
76.6
1H(April – September)
1H(April – September)
2Q FY’08/3
2Q FY’09/3
1H FY’08/3
1H FY’09/3
0.1
Fiscal Year(April – March)
Fiscal Year(April – March)
50.7 40.4 45.0
101.5
59.6 41.0
17.9
12.312.0
0.1 0.1
170.2
112.4
FY’09/3FY’08/3 FY’10/3(Plan)
98.0
0.2
2Q FY’10/3
1H FY’10/3

2424
107.4 111.8
37.8 22.7
77.681.0
*Note: Figures do not include amounts for rental equipment handled by the Document Solutions segment.
Depreciation & Amortization
226.8
Billions of yen
FY’08/3 FY’09/3
Fiscal Year(April – March)
Fiscal Year(April – March)
212.6
Appendix
195.0
FY’10/3(Plan)
159.6 149.9 134.7
20.0 19.2 17.4
27.5 27.9 25.1
11.9 6.86.1
48.759.5
Imaging SolutionsInformation SolutionsDocument Solutions
■ Corporate
38.8 38.0
49.8 55.048.5
20.2 12.3
11.4
33.6
93.7
109.0
40.1 38.0 32.7 72.8 73.8 63.1Depreciation*
0.1
54.0
105.6
2Q(July - September)
2Q(July - September)
1H(April – September)
1H(April – September)
0.1 0.2
2Q FY’08/3
2Q FY’09/3
2Q FY’10/3
1H FY’08/3
1H FY’09/3
1H FY’10/3
0.3 0.2 0.6 0.50.1

2525
Billions of yen
AppendixR&D Expenses
Ratio of R&D expenses to revenue
Fiscal Year(April – March)
Fiscal Year(April – March)
FY’08/3 FY’09/3 FY’10/3(Plan)
93.4
96.4
14.3
77.2
187.6180.0
191.1
6.6%
7.8% 7.8%
17.0
8.3
7.26.5
44.78.5
7.16.4
88.390.8
47.2 49.3
95.7
2Q(July - September)
2Q(July - September)
1H(April – September)
1H(April – September)
80.4
ImagingSolutions
InformationSolutions
DocumentSolutions
17.0
1H FY’08/3
1H FY’09/3
1H FY’10/3
2Q FY’08/3
2Q FY’09/3
2Q FY’10/3

2626
SG&A Expenses Billions of yen
Appendix
Ratio of SG&A expenses to revenue
28.326.626.6
295.7
374.1
1H FY’10/3
1H FY’08/3
1H FY’09/3
356.1
2Q(July - September)
2Q(July - September)
1H(April – September)
1H(April – September)
28.626.7
759.1694.7
Fiscal Year(April – March)
Fiscal Year(April – March)
27.426.126.4
189.9
2Q FY’10/3
2Q FY’08/3
2Q FY’09/3
148.2179.2
FY’08/3 FY’09/3

2727
Appendix
330.9
270.1
339.9
Mar. '08 Mar.' 09 Sep.'09
Billions of yen
Cash and Cash Equivalents
113.867.6 45.0
242.4253.9
256.2
0.20.20.2
Mar. '08 Mar. '09 Sep. '09
370.0
321.5
Long term debtShort term debtD/E ratio
Interest Bearing Debt
287.4
2828
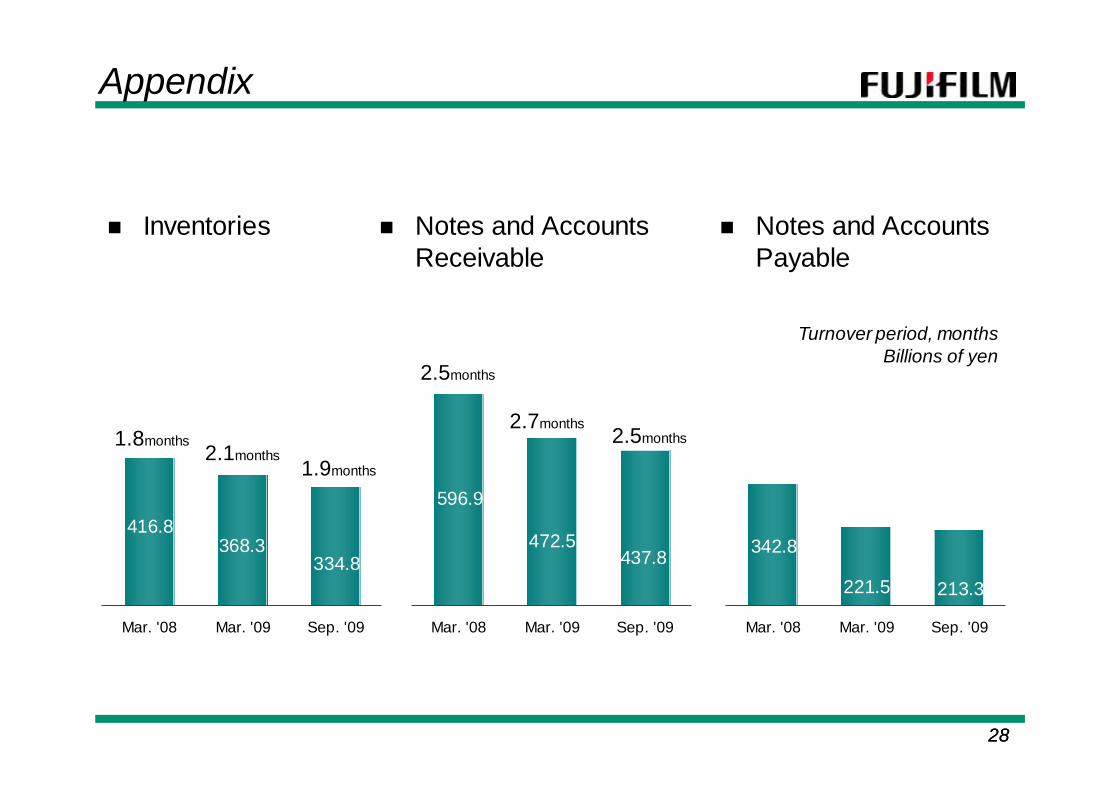
437.8
596.9
472.5
Mar. '08 Mar. '09 Sep. '09
334.8
416.8368.3
Mar. '08 Mar. '09 Sep. '09
1.8months2.1months
2.5months
2.7months
Appendix
213.3
342.8
221.5
Mar. '08 Mar. '09 Sep. '09
Inventories Notes and Accounts Receivable
Notes and Accounts Payable
Billions of yenTurnover period, months
1.9months
2.5months

2929
AppendixCurrent State of New Drug DevelopmentDevelopment
code Non-clinical P I P II P III Filed FormulationT-3262 finegranules Quinolone synthetic antibacterial Japan Oral*
T-614 Rheumatoid arthritis Japan Oral
T-3762 Quinolone synthetic antibacterial Japan Injection**
T-3811 New-type quinolone synthetic antibacterial Japan Injection***
U.S.A. Oral/Injection
Europe
T-705 Antiviral Japan Oral
U.S.A.
T-817MA Alzheimer’s disease U.S.A. Oral
T-5224 Rheumatoid arthritis Japan Oral
Overseas
T-2307 Antifungal U.S.A. Injection
T-1106 Antiviral Japan Oral
* Tablets are sold under the name "Ozex"** Additional dosage of "PASIL" intravenous drip, which is currently sold on the market
*** Oral drugs are sold under the name "Geninax">Changes since the previous announcement (Jul 30, 2009): T3762 fine granules: Approval obtained for manufacturing in October 2009(Reimbursement price undecided)T705: Phase III trials began in October 2009.
T2307: Phase I trials began in October 2009
Therapeutic category RegionDevelopment stage

3030
Exchange Rates
Number of Employees
Yen
Appendix
Sensitivity of Currency (full year, ¥1 change)
Operating income
US$ 0.9Euro 0.7
Sep. 2008 Dec. 2008 Mar. 2009 Jun. 2009 Sep. 2009
Consolidated Total 78,228 78,203 76,252 75,929 75,938
Billion s of YenFY2009/3 FY2010/3
1Q 2Q 1H Year 1Q 2Q 1HUS$ 104 108 106 101 97 94 96
Euro 163 162 163 145 133 133 133
42.5%
40.7%
38.3%
38.8%
1.1%
2.0%
4.5%
4.5%
8.6%
8.9%
Mar.'09
Sep.'09Financial InstitutionsSecurities CompaniesOther CorporationsIndividuals & OthersForeighn CorporationsTreasury stocks
5.1%
5.0%
Distribution of Shareholders

IR Office, Corporate Planning Div.
We will use leading-edge, proprietary technologies to provide top-quality products and services that contribute to the advancement ofculture, science, technology and industry, as well as improved healthand environmental protection in society. Our overarching aim is to helpenhance the quality of life of people worldwide.