earnings presentation 2016
TRANSCRIPT

2016 Earnings Presentation
Ana Botín, Group Executive ChairmanJosé Antonio Álvarez, CEO
25th January 2017

22
Important information
Banco Santander, S.A. ("Santander") cautions that this presentation contains forward-looking statements. These forward-looking statements are found in various places
throughout this presentation and include, without limitation, statements concerning our future business development and economic performance. While these forward-looking
statements represent our judgment and future expectations concerning the development of our business, a number of risks, uncertainties and other important factors could
cause actual developments and results to differ materially from our expectations. These factors include, but are not limited to: (1) general market, macro-economic,
governmental and regulatory trends; (2) movements in local and international securities markets, currency exchange rates and interest rates; (3) competitive pressures; (4)
technological developments; and (5) changes in the financial position or credit worthiness of our customers, obligors and counterparties. The risk factors that we have indicated
in our past and future filings and reports, including those with the Securities and Exchange Commission of the United States of America (the “SEC”) could adversely affect our
business and financial performance. Other unknown or unpredictable factors could cause actual results to differ materially from those in the forward-looking statements.
Forward-looking statements speak only as of the date on which they are made and are based on the knowledge, information available and views taken on the date on which
they are made; such knowledge, information and views may change at any time. Santander does not undertake any obligation to update or revise any forward-looking
statement, whether as a result of new information, future events or otherwise.
The information contained in this presentation is subject to, and must be read in conjunction with, all other publicly available information, including, where relevant any fuller
disclosure document published by Santander. Any person at any time acquiring securities must do so only on the basis of such person's own judgment as to the merits or the
suitability of the securities for its purpose and only on such information as is contained in such public information having taken all such professional or other advice as it
considers necessary or appropriate in the circumstances and not in reliance on the information contained in the presentation. In making this presentation available, Santander
gives no advice and makes no recommendation to buy, sell or otherwise deal in shares in Santander or in any other securities or investments whatsoever.
Neither this presentation nor any of the information contained therein constitutes an offer to sell or the solicitation of an offer to buy any securities. No offering of securities shall
be made in the United States except pursuant to registration under the U.S. Securities Act of 1933, as amended, or an exemption therefrom. Nothing contained in this
presentation is intended to constitute an invitation or inducement to engage in investment activity for the purposes of the prohibition on financial promotion in the U.K. Financial
Services and Markets Act 2000.
Note: Statements as to historical performance or financial accretion are not intended to mean that future performance, share price or future earnings (including earnings per
share) for any period will necessarily match or exceed those of any prior year. Nothing in this presentation should be construed as a profit forecast.
The businesses included in each of our geographic segments and the accounting principles under which their results are presented here may differ from the included
businesses and local applicable accounting principles of our public subsidiaries in such geographies. Accordingly, the results of operations and trends shown for our geographic
segments my differ materially from those of such subsidiaries.

33
Agenda
Delivery of our 2016 commitments and progress in strategic priorities
Concluding remarks
Group and business areas review
2017 Strategic priorities

44
Santander delivered strong financial performance: underlying PBT +12%1 YoY2016 results (change vs. 2015)
(1) Constant euros
€4.22
(+15 cents)TNAV/Share
Attributable profit€6,204 MM
(+4%)
11.1%Underlying RoTE
Dividend per share€0.21
(+5%)Loans
Funds
€798 Bn
(+2%1)
€796 Bn
(+5%1)
FL CET110.55%
(+50 bps)
€41,268 MM
(+4%1)Customer revenues

55
Underlying PBT +12%1 YoY and attributable profit +4% YoY
(1) Constant euros
€ million 2016 2015 ABS. %%
Constant
euros
Net interest income 31,089 32,189 -1,101 -3 +2
Net fees 10,180 10,033 147 +1 +8
Total customer revenues 41,268 42,222 -954 -2 +4
ROF and other 2,585 3,051 -466 -15 -12
Gross Income 43,853 45,272 -1,419 -3 +3
Operating expenses -21,088 -21,571 -483 -2 +4
Operating Income 22,766 23,702 -936 -4 +2
Net loan loss provisions -9,518 -10,108 -590 -6 -2
Underlying PBT 11,288 10,939 349 +3 +12
Attributable PAT 6,204 5,966 238 +4 +15

66
We again delivered on all our 2016 shareholder commitments…
TNAV/share
(€)TNAV/share
(€)
TNAV/share
(€)
Cash
dividend per
share
(€)
TNAV/share
(€)
EPS
(€)
TNAV/share
(€)
FL CET1
(%)
4.224.074.013.89
0.170.16
0.090.08
0.40 0.410.480.39
10.0510.55
9.311 9.651
2013 2014 2015 2016
(1) Pro-forma, including capital increase in January 2015

77
…and continued to reinforce our well-funded and highly liquid balance sheet
Prudent balance sheet structure Improved credit quality and capital position
%
2016 vs 2015
1.18Cost of credit -7bps
3.93NPL ratio -43bps
10.55FL CET1 +50bps
Net loans to
customers
Financial assets
Fixed assets & other
Deposits
Funding ST
Equity & other17%
14%
75%65%
13%
8%
3%
Liabilities
5%
Assets
Securitisations
Funding M/LT

88
1
2
3
A differential business model
Geographic diversification drives predictability of earnings = less capital
Subsidiary model with strong culture of working together drives
efficiency and service excellence
Serving 125 MM customers’ financial needs, with critical mass
in 10 markets with c.1 Bn people drives profitable growth

99
We are delivering on our unique opportunity…
15.0
2016
target
2016
15.2
2015
13.8
Loyal customers
Million
20.020.9
16.6
2016
target
20162015
Digital customers
Million
8.1
4.3
2016
target
Increase
20162015
Fee income growth1
%
(1) % change (constant euros)
1
+10% +26% c.2x
1010
100
80
60
40
20
0
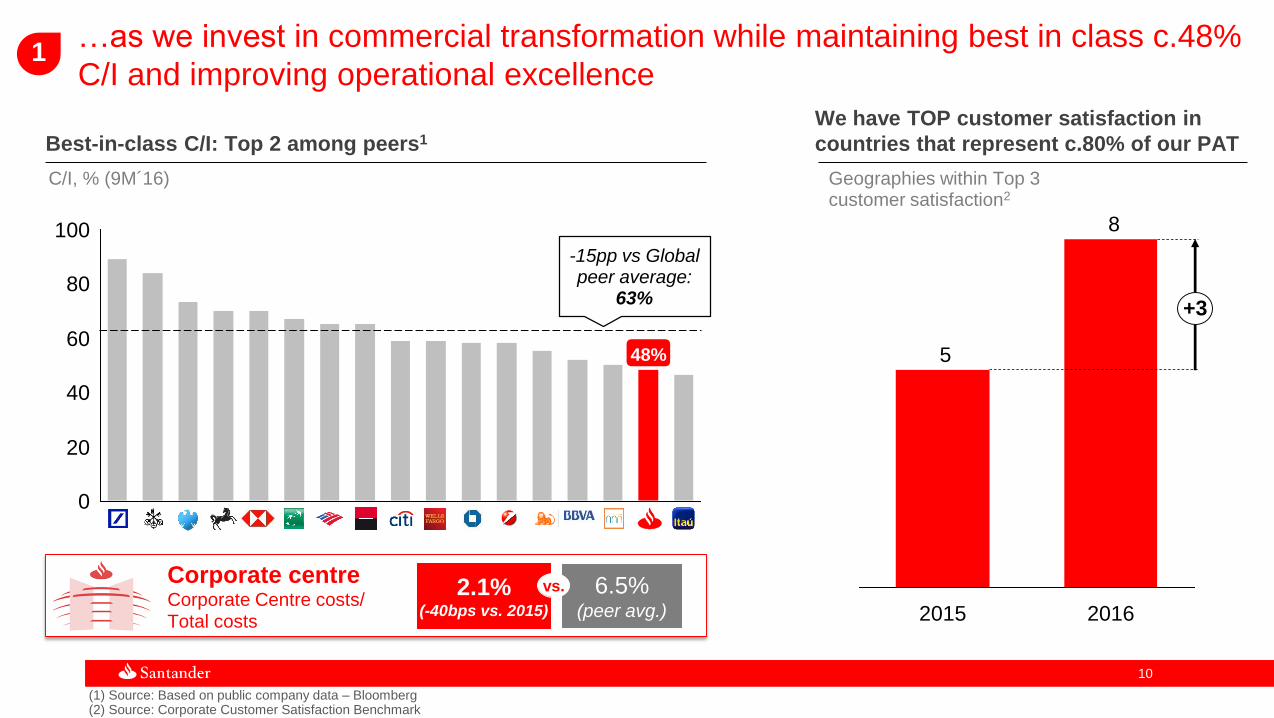
…as we invest in commercial transformation while maintaining best in class c.48%
C/I and improving operational excellence
(1) Source: Based on public company data – Bloomberg(2) Source: Corporate Customer Satisfaction Benchmark
1
We have TOP customer satisfaction in
countries that represent c.80% of our PATBest-in-class C/I: Top 2 among peers1
vs
C/I, % (9M´16) Geographies within Top 3 customer satisfaction2
-15pp vs Global peer average:
63%
48%
8
5
20162015
+3
Corporate centreCorporate Centre costs/ Total costs
2.1%(-40bps vs. 2015)
6.5%(peer avg.)
vs.

1111
Our geographic diversification delivers predictable and growing
earnings through the cycle…
Well balanced profit generation
% of Group PAT1
Santander has the lowest volatility in earnings among peers…
Average volatility of quarterly reported EPS (%), 1999-9M’162
…with growing profits
Statutory profit growth, CAGR (%), 1998 vs. 2015
(1) Excluding the Corporate Centre and Real Estate activity in Spain
3US
5 Argentina
4
Chile6
Mexico8
Brazil
21
UK
20
SCF 13
Spain
12
Portugal5
Poland
3
Other
1025
454749
6779
95
122135
729
Best
Source: Bloomberg; Note: GAAP criteria (2) The analysis takes the quarterly EPS to 9M’16, starting from the first available data since Jan’99
2

1212
…which allows us to consistently fund profitable growth, increase cash
dividend per share and accumulate capital
c.1/3 c.1/3
c.1/3
Top tier profitability
allows us to…
(2016 vs. 2015)
Accumulate capital
Fund business
growth
+8%cash DPS
+2%2
customer loans
+50 bps (+€3 Bn)FL CET1
Increase
cash dividends
per share
RoTE 9M´161
%
6
6
7
7
8
9
9
9
11
11
11
13
14
4
5
(1) Source: Based on public company data - Bloomberg. Santander Underlying. RoTCE for US Banks(2) Constant euros
2
1313
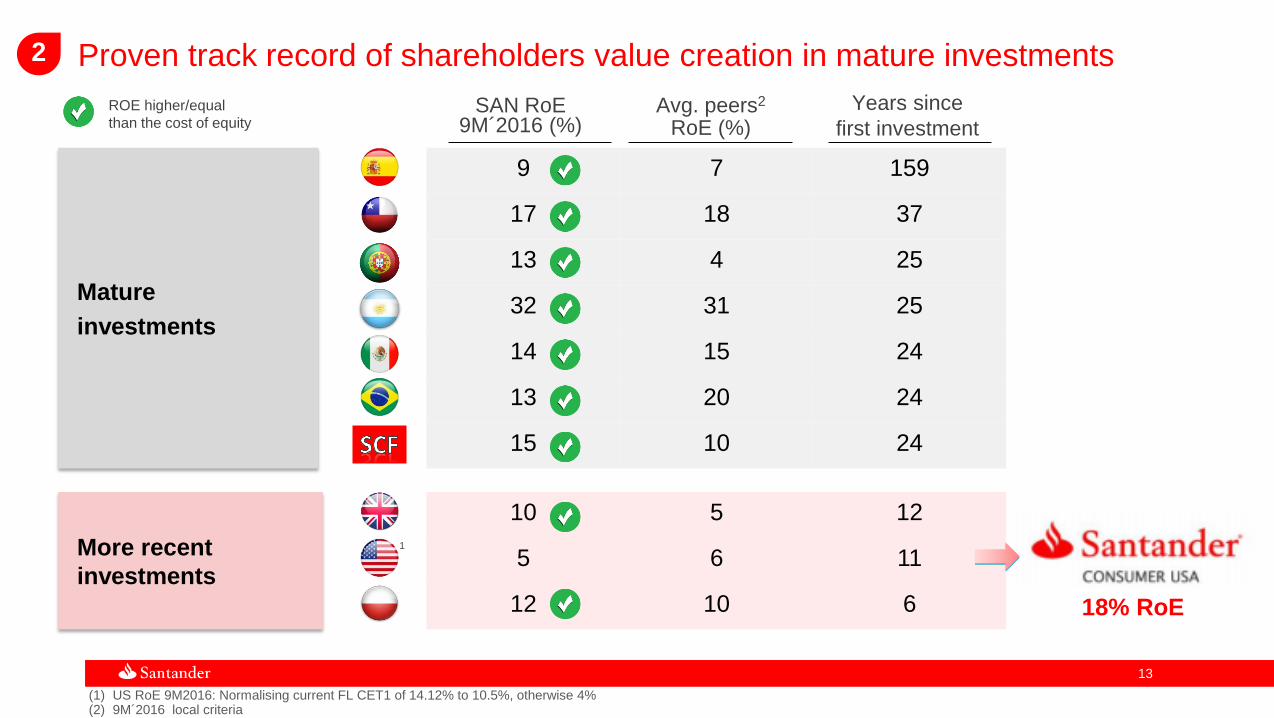
Proven track record of shareholders value creation in mature investments
9 7 159
17 18 37
13 4 25
32 31 25
14 15 24
13 20 24
15 10 24
Avg. peers2
RoE (%) SAN RoE
9M´2016 (%)Years since
first investment
ROE higher/equal
than the cost of equity
More recent
investments
Mature
investments
(1) US RoE 9M2016: Normalising current FL CET1 of 14.12% to 10.5%, otherwise 4%(2) 9M´2016 local criteria
10 5 12
5 6 11
12 10 6
1
2
18% RoE

1414
Improved cost efficiency
More transactional customers
SBNA underlying C/I
SBNA net new checking customers (monthly average increase)
Delivering regulatory progress in the US whilst progressing in improving
SBNA business performance…
(1) Total interest expense / average interest bearing liabilities. Source SNL
2
-10pp
2016
75%
2015
85%
-20bps
2016 Q3
27bps
2015
47bps+4%
Nov-16Nov-15
Significant progress in the regulatory agenda
Improved funding costs vs peers
SBNA gap vs. peers in cost of interest bearing liabilities1
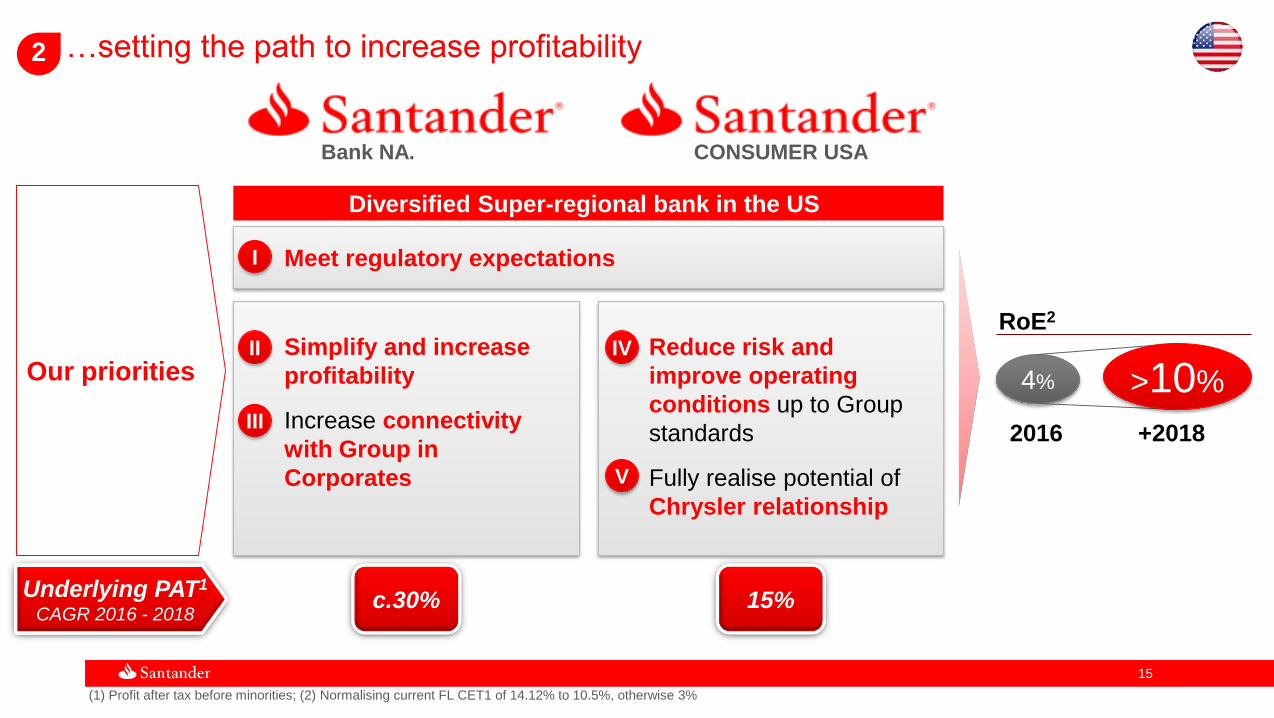
1515
…setting the path to increase profitability
(1) Profit after tax before minorities; (2) Normalising current FL CET1 of 14.12% to 10.5%, otherwise 3%
Our priorities
• Meet regulatory expectationsI
• Simplify and increase
profitability
• Increase connectivity
with Group in
Corporates
II
III
• Reduce risk and
improve operating
conditions up to Group
standards
• Fully realise potential of
Chrysler relationship
IV
2
Underlying PAT1
CAGR 2016 - 2018c.30% 15%
Bank NA.
Diversified Super-regional bank in the US
4%
RoE2
2016 +2018
>10%
V
CONSUMER USA

1616
We add increasing value by working as a Group… 3
Global projects led by the Group: Santander wallet example
Single global solution for c.400k customers
Launched: Upcoming:
Collaboration between countries: Connectivity examples
Number of companies
jointly targeted through
collaborationc.500
+38%
+46%International trade
revenues1
(+2018 vs. 2016)
9xUK international
clients
(1) SP-UK corridor specifically
Average increase in
revenues(2016)

1717
…supporting our communities…
Strong Simple | Personal | Fair culture
More than 3/4 of our employees
support the new culture
>9 pp vs. average of financial services employees
+5 pp improvement in work-life balance
S|P|F culture
Commitment
Leadership, talent and
performance
Source: Employee Engagement Survey
1818
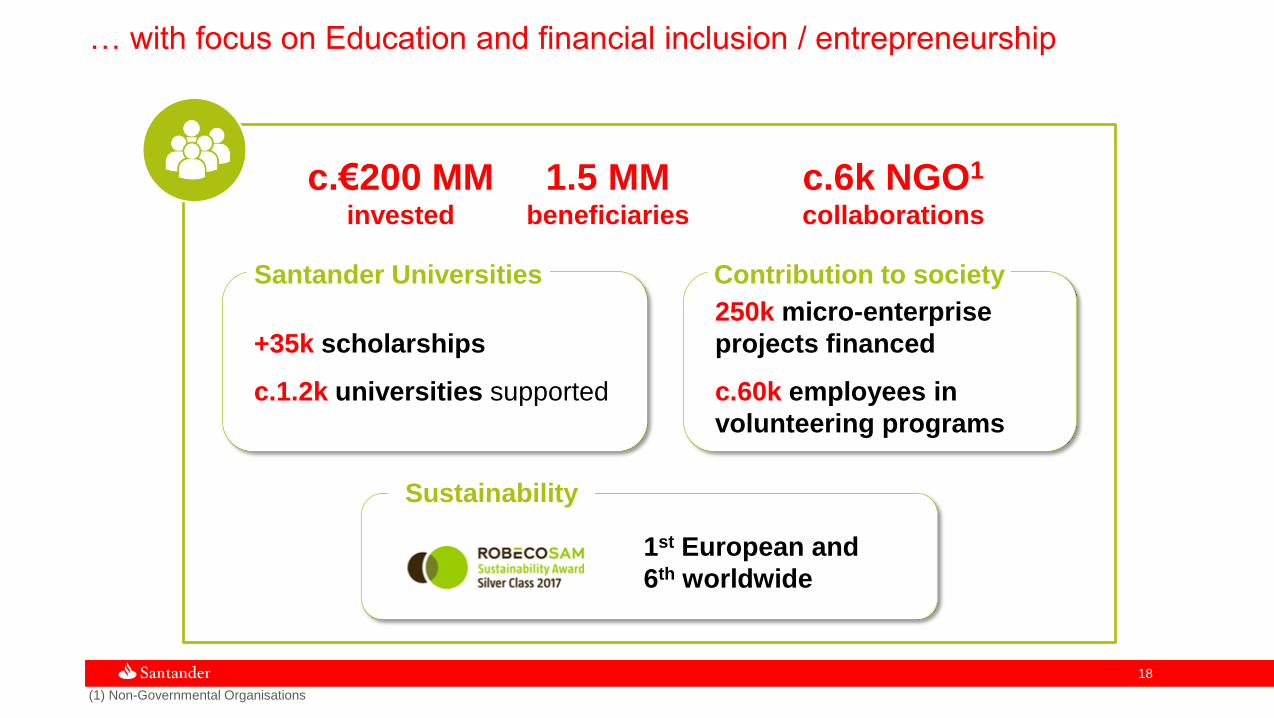
… with focus on Education and financial inclusion / entrepreneurship
c.€200 MM invested
c.6k NGO1
collaborations
1.5 MMbeneficiaries
• 1st European and
6th worldwide
Sustainability
+35k scholarships
c.1.2k universities supported
Santander Universities
250k micro-enterprise
projects financed
c.60k employees in
volunteering programs
Contribution to society
(1) Non-Governmental Organisations

1919
Agenda
Delivery of our 2016 commitments and progress in strategic priorities
Concluding remarks
Group and business areas review
2017 Strategic priorities

2020
Santander delivered strong financial performance: underlying PBT +12%1 YoY2016 results (change vs. 2015)
Note: Loans and funds excluding repos.(1) Constant euros
€4.22
(+15 cents)TNAV/Share
Attributable profit€6,204 MM
(+4%)
11.1%Underlying RoTE
Dividend per share€0.21
(+5%)Loans
Funds
€798 Bn
(+2%1)
€796 Bn
(+5%1)
FL CET110.55%
(+50 bps)
€41,268 MM
(+4%1)Customer revenues

2121
Widespread growth, particularly in developing markets
Note: Loans excluding repos. Funds: deposits excluding repos + marketed mutual funds. % change in constant euros
(1) SCF excluding PSA (+6%)
Mexico
Chile
UK
Spain
Argentina
Brazil
Portugal
SCF
Poland
USA
+8%
+7%
+2%
-4%
+37%
+0.4%
-5%
+14%1
+8%
-2%
Loan portfolio
Medium-low risk profile
Well-diversified portfolio
Mexico
Chile
UK
Spain
Argentina
Brazil
Portugal
SCF
Poland
USA
+12%
+6%
+6%
+3%
+49%
+3%
+2%
+7%
+10%
+7%
Funds
Growth in demand deposits
and mutual funds
Maturemarkets
Developingmarkets
Maturemarkets
Developing markets28
39
243
151
7
80
29
88
21
90
36
35
211
225
11
100
31
35
26
74
Dec’16 € Billion YoY var. Dec’16 € Billion YoY var.

2222
Attributable profit up 4% (+15% in constant euros) driven by higher customer
revenues and lower cost of credit. 4Q’16 profit of €1,598 million1
Higher customer revenues
Lower provisions
The efficiency plan enabled transformation and regulatory costs to be absorbed
Double-digit growth in profit
2016 2015 % /2015 % /2015
Gross income 43,853 45,272 -3 +3
Operating expenses -21,088 -21,571 -2 +4
Net op. Income 22,766 23,702 -4 +2
Loan-loss provisions -9,518 -10,108 -6 -2
Underlying PBT 11,288 10,939 +3 +12
Taxes -3,396 -3,120 +9 +16
Underlying attrib. profit 6,621 6,566 +1 +10
Non-recurring2 -417 -600 -31 -31
Attributable profit 6,204 5,966 +4 +15
€ millionConstant euros
(1) Includes Deposit Guarantee Fund, mainly in Spain
(2) Non-recurring items details on the next page

2323
Restructuring costsCapital gain
VISA Europe
Restatement SC USA
2015
-600
835683
283435
600
1,118
1,718
Non-recurringpositive results
Non-recurringnegative results
475
13732
227
644
Non-recurringpositive results
Non-recurringnegative results
PPI1-417
2015 and 2016 profit hit by several non-recurring items
€ million net of tax
2016
€ million net of tax
(1) Payment Protection Insurance in UK
Impairment of intangible assets (software)
Net of the reversal of provisions
in Brazil
Badwill Other items(goodwill, other)
PPI1
In 4Q’16: PPI (-€137 mill.), SC USA restatement (-€32 mill.) and, for
comparison purposes with 2015, SRF contribution of €120 mill. (charged in
2Q) was reallocated from non-recurring items to gross income

2424
7,286
7,7567,959
815 550 373
1Q'14 2Q 3Q 4Q 1Q'15 2Q 3Q 4Q 1Q'16 2Q 3Q 4Q
2,3352,397
2,592
(*) Other income includes gains on financial transactions, income from equity accounted method, dividends and other operating results. Including in 4Q’15 and 4Q'16 contribution to the DGF and SRF Note: Constant euros
Gross income evolution Gross income
42,76843,853689
762 -366
+8%+2%-12%
+3%
Net interest income
Fee income
Other income*
Fee income 2016
Gross income
Net interest income
Other income*
2015
Gross income
Gross income rose in 8 of 10 core units driven by net interest income and good
performance of fee income
€ million € million

2525
Note: Constant euros. (1) In real terms and excluding perimeter; (2) Nominal costs less 2016 average inflation of each country
20,36821,088
+3.5%
-1.7%excl. inflationand perimeter
Total operating expenses
2016
Expenses
2015
Expenses
In real terms2
Nominal and excl. perimeter
Brazil 5.7 -3.3
UK -0.4 -1.2
SCF 8.3 -0.8
Spain -4.0 -3.8
Mexico 9.3 6.5
Chile 1.5 -2.3
Portugal 19.1 -4.7
USA 5.5 4.2
Argentina 37.4 -0.5
Poland 1.7 2.3
Corporate Centre -17.7 -17.5
Group 3.5 -1.7
% change in seven units below inflation rate1
€ million 2016 / 2015, %
Active cost management enabled the continuous investment in commercial
transformation, while remaining as one of the most efficient banks

2626
(1) Constant euros
9,722 9,518
-2%
Total loan-loss provisions1
2016
LLPs
2015
LLPs
Coverage ratio
NPL ratio
Cost of credit
excl. SC USA
73%
4.36%
0.90%
Cost of credit 1.25%
74%
3.93%
0.82%
1.18%
Ratios evolution
D’15 D’16
€ million
All credit quality ratios improved with cost of credit already achieving
the Investor Day goals

2727
Fully-loaded CET1
Note: on 3 February 2016, the ECB authorised the use of the Alternative Standard Method to calculate the capital requirements on a consolidated level of the operational risk in Banco Santander (Brasil) S.A.
10.05
10.2710.36
10.4710.55
Dec’15 Mar’16 Sep’16 Dec’16Jun’16
+50 bps
in 2016
%
Consistent progress on reaching our target of fully-loaded CET1 >11% in 2018
Total capital ratio: 13.87% +82 bps
Leverage ratio: 5.0% +30 bps
Underlying RoRWA : 1.36% +6 bps
YoY var.December ’16

2828
Brazil
UK
SCF
Spain
Mexico
USA
Chile
Portugal
Poland
Argentina
2,772
2,452
1,803
1,459
1,067
1,036
894
533
508
503
SCF
Corporate Centre (underlying): -€1,589 million
Profit before taxes 2016 Attributable profit 2016
Corporate Centre (underlying): -€1,439 million
+15%
+5%
+18%
-42%
+16%
+33%
-6%2
+52%
-4%
+18%
+16%
+5%
+17%
-32%
+20%
+27%
+4%1
+50%
+8%
+21%
Despite challenging market conditions, PBT rose in 9 of 10 core units (Attributable profit impacted by higher and/or new taxes)
(1) Excluding the new tax on assets: PBT +20% (2) Excluding the new tax on assets: Attributable profit +14
Brazil
UK
SCF
Spain
Mexico
USA
Chile
Portugal
Poland
Argentina
1,786
1,681
1,093
1,022
629
395
513
399
272
359
SCF
€ million and % change / 2015 in constant euros € million and % change / 2015 in constant euros

2929
BRAZIL
Strategy and highlights
Enhanced customer loyalty driven by improvement of added value
proposals (digital advances, product and partnership innovations)
NII and fee income growth underscored revenues recurrence
Increased productivity and efficiency resulted in expenses growing at
below the average inflation rate (in 4Q impact of collective agreement)
Provisions and credit quality under control thanks to prudent risk
management
2015 2016
Volumes2
Activity
Var. D'16 / D'15
+5%/ 3Q’16
+1%/ 3Q’16
Spread and cost of credit
Loyal customers (mill.) 3.2 3.7
Digital customers (mill.) 4.4 6.4
Biometrics 0.1 6.3
(million customers)
Cost of credit 4.50% 4.89%
Customer satisfaction1 2nd 3rd
(ranking among the 5 largest banks)
(*) % change in constant euros
0.4%
+3%
Loans Funds
(1) Source: Bacen. Complaints ranking: number of complaints filed by customers; (2) Loans excluding repos. Funds: deposits excluding repos + marketed mutual funds.
€ million
P&L
4Q’16 %/3Q’16* 2016 %/2015*
NII 2,269 5.3 8,062 1.8
Fee income 887 12.8 2,940 16.9
Gross income 3,187 2.7 11,321 6.8
Operating expenses -1,305 9.5 -4,475 5.7
LLPs -953 -2.2 -3,377 7.6
PBT 736 -9.1 2,772 15.9
Attributable profit 510 2.6 1,786 15.0
%
7.65 7.67 7.97 7.93 8.03
4.50 4.63 4.71 4.87 4.89
4Q'15 1Q'16 2Q 3Q 4Q
Cost of credit
Spread on loans

3030
UNITED KINGDOM
Strategy and highlights
Robust business flows in both retail and corporates
PBT up 8%. Attributable profit impacted by the introduction of the 8% bank
corporation surcharge in 2016
Revenues up: higher lending volumes and lower cost of deposits (1l2l3 World
interest rate change) offsetting SVR3 attrition and new asset margins decline
Digitalisation and product simplification supporting expenses discipline
Strong credit quality in all loan books, supported by prudent lending criteria
2015 2016
Volumes2
Activity
Var. D'16 / D'15
0%/ 3Q’16
+2%/ 3Q’16
Banking NIM
%, local criteria
Digital customers (mill.) 3.7 4.6
Corporate lending growth >5 pp =
vs. market
Share of corporates / total 13.4% 13.7%
loans
NPL ratio 1.52% 1.41%
Retail customer satisfaction1 62.9% 62.9%
£ million
1.80 1.78 1.78 1.751.83
4Q'15 1Q'16 2Q 3Q 4Q
(1) Customer satisfaction as measured by the Financial Research Survey (FRS) run by GfK; (2) Loans excluding repos. Funds: deposits excluding repos + marketed mutual funds
(3) SVR: Standard variable rate.
+2%
+6%
Loans Funds
P&L
4Q’16 %/3Q’16 2016 %/2015
NII 928 4.5 3,599 0.4
Fee income 205 -6.9 843 6.5
Gross income 1,234 5.2 4,752 2.7
Operating expenses -594 -0.8 -2,424 -0.4
LLPs 48 — -48 -38.9
PBT 583 25.4 2,004 7.7
Attributable profit 407 30.9 1,373 -4.0

3131
Strategy and highlights
High diversification and leadership in Europe. Joint-venture with PSA
and GE Nordics integration completed as scheduled
New lending growth in all countries
Profit up driven by higher revenues and lower LLPs. 4Q impacted by the
seasonal lower auto sales
Best-in-class in efficiency and risk
Main countries profit: Germany (€347 mill.); Nordic countries (€281 mill.)
and Spain (€207 mill)
2015 2016
Volumes2 Customer NIM
Activity
Var. D'16 / D'15 %
+3%/ 3Q’16
+1%/ 3Q’16
+14%+17%
Loans New lending
Note: Excluding Santander Consumer UK profit, recorded in Santander UK results. Including it, 2016 attributable profit: €1,238 mill. (+16% / 2015); 4Q'16: 292 mill. (-10% / 3Q’16). (1) Customers with active contract, excl. SC UK and PSA; (2) Loans excluding repos.
Active customers1 (mill.) 16.8 17.9
Countries incorporated (#) 5 11(Banque PSA Finance agreement)
Cost of credit 0.77% 0.47%
NPL ratio 3.42% 2.68%
NIM
NIM net of provisions
3.7 3.6 3.7 3.7 3.6
3.3 3.13.4 3.2 3.2
4Q'15 1Q'16 2Q 3Q 4Q
SANTANDER CONSUMER FINANCE
For comparison purposes with 2015, the SRF contribution in 4Q'16 was reallocated from non-recurring items to gross income
€ million
P&L
4Q’16 %/3Q’16* 2016 %/2015*
NII 867 -1.8 3,391 10.7
Fee income 184 -15.9 862 -1.2
Gross income 1,043 -6.0 4,262 8.5
Operating expenses -486 3.9 -1,904 8.3
LLPs -87 -25.7 -387 -27.3
Underlying PBT 418 -14.7 1,803 21.3
Attributable profit 269 -8.0 1,093 17.9
(*) % change in constant euros

3232
2.27 2.26 2.14 2.06 2.10
0.58 0.50 0.48 0.49 0.47
4Q'151Q'16 2Q 3Q 4Q
SPAIN
Strategy and highlights
Ongoing 1l2l3 strategy to boost customer loyalty (+32%), commercial
productivity (50% of new loans linked to 1I2I3 customers), and high return
investments (+230 bps UPLs new loans market share)
In companies, loyal companies grew 48% and top player in league tables
Efficiency plan implemented while maintaining commercial activity levels and
top 3 position in customer satisfaction
Profit up backed by fee income growth, expenses control and lower provisions
Net interest income affected by low interest rates, mortgages repricing
and impact of ALCO portfolio sales
2015 2016
Volumes1
Activity
Var. D'16 / D'15
-1%/ 3Q’16
+1%/ 3Q’16
(1) Loans excluding repos. Funds: deposits excluding repos + marketed mutual funds
Customer NIM
%
-4%
+3%
Loans Funds
Digital customers (mill.) 2.4 2.7
Retail fee income -6% +6%(y-o-y % change)
Customer satisfaction Top 3 Top 3(position)
Cost of credit 0.62% 0.37%
€ million
P&L
Yield on loans
Cost of deposits
4Q’16 %/3Q’16 2016 %/2015
NII 747 2.5 3,077 -10.3
Fee income 451 -1.2 1,781 5.5
Gross income 1,179 -15.7 5,608 -7.8
Operating expenses -802 -2.7 -3,297 -4.0
LLPs -85 -39.2 -585 -41.0
Underlying PBT 195 -49.1 1,459 4.8
Attributable profit 237 -12.0 1,022 4.6
For comparison purposes with 2015, the SRF contribution in 4Q'16 was reallocated from non-recurring items to gross income.

3333
Good performance of other units: increased customer base, volumes and profits
ATTRIBUTABLE PROFIT(DETAIL BY UNITS IN THE APPENDIX)
Mexico■ Focus on commercial transformation: strong growth in volumes, digital customers
(+46%) and loyal (+16%)
■ Profit boosted by customer revenues (NII: +14%) and enhanced credit quality
Chile
Portugal■ Banif's integration has been completed, enabling a more balanced loan portfolio
and market share gains in corporates
■ Profit up driven by customer revenues and sharp reduction in the cost of credit
■ Improved customer satisfaction with market share gains in loans and deposits
■ Higher customer revenues, expenses under control and lower cost of credit
€629 mill.; +18%
€513 mill.; +16%
€399 mill.; +33%
Poland■ Higher volumes and customer revenues. Good management of NII (+11%) and
enhanced credit quality
■ Profit impacted by new tax on assets and lower gains on financial transactions
€272 mill.; -6%
Excl. tax on assets: +14%
Argentina■ Market share gain in loans and deposits. Acquisition of Citibank’s retail portfolio in
October (Central Bank authorisation expected in March 2017)
■ Profit up due to higher revenues and better cost of credit€359 mill.; +52%
Note: % change over 2015 in constant euros
US■ SBNA: showed business progress (core deposits +4%)
■ SC USA: 18% RoTE with lower risk profile and increased compliance
■ Significant progress in the regulatory agenda
€395 mill.; -42%

3434
2016 2015
NII -739 -627
Gains / Losses on FT -243 150
Operating expenses -450 -547
Provisions -73 -481
Tax and minority interests 149 29
Underlying attrib. profit -1,439 -1,493
Non-recurring items -417 -600
Attributable profit -1,856 -2,093
CORPORATE CENTRE
P&L
€ million
Corporate Centre / Total Group (%)
2015 2016
23% 22%
Lower revenues due to fall in gains on financial transactions (hedging)
Provisions back to normal levels. They were above average in 2015
Progress on reducing the Corporate Centre's weight in the Group:
Headquarters expenses down 18% in 2016
2014 2015 2016
2.9% 2.5% 2.1%
Operating expenses Underlying attrib. profit
% change 2016/2014
Spain -216
C.C. -186
US -32
UK -30
Poland +29
Rest +18
-23%

3535
Agenda
Delivery of our 2016 commitments and progress in strategic priorities
Concluding remarks
Group and business areas review
2017 Strategic priorities

3636
To help people
and businesses
prosper
To be the best Retail and Commercial
Bank, earning the lasting loyalty of our
people, customers, shareholders and
communities
Our purpose
A bank that is…
SIMPLE | PERSONAL | FAIR
Our aim
3737
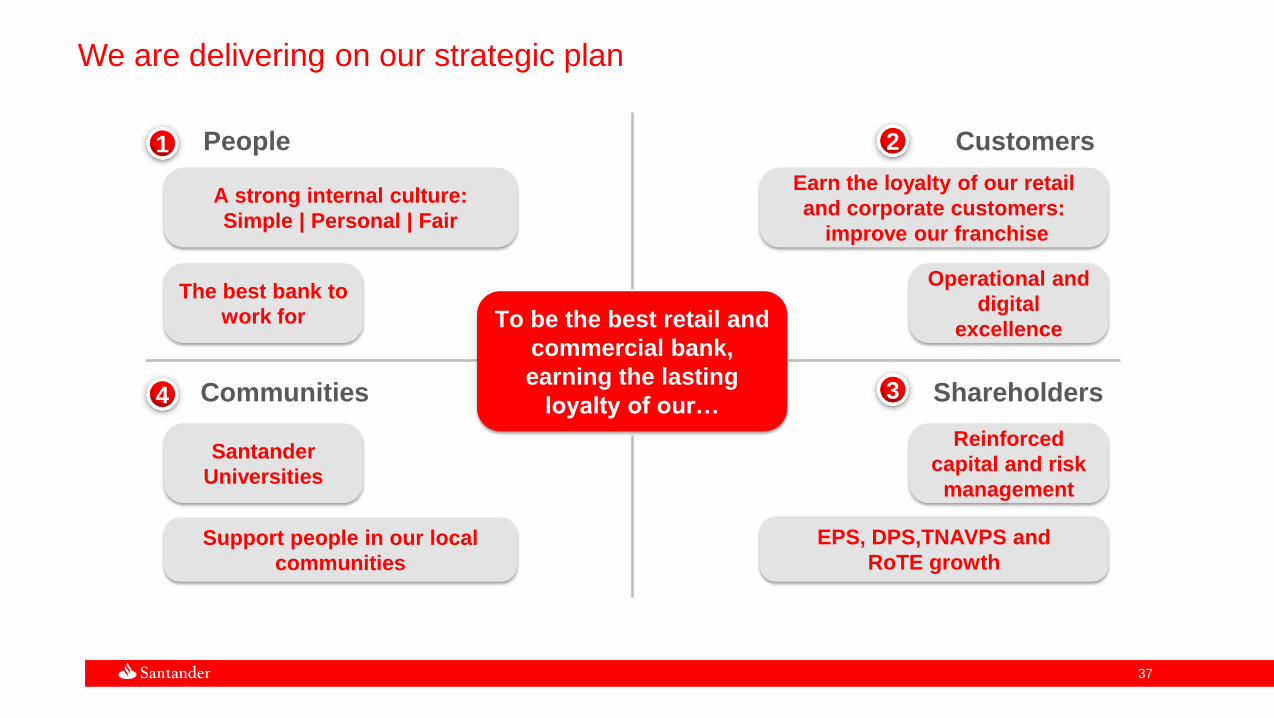
We are delivering on our strategic plan
Shareholders
People Customers
Communities
A strong internal culture:
Simple | Personal | Fair
Support people in our local
communities
EPS, DPS,TNAVPS and
RoTE growth
Operational and
digital
excellence
Earn the loyalty of our retail
and corporate customers:
improve our franchise
Reinforced
capital and risk
management
The best bank to
work for
Santander
Universities
To be the best retail and
commercial bank,
earning the lasting
loyalty of our…
1 2
4 3

3838
Helping our people
People
People and communities: Continuing our progress towards a Simple | Personal |
Fair culture and giving back to our communities is a requirement to succeed
Helping our people
• +93k scholarships in 2017-2018
• c.80k entrepreneurs supported
in 2017-2018
4.5
2.9
2017 2018
People supported
Million (cumulative from 2016)
Communities
2016
78
Increase
2017
Employee engagement
% of engaged employees

3939
Customers: In 2016 we increased customer value and our target is to reach 17MM
loyal customers in 2017
4.3%
8.1%Increase2
(c.10% CAGR
by 2018)
Fee income growth1
Loyal customers, million
1|2|3 World
(1) Constant euros (2) CAGR 15-18
17,0
2017
13,8
2015 2016
15,2
Customer loyalty value propositions… ...to further drive fee income growth

4040
Customers: Leveraging technology and active collaboration to deliver best
customer experience and efficiency
Examples
New digital platform
launch in Q2 2017
Digital account and
card for the unbanked
Real time international
payments
Digital transformation
1Business
transformation
2
3Working as a Group
20.9 25
20172016
48Broadly stable
8countries in
top 3
Maintain leadership
Digital
customersMillion
C/I%
Customer
experience1
(1) Geographies within Top 3 customer satisfaction, Source: Corporate Customer Satisfaction Benchmark

4141
Shareholders: We delivered on FL CET1 ahead of plan and reaffirm 2017
guidance
Committed to accumulate organically c.40 bps CET1 per year after dividends and lending growth
Loans growth > RWA growth
Profit growth > RWA growth
Capital management and M&A discipline across the Group
1
2
3
10.55
+50bps
2015 2016
10.05
Fully loaded CET1
(%) 10bps ahead of plan

4242
Shareholders: Reaffirm all our targets for 2017: grow EPS, DPS and TNAV per
share
EPS € DPS €
TNAV/Share €
0.41
2017
target
2015
0.40
2016
Increase
0.210.20
20162015 2017
target
Increase
4.224.07
2015 2017
target
2016
Increase

4343
Agenda
Delivery of our 2016 commitments and progress in strategic priorities
Concluding remarks
Group and business areas review
2017 Strategic priorities

4444
We delivered on all our strategic goals in 2016…
Loyal customers (million)
Digital customers (million)
Fee income1
15.2
0.41
0.21
2016
Cost of risk
Cost to income
4.22
15.0
Increase
Increase
Increase
10.45%
2016 targets2015
13.8
0.40
0.20
4.07
10.05% 10.55%
EPS (€)
DPS (€)
TNAV / share (€)
FL CET1
48.1% Broadly stable47.6%
1.18% Improve1.25%
8.1% Increase4.3%
20.9 20.016.6
(1) % change (constant euros)

4545
…and we are on track to meet our 2017/18 targets
Loyal customers (Million)
Digital customers (Million)
Fee income1
17
Increase
Increase
2017 targets
Cost of risk
Cost to income
18.6
Double digit growth
Increase
>11%
2018 targets2016
15.2
0.41
0.21
10.55% +40bps per year
EPS (€)
DPS (€)
FL CET1
Broadly stable 45-47%48.1%
Improve 1.2% avg. 15-181.18%
Increase c.10% CAGR 15-188.1%
25 3020.9
(1) % change (constant euros)

4646
Reaffirming our key shareholder metrics, increasing EPS in 16/17, reaching double
digit by 2018, and growing DPS and TNAV per share
(1) Except for the US – approaching peers
Customers
ShareholdersCommunities
▪ 17MM retail Loyal Customers
▪ 1.6MM loyal SMEs and Corporates
▪ Customer loans growth above peers
▪ All geographies top 3 in customer service1
▪ 30MM digital customers (x2)
▪ c.10% CAGR of fee income 2015-18
“To be the best retail and
commercial bank, earning the
lasting loyalty of our people,
customers, shareholders
and communities”
▪ Top 3 bank to work for in the majority of
our geographies
▪ People supported in
our communities:
4.5MM 2016-18
▪ Cost to income ratio 45-47%
▪ 2015-18 average cost of risk 1.2%
▪ FL CET1 > 11%
▪ Increasing EPS, reaching double digit growth by 2018
▪ 30-40% cash dividend pay-out: Yearly DPS increase
▪ RoTE >11%
People
▪ c.130k scholarships 2016-18

4747
The best retail bank in Europe and the Americas
During 2016 we have delivered ahead of plan on our
strategic, financial and commercial targets1We reiterate our commitments for 2017 and 20182Consistent delivery over the past 3 years:
• Broadly stable C/I
• Cash DPS +89%
• 11.1% underlying RoTE after FL CET1 +50bps
• Increasing TNAV/Share every year
3
We have delivered all this in the right way, helping more people and business
prosper while building a bank that is more simple, personal and fair

4848
APPENDIX

4949
Global segments results
Group balance sheet
Liquidity and funding
NPL and coverage ratios, and cost of credit
Quarterly income statements
Appendix
Other geographic units results

5050
Other geographic units results

5151
MEXICO
Strategy and highlights
46% increase in digital customers and 16% in loyal ones. Efforts made
to attract payrolls
Strong rise in volumes, improving funds structure
Profit up driven by NII (+14%), fuelled by loans and demand deposits
growth and higher interest rates since December 2015
Ongoing credit quality improvement, with lower NPLs, cost of credit and
higher coverage ratio
2015 2016
Volumes1 Customer NIM
Activity
Var. D'16 / D'15 %
-2%/ 3Q’16
+5%/ 3Q’16
+8%
+12%
Loans Funds
(1) Loans excluding repos. Funds: deposits excluding repos + marketed mutual funds
Digital customers (thousand) 876 1,282
Payrolls (thousand) 3,076 3,400
Demand deposits (YoY change) +18% +16%
SMEs loans (MXN mill.) 61,203 67,640
Cost of credit 2.91% 2.86%
NIM net of provisions
NIM
3.7 3.7 3.7 3.8 3.8
2.5 2.3 2.3 2.5 2.5
4Q'15 1Q'16 2Q 3Q 4Q
€ million
P&L
4Q’16 %/3Q’16* 2016 %/2015*
NII 615 4.9 2,385 14.3
Fee income 179 8.0 711 4.4
Gross income 828 6.0 3,203 13.4
Operating expenses -325 6.6 -1,274 9.3
LLPs -203 6.8 -832 11.4
PBT 293 3.9 1,067 17.5
Attributable profit 169 0.4 629 17.5
(*) % change in constant euros

5252
CHILE
Strategy and highlights
Improved customer satisfaction indices, greater loyalty and about
one million digital customers
Gaining market share in loans and deposits
Higher attributable profit driven by net interest income, expenses
under control and lower provisions
Improvement of all credit quality ratios
2015 2016
Volumes1
Activity
Var. D'16 / D'15
+1%/ 3Q’16
+1%/ 3Q’16
+7% +6%
Loans Funds
Customer NIM
%
(1) Loans excluding repos. Funds: deposits excluding repos + marketed mutual funds
Loyal customers (thousand) 559 604
Digital customers (thousand) 918 959
Cost of credit 1.65% 1.43%
NPL ratio 5.62% 5.05%
Customer satisfaction 4th 1st
(position)
3.7 3.6 3.8 3.84.1
2.42.7 2.7 2.6
3.0
4Q'15 1Q'16 2Q 3Q 4Q
NIM net of provisions
NIM
€ million 4Q’16 %/3Q’16* 2016 %/2015*
NII 521 7.7 1,864 7.4
Fee income 91 0.1 353 1.2
Gross income 672 6.2 2,422 7.0
Operating expenses -265 3.9 -986 1.5
LLPs -131 -13.0 -514 -6.5
PBT 241 2.6 894 20.2
Attributable profit 137 3.2 513 16.4
(*) % change in constant euros
P&L

5353
PORTUGAL
Strategy and highlights
Banif's integration has been completed, enabling a more balanced
loan portfolio and higher market share in corporates
Rise in the 1|2|3 customer base reflected in double digit growth in
loyal companies and digital customers
Deposits up 3%, underscoring the banks good position in the financial
system
Profit rose driven by higher customer revenues and sharp reduction
of the cost of credit
2015 2016
Volumes1
Activity
Var. D'16 / D'15
-1%/ 3Q’16
-1%/ 3Q’16
Note: 2015 customers do not include Banif
(1) Loans excluding repos. Funds: deposits excluding repos + marketed mutual funds (2) Not including Banif
Cost of time deposits –New deposits2
%
Loyal individuals (thousand) 505 603
Loyal companies (thousand) 23.0 33.2
Digital customers (thousand) 381 502
Cost of credit 0.29% 0.18%
Loans market-share 14.3% 14.4%(O’16)
0.34 0.24 0.23 0.18 0.18
4Q'15 1Q'16 2Q 3Q 4Q
-5%
+2%
Loans Funds
€ million
P&L
4Q’16 %/3Q’16 2016 %/2015
NII 182 1.0 733 32.0
Fee income 69 -13.6 314 19.1
Gross income 292 1.8 1,209 19.0
Operating expenses -143 0.9 -589 19.1
LLPs -9 -40.3 -54 -25.4
Underlying PBT 134 8.3 533 27.2
Attributable profit 106 14.8 399 33.0
For comparison purposes with 2015, the SRF contribution in 4Q'16 was reallocated from non-recurring items to gross income.

5454
UNITED STATES
SBNA: Focus on commercial activity
In SC USA, revenues impacted by the change of mix towards a lower risk
profile. Lower originations in 4Q16
Costs still high due to investments in IT, franchise and regulatory issues
Higher LLPs in SBNA (Oil & Gas in 1Q16) and SC USA (higher average
retained balances)
Significant progress in regulatory agenda
2015 2016US$ million
Activity1
-2%/ 3Q’16
-1%/ 3Q’16
-2%
+2%
Loans Funds
Santander Bank Santander Consumer USA
Var. D'16 / D'15 Var. D'16 / D'15
-2%/ 3Q’16
-2%/ 3Q’16
Strategy and highlights
(1) Loans excluding repos. Funds: deposits excluding repos + marketed mutual funds
Digital customers (thousand) 617 778
C&I loans ($Bn) 19 17
Core deposits ($Bn) 43 45
SC servicing portfolio ($Bn) 15 12
Total cost of credit 3.66% 3.68%
P&L
4Q’16 %/3Q’16 2016 %/2015
NII 1,561 -3.9 6,545 -3.5
Fee income 276 -7.7 1,219 1.2
Gross income 1,945 -6.7 8,332 -3.6
Operating expenses -932 6.6 -3,538 5.5
LLPs -935 7.9 -3,548 3.1
PBT 69 -79.6 1,146 -32.1
Attributable profit 12 -92.6 437 -41.9
-2%-3%
Loans Managedassets
5555
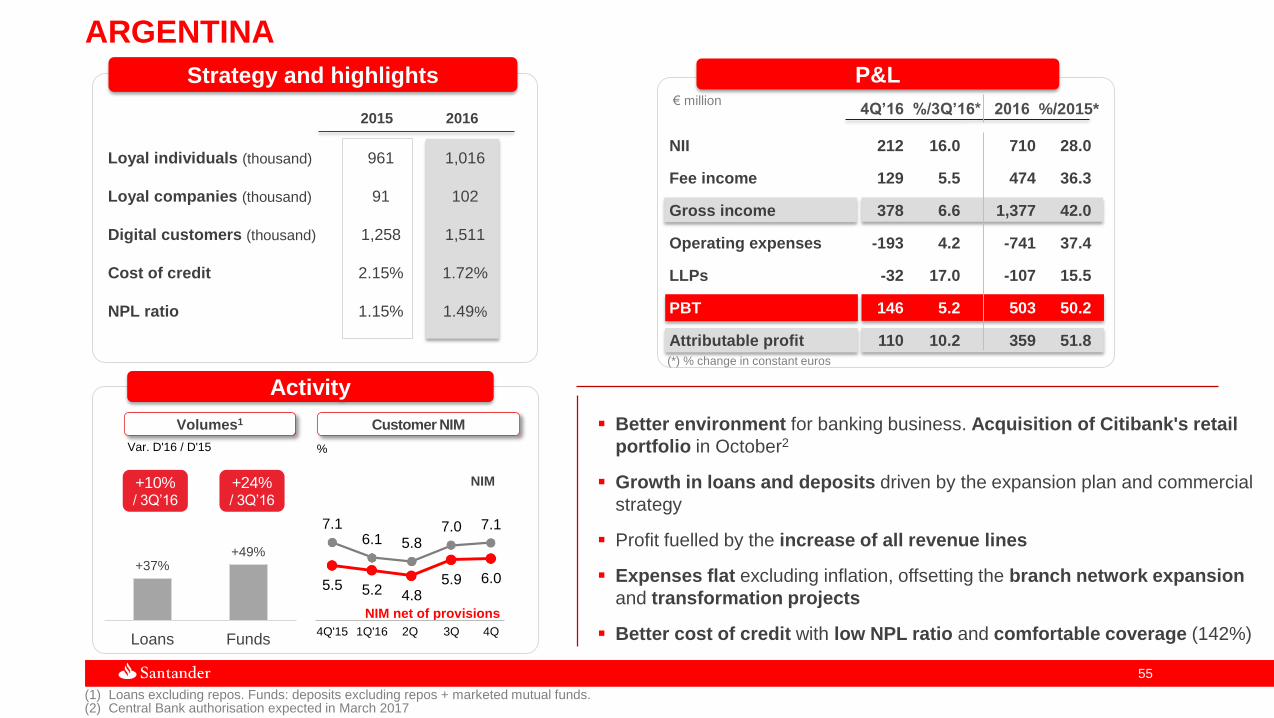
ARGENTINA
Strategy and highlights
Better environment for banking business. Acquisition of Citibank's retail
portfolio in October2
Growth in loans and deposits driven by the expansion plan and commercial
strategy
Profit fuelled by the increase of all revenue lines
Expenses flat excluding inflation, offsetting the branch network expansion
and transformation projects
Better cost of credit with low NPL ratio and comfortable coverage (142%)
2015 2016
Volumes1
Activity
Var. D'16 / D'15
+10%/ 3Q’16
+24%/ 3Q’16
(1) Loans excluding repos. Funds: deposits excluding repos + marketed mutual funds.(2) Central Bank authorisation expected in March 2017
+37%+49%
Loans Funds
%
Customer NIM
Loyal individuals (thousand) 961 1,016
Loyal companies (thousand) 91 102
Digital customers (thousand) 1,258 1,511
Cost of credit 2.15% 1.72%
NPL ratio 1.15% 1.49%
NIM net of provisions
NIM
7.16.1 5.8
7.0 7.1
5.5 5.2 4.85.9 6.0
4Q'15 1Q'16 2Q 3Q 4Q
€ million
P&L
4Q’16 %/3Q’16* 2016 %/2015*
NII 212 16.0 710 28.0
Fee income 129 5.5 474 36.3
Gross income 378 6.6 1,377 42.0
Operating expenses -193 4.2 -741 37.4
LLPs -32 17.0 -107 15.5
PBT 146 5.2 503 50.2
Attributable profit 110 10.2 359 51.8
(*) % change in constant euros

5656
POLAND
Strategy and highlights
Benchmark bank in innovation and digital channels
Market share gain in loans. Volumes growth in companies, mortgages,
consumer credit and cards
Attributable profit up 14% excluding the new tax on assets
Good management of NII (+11%, backed by larger volumes) and costs
Significant drop in the NPL ratio and the cost of credit
Fee income hit by new regulation in bank insurance. Better evolution vs.
sector (-6%)
2015 2016
Volumes1
Activity
Var. D'16 / D'15
0%/ 3Q’16
+5%/ 3Q’16
+8%+10%
Loans Funds
(1) Loans excluding repos. Funds: deposits excluding repos + marketed mutual funds.
Customer NIM
%
Digital customers (thousand) 1,885 1,979
Loyal companies (thousand) 60 89
Cost of credit 0.87% 0.70%
NPL ratio 6.30% 5.42%
Market share in loans 9.8% 10.1%(S’16)
Yield on loans
Cost of deposits
4.04 3.96 3.98 3.99 4.00
0.99 1.03 0.95 0.84 0.83
4Q'15 1Q'16 2Q 3Q 4Q
€ million
P&L
4Q’16 %/3Q’16* 2016 %/2015*
NII 222 4.2 834 11.2
Fee income 101 -3.8 400 -1.2
Gross income 329 0.7 1,314 7.4
Operating expenses -139 -5.8 -579 1.7
LLPs -35 -17.5 -145 -9.8
PBT 129 -1.1 508 3.6
Attributable profit 63 -7.7 272 -5.6
(*) % change in constant euros

5757
OTHER LATIN AMERICAN COUNTRIES
€ million (constant euros)
Attributable profit
Uruguay Peru
2015 2016
3137
2015 2016
64 84
Focusing on loyalty, transactions and target segments
Profit driven by customer revenues growth
+32%
+21%

Global segmentsresults

5959
RETAIL BANKING
€ billion (constant euros)
Dec'15 Dec'16
677 693
+2%*
Dec'15 Dec'16
695 729
+5%*
Loans Funds
(*) -1% in euros
Activity
The retail banking model continued to be transformed into an increasingly Simple, Personal and Fair model
Focused on three main priorities: customer loyalty, digital transformation and operational excellence
Further development of the multi-channel model, centred on digital channels
Progress in achieving our targets. 15.2 million loyal customers (+10% from December 2015) and 20.9 million digital customers
(+26% from December 2015)
(*) +3% in euros
P&L
4Q’16 %/3Q’16* 2016 %/2015*
NII 7,493 1.9 29,090 2.9
Fee income 2,279 0.3 8,745 8.9
Gross income 9,960 -0.1 39,055 2.8
Operating expenses -4,827 4.0 -18,476 5.0
LLPs -2,299 -1.1 -8,693 -2.2
Underlying PBT 2,311 -14.2 10,201 3.6
Attributable profit 1,587 -3.4 6,297 0.1
(*) % change in constant euros
€ million
For comparison purposes with 2015, the SRF contribution in 4Q'16 was reallocated from non-recurring items to gross income.

6060
GLOBAL CORPORATE BANKING
(*) % change in constant euros
€ million
P&L
4Q’16 %/3Q’16* 2016 %/2015*
NII 801 10.0 2,781 -0.5
Fee income 372 5.7 1,465 4.6
Gross income 1,419 -7.0 5,825 13.7
Operating expenses -478 -2.4 -1,951 -2.2
LLPs -55 -74.9 -660 1.1
PBT 848 1.2 3,137 31.5
Attributable profit 588 7.6 2,089 30.0
€ million (constant euros)
Gross income
1,671 1,884
1,3481,361
1,4511,753
655
8265,125
5,825
2015 2016
+14%*
+13%
+21%
+26%TOTAL
Global Transaction
Banking
Global Markets
Capital & Other
+1%Customers
+12%*
(*) In euros: Total gross income, +6%; customer revenues: +6%
Financing
Solutions & Advisory
Customer-centred strategy, underpinned by the Division's global capacities and their interconnection with local units
Benchmark positions in export finance, corporate lending and project finance, among other, in Europe and Latin America
Attributable profit up 30% (in constant euros), driven by strong and diversified customer revenues (+12%)

6161
Dec'15 Dic'16
2.6 1.9
3.7 3.5
2,11.6
5.0
1.3
2.4
2.7
15,8
11,0
Coverage ratio
Dec'16 and var. / Dec'15
+4 p.p.
€ million
P&L
2016 2015 % 2015
Gross income 39 137 -71.8
Operating expenses -211 -235 -10.3
Provisions -288 -511 -43.6
Tax recovery 137 180 -23.6
Attributable profit -326 -420 -22.3
Loans NetForeclosures
56% 58%
-1 p.p.
Reduction of non-core exposure continued at a pace above 15% (net loans: -29%)
Coverage ratio already adapted to the requirements of Appendix IX
Deconsolidation of assets from the Metrovacesa / Merlín merger
Lower losses due to reduced costs and provision needs
Activity
REAL ESTATE ACTIVITY SPAIN
€ billion
Total Balance
Net foreclosures
Net loans
RentalsMetrovacesa
Sareb and
Other

GroupBalance sheet

6363
BALANCE SHEET
Balance sheet (Dec’16)
Retail balance sheet, appropriate for a low risk business model, liquid
and well capitalised
(*) Other assets: tangible and intangible assets: €53 bn, held-to-maturity portfolio: €14 bn.; other financial instruments at fair value: €1 bn, accruals and other accounts: €64 bn.
791
118
132
229
63
691
99 4683 106
171 149
1,339 1,339
Assets Liabilities
Lending: 59% of balance sheet
Derivatives (with counterparty on liabilities side): 6% of balance sheet
Cash, central banks and credit institutions: 13%
Other (goodwill, fixed assets, accruals): 10%
Available for sale portfolio (AFS): 7%
Trading portfolio: 5%
1
3
2
4
5
6
1
6
5
4
3
2
€ billion
Trading portfolio
Other*
Net loans to
customers
Derivatives
Cash and credit institutions
AFS portfolio Other
Customer deposits
Credit institutions
Derivatives
Issues and subordinated
liabilities
Shareholders’ equity & fixed liabilities

Liquidity and funding

6565
LIQUIDITY AND FUNDING
Liquidity balance sheet (Dec’16)
Well-funded balance sheet with high structural liquidity surplus
Note: Liquidity balance sheet for management purposes (net of trading derivatives and interbank balances). Provisional (1) Financial assets – short term wholesale funding markets
€ billion
Funding CP
17727
89
132
791
150
57
691
Assets Liabilities
Structural liquidity1 surplus: €150 bill. (14% net liabilities)
Commercial Gap: €100 bill.
Securitisations
Equity (103) and other (29)
Net loans to
customers
Financial assets
Fixed assets & other
Deposits
Funding M/LP

6666
LIQUIDITY AND FUNDING
Commercial activity evolution enabled a lower recourse to medium and
long- term wholesale funding, without eroding the structural liquidity surplus
(1) Placed in the market and including structured finance
Sterling area, 23%
Euro area, 42%
US$ area, 35%
2016 Diversified issuances
Total
14.4 13.1
45.8
31.3
60.2
44.4
2015 2016
Issuances
€ billion
M/L term issuance
Securitisations1

NPL, coverage ratios
and cost of credit

6868
NPL ratio%
31.03.15 30.06.15 30.09.15 31.12.15 31.03.16 30.06.16 30.09.16 31.12.16
Continental Europe 8.52 8.15 7.89 7.27 7.08 6.84 6.43 5.92
Spain 7.25 6.91 6.61 6.53 6.36 6.06 5.82 5.41
Santander Consumer Finance 4.52 4.25 4.15 3.42 3.28 2.95 2.86 2.68
Poland 7.33 7.07 7.14 6.30 5.93 5.84 5.71 5.42
Portugal 8.96 8.80 8.86 7.46 8.55 10.46 9.40 8.81
United Kingdom 1.75 1.61 1.51 1.52 1.49 1.47 1.47 1.41
Latin America 4.64 4.74 4.65 4.96 4.88 4.98 4.94 4.81
Brazil 4.90 5.13 5.30 5.98 5.93 6.11 6.12 5.90
Mexico 3.71 3.81 3.54 3.38 3.06 3.01 2.95 2.76
Chile 5.88 5.73 5.60 5.62 5.45 5.28 5.12 5.05
USA 2.20 2.20 2.20 2.13 2.19 2.24 2.24 2.28
Operating Areas 4.87 4.68 4.52 4.39 4.36 4.32 4.19 3.95
Total Group 4.85 4.64 4.50 4.36 4.33 4.29 4.15 3.93

6969
Coverage ratio%
31.03.15 30.06.15 30.09.15 31.12.15 31.03.16 30.06.16 30.09.16 31.12.16
Continental Europe 58.6 58.9 60.4 64.2 65.4 61.3 61.3 60.0
Spain 46.6 46.8 47.8 48.1 50.2 47.6 47.6 48.3
Santander Consumer Finance 103.6 104.9 107.2 109.1 111.9 110.6 110.7 109.1
Poland 61.6 63.5 63.1 64.0 67.0 65.8 68.9 61.0
Portugal 52.4 54.2 56.2 99.0 87.7 61.9 57.8 63.7
United Kingdom 41.2 40.3 39.6 38.2 36.5 36.5 36.0 32.9
Latin America 83.6 84.4 85.4 79.0 79.7 81.4 84.5 87.3
Brazil 95.2 95.9 96.0 83.7 83.7 85.3 89.3 93.1
Mexico 88.4 87.5 93.0 90.6 97.5 102.3 101.9 103.8
Chile 52.0 51.6 52.8 53.9 54.6 55.5 58.1 59.1
USA 211.5 224.2 218.3 225.0 221.1 220.6 216.2 214.4
Operating Areas 68.3 69.4 70.5 72.6 73.3 72.0 72.8 73.5
Total Group 68.9 70.1 71.1 73.1 74.0 72.5 72.7 73.8

7070
Percentage over Group's total
(*) Excluding SCF UK
Spain, 18%
SCF*, 10%
Poland, 3%
Portugal, 7%
UK, 5%Brazil, 20%
Mexico, 3%
Chile, 5%
USA, 18%
Other, 11%
Spain, 28%
SCF*, 7%
Poland, 4%
Portugal, 8%UK, 11%
Brazil, 16%
Mexico, 2%
Chile, 6%
USA, 6%
Other, 12%
100%: €33,643 mill. 100%: €24,835 mill.
Non-performing loans and loan-loss allowances. December 2016
Non-performing loans Loan-loss allowances

7171
Cost of credit%
31.03.15 30.06.15 30.09.15 31.12.15 31.03.16 30.06.16 30.09.16 31.12.16
Continental Europe 0.95 0.86 0.77 0.68 0.60 0.51 0.46 0.44
Spain 0.97 0.84 0.71 0.62 0.54 0.45 0.41 0.37
Santander Consumer Finance 0.93 0.91 0.87 0.77 0.64 0.55 0.49 0.47
Poland 1.00 1.00 0.96 0.87 0.82 0.75 0.76 0.70
Portugal 0.45 0.38 0.35 0.29 0.28 0.21 0.17 0.18
United Kingdom 0.11 0.08 0.04 0.03 0.01 0.03 0.05 0.02
Latin America 3.53 3.39 3.33 3.36 3.39 3.41 3.42 3.37
Brazil 4.63 4.45 4.40 4.50 4.63 4.71 4.87 4.89
Mexico 2.92 2.89 2.87 2.91 2.95 2.96 2.86 2.86
Chile 1.74 1.68 1.68 1.65 1.58 1.59 1.55 1.43
USA 3.25 3.39 3.36 3.66 3.85 3.77 3.80 3.68
Operating Areas 1.38 1.33 1.27 1.26 1.24 1.20 1.20 1.19
Total Group 1.38 1.32 1.26 1.25 1.22 1.19 1.19 1.18
Note: Cost of credit = 12 month loan-loss provisions / average lending. Calculated in current euros
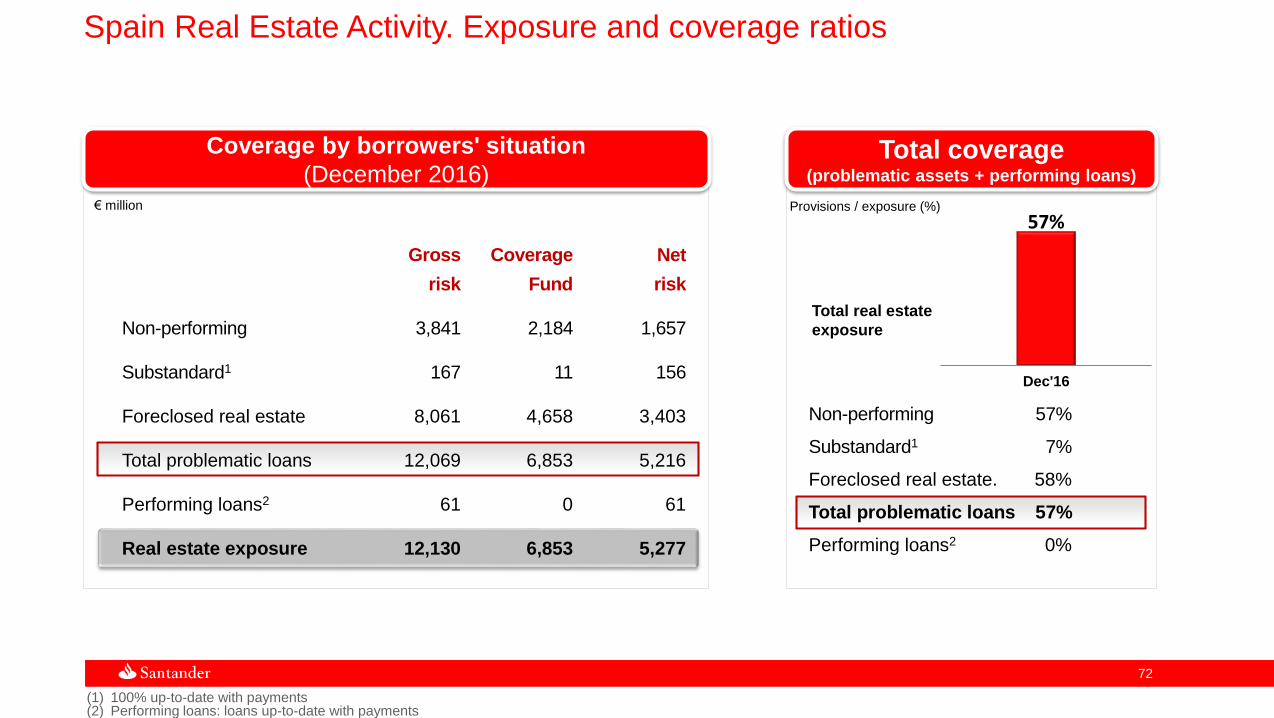
7272
Total coverage(problematic assets + performing loans)
57%
Dec'16
Provisions / exposure (%)
Coverage by borrowers' situation
(December 2016)
Gross Coverage Net
risk Fund risk
Non-performing 3,841 2,184 1,657
Substandard1 167 11 156
Foreclosed real estate 8,061 4,658 3,403
Total problematic loans 12,069 6,853 5,216
Performing loans2 61 0 61
Real estate exposure 12,130 6,853 5,277
(1) 100% up-to-date with payments(2) Performing loans: loans up-to-date with payments
€ million
Total real estate
exposure
Non-performing 57%
Substandard1 7%
Foreclosed real estate. 58%
Total problematic loans 57%
Performing loans2 0%
Spain Real Estate Activity. Exposure and coverage ratios

7373
LOANS Foreclosed REAL ESTATE (Dec’16)
€ million € million
Grossamount Coverage
NetamountDec’16 Dec’15 Var.
Finished buildings 2,120 2,735 -615
Buildings under constr. 97 137 -40
Developed land 1,270 1,603 -333
Building and other land 247 699 -452
Non mortgage guarantee 335 785 -450
Total 4,069 5,959 -1,890
Finished buildings 2,178 49% 1,104
Buildings under constr. 839 46% 453
Developed land 2,609 60% 1,051
Building and other land 2,435 67% 795
Other land 0 -- 0
Total 8,061 58% 3,403
Spain Real Estate Activity. Loans and foreclosures
Quarterly income
statements

7575
Grupo Santander€ million
1Q 15 2Q 15 3Q 15 4Q 15 1Q 16 2Q 16 3Q 16 4Q 16 2015 2016
NII + Fee income 10,563 10,867 10,457 10,336 10,021 10,119 10,395 10,734 42,222 41,268
Gross income 11,444 11,618 11,316 10,894 10,730 10,929 11,080 11,113 45,272 43,853
Operating expenses (5,377) (5,429) (5,342) (5,422) (5,158) (5,227) (5,250) (5,453) (21,571) (21,088)
Net operating income 6,067 6,189 5,974 5,472 5,572 5,703 5,831 5,660 23,702 22,766
Net loan-loss provisions (2,563) (2,508) (2,479) (2,558) (2,408) (2,205) (2,499) (2,406) (10,108) (9,518)
Other (514) (683) (716) (742) (433) (544) (392) (591) (2,654) (1,960)
Underlying profit before taxes 2,990 2,998 2,778 2,173 2,732 2,954 2,940 2,663 10,939 11,288
Underlying consolidated profit 2,067 2,059 1,991 1,702 1,922 1,984 2,036 1,951 7,819 7,893
Underlying attributable profit 1,717 1,709 1,680 1,460 1,633 1,646 1,695 1,646 6,566 6,621
Net capital gains and provisions* — 835 — (1,435) — (368) — (49) (600) (417)
Attributable profit 1,717 2,544 1,680 25 1,633 1,278 1,695 1,598 5,966 6,204
(*) Including: in 2Q15 net result of the reversal of provisions in Brazilin 4Q15 Banif's badwill, PPI, impairment of intangible assets and other provisions (goodwill and other)in 2Q16 capital gains from the disposal of the stake in Visa Europe, restructuring costs and contribution to the SRFIn 4Q16 PPI, restatement Santander Consumer USA and the SRF contribution, recorded in 2Q16, was reallocated to gross income

7676
Grupo SantanderConstant € million
1Q 15 2Q 15 3Q 15 4Q 15 1Q 16 2Q 16 3Q 16 4Q 16 2015 2016
NII + Fee income 9,629 9,963 10,073 10,153 10,210 10,196 10,312 10,550 39,817 41,268
Gross income 10,479 10,674 10,914 10,702 10,915 11,013 11,001 10,924 42,768 43,853
Operating expenses (4,939) (5,007) (5,132) (5,290) (5,220) (5,251) (5,228) (5,389) (20,368) (21,088)
Net operating income 5,540 5,667 5,781 5,412 5,695 5,762 5,773 5,535 22,400 22,766
Net loan-loss provisions (2,370) (2,338) (2,445) (2,569) (2,489) (2,243) (2,464) (2,322) (9,722) (9,518)
Other (475) (643) (700) (751) (450) (548) (379) (582) (2,569) (1,960)
Underlying profit before taxes 2,695 2,685 2,636 2,093 2,756 2,971 2,930 2,631 10,109 11,288
Underlying consolidated profit 1,854 1,827 1,875 1,635 1,942 1,994 2,028 1,929 7,190 7,893
Underlying attributable profit 1,525 1,502 1,571 1,394 1,649 1,652 1,690 1,630 5,992 6,621
Net capital gains and provisions* — 835 — (1,435) — (368) — (49) (600) (417)
Attributable profit 1,525 2,337 1,571 (41) 1,649 1,284 1,690 1,582 5,392 6,204
(*) Including: in 2Q15 net result of the reversal of provisions in Brazilin 4Q15 Banif's badwill, PPI, impairment of intangible assets and other provisions (goodwill and other)in 2Q16 capital gains from the disposal of the stake in Visa Europe, restructuring costs and contribution to the SRFIn 4Q16 PPI, restatement Santander Consumer USA and the SRF contribution, recorded in 2Q16, was reallocated to gross income
7777
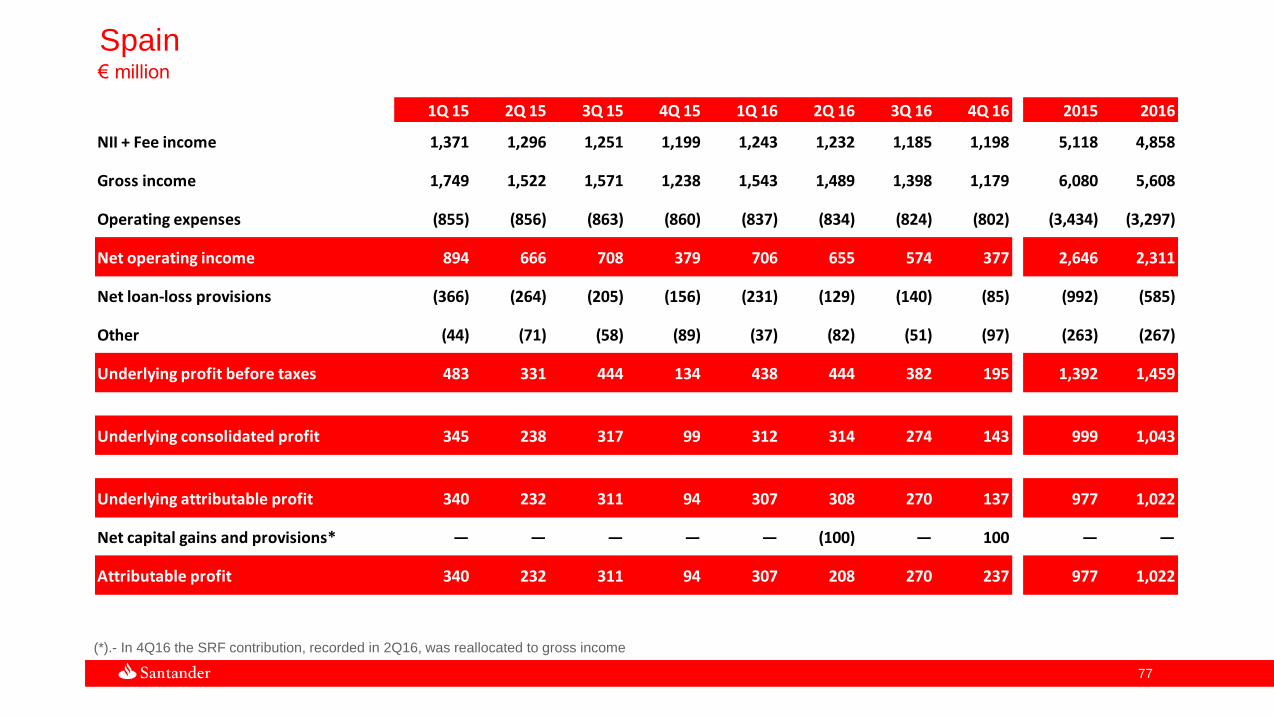
Spain€ million
1Q 15 2Q 15 3Q 15 4Q 15 1Q 16 2Q 16 3Q 16 4Q 16 2015 2016
NII + Fee income 1,371 1,296 1,251 1,199 1,243 1,232 1,185 1,198 5,118 4,858
Gross income 1,749 1,522 1,571 1,238 1,543 1,489 1,398 1,179 6,080 5,608
Operating expenses (855) (856) (863) (860) (837) (834) (824) (802) (3,434) (3,297)
Net operating income 894 666 708 379 706 655 574 377 2,646 2,311
Net loan-loss provisions (366) (264) (205) (156) (231) (129) (140) (85) (992) (585)
Other (44) (71) (58) (89) (37) (82) (51) (97) (263) (267)
Underlying profit before taxes 483 331 444 134 438 444 382 195 1,392 1,459
Underlying consolidated profit 345 238 317 99 312 314 274 143 999 1,043
Underlying attributable profit 340 232 311 94 307 308 270 137 977 1,022
Net capital gains and provisions* — — — — — (100) — 100 — —
Attributable profit 340 232 311 94 307 208 270 237 977 1,022
(*).- In 4Q16 the SRF contribution, recorded in 2Q16, was reallocated to gross income
7878
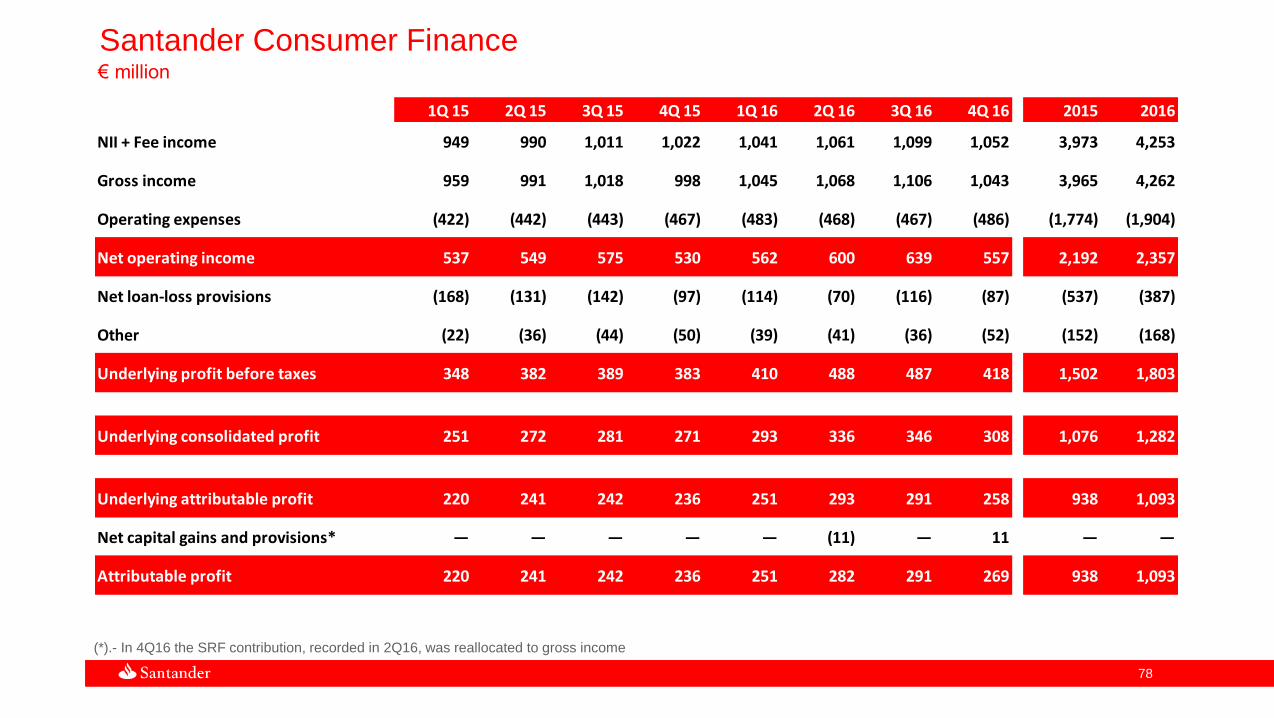
Santander Consumer Finance€ million
1Q 15 2Q 15 3Q 15 4Q 15 1Q 16 2Q 16 3Q 16 4Q 16 2015 2016
NII + Fee income 949 990 1,011 1,022 1,041 1,061 1,099 1,052 3,973 4,253
Gross income 959 991 1,018 998 1,045 1,068 1,106 1,043 3,965 4,262
Operating expenses (422) (442) (443) (467) (483) (468) (467) (486) (1,774) (1,904)
Net operating income 537 549 575 530 562 600 639 557 2,192 2,357
Net loan-loss provisions (168) (131) (142) (97) (114) (70) (116) (87) (537) (387)
Other (22) (36) (44) (50) (39) (41) (36) (52) (152) (168)
Underlying profit before taxes 348 382 389 383 410 488 487 418 1,502 1,803
Underlying consolidated profit 251 272 281 271 293 336 346 308 1,076 1,282
Underlying attributable profit 220 241 242 236 251 293 291 258 938 1,093
Net capital gains and provisions* — — — — — (11) — 11 — —
Attributable profit 220 241 242 236 251 282 291 269 938 1,093
(*).- In 4Q16 the SRF contribution, recorded in 2Q16, was reallocated to gross income

7979
Santander Consumer FinanceConstant € million
1Q 15 2Q 15 3Q 15 4Q 15 1Q 16 2Q 16 3Q 16 4Q 16 2015 2016
NII + Fee income 937 972 1,005 1,021 1,045 1,062 1,098 1,047 3,935 4,253
Gross income 946 973 1,012 997 1,050 1,069 1,105 1,039 3,928 4,262
Operating expenses (417) (435) (440) (467) (485) (468) (467) (485) (1,758) (1,904)
Net operating income 530 538 572 530 565 600 639 554 2,170 2,357
Net loan-loss provisions (165) (129) (141) (97) (115) (70) (116) (86) (532) (387)
Other (22) (36) (44) (50) (39) (41) (36) (52) (152) (168)
Underlying profit before taxes 343 374 386 383 411 489 487 415 1,486 1,803
Underlying consolidated profit 247 266 279 271 294 336 345 306 1,064 1,282
Underlying attributable profit 216 235 240 236 252 293 291 257 927 1,093
Net capital gains and provisions* — — — — — (11) — 11 — —
Attributable profit 216 235 240 236 252 282 291 268 927 1,093
(*).- In 4Q16 the SRF contribution, recorded in 2Q16, was reallocated to gross income

8080
Poland€ million
1Q 15 2Q 15 3Q 15 4Q 15 1Q 16 2Q 16 3Q 16 4Q 16 2015 2016
NII + Fee income 291 301 300 311 292 298 321 323 1,204 1,233
Gross income 340 336 309 292 311 345 330 329 1,276 1,314
Operating expenses (151) (153) (146) (143) (145) (146) (149) (139) (594) (579)
Net operating income 190 182 162 149 166 199 181 190 683 735
Net loan-loss provisions (39) (46) (39) (44) (33) (34) (43) (35) (167) (145)
Other (1) (2) 3 (4) (22) (29) (6) (25) (4) (83)
Profit before taxes 150 135 125 101 111 136 132 129 511 508
Consolidated profit 122 112 99 77 88 108 100 91 410 387
Attributable profit 89 82 73 57 64 75 69 63 300 272

8181
PolandPLN million
1Q 15 2Q 15 3Q 15 4Q 15 1Q 16 2Q 16 3Q 16 4Q 16 2015 2016
NII + Fee income 1,220 1,232 1,255 1,327 1,275 1,301 1,391 1,412 5,034 5,379
Gross income 1,427 1,371 1,293 1,247 1,357 1,507 1,430 1,440 5,338 5,733
Operating expenses (632) (626) (614) (611) (632) (638) (647) (609) (2,484) (2,527)
Net operating income 794 745 679 636 724 869 783 831 2,855 3,207
Net loan-loss provisions (164) (187) (164) (186) (144) (149) (186) (153) (700) (632)
Other (3) (9) 11 (16) (97) (126) (25) (111) (17) (360)
Profit before taxes 627 549 526 435 483 593 573 566 2,137 2,215
Consolidated profit 512 456 416 331 384 471 434 399 1,715 1,688
Attributable profit 372 333 306 245 281 327 300 277 1,256 1,185

8282
Portugal€ million
1Q 15 2Q 15 3Q 15 4Q 15 1Q 16 2Q 16 3Q 16 4Q 16 2015 2016
NII + Fee income 211 208 200 200 273 262 260 251 818 1,047
Gross income 238 234 226 318 337 293 287 292 1,016 1,209
Operating expenses (123) (122) (124) (125) (154) (149) (142) (143) (494) (589)
Net operating income 115 112 102 193 183 144 145 149 522 620
Net loan-loss provisions (22) (21) (24) (5) (22) (6) (16) (9) (72) (54)
Other (21) (23) 23 (10) (2) (21) (5) (5) (31) (34)
Underlying profit before taxes 72 67 101 178 158 116 124 134 419 533
Underlying consolidated profit 55 49 77 120 122 89 93 98 301 402
Underlying attributable profit 55 49 77 119 121 89 92 97 300 399
Net capital gains and provisions* — — — — — (9) — 9 — —
Attributable profit 55 49 77 119 121 80 92 106 300 399
(*).- In 4Q16 the SRF contribution, recorded in 2Q16, was reallocated to gross income

8383
United Kingdom£ million
1Q 15 2Q 15 3Q 15 4Q 15 1Q 16 2Q 16 3Q 16 4Q 16 2015 2016
NII + Fee income 1,100 1,110 1,092 1,076 1,105 1,096 1,108 1,133 4,377 4,442
Gross income 1,152 1,173 1,150 1,155 1,166 1,180 1,172 1,234 4,630 4,752
Operating expenses (612) (608) (605) (610) (611) (619) (599) (594) (2,435) (2,424)
Net operating income 540 565 545 545 554 561 573 640 2,195 2,328
Net loan-loss provisions (56) (12) 6 (15) (5) (53) (37) 48 (78) (48)
Other (41) (36) (94) (85) (45) (56) (71) (104) (257) (277)
Profit before taxes 443 516 457 444 504 452 465 583 1,860 2,004
Consolidated profit 356 401 350 350 356 316 316 414 1,457 1,402
Attributable profit 350 394 343 343 349 307 311 407 1,430 1,373

8484
Brazil€ million
1Q 15 2Q 15 3Q 15 4Q 15 1Q 16 2Q 16 3Q 16 4Q 16 2015 2016
NII + Fee income 2,962 2,869 2,598 2,534 2,365 2,583 2,899 3,155 10,963 11,002
Gross income 3,007 2,981 2,656 2,497 2,381 2,703 3,050 3,187 11,140 11,321
Operating expenses (1,187) (1,151) (1,056) (1,059) (947) (1,046) (1,177) (1,305) (4,452) (4,475)
Net operating income 1,820 1,830 1,600 1,438 1,434 1,657 1,873 1,882 6,689 6,845
Net loan-loss provisions (826) (828) (813) (830) (720) (753) (951) (953) (3,297) (3,377)
Other (209) (263) (255) (151) (177) (193) (134) (193) (878) (696)
Profit before taxes 785 739 533 457 536 711 788 736 2,513 2,772
Consolidated profit 532 509 434 350 399 481 544 575 1,824 1,999
Attributable profit 477 452 385 317 359 429 488 510 1,631 1,786

8585
BrazilR$ million
1Q 15 2Q 15 3Q 15 4Q 15 1Q 16 2Q 16 3Q 16 4Q 16 2015 2016
NII + Fee income 9,522 9,736 10,129 10,570 10,161 10,216 10,500 11,271 39,958 42,147
Gross income 9,666 10,109 10,362 10,468 10,227 10,708 11,067 11,364 40,605 43,366
Operating expenses (3,815) (3,904) (4,110) (4,396) (4,068) (4,138) (4,266) (4,671) (16,225) (17,143)
Net operating income 5,851 6,205 6,251 6,072 6,159 6,570 6,801 6,693 24,379 26,223
Net loan-loss provisions (2,657) (2,808) (3,138) (3,415) (3,093) (2,972) (3,473) (3,398) (12,017) (12,937)
Other (672) (888) (975) (667) (762) (763) (457) (686) (3,201) (2,668)
Profit before taxes 2,523 2,509 2,139 1,990 2,304 2,835 2,870 2,609 9,161 10,619
Consolidated profit 1,711 1,726 1,704 1,509 1,716 1,908 1,979 2,055 6,650 7,658
Attributable profit 1,534 1,536 1,514 1,362 1,540 1,704 1,774 1,821 5,946 6,840

8686
Mexico€ million
1Q 15 2Q 15 3Q 15 4Q 15 1Q 16 2Q 16 3Q 16 4Q 16 2015 2016
NII + Fee income 791 834 794 832 767 768 767 794 3,251 3,096
Gross income 819 854 794 850 792 786 796 828 3,317 3,203
Operating expenses (355) (353) (327) (334) (322) (317) (311) (325) (1,370) (1,274)
Net operating income 463 501 467 516 470 469 486 503 1,947 1,928
Net loan-loss provisions (211) (224) (227) (215) (221) (214) (194) (203) (877) (832)
Other 8 (2) 1 (10) (6) (11) (5) (8) (4) (30)
Profit before taxes 260 274 241 291 243 244 288 293 1,067 1,067
Consolidated profit 201 213 193 224 187 192 223 217 831 820
Attributable profit 153 160 143 173 143 146 172 169 629 629

8787
MexicoMillion pesos
1Q 15 2Q 15 3Q 15 4Q 15 1Q 16 2Q 16 3Q 16 4Q 16 2015 2016
NII + Fee income 13,300 14,117 14,479 15,219 15,253 15,690 16,028 16,922 57,115 63,893
Gross income 13,769 14,450 14,503 15,547 15,745 16,054 16,647 17,645 58,269 66,093
Operating expenses (5,973) (5,978) (5,978) (6,131) (6,402) (6,479) (6,497) (6,922) (24,060) (26,300)
Net operating income 7,795 8,472 8,526 9,416 9,343 9,576 10,151 10,723 34,209 39,792
Net loan-loss provisions (3,545) (3,791) (4,131) (3,939) (4,399) (4,364) (4,062) (4,337) (15,406) (17,162)
Other 130 (36) 17 (174) (123) (233) (98) (161) (64) (615)
Profit before taxes 4,380 4,644 4,412 5,302 4,821 4,979 5,990 6,225 18,739 22,015
Consolidated profit 3,381 3,606 3,530 4,080 3,724 3,919 4,643 4,629 14,597 16,915
Attributable profit 2,574 2,704 2,613 3,155 2,839 2,979 3,577 3,589 11,046 12,983

8888
Chile€ million
1Q 15 2Q 15 3Q 15 4Q 15 1Q 16 2Q 16 3Q 16 4Q 16 2015 2016
NII + Fee income 485 593 554 519 509 534 561 613 2,151 2,216
Gross income 553 633 606 543 556 577 616 672 2,336 2,422
Operating expenses (238) (263) (243) (260) (235) (237) (249) (265) (1,004) (986)
Net operating income 316 370 364 283 321 339 368 407 1,332 1,435
Net loan-loss provisions (132) (126) (153) (157) (109) (127) (146) (131) (567) (514)
Other 6 (3) (4) 4 1 (1) 6 (35) 3 (27)
Profit before taxes 190 241 207 130 213 211 228 241 768 894
Consolidated profit 147 212 182 113 173 181 187 195 655 735
Attributable profit 106 147 125 78 122 126 129 137 455 513

8989
ChileCh$ billion
1Q 15 2Q 15 3Q 15 4Q 15 1Q 16 2Q 16 3Q 16 4Q 16 2015 2016
NII + Fee income 341 406 414 397 393 409 414 441 1,557 1,657
Gross income 389 432 454 416 430 441 455 484 1,691 1,810
Operating expenses (167) (180) (182) (198) (182) (182) (184) (191) (727) (737)
Net operating income 222 253 272 218 248 260 272 293 964 1,073
Net loan-loss provisions (92) (86) (113) (119) (84) (98) (108) (94) (410) (384)
Other 4 (2) (3) 3 1 (0) 5 (26) 2 (20)
Profit before taxes 134 165 155 103 165 162 169 173 556 668
Consolidated profit 104 146 136 89 134 138 138 140 474 550
Attributable profit 74 101 94 61 94 96 95 98 330 384

9090
United States$ million
1Q 15 2Q 15 3Q 15 4Q 15 1Q 16 2Q 16 3Q 16 4Q 16 2015 2016
NII + Fee income 1,940 2,011 2,019 2,014 2,018 1,983 1,925 1,838 7,984 7,764
Gross income 2,101 2,210 2,169 2,167 2,168 2,133 2,085 1,945 8,647 8,332
Operating expenses (783) (806) (858) (907) (856) (874) (875) (932) (3,354) (3,538)
Net operating income 1,318 1,404 1,311 1,260 1,312 1,259 1,210 1,013 5,293 4,794
Net loan-loss provisions (719) (834) (834) (1,053) (949) (797) (867) (935) (3,440) (3,548)
Other (21) (46) (41) (56) (72) (16) (3) (8) (164) (99)
Profit before taxes 579 524 436 150 291 446 340 69 1,689 1,146
Consolidated profit 401 350 294 73 177 285 238 54 1,117 754
Attributable profit 289 239 207 17 90 178 157 12 752 437

9191
Corporate Centre€ million
1Q 15 2Q 15 3Q 15 4Q 15 1Q 16 2Q 16 3Q 16 4Q 16 2015 2016
NII + Fee income (222) (138) (139) (142) (173) (192) (201) (204) (641) (771)
Gross income (230) (177) (56) (32) (223) (244) (316) (282) (495) (1,066)
Operating expenses (142) (150) (142) (112) (126) (120) (104) (99) (547) (450)
Net operating income (372) (327) (199) (144) (349) (365) (421) (381) (1,042) (1,516)
Net loan-loss provisions (1) 2 (1) 26 1 (5) 5 0 27 2
Other (98) (132) (148) (130) (5) (55) (59) 44 (507) (75)
Underlying profit before taxes (470) (457) (348) (247) (353) (424) (474) (337) (1,523) (1,589)
Underlying consolidated profit (465) (489) (392) (117) (317) (418) (414) (298) (1,464) (1,448)
Underlying attributable profit (491) (489) (395) (119) (311) (418) (412) (299) (1,493) (1,439)
Net capital gains and provisions* — 835 — (1,435) — (248) — (169) (600) (417)
Attributable profit (491) 346 (395) (1,554) (311) (666) (412) (467) (2,093) (1,856)
(*) Including: in 2Q15 net result of the reversal of provisions in Brazilin 4Q15 Banif's badwill, PPI, impairment of intangible assets and other provisions (goodwill and other)in 2Q16 capital gains from the disposal of the stake in Visa Europe and restructuring costsin 4Q16 PPI and restatement SC USA

Nuestra misión es contribuir al progreso de las personas y
de las empresas.
Nuestra cultura se basa en la creencia de que todo lo que
hacemos debe ser
Thank you
Our purpose is to help people and
businesses prosper.
Our culture is based on the belief that
everything we do should be