earnings related schemes: design, options and experience · earnings related schemes: design,...
TRANSCRIPT

Earnings related schemes:
Design, options and experience
Edward Whitehouse
World Bank core course
Washington DC, March 2014

Objectives
Primary objective: ensuring older people have a decent standard of
living
Secondary objectives capital markets:
institutional development
encourage national savings
labour markets retirement decisions
restructuring
public finances providing funds for socially/economically targeted
investments

Objectives
Primary objective
ensuring older people have a decent standard of living in retirement
Two interpretations
‘Adequacy’: ensuring older people meet a basic standard of living
‘Insurance/forced savings’: ensuring a reasonable standard of living in retirement relative to position before retirement

Objectives and measures
Adequacy: an absolute measure of living standards individual pension entitlement as a proportion of
economy-wide average earnings
pension level
Insurance: a relative measure of living standards individual pension entitlement relative to
individual earnings when working
replacement rate
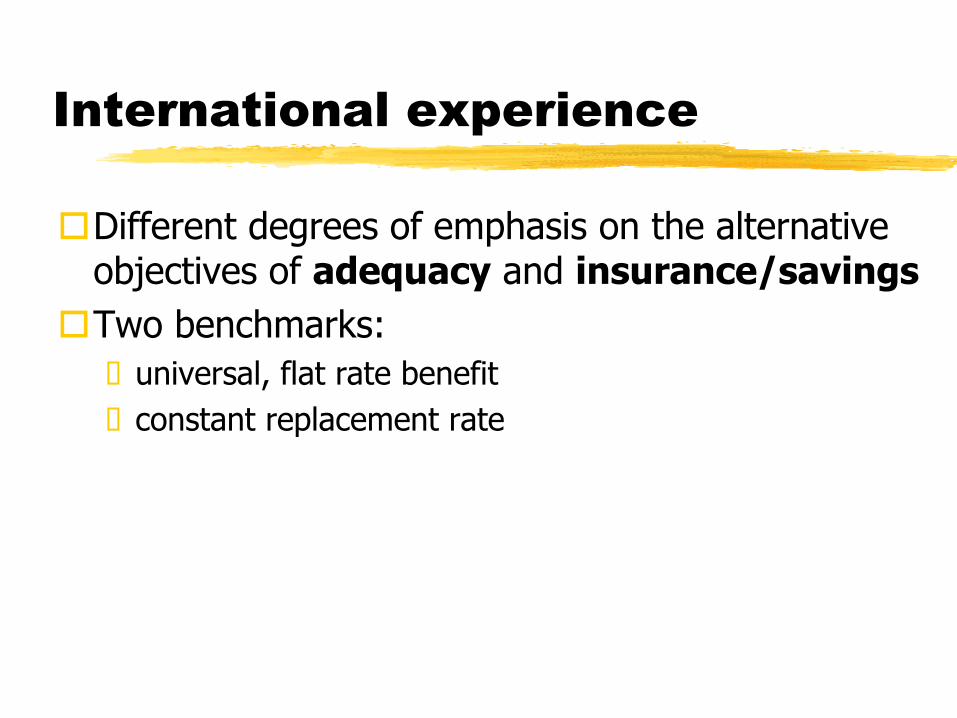
International experience
Different degrees of emphasis on the alternative objectives of adequacy and insurance/savings
Two benchmarks:
universal, flat rate benefit
constant replacement rate

Benchmarks
0
0.25
0.5
0.75
1
1.25
0 0.5 1 1.5 2
0
0.25
0.5
0.75
1
1.25
0 0.5 1 1.5 2
Relative pension level Replacement rate
Basic
Basic
Earnings related
Earnings related

Relative pension levels:
adequacy emphasis
Source: OECD
Pensions at a Glance

Relative pension levels:
insurance emphasis
Source: OECD
Pensions at a Glance

Relative pension levels:
intermediate
Source: OECD
Pensions at a Glance
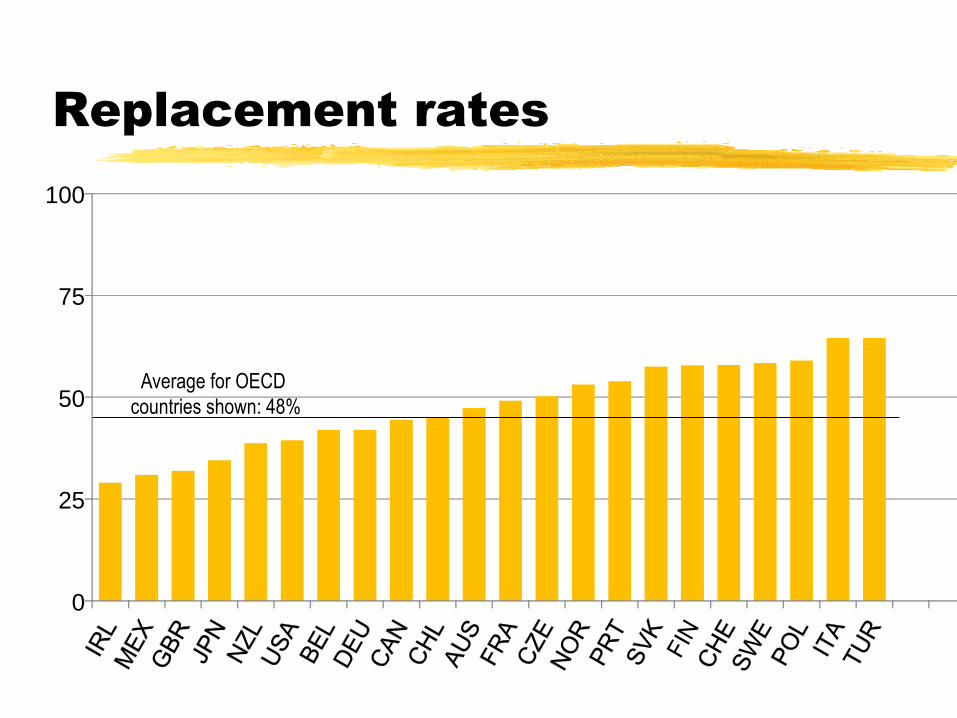
Replacement rates
0
25
50
75
100
Average for OECD
countries shown: 48%
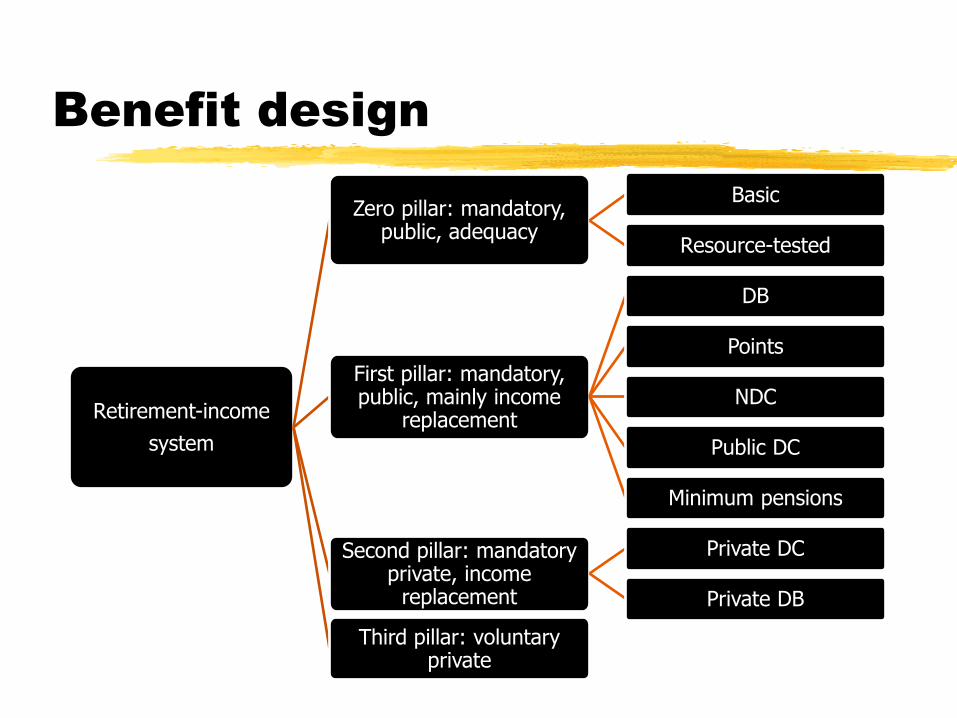
Benefit design
Retirement-income
system
Zero pillar: mandatory, public, adequacy
Basic
Resource-tested
First pillar: mandatory, public, mainly income
replacement
DB
Points
NDC
Public DC
Minimum pensions
Second pillar: mandatory private, income
replacement
Private DC
Private DB
Third pillar: voluntary private

Benefit design 1
‘Adequacy’ schemes
What is an adequate, minimum income for older people?
depends on family structures within a society
must be defined relative to living standards of rest of society (20-33% is the international norm)
must be affordable; avoid shifting poverty to other groups
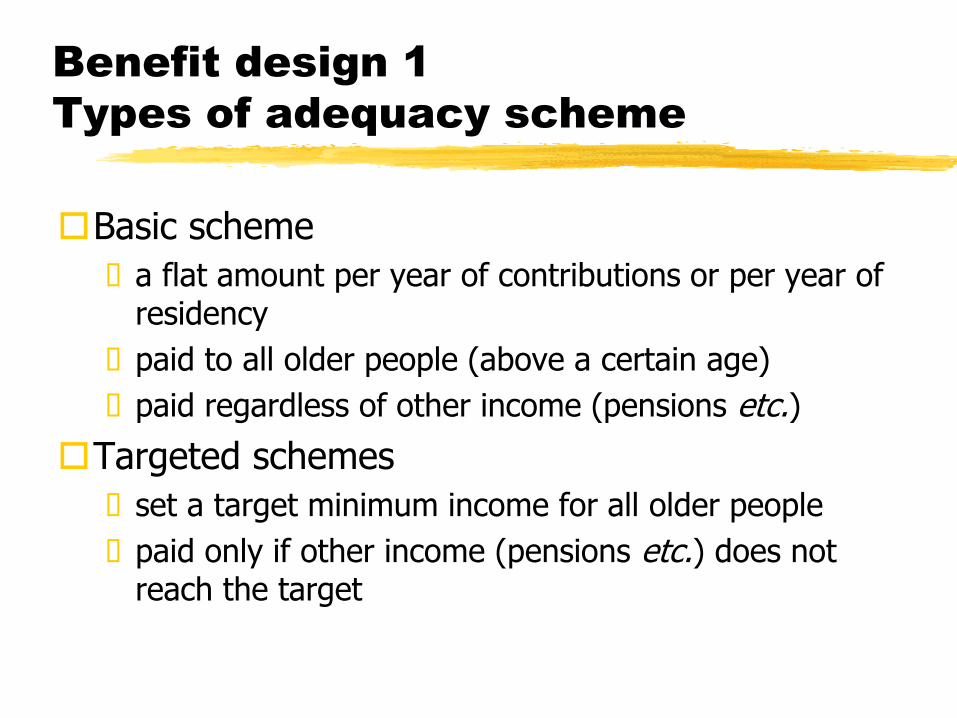
Benefit design 1
Types of adequacy scheme
Basic scheme
a flat amount per year of contributions or per year of residency
paid to all older people (above a certain age)
paid regardless of other income (pensions etc.)
Targeted schemes
set a target minimum income for all older people
paid only if other income (pensions etc.) does not reach the target
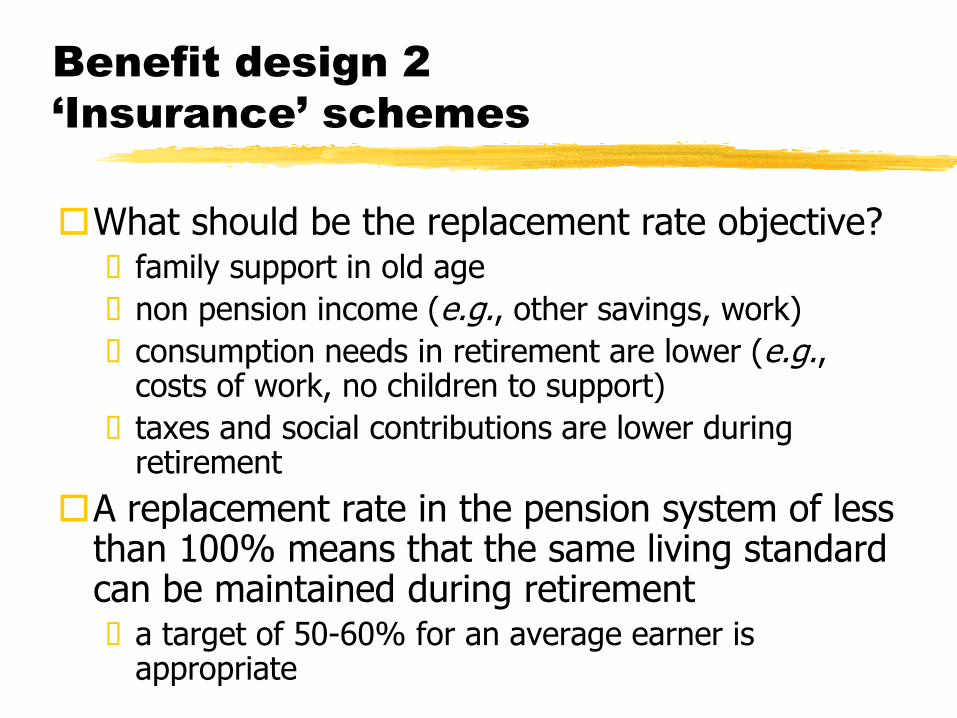
Benefit design 2
‘Insurance’ schemes
What should be the replacement rate objective? family support in old age
non pension income (e.g., other savings, work)
consumption needs in retirement are lower (e.g., costs of work, no children to support)
taxes and social contributions are lower during retirement
A replacement rate in the pension system of less than 100% means that the same living standard can be maintained during retirement a target of 50-60% for an average earner is
appropriate
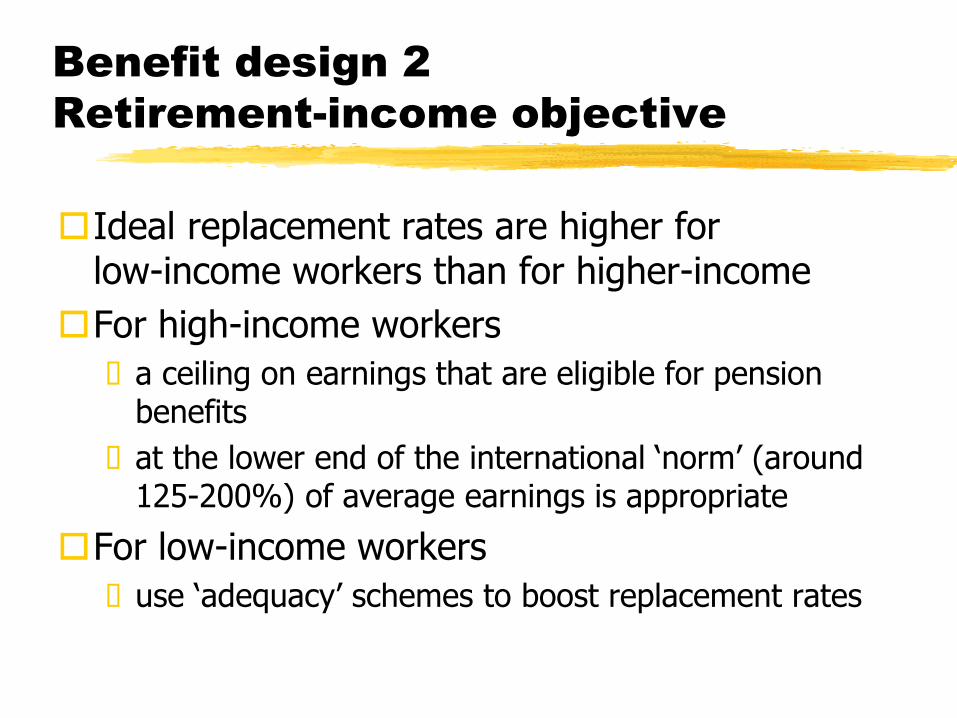
Benefit design 2
Retirement-income objective
Ideal replacement rates are higher for low-income workers than for higher-income
For high-income workers
a ceiling on earnings that are eligible for pension benefits
at the lower end of the international ‘norm’ (around 125-200%) of average earnings is appropriate
For low-income workers
use ‘adequacy’ schemes to boost replacement rates
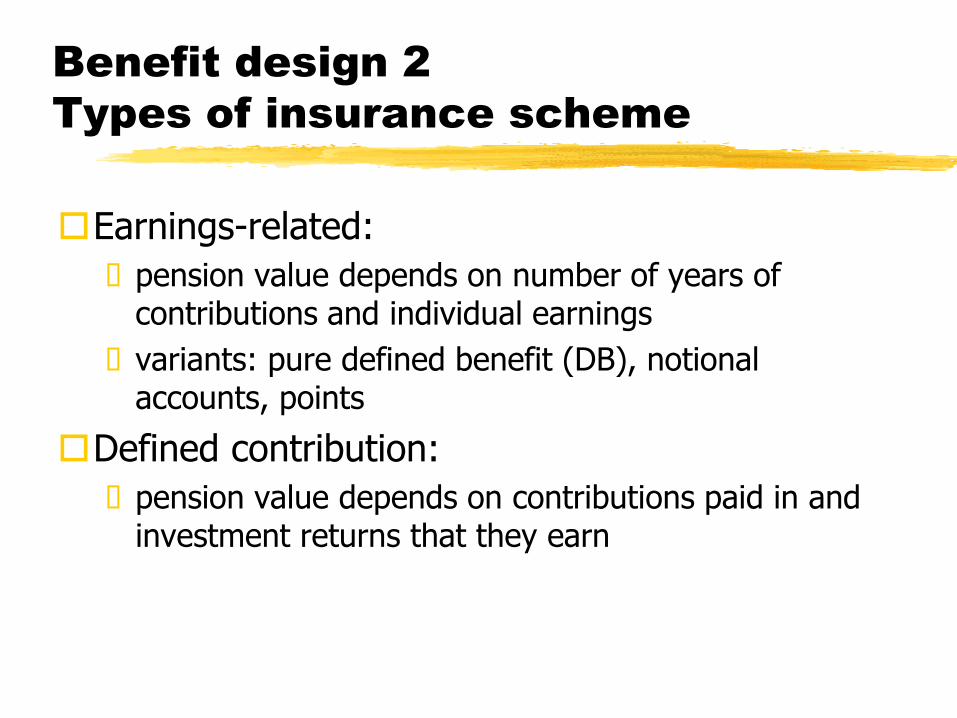
Benefit design 2
Types of insurance scheme
Earnings-related:
pension value depends on number of years of contributions and individual earnings
variants: pure defined benefit (DB), notional accounts, points
Defined contribution:
pension value depends on contributions paid in and investment returns that they earn

Benefit design 2
Country practice: mandatory schemes
OECD (24) ECA (10) LAC (9) MENA (10)
Public
None 3 - - -
DB/points 15 8 2 10
NDC 3 2 - -
Private
DB 3 - - -
DC 5 5 8 -
Source: World Bank
Pensions Panorama

Some equations
Defined benefit
Points
Notional accounts
Two identities if u = x = n
then a = v / k = c / A

Benefit design 2
Defined benefit schemes
Target replacement rate sets the ‘accrual rate’:
pension value as a percentage of individual earnings resulting from a years’ contributions
e.g., a 60% replacement rate implies 1.5% annual accrual rate x 40 years’ contributions
Accrual rates are best ‘linear’
that means the same accrual rate for all years and at all ages

Benefit design 2
Defined benefit schemes
Earnings measure: ‘final’ salary used to be very common
now countries have moved to lifetime average salary
Explanations: improved record-keeping
computerisation makes lifetime calculations easier
final salary no longer needed to protect against effects of inflation between earning rights and retirement
Problems of final-salary schemes: distributional effects
strategic manipulation
costs

Earnings measures
0
5
10
15
20
25
30
35
40
45
50
Pre - reform Post - reform
Iceland Germany
United
States
Canada
Hungary
Japan, Korea,
Luxembourg ,
Switzerland
N umber of years of earnings
in pension calculation
0
5
10
15
20
25
30
35
40
45
50
Pre - reform Post - reform
N umber of years of earnings
in pension calculation
Norway,
United Kingdom
Austria ,
Finland ,
Poland ,
Portugal Czech
Republic
France
Greece, Netherlands ,
Slovak Republic,
Italy, Turkey
Spain,
Sweden

Benefit design 3
Indexation
Indexation:
automatic adjustment of pensions in payment to reflect changes in costs of living or standards of living
not the arbitrary result of annual negotiation
without adjustment, purchasing power of pension can decline quickly: indexation ensures adequacy in a dynamic sense
Few countries had automatic adjustments until the 1970s
then, high inflation led all industrialised countries to adopt automatic indexation

Benefit design 4
Pension eligibility age
All pension systems have a ‘normal’ pension eligibility age (even if people often retire earlier)
There are no guiding principles as to what this should be
Therefore, examine what other countries do
‘normal’ pension eligibility age
life expectancy at that age

Pension eligibility ages
0
5
10
15
20
62 63 66 68 70
SVK
61 64 65 67 69
FRA
SVN
GBR
EST
AUS
DNK
DEU
ISL ISR (64F)
USA
NOR
Normal pensionable age, years
Number of OECD-34 countries
ESP
PRT
SWE
TUR
CHE (64F)
JPN
AUT BEL
CAN
CZE
CHL (60F)
FIN
GRC
HUN
IRL ITA
KOR LUX
MEX
NLD
NZE
POL

Trends in life expectancy at
age 65
Men Women Additional years
of life expectancy
0
5
10
15
20
25
1960 1980 2000 2020 2040 2050
Lowest(TUR, KOR, CZE, HUN)
Highest OECD country(NOR, ICE, JPN)
Lowest(SVK, TUR)
Highest(JPN, AUS)
2010 1960 1980 2000 2020 2040 2050
0
5
10
15
20
25
2010
Lowest(TUR)
Highest OECD country(NOR, CAN, CHE, JPN)
Lowest(TUR)
Highest (JPN)
Source: OECD Pensions Outlook 2012

Trends in life expectancy at
normal pension age
0
5
10
15
20
25
30
1960 1980 2000 2010 2020 2040 2050
Lowest(IRL, DNK)
Highest OECD country(GRC, ITA)
Lowest(HUN, EST, CZE)
Highest(GRC LUX)
Additional years
of life expectancy
1960 1980 2000 2010 2020 2040 2050
Lowest (IRL, DNK)
Lowest (CZE, DNK, IRL)
Highest (FRA, LUX)
Highest OECD country(ITA, JPN)
Men Women
Source: OECD Pensions Outlook 2012

Benefit design 4
Pension age and retirement duration
60 62 65 67 68 70
15
17.5
20
22.5
25
27.5
30
60 62 65 67 68 70
Life expectancy at normal pension age, years
Pensionable age
Men Women
AUS
AUT
BEL
CAN
CZE
DNK
FIN
FRA
DEU
GRC
HUN
ISL
IRL ITA
JPN
KOR
LUX
MEX
NLD
NZE
NOR
POL
PRT
SVK
ESP
SWE CHE
TUR
GBR USA OECD
AUS
AUT, CAN, FIN
BEL
CZE
DNK
FRA
DEU
GRC
HUN
ISL
IRL ITA
JPN
KOR
LUX
MEX
NLD NZE
NOR
POL
PRT
SVK
ESP
SWE
CHE
TUR GBR
USA
OECD
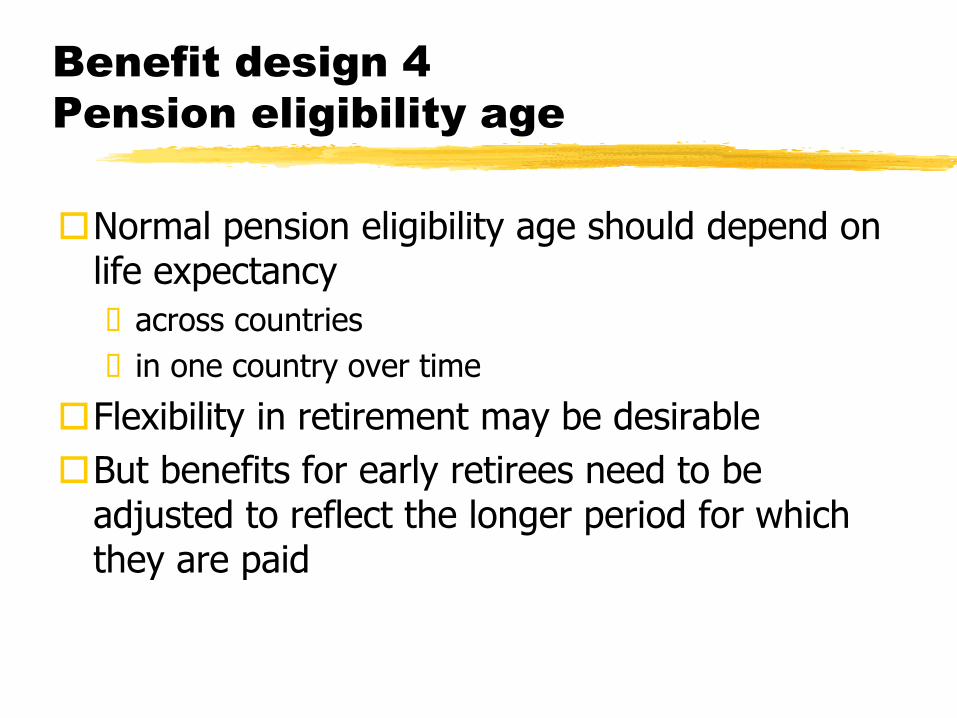
Normal pension eligibility age should depend on life expectancy
across countries
in one country over time
Flexibility in retirement may be desirable
But benefits for early retirees need to be adjusted to reflect the longer period for which they are paid
Benefit design 4
Pension eligibility age

Financing pensions 1
A general principle:
‘Adequacy’ pensions should be paid for from the central government budget
‘Insurance’ pensions should be self-financing, that is paid for out of contributions from individual members and employers
In defined-contribution, ‘insurance’ pensions this is simple to achieve
the contributions made by or on behalf of each individual member will automatically equal the benefits that he or she receives

Financing pensions 2
In defined-benefit and other earnings-related schemes, this is more complicated to achieve
Actuarial/economic techniques can be used to show which combinations of parameters and rules are feasible
Three key parameters
target replacement rate
pension eligibility age
contribution rate

Defined contribution pensions
Value of pension is not set by the government
Instead, it depends on the performance of the investments into which contributions are put
Outcomes are uncertain because capital markets can be volatile

Diversification
‘It is the part of a wise man to keep himself today for tomorrow, and not venture all his eggs in one basket’ (Miguel de Cervantes, 1605, Don Quixote)
Pay-as-you-go public pensions:
sustainable rate of return = earnings growth + employment growth
Funded pensions
rate of return in capital market directly or indirectly affects pension value
Think of pension package as a ‘portfolio’ of different ‘assets’

Diversification
Investment portfolio
Canada France Germany Italy Japan Sweden United
Kingdom United States
Domestic 21.2 -9.7 -8.6 -22.0 8.3 12.4 -28.2 3.5 (34.4) (66.9) (76.1) (38.1) (69.2) (58.2) (15.3) (86.1)
OECD-8 16.3 -26.0 -14.6 1.9 -15.2 8.8 -11.6 4.8 (47.0) (24.2) (60.3) (93.4) (50.0) (69.7) (60.8) (83.3)
Correlation between real earnings growth and real return on ‘balanced’* portfolio
Correlation coefficient and p-value in per cent Note: ‘Balanced’ portfolio comprises 50% equities, 50% government bonds. ‘Domestic’ includes only home capital markets, OECD-8 diversifies investments between all countries shown.
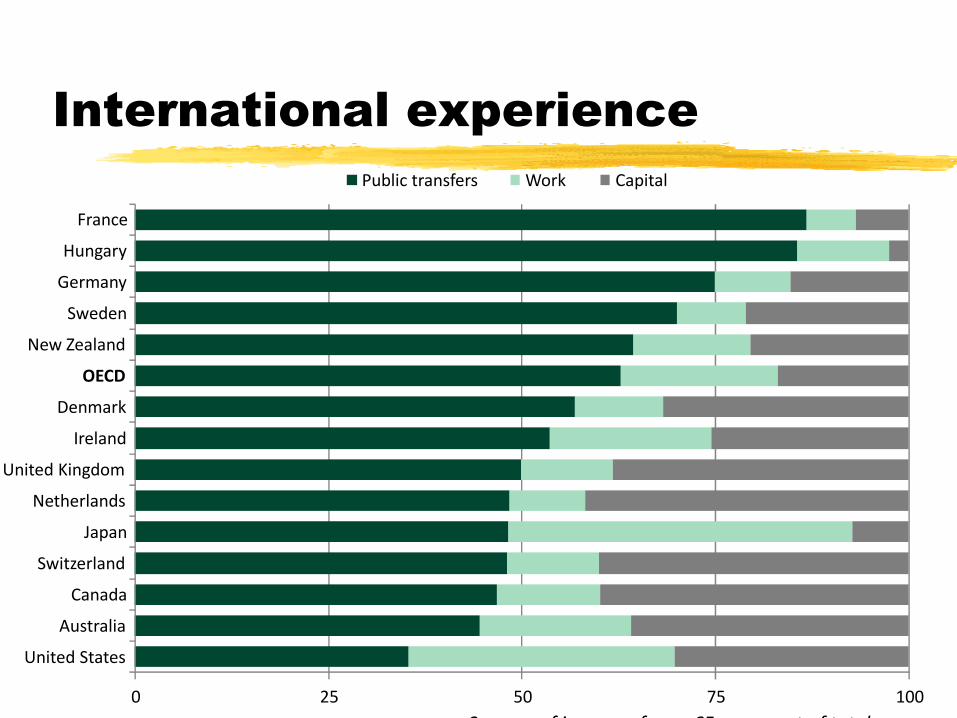
International experience
0 25 50 75 100
United States
Australia
Canada
Switzerland
Japan
Netherlands
United Kingdom
Ireland
Denmark
OECD
New Zealand
Sweden
Germany
Hungary
France
Public transfers Work Capital
Sources of income of over 65s, per cent of total

Principles of pension design
Adequacy ensure that all older people, regardless of their career history, have
enough money to survive
Self-financing insurance benefits should be financed wholly from contribution
revenues without support from the central budget
Secure pensions promises are sustainable and affordable
pensions are protected against inflation
Transparent people know what they can expect in retirement income
Efficient administration is effective and costs are as low as possible
avoids distorting economic choices (e.g., savings and retirement decisions)
limits opportunities for ‘gaming’ the system

Issues
What level should the adequacy pension be?
What type of adequacy pension?
What type of insurance pension?
What target replacement rate?
What pension eligibility age?