earnings update q3fy16 - bharat financial … update q3fy16 sks microfinance limited bse: 533228...
TRANSCRIPT
EARNINGS UPDATE Q3FY16
SKS Microfinance LimitedBSE: 533228 ● NSE: SKSMICRO
Corporate Identity No. L65999MH2003PLC250504
www.sksindia.com
This presentation is solely for viewing. No part of it may be circulated, quoted, or reproduced for distribution without prior written approval from SKS Microfinance Limited. 1
JANUARY 2016
CONTENTS
2
▪ Highlights of Q3FY16
▪ Future Strategy
▪ Operational Highlights
▪ Review of Financials
▪ Financial Architecture
▪ Capital Structure
▪ Annexures
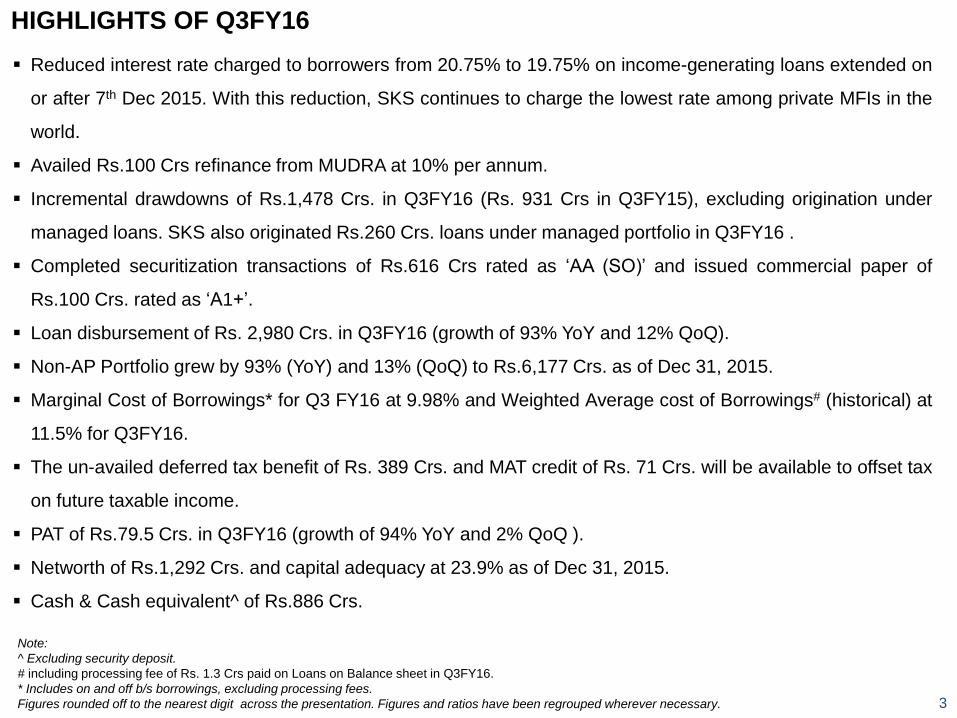
Reduced interest rate charged to borrowers from 20.75% to 19.75% on income-generating loans extended on
or after 7th Dec 2015. With this reduction, SKS continues to charge the lowest rate among private MFIs in the
world.
Availed Rs.100 Crs refinance from MUDRA at 10% per annum.
Incremental drawdowns of Rs.1,478 Crs. in Q3FY16 (Rs. 931 Crs in Q3FY15), excluding origination under
managed loans. SKS also originated Rs.260 Crs. loans under managed portfolio in Q3FY16 .
Completed securitization transactions of Rs.616 Crs rated as ‘AA (SO)’ and issued commercial paper of
Rs.100 Crs. rated as ‘A1+’.
Loan disbursement of Rs. 2,980 Crs. in Q3FY16 (growth of 93% YoY and 12% QoQ).
Non-AP Portfolio grew by 93% (YoY) and 13% (QoQ) to Rs.6,177 Crs. as of Dec 31, 2015.
Marginal Cost of Borrowings* for Q3 FY16 at 9.98% and Weighted Average cost of Borrowings# (historical) at
11.5% for Q3FY16.
The un-availed deferred tax benefit of Rs. 389 Crs. and MAT credit of Rs. 71 Crs. will be available to offset tax
on future taxable income.
PAT of Rs.79.5 Crs. in Q3FY16 (growth of 94% YoY and 2% QoQ ).
Networth of Rs.1,292 Crs. and capital adequacy at 23.9% as of Dec 31, 2015.
Cash & Cash equivalent^ of Rs.886 Crs.
HIGHLIGHTS OF Q3FY16
Note:
^ Excluding security deposit.
# including processing fee of Rs. 1.3 Crs paid on Loans on Balance sheet in Q3FY16.
* Includes on and off b/s borrowings, excluding processing fees.
Figures rounded off to the nearest digit across the presentation. Figures and ratios have been regrouped wherever necessary. 3
4
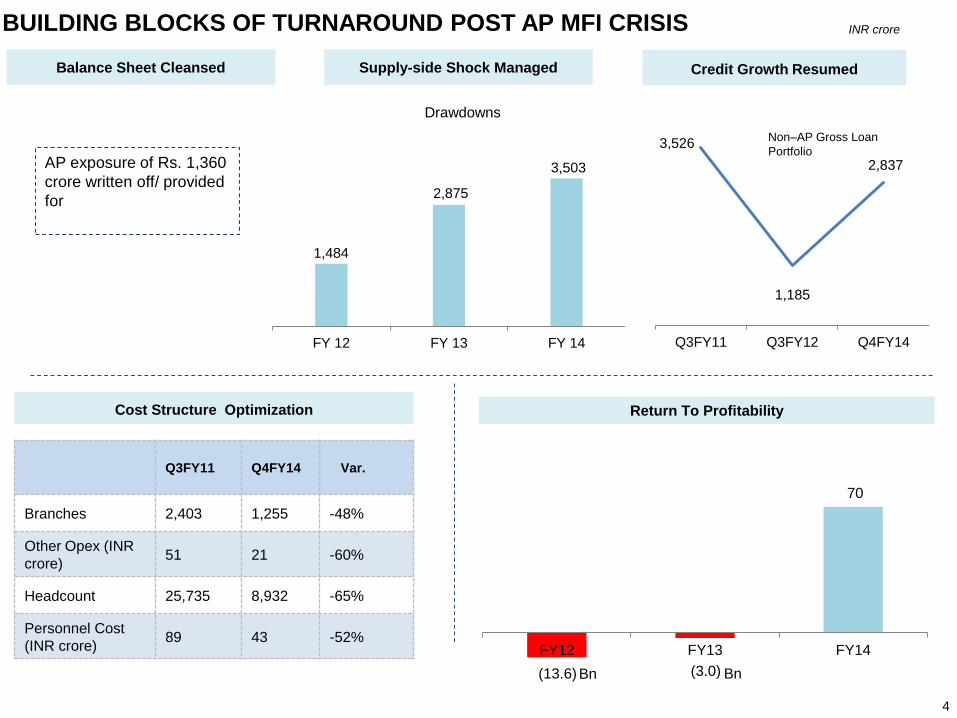
Balance Sheet Cleansed
BUILDING BLOCKS OF TURNAROUND POST AP MFI CRISIS
Supply-side Shock Managed
1,484
2,875
3,503
FY 12 FY 13 FY 14
Drawdowns
AP exposure of Rs. 1,360
crore written off/ provided
for
Q3FY11 Q4FY14 Var.
Branches 2,403 1,255 -48%
Other Opex (INR
crore)51 21 -60%
Headcount 25,735 8,932 -65%
Personnel Cost
(INR crore)89 43 -52%
Credit Growth Resumed
3,526
1,185
2,837
Q3FY11 Q3FY12 Q4FY14
Non–AP Gross Loan
Portfolio
(13.6) (3.0)
70
FY12 FY13 FY14
Return To Profitability
Bn Bn
Cost Structure Optimization
INR crore

5
12.6% 11.9% 10.0%
FY14 FY15 Q3FY16
Marginal Cost of Borrowing
13%
74.5%
61.1%46.9%
FY14 FY15 Q3FY16
Cost to Income
Installed Computers at all branches with In-House lending system
All branch connectivity with daily data receipt (1,215 remote locations)
Refactoring of In-house lending system
Eqipped Loan Officers with tablets
Mobile/ digital/ cashless transactions
Technology Upgraded
DURABLE FOUNDATION FOR SUSTAINABLE GROWTH (1/2)
Market Share Regained Capital Reinforced
2000 2014 -152012Yrs
#
14%
8%1,229
Oct’10 June’12 Sep’15
28.300 36,569
14.600
Non-AP Portfolio Outstanding
3,945
SKS
Others
INR Crs.
Net worth - Rs. 1,292 crs
CAR - 23.9% (RBI Requirement
15%)
Efficiency Gains
# On and Off balance sheet loans including processing fee
2015 -16
SKS
Disbursement
share 19%* in
Q2FY16
* Industry
disbursements
for Q2FY16 is
Rs.14,395 crs.
Sep-15 data as per MFIN; excludes data for Bandhan bank
5,462
6
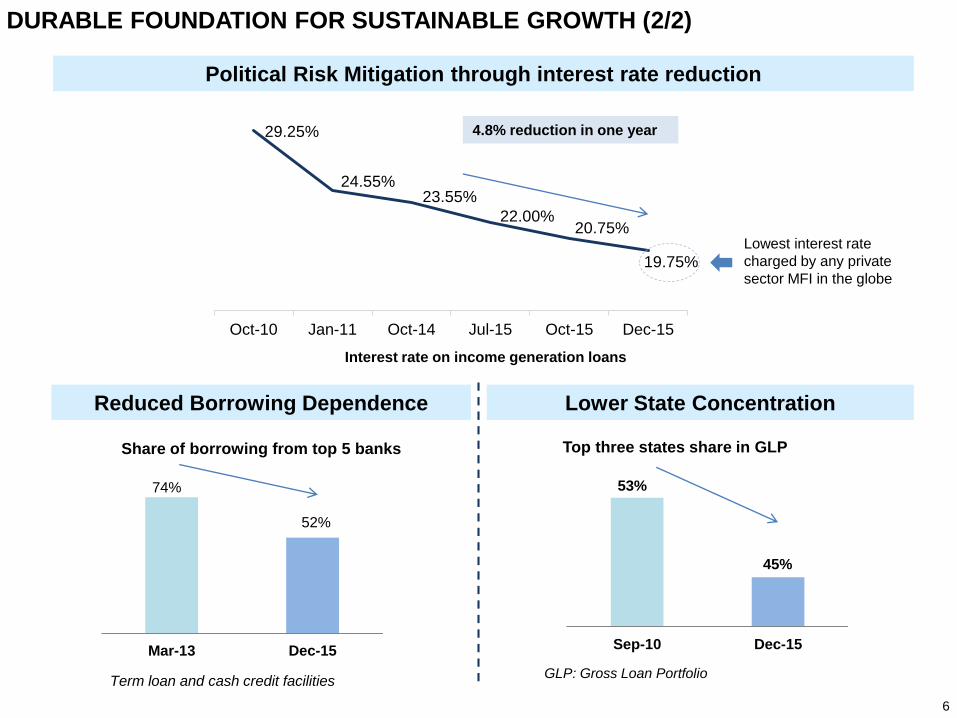
53%
45%
Sep-10 Dec-15
74%
52%
Mar-13 Dec-15
29.25%
24.55%23.55%
22.00%20.75%
19.75%
Oct-10 Jan-11 Oct-14 Jul-15 Oct-15 Dec-15
Reduced Borrowing Dependence
DURABLE FOUNDATION FOR SUSTAINABLE GROWTH (2/2)
Political Risk Mitigation through interest rate reduction
Lower State Concentration
Lowest interest rate
charged by any private
sector MFI in the globe
4.8% reduction in one year
GLP: Gross Loan PortfolioTerm loan and cash credit facilities
Interest rate on income generation loans
Share of borrowing from top 5 banks Top three states share in GLP

CLARITY ON MAJOR UNCERTAINTIES
POST AP MFI CRISIS
7
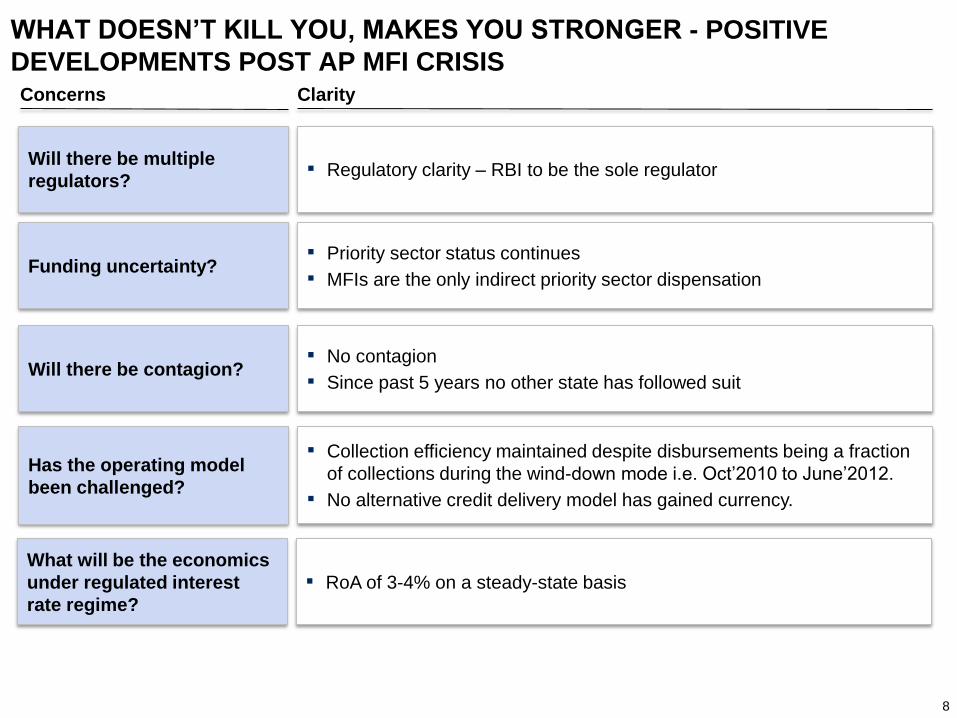
WHAT DOESN’T KILL YOU, MAKES YOU STRONGER - POSITIVE
DEVELOPMENTS POST AP MFI CRISIS
▪ Regulatory clarity – RBI to be the sole regulator
▪ Priority sector status continues
▪ MFIs are the only indirect priority sector dispensation
▪ No contagion
▪ Since past 5 years no other state has followed suit
▪ Collection efficiency maintained despite disbursements being a fraction
of collections during the wind-down mode i.e. Oct’2010 to June’2012.
▪ No alternative credit delivery model has gained currency.
Clarity
Will there be multiple
regulators?
Funding uncertainty?
Will there be contagion?
Has the operating model
been challenged?
Concerns
What will be the economics
under regulated interest
rate regime?
▪ RoA of 3-4% on a steady-state basis
8
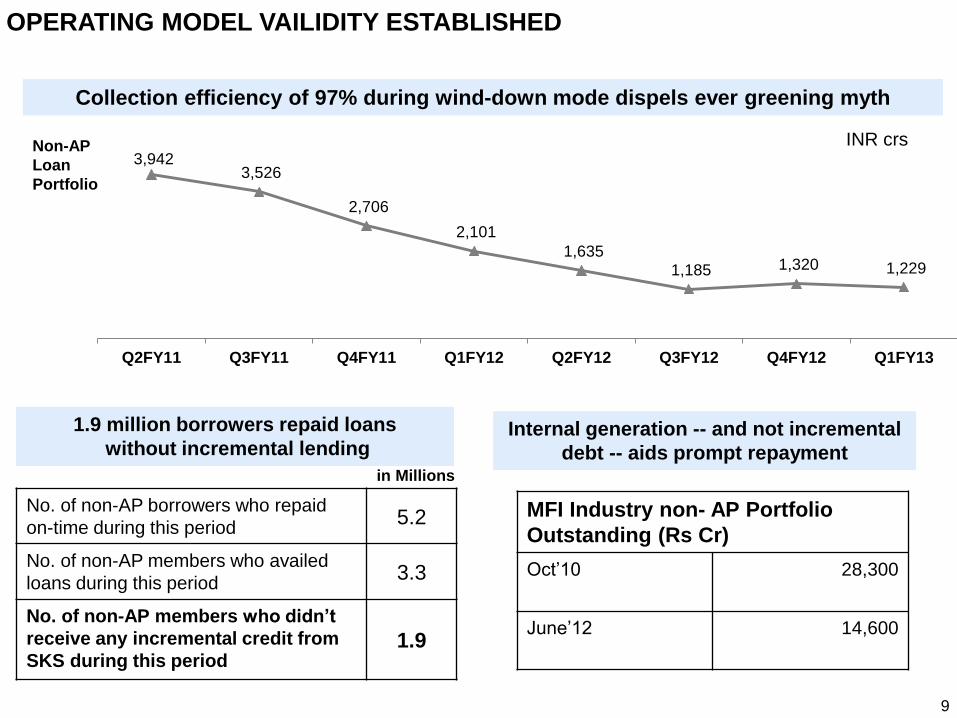
3,942 3,526
2,706
2,101
1,635
1,185 1,320 1,229
Q2FY11 Q3FY11 Q4FY11 Q1FY12 Q2FY12 Q3FY12 Q4FY12 Q1FY13
OPERATING MODEL VAILIDITY ESTABLISHED
Collection efficiency of 97% during wind-down mode dispels ever greening myth
Non-AP
Loan
Portfolio
No. of non-AP borrowers who repaid
on-time during this period5.2
No. of non-AP members who availed
loans during this period3.3
No. of non-AP members who didn’t
receive any incremental credit from
SKS during this period1.9
in Millions
1.9 million borrowers repaid loans
without incremental lending
INR crs
MFI Industry non- AP Portfolio
Outstanding (Rs Cr)
Oct’10 28,300
June’12 14,600
Internal generation -- and not incremental
debt -- aids prompt repayment
9

Sector outstanding
Non-AP Portfolio
Oct ’10 – 28,300
Mar’14 – 24,615
Mar’15- 40,138
Sep’15 -36,569#
Market Share Dynamics
2nd, 3rd, 4th and 5th
largest MFI playerswith 40% Non-APmarket share areunder CDR.
Institutional Infrastructure
Credit Bureaus-
- Equifax & Highmark arefunctional
- 95% of MFIs now use CB reports for disbursements
COMPETITIVE LANDSCAPE CHANGES TO SKS’ ADVANTAGE
INR crore
• No. of loan records - 18.6 Crore
• No. of borrower records – 7.5 Crore
• No. of loan records (live) – 4.3 Crore
• No. of borrower records (live) – 2.9 Crore
• No. of MFIs reporting – 125 (Incl. all 45
NBFC-MFIs)
• Frequency of sharing the records – Weekly
Snapshot of Equifax Credit Bureau*:
* Source: Equifax (as on Nov 2015)# Sep-15 data as per MFIN; excludes data for Bandhan bank 10
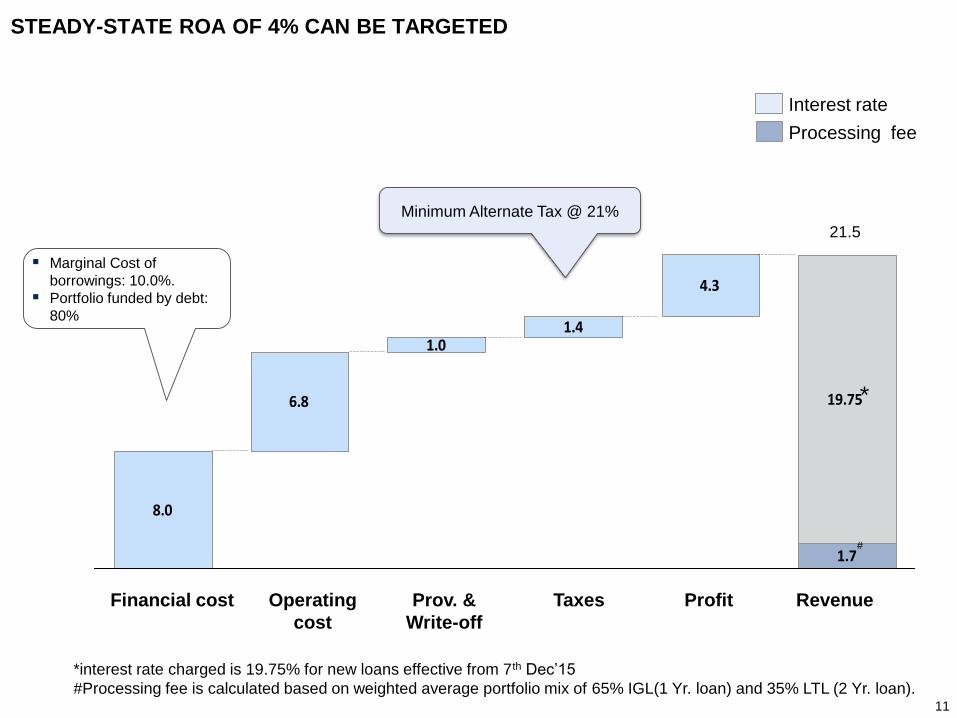
11
Processing fee
Interest rate
8.0
6.8
1.01.4
4.3
1.7
19.75
Revenue
21.5
ProfitTaxesProv. &
Write-off
Operating
cost
Financial cost
Minimum Alternate Tax @ 21%
Marginal Cost of
borrowings: 10.0%.
Portfolio funded by debt:
80%
STEADY-STATE ROA OF 4% CAN BE TARGETED
*interest rate charged is 19.75% for new loans effective from 7th Dec’15
#Processing fee is calculated based on weighted average portfolio mix of 65% IGL(1 Yr. loan) and 35% LTL (2 Yr. loan).
*
#
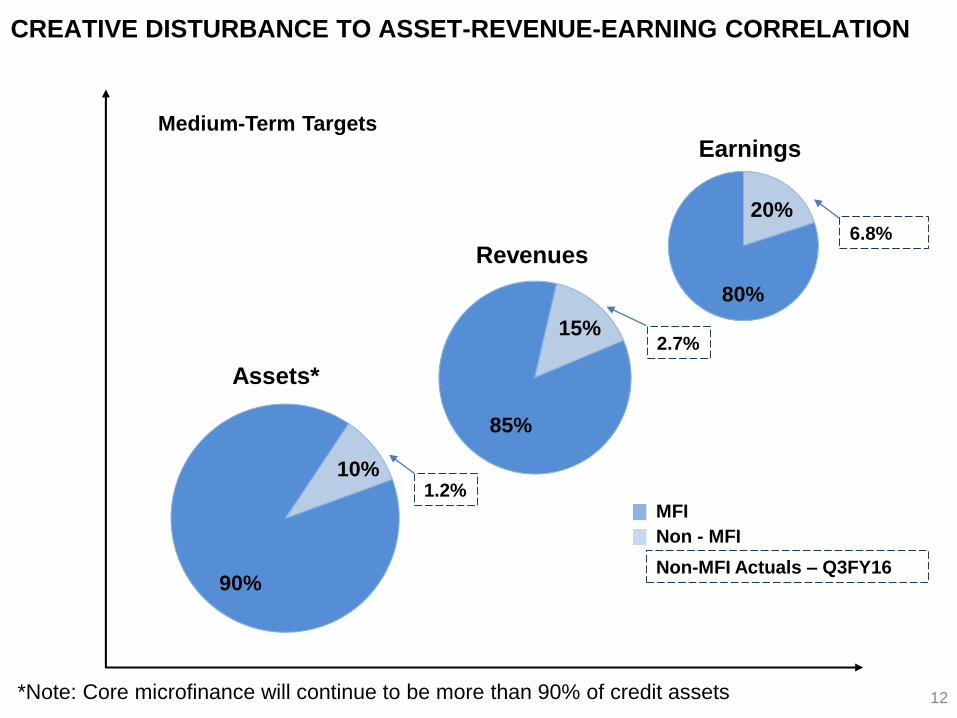
CREATIVE DISTURBANCE TO ASSET-REVENUE-EARNING CORRELATION
15%
85%
Revenues
10%
90%
Assets*
20%
80%
Earnings
*Note: Core microfinance will continue to be more than 90% of credit assets
Medium-Term Targets
MFI
Non - MFI
Non-MFI Actuals – Q3FY16
1.2%
2.7%
6.8%
12

13
FUTURE STRATEGY

14
OPPORTUNITIES CHALLENGES
A COMPARATIVE STUDY OF STRUCTURAL OPPORTUNITIES & CHALLENGES
Access to low cost funds/deposits
Bank accounts to customers
Political risk mitigation
× CASA can be competitive only in the long
term
× CRR and SLR drag
× No PSL benefit on bank borrowings
× Interbank borrowings capped at 3x Net
Worth
× Cannot act as Business Correspondent
(BC) to other banks
× Investment in technology, infrastructure
and functional capabilities for banking
× Huge domestic capital raise /dilution
SFB
Generate Agri-allied/ PSL for banks
Leverage Business Correspondent (BC)
model to offer bank accounts and saving
products to customers without CRR and
SLR drag
× Political risk beyond a size
× Cannot access deposits
NBFC-MFI
15
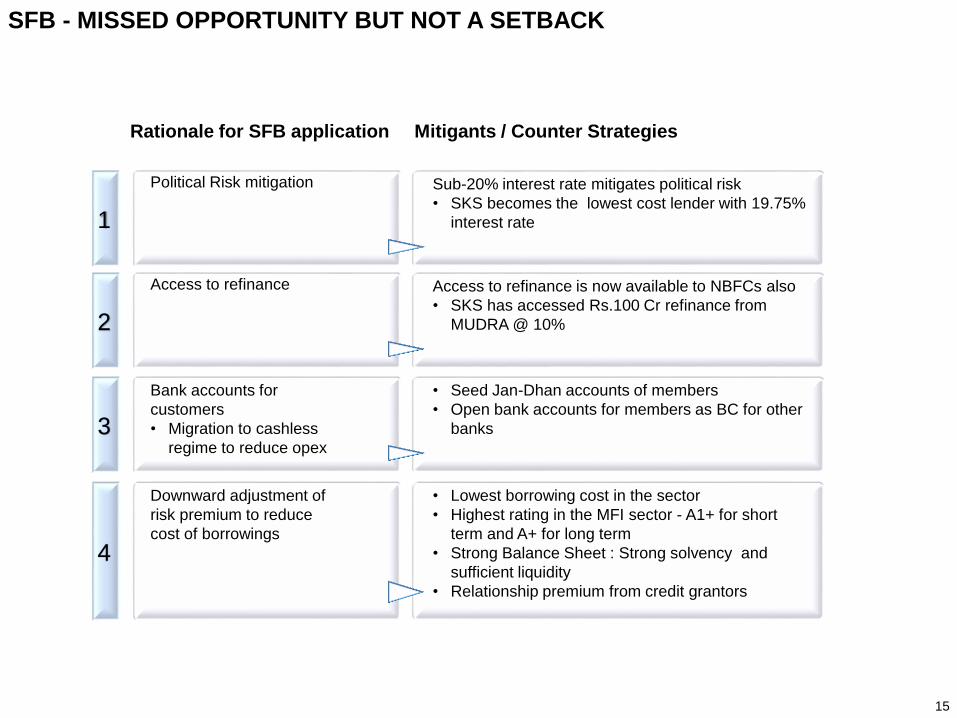
SFB - MISSED OPPORTUNITY BUT NOT A SETBACK
Political Risk mitigation Sub-20% interest rate mitigates political risk
• SKS becomes the lowest cost lender with 19.75%
interest rate1
Access to refinance Access to refinance is now available to NBFCs also
• SKS has accessed Rs.100 Cr refinance from
MUDRA @ 10%2
Bank accounts for
customers
• Migration to cashless
regime to reduce opex
• Seed Jan-Dhan accounts of members
• Open bank accounts for members as BC for other
banks3
Downward adjustment of
risk premium to reduce
cost of borrowings
• Lowest borrowing cost in the sector
• Highest rating in the MFI sector - A1+ for short
term and A+ for long term
• Strong Balance Sheet : Strong solvency and
sufficient liquidity
• Relationship premium from credit grantors
4
Rationale for SFB application Mitigants / Counter Strategies
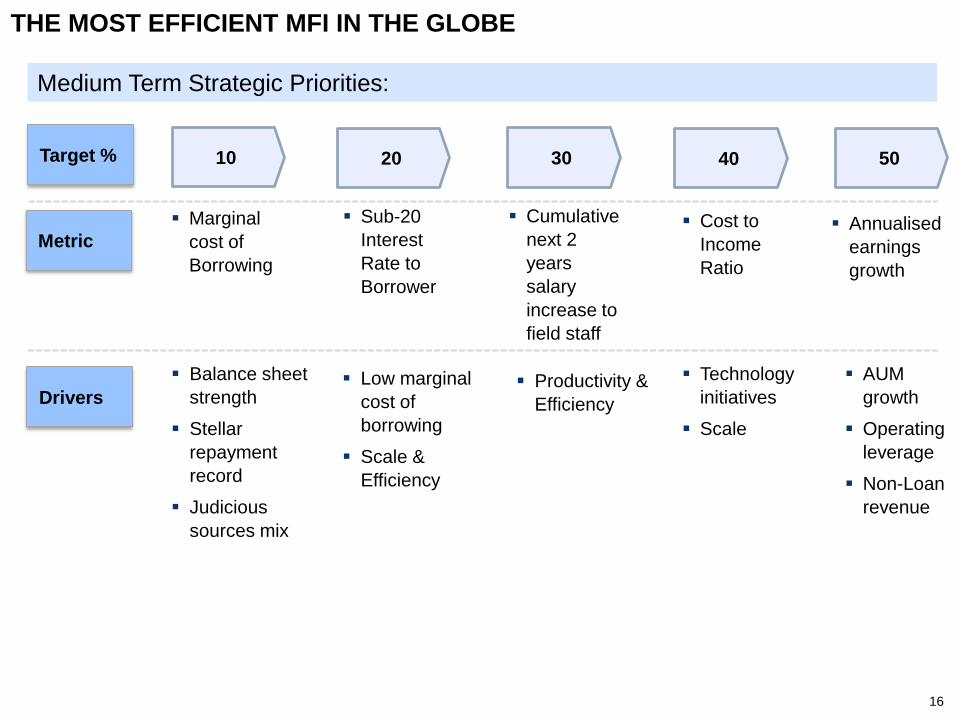
THE MOST EFFICIENT MFI IN THE GLOBE
16
10
Metric
Sub-20
Interest
Rate to
Borrower
Cost to
Income
Ratio
Balance sheet
strength
Stellar
repayment
record
Judicious
sources mix
Technology
initiatives
Scale
AUM
growth
Operating
leverage
Non-Loan
revenue
Drivers
Marginal
cost of
Borrowing
Cumulative
next 2
years
salary
increase to
field staff
Target %
Annualised
earnings
growth
Medium Term Strategic Priorities:
20 30 40 50
Low marginal
cost of
borrowing
Scale &
Efficiency
Productivity &
Efficiency
OPERATIONAL HIGHLIGHTS
17
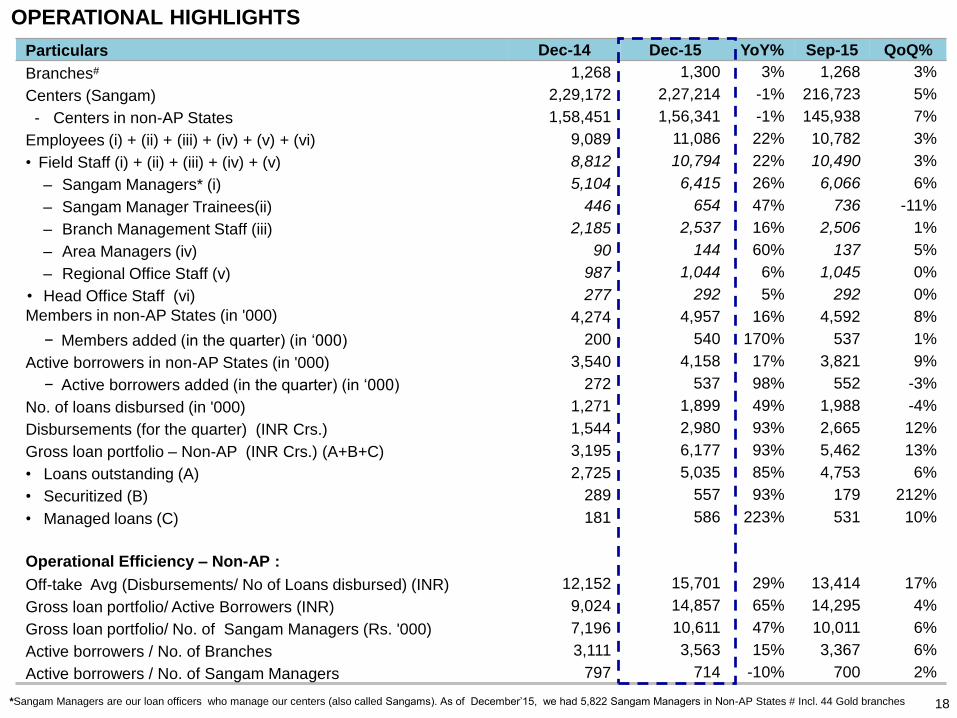
*Sangam Managers are our loan officers who manage our centers (also called Sangams). As of December’15, we had 5,822 Sangam Managers in Non-AP States # Incl. 44 Gold branches 18
OPERATIONAL HIGHLIGHTS
Particulars Dec-14 Dec-15 YoY% Sep-15 QoQ%
Branches# 1,268 1,300 3% 1,268 3%
Centers (Sangam) 2,29,172 2,27,214 -1% 216,723 5%
- Centers in non-AP States 1,58,451 1,56,341 -1% 145,938 7%
Employees (i) + (ii) + (iii) + (iv) + (v) + (vi) 9,089 11,086 22% 10,782 3%
• Field Staff (i) + (ii) + (iii) + (iv) + (v) 8,812 10,794 22% 10,490 3%
– Sangam Managers* (i) 5,104 6,415 26% 6,066 6%
– Sangam Manager Trainees(ii) 446 654 47% 736 -11%
– Branch Management Staff (iii) 2,185 2,537 16% 2,506 1%
– Area Managers (iv) 90 144 60% 137 5%
– Regional Office Staff (v) 987 1,044 6% 1,045 0%
• Head Office Staff (vi) 277 292 5% 292 0%
Members in non-AP States (in '000) 4,274 4,957 16% 4,592 8%
− Members added (in the quarter) (in ‘000) 200 540 170% 537 1%
Active borrowers in non-AP States (in '000) 3,540 4,158 17% 3,821 9%
− Active borrowers added (in the quarter) (in ‘000) 272 537 98% 552 -3%
No. of loans disbursed (in '000) 1,271 1,899 49% 1,988 -4%
Disbursements (for the quarter) (INR Crs.) 1,544 2,980 93% 2,665 12%
Gross loan portfolio – Non-AP (INR Crs.) (A+B+C) 3,195 6,177 93% 5,462 13%
• Loans outstanding (A) 2,725 5,035 85% 4,753 6%
• Securitized (B) 289 557 93% 179 212%
• Managed loans (C) 181 586 223% 531 10%
Operational Efficiency – Non-AP :
Off-take Avg (Disbursements/ No of Loans disbursed) (INR) 12,152 15,701 29% 13,414 17%
Gross loan portfolio/ Active Borrowers (INR) 9,024 14,857 65% 14,295 4%
Gross loan portfolio/ No. of Sangam Managers (Rs. '000) 7,196 10,611 47% 10,011 6%
Active borrowers / No. of Branches 3,111 3,563 15% 3,367 6%
Active borrowers / No. of Sangam Managers 797 714 -10% 700 2%
PRODUCTIVITY GAINS & COST EFFICIENCY ENABLE SKS TO LEVERAGE THE CONDUCIVE
ENVIRONMENT
19
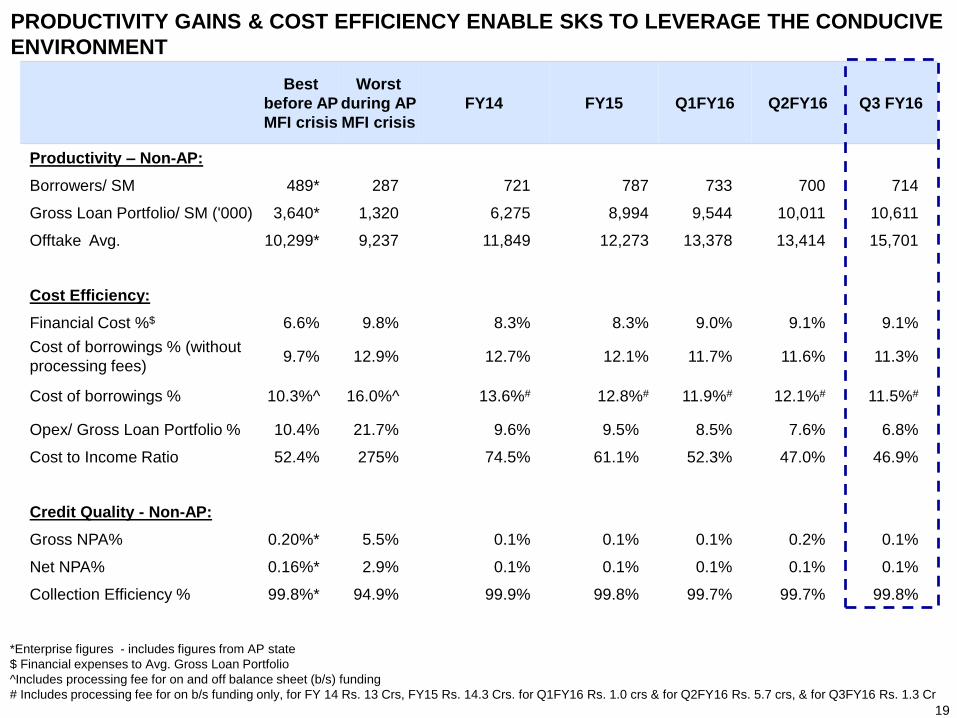
Best
before AP
MFI crisis
Worst
during AP
MFI crisis
FY14 FY15 Q1FY16 Q2FY16 Q3 FY16
Productivity – Non-AP:
Borrowers/ SM 489* 287 721 787 733 700 714
Gross Loan Portfolio/ SM ('000) 3,640* 1,320 6,275 8,994 9,544 10,011 10,611
Offtake Avg. 10,299* 9,237 11,849 12,273 13,378 13,414 15,701
Cost Efficiency:
Financial Cost %$ 6.6% 9.8% 8.3% 8.3% 9.0% 9.1% 9.1%
Cost of borrowings % (without
processing fees)9.7% 12.9% 12.7% 12.1% 11.7% 11.6% 11.3%
Cost of borrowings % 10.3%^ 16.0%^ 13.6%# 12.8%# 11.9%# 12.1%# 11.5%#
Opex/ Gross Loan Portfolio % 10.4% 21.7% 9.6% 9.5% 8.5% 7.6% 6.8%
Cost to Income Ratio 52.4% 275% 74.5% 61.1% 52.3% 47.0% 46.9%
Credit Quality - Non-AP:
Gross NPA% 0.20%* 5.5% 0.1% 0.1% 0.1% 0.2% 0.1%
Net NPA% 0.16%* 2.9% 0.1% 0.1% 0.1% 0.1% 0.1%
Collection Efficiency % 99.8%* 94.9% 99.9% 99.8% 99.7% 99.7% 99.8%
*Enterprise figures - includes figures from AP state
$ Financial expenses to Avg. Gross Loan Portfolio
^Includes processing fee for on and off balance sheet (b/s) funding
# Includes processing fee for on b/s funding only, for FY 14 Rs. 13 Crs, FY15 Rs. 14.3 Crs. for Q1FY16 Rs. 1.0 crs & for Q2FY16 Rs. 5.7 crs, & for Q3FY16 Rs. 1.3 Cr
20
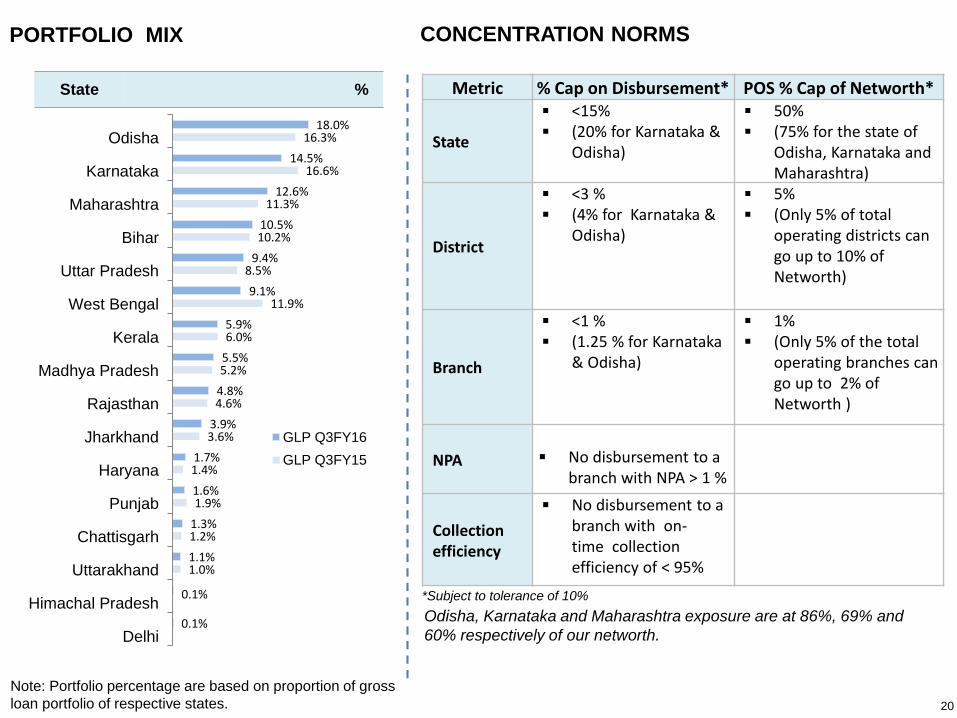
PORTFOLIO MIX
Metric % Cap on Disbursement* POS % Cap of Networth*
State
<15% (20% for Karnataka &
Odisha)
50% (75% for the state of
Odisha, Karnataka and Maharashtra)
District
<3 % (4% for Karnataka &
Odisha)
5% (Only 5% of total
operating districts can go up to 10% of Networth)
Branch
<1 % (1.25 % for Karnataka
& Odisha)
1% (Only 5% of the total
operating branches can go up to 2% of Networth )
NPA No disbursement to a branch with NPA > 1 %
Collection efficiency
No disbursement to a branch with on-time collection efficiency of < 95%
CONCENTRATION NORMS
*Subject to tolerance of 10%
Note: Portfolio percentage are based on proportion of gross
loan portfolio of respective states.
1.0%
1.2%
1.9%
1.4%
3.6%
4.6%
5.2%
6.0%
11.9%
8.5%
10.2%
11.3%
16.6%
16.3%
0.1%
0.1%
1.1%
1.3%
1.6%
1.7%
3.9%
4.8%
5.5%
5.9%
9.1%
9.4%
10.5%
12.6%
14.5%
18.0%
Delhi
Himachal Pradesh
Uttarakhand
Chattisgarh
Punjab
Haryana
Jharkhand
Rajasthan
Madhya Pradesh
Kerala
West Bengal
Uttar Pradesh
Bihar
Maharashtra
Karnataka
Odisha
GLP Q3FY16
GLP Q3FY15
State %
Odisha, Karnataka and Maharashtra exposure are at 86%, 69% and
60% respectively of our networth.

21* Excludes 44 Gold Loan Branches.
VINTAGE OF NON-AP BRANCHES IS 7.0 YEARS PORTFOLIO OUTSTANDING BY ECONOMIC ACTIVITY
Purpose % Mix
Livestock 30%
Tailoring, Cloth weaving 11%
Grocery stores and other retail outlets 10%
Masonry, Painting, Plumbing, Electrician,
Carpenter and related7%
Trading of Vegetable & fruits 7%
Agriculture 7%
Vehicle repairs 5%
Eateries 5%
Trading of Agri-commodities 4%
Garments & Footwear retailing 2%
Trading of Utensils, Plastic items 1%
Scrap business 1%
Bangles shop 1%
Other income generating activities 9%
As of Dec 2015
StateNo. of
Branches
Wt. Avg. Vintage
(in Yrs.)*
Karnataka 169 8.0
Odisha 149 7.5
Uttar Pradesh 130 6.0
Bihar 128 7.0
West Bengal 126 7.2
Maharashtra 119 7.3
Madhya Pradesh 69 7.4
Rajasthan 59 7.1
Kerala 48 5.8
Jharkhand 47 6.2
Chhattisgarh 23 6.8
Haryana 21 4.8
Punjab 18 6.4
Uttarakhand 12 5.2
Himachal Pradesh 3 1.1
Delhi 1 6.4
Non-AP 1,122 7.0
REVIEW OF FINANCIALS
22
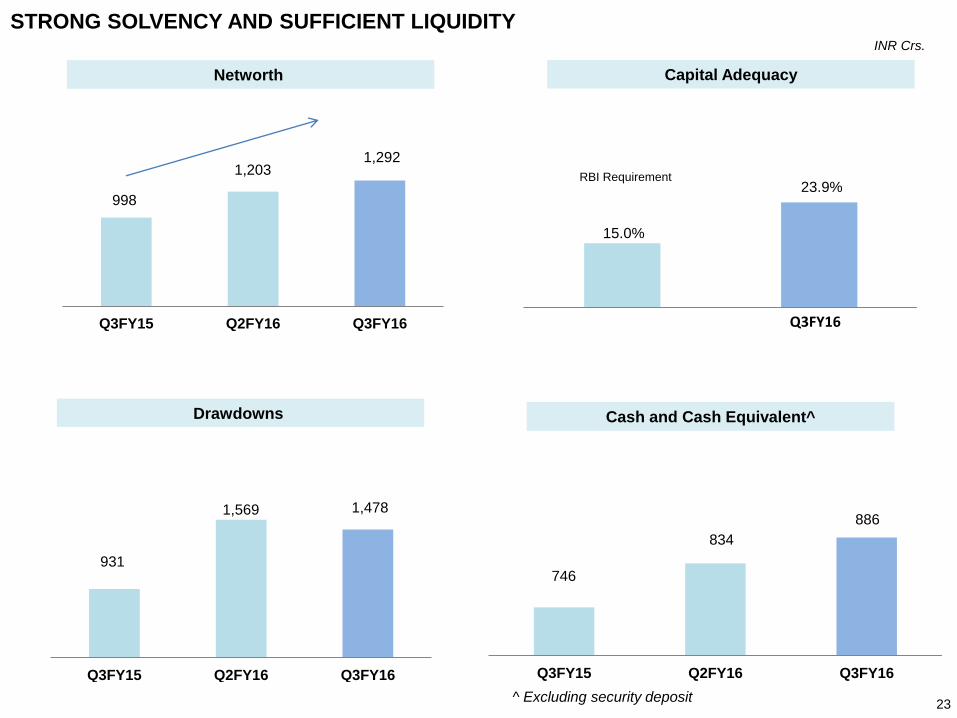
INR Crs.
Capital AdequacyNetworth
23
STRONG SOLVENCY AND SUFFICIENT LIQUIDITY
998
1,203 1,292
Q3FY15 Q2FY16 Q3FY16
Cash and Cash Equivalent^
746
834
886
Q3FY15 Q2FY16 Q3FY16
15.0%
23.9%RBI Requirement
Q3FY16
Drawdowns
^ Excluding security deposit
931
1,569 1,478
Q3FY15 Q2FY16 Q3FY16
INR Crs.
24
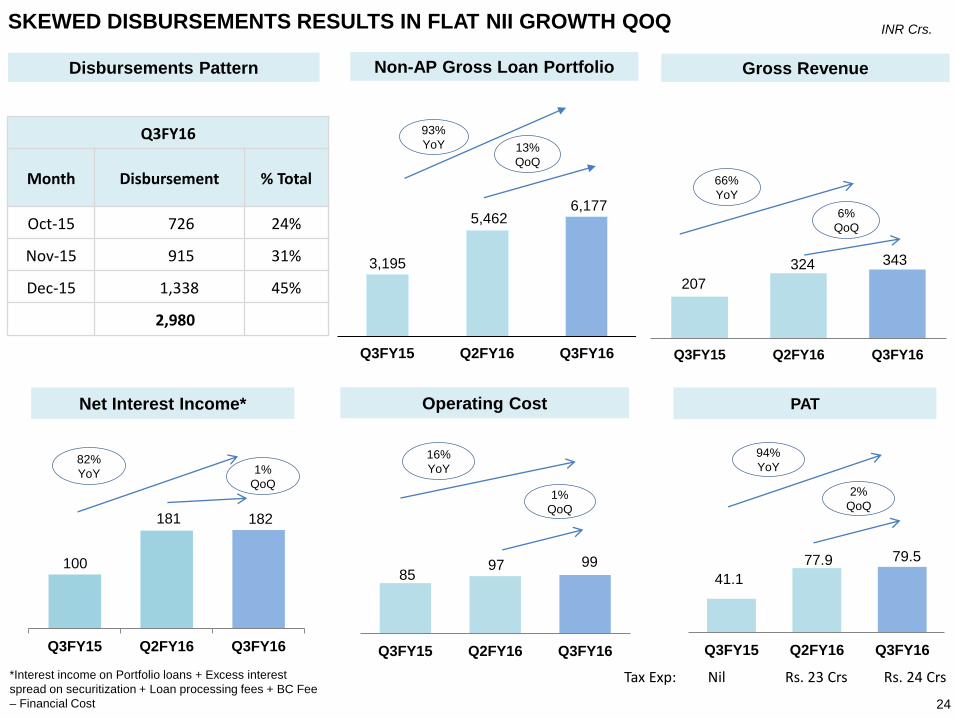
PAT
41.1
77.9 79.5
Q3FY15 Q2FY16 Q3FY16
85 97 99
Q3FY15 Q2FY16 Q3FY16
1%
QoQ
Operating Cost
100
181 182
Q3FY15 Q2FY16 Q3FY16
1%
QoQ
Net Interest Income*
*Interest income on Portfolio loans + Excess interest
spread on securitization + Loan processing fees + BC Fee
– Financial Cost
2%
QoQ
Disbursements Pattern
3,195
5,462 6,177
Q3FY15 Q2FY16 Q3FY16
93%
YoY 13%
QoQ
Non-AP Gross Loan Portfolio
94%
YoY
207
324 343
Q3FY15 Q2FY16 Q3FY16
66%
YoY
6%
QoQ
Gross Revenue
16%
YoY
Tax Exp: Nil Rs. 23 Crs Rs. 24 Crs
SKEWED DISBURSEMENTS RESULTS IN FLAT NII GROWTH QOQ
82%
YoY
Q3FY16
Month Disbursement % Total
Oct-15 726 24%
Nov-15 915 31%
Dec-15 1,338 45%
2,980

Particulars Q3FY15 Q3FY16 YoY%
Q3FY16
As % of Total
Revenue
Q2FY16 QoQ%
Income from Operations
Interest income on Portfolio loans 154 263 71% 77% 256 3%
Excess interest spread on securitization 10 17 75% 5% 11 57%
Loan processing fees 11 19 63% 5% 16 16%
Other Income
Income on investments 14 14 - 4% 9 63%
Recovery against loans written off 5 4 -28% 1% 4 -13%
Facilitation fees from Cross-sell 8 9 12% 3% 13 -27%
BC fees 4 16 - 5% 16 2%
Other miscellaneous income 0.2 1.1 - 0.3% 0.2 -
Total Revenue 207 343 66% 100% 324 6%
Financial expenses 79 133 69% 39% 117 14%
Personnel expenses 63 72 13% 21% 70 2%
Operating and other expenses 21 25 18% 7% 26 -4%
Depreciation and amortization 1 3 137% 1% 2 47%
Total Operating Cost 85 99 16% 29% 97 1%
Provision & Write-offs 2 9 - 3% 9 -
Total Expenditure 166 240 45% 70% 223 8%
Profit before Tax 41 103 151% 30% 101 2%
Tax expense - 24 - 7% 23 1%
Profit after Tax 41.1 79.5 94% 23% 77.9 2%
INR Crs.
25
PAT GROWTH OF 94% YoY
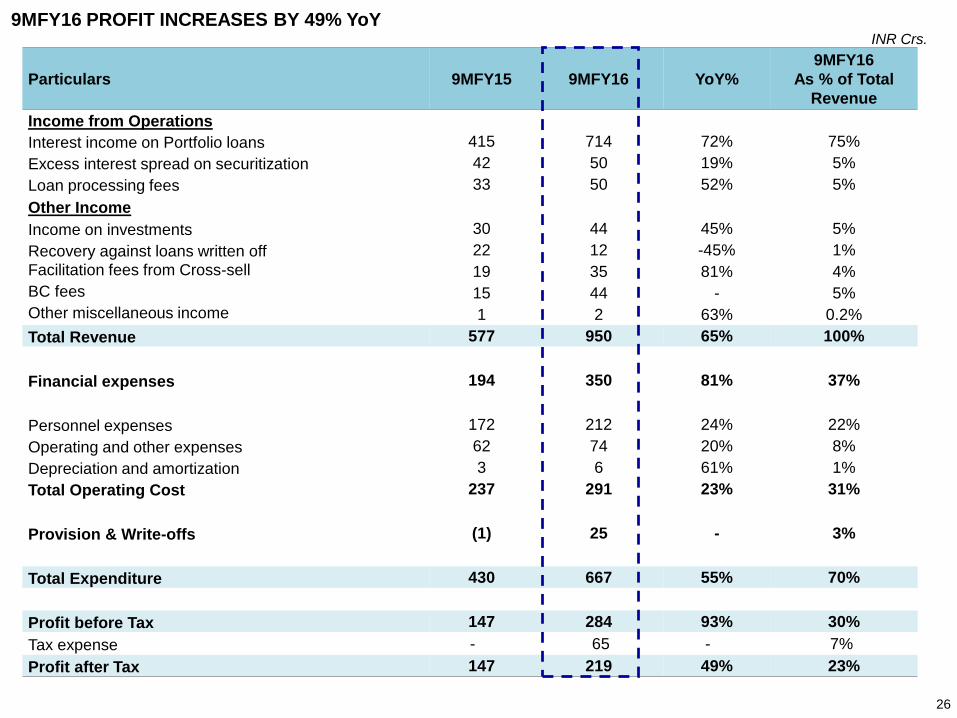
Particulars 9MFY15 9MFY16 YoY%
9MFY16
As % of Total
Revenue
Income from Operations
Interest income on Portfolio loans 415 714 72% 75%
Excess interest spread on securitization 42 50 19% 5%
Loan processing fees 33 50 52% 5%
Other Income
Income on investments 30 44 45% 5%
Recovery against loans written off 22 12 -45% 1%
Facilitation fees from Cross-sell 19 35 81% 4%
BC fees 15 44 - 5%
Other miscellaneous income 1 2 63% 0.2%
Total Revenue 577 950 65% 100%
Financial expenses 194 350 81% 37%
Personnel expenses 172 212 24% 22%
Operating and other expenses 62 74 20% 8%
Depreciation and amortization 3 6 61% 1%
Total Operating Cost 237 291 23% 31%
Provision & Write-offs (1) 25 - 3%
Total Expenditure 430 667 55% 70%
Profit before Tax 147 284 93% 30%
Tax expense - 65 - 7%
Profit after Tax 147 219 49% 23%
INR Crs.
26
9MFY16 PROFIT INCREASES BY 49% YoY
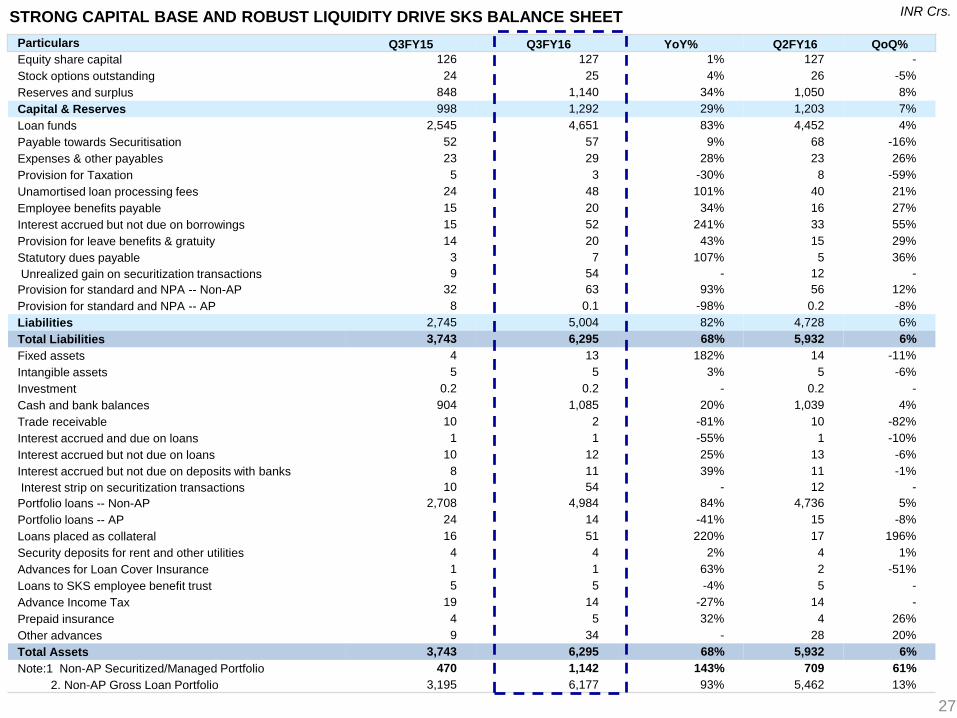
STRONG CAPITAL BASE AND ROBUST LIQUIDITY DRIVE SKS BALANCE SHEET INR Crs.
Particulars Q3FY15 Q3FY16 YoY% Q2FY16 QoQ%
Equity share capital 126 127 1% 127 -
Stock options outstanding 24 25 4% 26 -5%
Reserves and surplus 848 1,140 34% 1,050 8%
Capital & Reserves 998 1,292 29% 1,203 7%
Loan funds 2,545 4,651 83% 4,452 4%
Payable towards Securitisation 52 57 9% 68 -16%
Expenses & other payables 23 29 28% 23 26%
Provision for Taxation 5 3 -30% 8 -59%
Unamortised loan processing fees 24 48 101% 40 21%
Employee benefits payable 15 20 34% 16 27%
Interest accrued but not due on borrowings 15 52 241% 33 55%
Provision for leave benefits & gratuity 14 20 43% 15 29%
Statutory dues payable 3 7 107% 5 36%
Unrealized gain on securitization transactions 9 54 - 12 -
Provision for standard and NPA -- Non-AP 32 63 93% 56 12%
Provision for standard and NPA -- AP 8 0.1 -98% 0.2 -8%
Liabilities 2,745 5,004 82% 4,728 6%
Total Liabilities 3,743 6,295 68% 5,932 6%
Fixed assets 4 13 182% 14 -11%
Intangible assets 5 5 3% 5 -6%
Investment 0.2 0.2 - 0.2 -
Cash and bank balances 904 1,085 20% 1,039 4%
Trade receivable 10 2 -81% 10 -82%
Interest accrued and due on loans 1 1 -55% 1 -10%
Interest accrued but not due on loans 10 12 25% 13 -6%
Interest accrued but not due on deposits with banks 8 11 39% 11 -1%
Interest strip on securitization transactions 10 54 - 12 -
Portfolio loans -- Non-AP 2,708 4,984 84% 4,736 5%
Portfolio loans -- AP 24 14 -41% 15 -8%
Loans placed as collateral 16 51 220% 17 196%
Security deposits for rent and other utilities 4 4 2% 4 1%
Advances for Loan Cover Insurance 1 1 63% 2 -51%
Loans to SKS employee benefit trust 5 5 -4% 5 -
Advance Income Tax 19 14 -27% 14 -
Prepaid insurance 4 5 32% 4 26%
Other advances 9 34 - 28 20%
Total Assets 3,743 6,295 68% 5,932 6%
Note:1 Non-AP Securitized/Managed Portfolio 470 1,142 143% 709 61%
2. Non-AP Gross Loan Portfolio 3,195 6,177 93% 5,462 13%
27
28
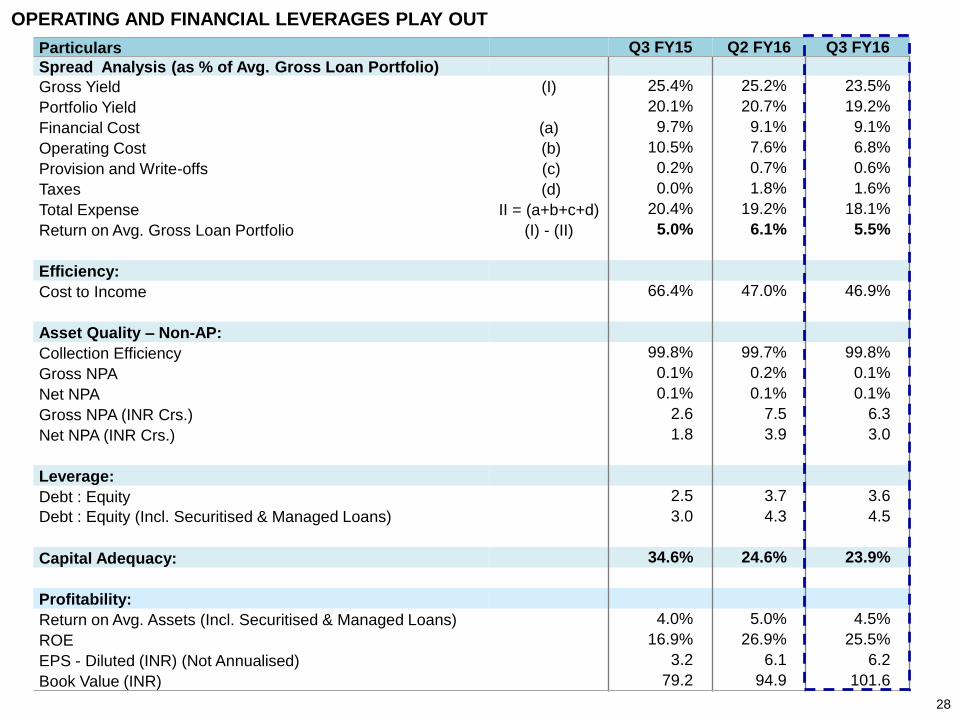
OPERATING AND FINANCIAL LEVERAGES PLAY OUT
Particulars Q3 FY15 Q2 FY16 Q3 FY16
Spread Analysis (as % of Avg. Gross Loan Portfolio)
Gross Yield (I) 25.4% 25.2% 23.5%
Portfolio Yield 20.1% 20.7% 19.2%
Financial Cost (a) 9.7% 9.1% 9.1%
Operating Cost (b) 10.5% 7.6% 6.8%
Provision and Write-offs (c) 0.2% 0.7% 0.6%
Taxes (d) 0.0% 1.8% 1.6%
Total Expense II = (a+b+c+d) 20.4% 19.2% 18.1%
Return on Avg. Gross Loan Portfolio (I) - (II) 5.0% 6.1% 5.5%
Efficiency:
Cost to Income 66.4% 47.0% 46.9%
Asset Quality – Non-AP:
Collection Efficiency 99.8% 99.7% 99.8%
Gross NPA 0.1% 0.2% 0.1%
Net NPA 0.1% 0.1% 0.1%
Gross NPA (INR Crs.) 2.6 7.5 6.3
Net NPA (INR Crs.) 1.8 3.9 3.0
Leverage:
Debt : Equity 2.5 3.7 3.6
Debt : Equity (Incl. Securitised & Managed Loans) 3.0 4.3 4.5
Capital Adequacy: 34.6% 24.6% 23.9%
Profitability:
Return on Avg. Assets (Incl. Securitised & Managed Loans) 4.0% 5.0% 4.5%
ROE 16.9% 26.9% 25.5%
EPS - Diluted (INR) (Not Annualised) 3.2 6.1 6.2
Book Value (INR) 79.2 94.9 101.6
29
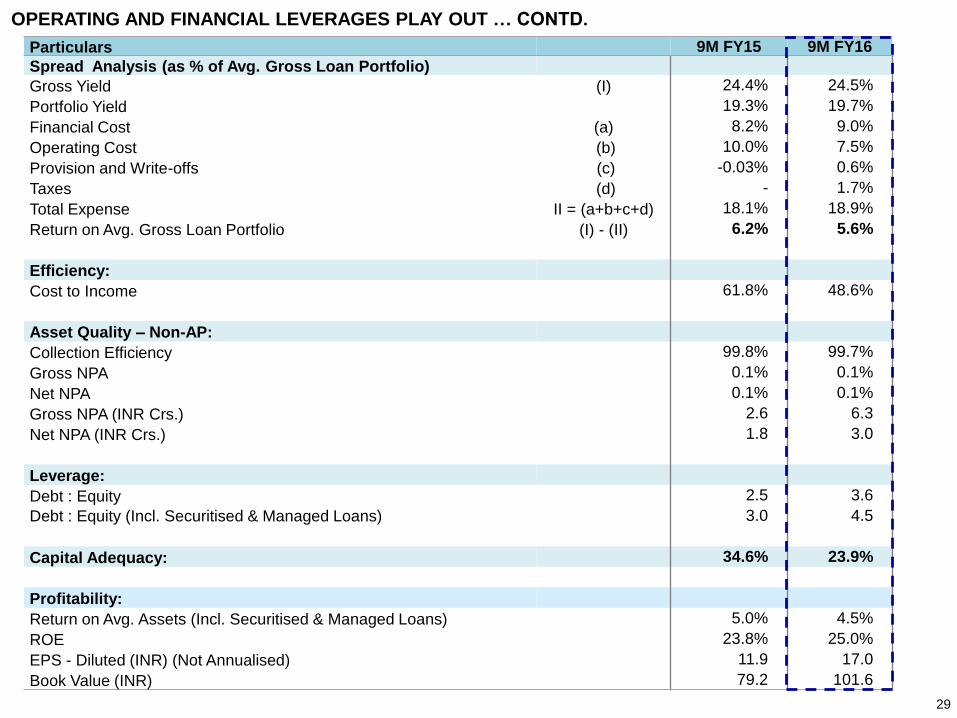
OPERATING AND FINANCIAL LEVERAGES PLAY OUT … CONTD.
Particulars 9M FY15 9M FY16
Spread Analysis (as % of Avg. Gross Loan Portfolio)
Gross Yield (I) 24.4% 24.5%
Portfolio Yield 19.3% 19.7%
Financial Cost (a) 8.2% 9.0%
Operating Cost (b) 10.0% 7.5%
Provision and Write-offs (c) -0.03% 0.6%
Taxes (d) - 1.7%
Total Expense II = (a+b+c+d) 18.1% 18.9%
Return on Avg. Gross Loan Portfolio (I) - (II) 6.2% 5.6%
Efficiency:
Cost to Income 61.8% 48.6%
Asset Quality – Non-AP:
Collection Efficiency 99.8% 99.7%
Gross NPA 0.1% 0.1%
Net NPA 0.1% 0.1%
Gross NPA (INR Crs.) 2.6 6.3
Net NPA (INR Crs.) 1.8 3.0
Leverage:
Debt : Equity 2.5 3.6
Debt : Equity (Incl. Securitised & Managed Loans) 3.0 4.5
Capital Adequacy: 34.6% 23.9%
Profitability:
Return on Avg. Assets (Incl. Securitised & Managed Loans) 5.0% 4.5%
ROE 23.8% 25.0%
EPS - Diluted (INR) (Not Annualised) 11.9 17.0
Book Value (INR) 79.2 101.6

FINANCIAL ARCHITECTURE
30
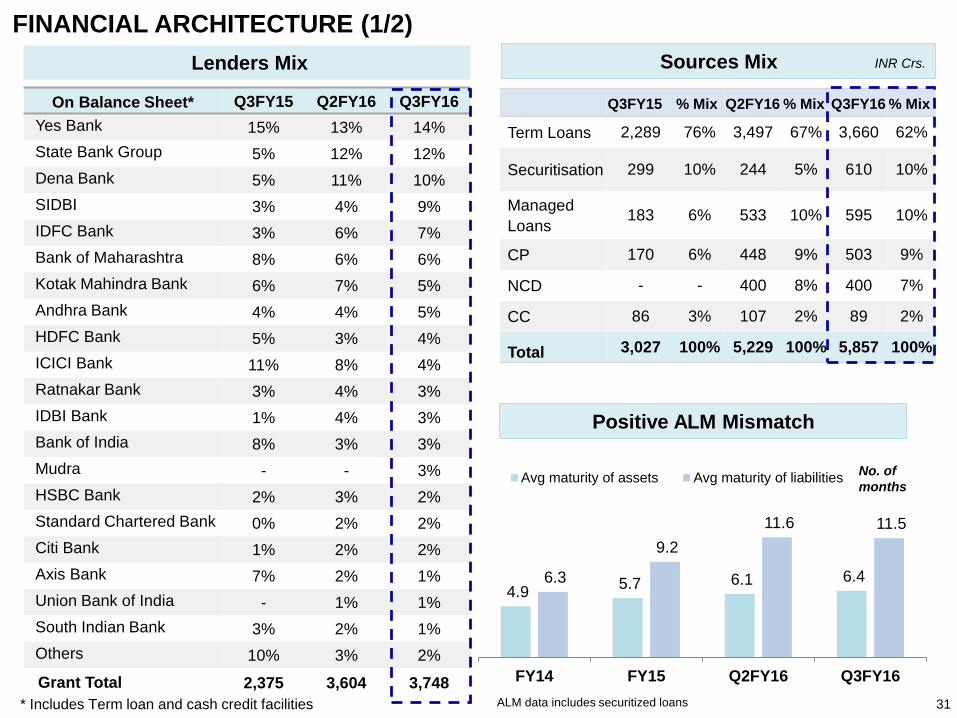
FINANCIAL ARCHITECTURE (1/2)
31
Lenders Mix
Positive ALM Mismatch
ALM data includes securitized loans* Includes Term loan and cash credit facilities
Sources Mix
Q3FY15 % Mix Q2FY16 % Mix Q3FY16 % Mix
Term Loans 2,289 76% 3,497 67% 3,660 62%
Securitisation 299 10% 244 5% 610 10%
Managed
Loans183 6% 533 10% 595 10%
CP 170 6% 448 9% 503 9%
NCD - - 400 8% 400 7%
CC 86 3% 107 2% 89 2%
Total 3,027 100% 5,229 100% 5,857 100%
INR Crs.
On Balance Sheet* Q3FY15 Q2FY16 Q3FY16
Yes Bank 15% 13% 14%
State Bank Group 5% 12% 12%
Dena Bank 5% 11% 10%
SIDBI 3% 4% 9%
IDFC Bank 3% 6% 7%
Bank of Maharashtra 8% 6% 6%
Kotak Mahindra Bank 6% 7% 5%
Andhra Bank 4% 4% 5%
HDFC Bank 5% 3% 4%
ICICI Bank 11% 8% 4%
Ratnakar Bank 3% 4% 3%
IDBI Bank 1% 4% 3%
Bank of India 8% 3% 3%
Mudra - - 3%
HSBC Bank 2% 3% 2%
Standard Chartered Bank 0% 2% 2%
Citi Bank 1% 2% 2%
Axis Bank 7% 2% 1%
Union Bank of India - 1% 1%
South Indian Bank 3% 2% 1%
Others 10% 3% 2%
Grant Total 2,375 3,604 3,748
4.9 5.7 6.1 6.4 6.3
9.2
11.6 11.5
FY14 FY15 Q2FY16 Q3FY16
Avg maturity of assets Avg maturity of liabilitiesNo. of
months
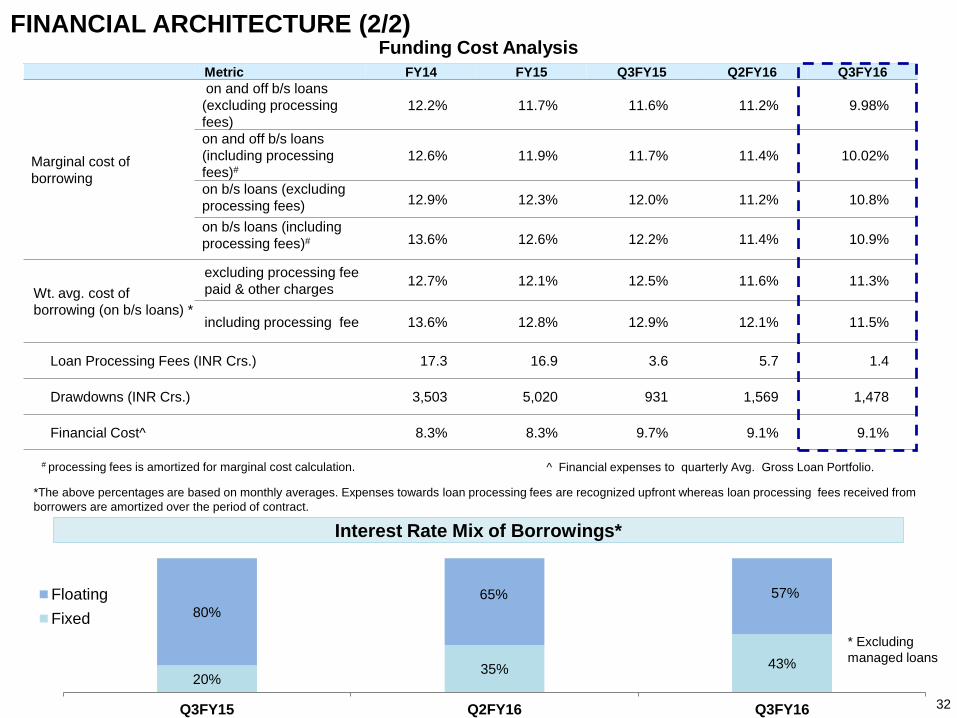
Metric FY14 FY15 Q3FY15 Q2FY16 Q3FY16
Marginal cost of
borrowing
on and off b/s loans
(excluding processing
fees)
12.2% 11.7% 11.6% 11.2% 9.98%
on and off b/s loans
(including processing
fees)#
12.6% 11.9% 11.7% 11.4% 10.02%
on b/s loans (excluding
processing fees) 12.9% 12.3% 12.0% 11.2% 10.8%
on b/s loans (including
processing fees)# 13.6% 12.6% 12.2% 11.4% 10.9%
Wt. avg. cost of
borrowing (on b/s loans) *
excluding processing fee
paid & other charges12.7% 12.1% 12.5% 11.6% 11.3%
including processing fee 13.6% 12.8% 12.9% 12.1% 11.5%
Loan Processing Fees (INR Crs.) 17.3 16.9 3.6 5.7 1.4
Drawdowns (INR Crs.) 3,503 5,020 931 1,569 1,478
Financial Cost^ 8.3% 8.3% 9.7% 9.1% 9.1%
Funding Cost Analysis
^ Financial expenses to quarterly Avg. Gross Loan Portfolio.
FINANCIAL ARCHITECTURE (2/2)
32
20%35% 43%
80%
65% 57%
Q3FY15 Q2FY16 Q3FY16
Floating
Fixed
Interest Rate Mix of Borrowings*
*The above percentages are based on monthly averages. Expenses towards loan processing fees are recognized upfront whereas loan processing fees received from
borrowers are amortized over the period of contract.
* Excluding
managed loans
# processing fees is amortized for marginal cost calculation.
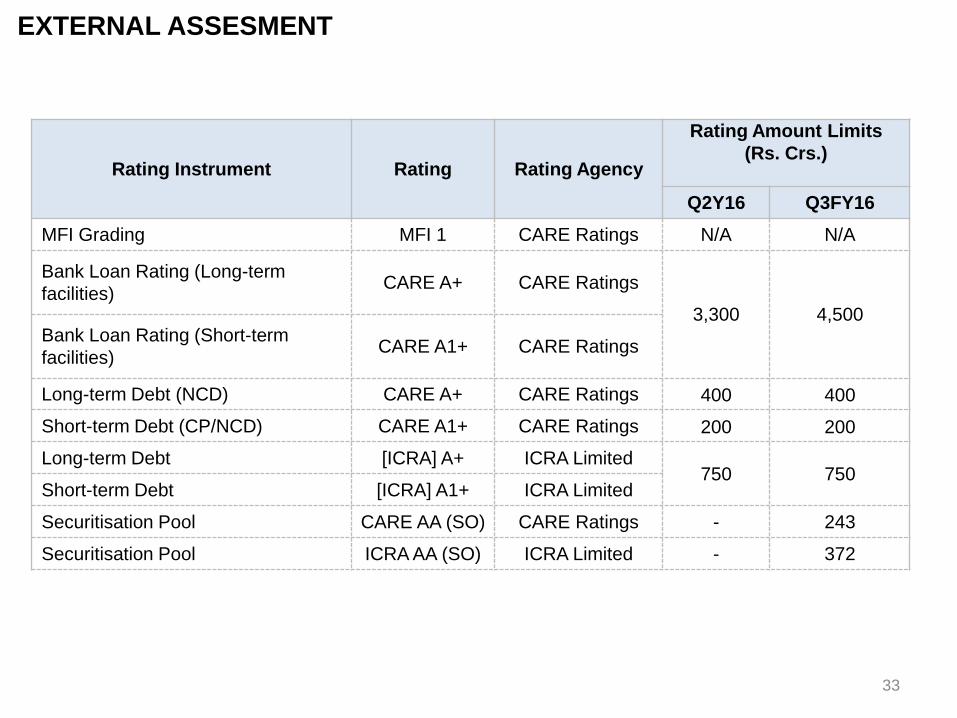
EXTERNAL ASSESMENT
Rating Instrument Rating Rating Agency
Rating Amount Limits
(Rs. Crs.)
Q2Y16 Q3FY16
MFI Grading MFI 1 CARE Ratings N/A N/A
Bank Loan Rating (Long-term
facilities)CARE A+ CARE Ratings
3,300 4,500Bank Loan Rating (Short-term
facilities)CARE A1+ CARE Ratings
Long-term Debt (NCD) CARE A+ CARE Ratings 400 400
Short-term Debt (CP/NCD) CARE A1+ CARE Ratings 200 200
Long-term Debt [ICRA] A+ ICRA Limited750 750
Short-term Debt [ICRA] A1+ ICRA Limited
Securitisation Pool CARE AA (SO) CARE Ratings - 243
Securitisation Pool ICRA AA (SO) ICRA Limited - 372
33
CAPITAL STRUCTURE AND
SHARE PRICE MOVEMENT
34

CAPITAL STRUCTURE AS ON 31ST DECEMBER 2015
No. of shares -12.7 Crs.
35
Excludes no. of Outstanding ESOPs 0.3 Crs.
Note: The Investment under different accounts by a fund are
clubbed under their respective names
39.7%
0.9%
0.9%
0.9%
1.1%
1.2%
1.2%
1.2%
1.4%
1.5%
1.5%
1.6%
1.6%
1.7%
1.7%
1.8%
1.9%
2.1%
2.3%
2.7%
2.8%
3.0%
3.3%
3.5%
4.1%
4.3%
4.6%
5.4%
Others
Morgan Stanley Investment…
Vanguard
Goldman Sachs
Wasatch Funds
SIDBI
TVF Fund Ltd.
GMO
ICICI Prudential Mutual Fund
Kotak
Columbia Threadneedle…
Amundi
Swiss Finance Corporation…
DSP Blackrock Mutual Fund
Wellington
Morgan Stanley Mauritius
Kismet SKS II
Alliancebernstein
Baron Capital Management
Kismet Microfinance
Birla Sun Life Mutual Fund
Tree Line
Vinod Khosla
Max Life Insurance Company…
Sandstone
Amansa Capital PTE Limited
Morgan Stanley SG PTE
IDFC Mutual Fund
FII, 33.9%
Domestic MFs,
Insurance co's & FIs ,
22.2%
Foreign Corporates,
9.8%
FPI, 18.4%
Domestic Individuals,
9.2%
NRI, 4.3%
Domestic Corporates,
2.1%
SHAREHOLDING PATTERN
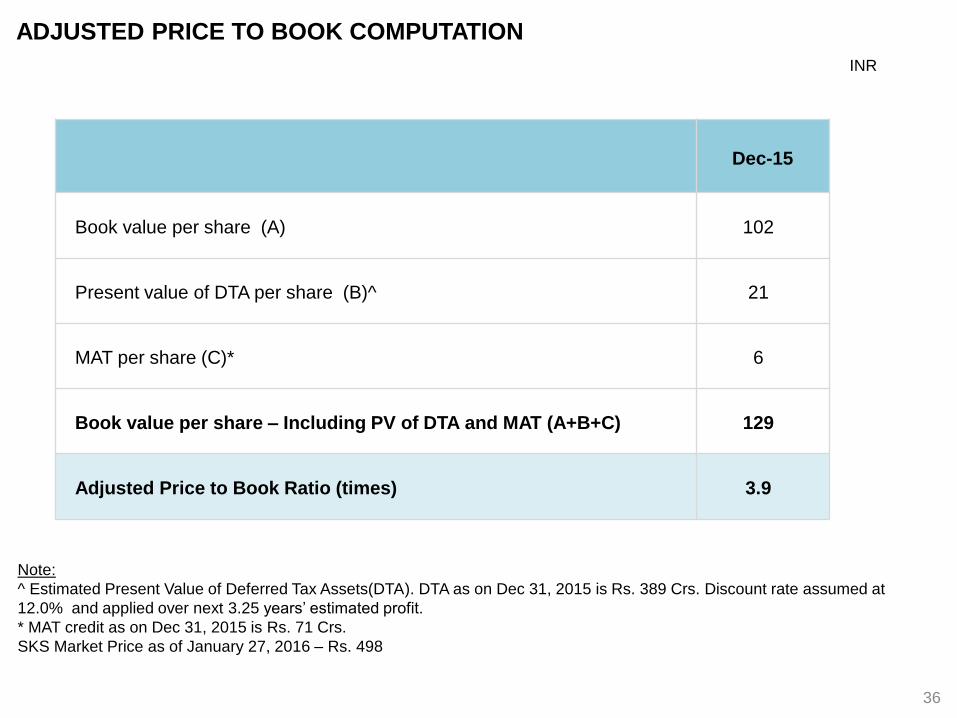
ADJUSTED PRICE TO BOOK COMPUTATION
Dec-15
Book value per share (A) 102
Present value of DTA per share (B)^ 21
MAT per share (C)* 6
Book value per share – Including PV of DTA and MAT (A+B+C) 129
Adjusted Price to Book Ratio (times) 3.9
36
Note:
^ Estimated Present Value of Deferred Tax Assets(DTA). DTA as on Dec 31, 2015 is Rs. 389 Crs. Discount rate assumed at
12.0% and applied over next 3.25 years’ estimated profit.
* MAT credit as on Dec 31, 2015 is Rs. 71 Crs.
SKS Market Price as of January 27, 2016 – Rs. 498
INR
ANNEXURES
37
38
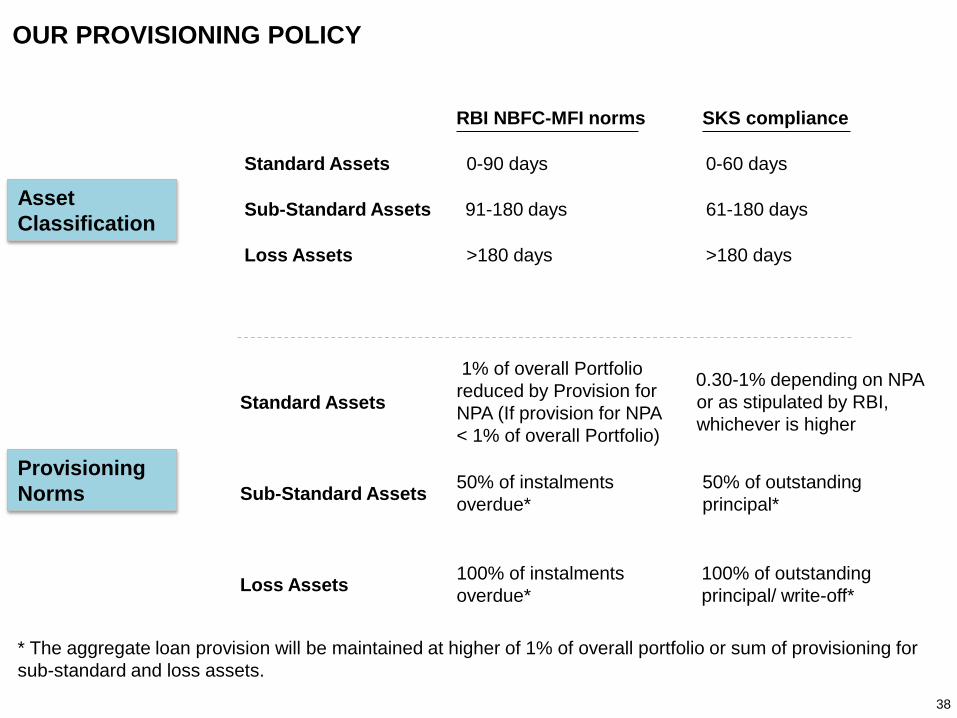
OUR PROVISIONING POLICY
SKS compliance
Asset
Classification
Standard Assets 0-90 days 0-60 days
Sub-Standard Assets 91-180 days 61-180 days
Loss Assets >180 days >180 days
Standard Assets
1% of overall Portfolio
reduced by Provision for
NPA (If provision for NPA
< 1% of overall Portfolio)
0.30-1% depending on NPA
or as stipulated by RBI,
whichever is higher
Sub-Standard Assets50% of instalments
overdue*
50% of outstanding
principal*
Loss Assets100% of instalments
overdue*
100% of outstanding
principal/ write-off*
Provisioning
Norms
RBI NBFC-MFI norms
* The aggregate loan provision will be maintained at higher of 1% of overall portfolio or sum of provisioning for
sub-standard and loss assets.
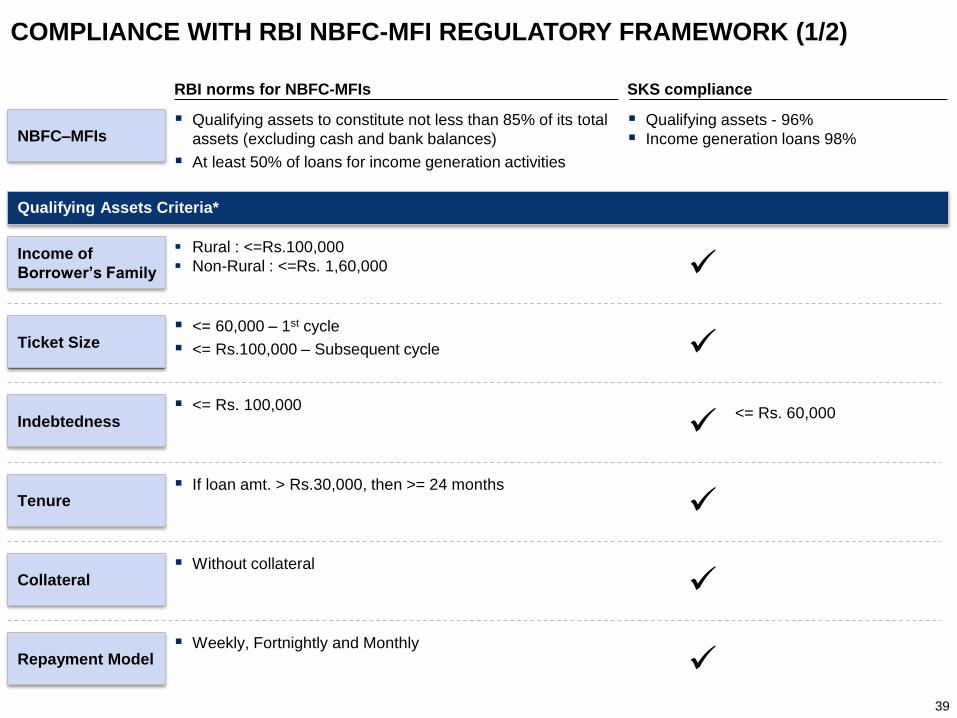
Qualifying Assets Criteria*
RBI norms for NBFC-MFIs
COMPLIANCE WITH RBI NBFC-MFI REGULATORY FRAMEWORK (1/2)
39
NBFC–MFIs Qualifying assets to constitute not less than 85% of its total
assets (excluding cash and bank balances)
At least 50% of loans for income generation activities
Qualifying assets - 96%
Income generation loans 98%
SKS compliance
Ticket Size <= 60,000 – 1st cycle
<= Rs.100,000 – Subsequent cycle
Indebtedness <= Rs. 100,000
Tenure If loan amt. > Rs.30,000, then >= 24 months
Collateral Without collateral
Repayment Model Weekly, Fortnightly and Monthly
Income of
Borrower’s Family
Rural : <=Rs.100,000
Non-Rural : <=Rs. 1,60,000
<= Rs. 60,000
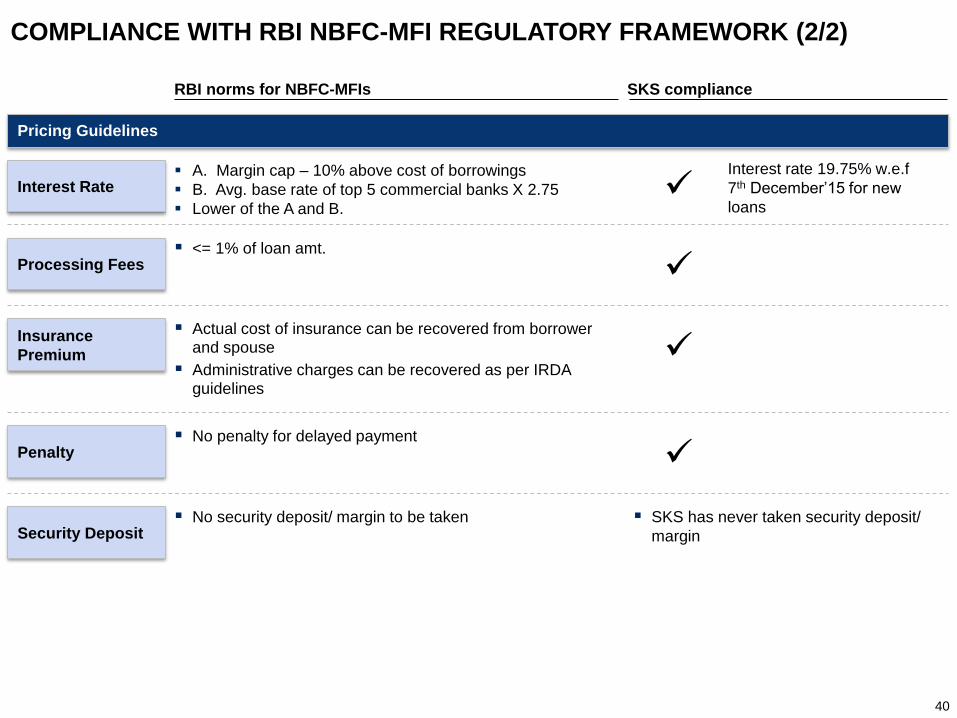
COMPLIANCE WITH RBI NBFC-MFI REGULATORY FRAMEWORK (2/2)
40
Interest Rate A. Margin cap – 10% above cost of borrowings
B. Avg. base rate of top 5 commercial banks X 2.75
Lower of the A and B.
Security Deposit No security deposit/ margin to be taken SKS has never taken security deposit/
margin
Pricing Guidelines
Processing Fees <= 1% of loan amt.
Penalty No penalty for delayed payment
Insurance
Premium
Actual cost of insurance can be recovered from borrower and spouse
Administrative charges can be recovered as per IRDA guidelines
RBI norms for NBFC-MFIs SKS compliance
Interest rate 19.75% w.e.f
7th December’15 for new
loans
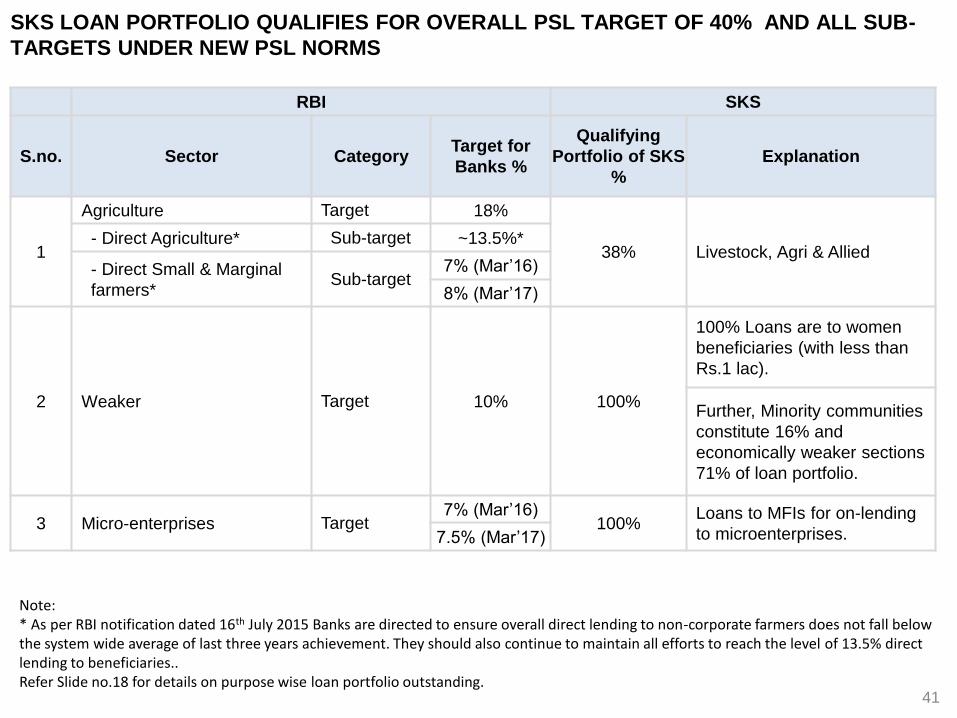
SKS LOAN PORTFOLIO QUALIFIES FOR OVERALL PSL TARGET OF 40% AND ALL SUB-
TARGETS UNDER NEW PSL NORMS
Note: * As per RBI notification dated 16th July 2015 Banks are directed to ensure overall direct lending to non-corporate farmers does not fall below the system wide average of last three years achievement. They should also continue to maintain all efforts to reach the level of 13.5% direct lending to beneficiaries..Refer Slide no.18 for details on purpose wise loan portfolio outstanding.
RBI SKS
S.no. Sector CategoryTarget for
Banks %
Qualifying
Portfolio of SKS
%
Explanation
1
Agriculture Target 18%
38% Livestock, Agri & Allied- Direct Agriculture* Sub-target ~13.5%*
- Direct Small & Marginal
farmers*Sub-target
7% (Mar’16)
8% (Mar’17)
2 Weaker Target 10% 100%
100% Loans are to women
beneficiaries (with less than
Rs.1 lac).
Further, Minority communities
constitute 16% and
economically weaker sections
71% of loan portfolio.
3 Micro-enterprises Target7% (Mar’16)
100%Loans to MFIs for on-lending
to microenterprises. 7.5% (Mar’17)
41
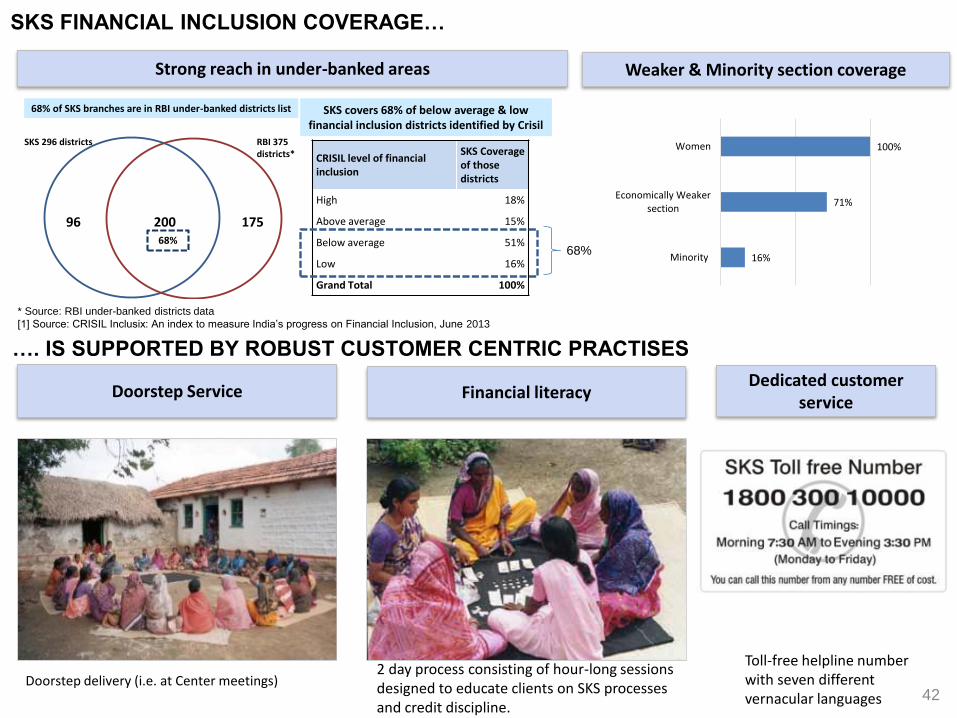
SKS FINANCIAL INCLUSION COVERAGE…
Strong reach in under-banked areas
20096 175
SKS 296 districts RBI 375 districts*
68%
68% of SKS branches are in RBI under-banked districts list SKS covers 68% of below average & low financial inclusion districts identified by Crisil
CRISIL level of financial inclusion
SKS Coverage of thosedistricts
High 18%
Above average 15%
Below average 51%
Low 16%
Grand Total 100%
68%
Weaker & Minority section coverageWeaker & Minority section coverage
16%
71%
100%
Minority
Economically Weakersection
Women
Doorstep ServiceDedicated customer
service
Toll-free helpline number with seven different vernacular languages
Financial literacy
2 day process consisting of hour-long sessions designed to educate clients on SKS processes and credit discipline.
…. IS SUPPORTED BY ROBUST CUSTOMER CENTRIC PRACTISES
Doorstep delivery (i.e. at Center meetings)
* Source: RBI under-banked districts data
[1] Source: CRISIL Inclusix: An index to measure India’s progress on Financial Inclusion, June 2013
42
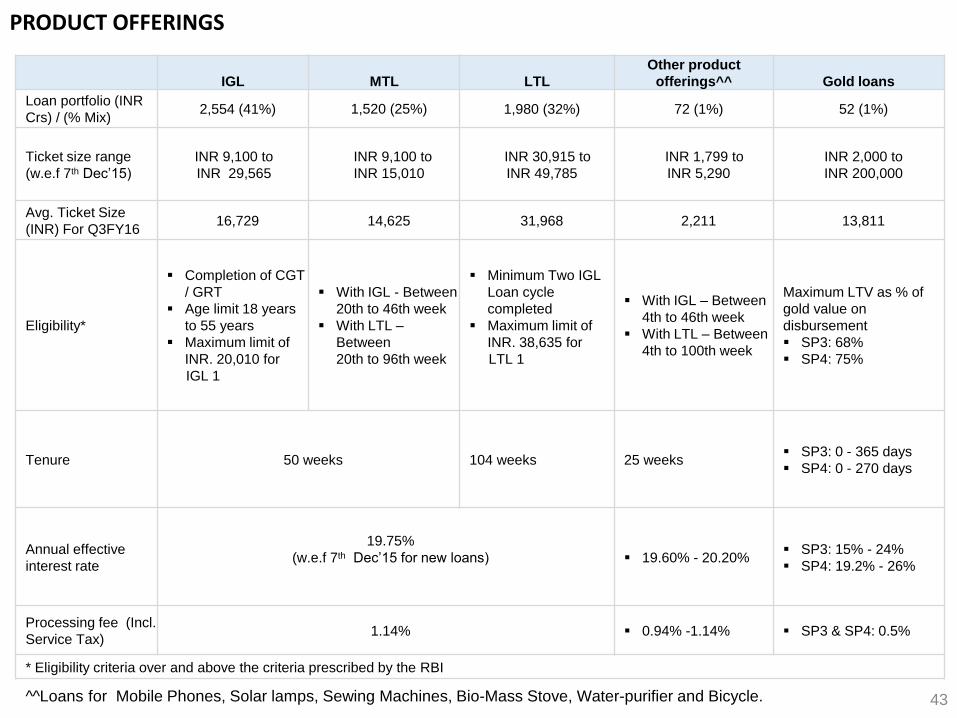
IGL MTL LTL
Other product
offerings^^ Gold loans
Loan portfolio (INR
Crs) / (% Mix)2,554 (41%) 1,520 (25%) 1,980 (32%) 72 (1%) 52 (1%)
Ticket size range
(w.e.f 7th Dec’15)
INR 9,100 to
INR 29,565
INR 9,100 to
INR 15,010
INR 30,915 to
INR 49,785
INR 1,799 to
INR 5,290
INR 2,000 to
INR 200,000
Avg. Ticket Size
(INR) For Q3FY1616,729 14,625 31,968 2,211 13,811
Eligibility*
Completion of CGT
/ GRT
Age limit 18 years
to 55 years
Maximum limit of
INR. 20,010 for
IGL 1
With IGL - Between
20th to 46th week
With LTL –
Between
20th to 96th week
Minimum Two IGL
Loan cycle
completed
Maximum limit of
INR. 38,635 for
LTL 1
With IGL – Between
4th to 46th week
With LTL – Between
4th to 100th week
Maximum LTV as % of
gold value on
disbursement
SP3: 68%
SP4: 75%
Tenure 50 weeks 104 weeks 25 weeks SP3: 0 - 365 days
SP4: 0 - 270 days
Annual effective
interest rate
19.75%
(w.e.f 7th Dec’15 for new loans) 19.60% - 20.20% SP3: 15% - 24%
SP4: 19.2% - 26%
Processing fee (Incl.
Service Tax)1.14% 0.94% -1.14% SP3 & SP4: 0.5%
* Eligibility criteria over and above the criteria prescribed by the RBI
PRODUCT OFFERINGS
^^Loans for Mobile Phones, Solar lamps, Sewing Machines, Bio-Mass Stove, Water-purifier and Bicycle. 43
44
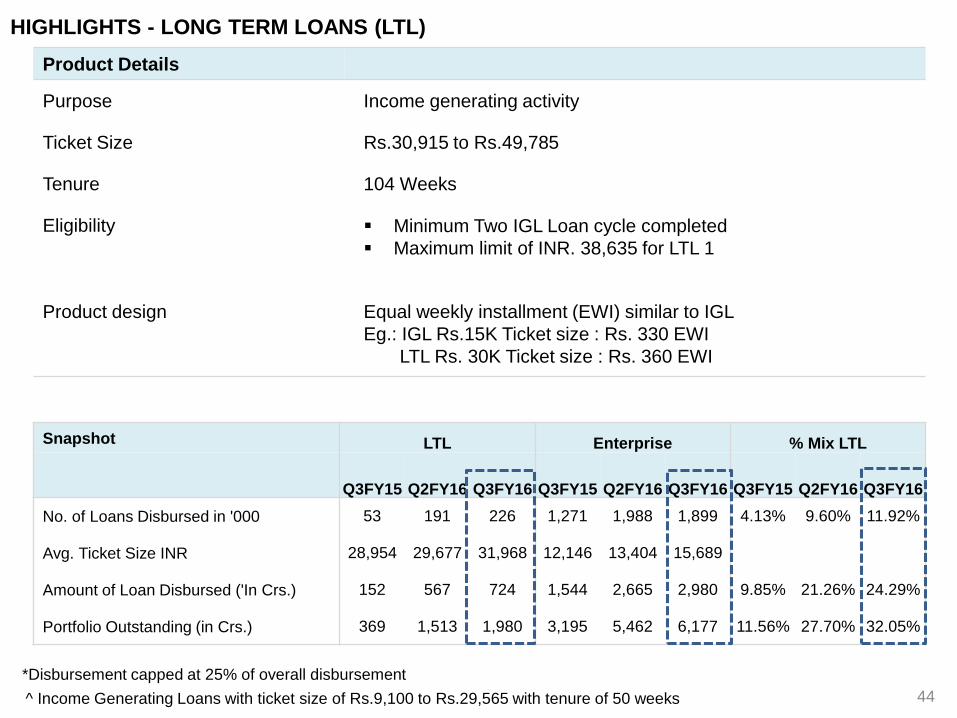
HIGHLIGHTS - LONG TERM LOANS (LTL)
Product Details
Purpose Income generating activity
Ticket Size Rs.30,915 to Rs.49,785
Tenure 104 Weeks
Eligibility Minimum Two IGL Loan cycle completed
Maximum limit of INR. 38,635 for LTL 1
Product design Equal weekly installment (EWI) similar to IGL
Eg.: IGL Rs.15K Ticket size : Rs. 330 EWI
LTL Rs. 30K Ticket size : Rs. 360 EWI
Snapshot LTL Enterprise % Mix LTL
Q3FY15 Q2FY16 Q3FY16 Q3FY15 Q2FY16 Q3FY16 Q3FY15 Q2FY16 Q3FY16
No. of Loans Disbursed in '000 53 191 226 1,271 1,988 1,899 4.13% 9.60% 11.92%
Avg. Ticket Size INR 28,954 29,677 31,968 12,146 13,404 15,689
Amount of Loan Disbursed ('In Crs.) 152 567 724 1,544 2,665 2,980 9.85% 21.26% 24.29%
Portfolio Outstanding (in Crs.) 369 1,513 1,980 3,195 5,462 6,177 11.56% 27.70% 32.05%
*Disbursement capped at 25% of overall disbursement
^ Income Generating Loans with ticket size of Rs.9,100 to Rs.29,565 with tenure of 50 weeks
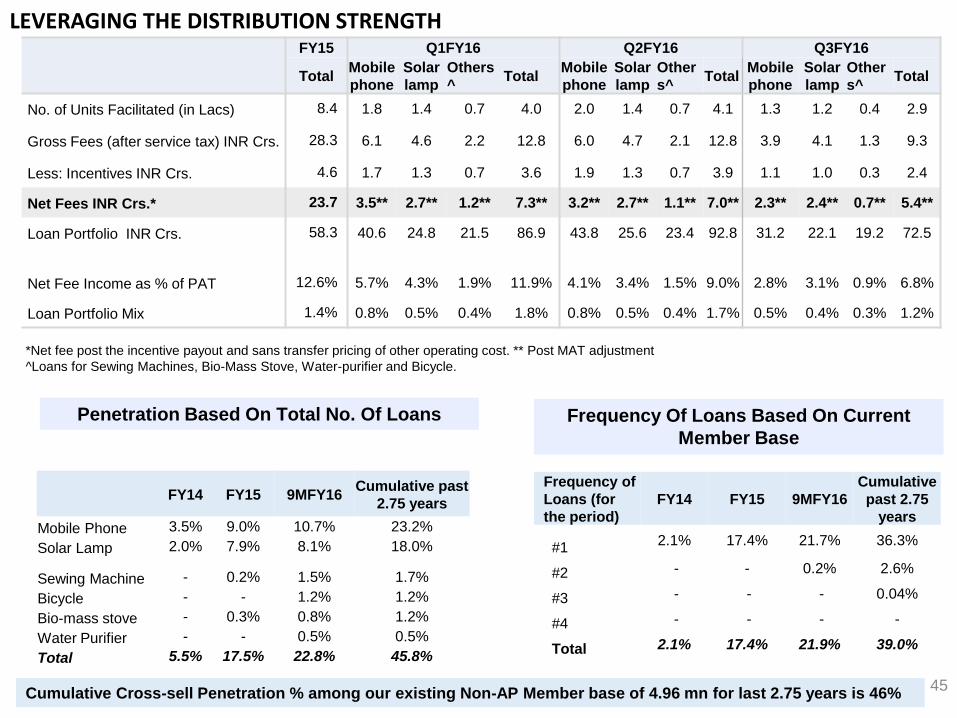
LEVERAGING THE DISTRIBUTION STRENGTH
*Net fee post the incentive payout and sans transfer pricing of other operating cost. ** Post MAT adjustment
^Loans for Sewing Machines, Bio-Mass Stove, Water-purifier and Bicycle.
45Cumulative Cross-sell Penetration % among our existing Non-AP Member base of 4.96 mn for last 2.75 years is 46%
FY14 FY15 9MFY16Cumulative past
2.75 years
Mobile Phone 3.5% 9.0% 10.7% 23.2%
Solar Lamp 2.0% 7.9% 8.1% 18.0%
Sewing Machine - 0.2% 1.5% 1.7%
Bicycle - - 1.2% 1.2%
Bio-mass stove - 0.3% 0.8% 1.2%
Water Purifier - - 0.5% 0.5%
Total 5.5% 17.5% 22.8% 45.8%
Frequency of
Loans (for
the period)
FY14 FY15 9MFY16
Cumulative
past 2.75
years
#1 2.1% 17.4% 21.7% 36.3%
#2 - - 0.2% 2.6%
#3 - - - 0.04%
#4 - - - -
Total 2.1% 17.4% 21.9% 39.0%
FY15 Q1FY16 Q2FY16 Q3FY16
TotalMobile
phone
Solar
lamp
Others
^Total
Mobile
phone
Solar
lamp
Other
s^Total
Mobile
phone
Solar
lamp
Other
s^Total
No. of Units Facilitated (in Lacs) 8.4 1.8 1.4 0.7 4.0 2.0 1.4 0.7 4.1 1.3 1.2 0.4 2.9
Gross Fees (after service tax) INR Crs. 28.3 6.1 4.6 2.2 12.8 6.0 4.7 2.1 12.8 3.9 4.1 1.3 9.3
Less: Incentives INR Crs. 4.6 1.7 1.3 0.7 3.6 1.9 1.3 0.7 3.9 1.1 1.0 0.3 2.4
Net Fees INR Crs.* 23.7 3.5** 2.7** 1.2** 7.3** 3.2** 2.7** 1.1** 7.0** 2.3** 2.4** 0.7** 5.4**
Loan Portfolio INR Crs. 58.3 40.6 24.8 21.5 86.9 43.8 25.6 23.4 92.8 31.2 22.1 19.2 72.5
Net Fee Income as % of PAT 12.6% 5.7% 4.3% 1.9% 11.9% 4.1% 3.4% 1.5% 9.0% 2.8% 3.1% 0.9% 6.8%
Loan Portfolio Mix 1.4% 0.8% 0.5% 0.4% 1.8% 0.8% 0.5% 0.4% 1.7% 0.5% 0.4% 0.3% 1.2%
Penetration Based On Total No. Of Loans Frequency Of Loans Based On Current
Member Base
46
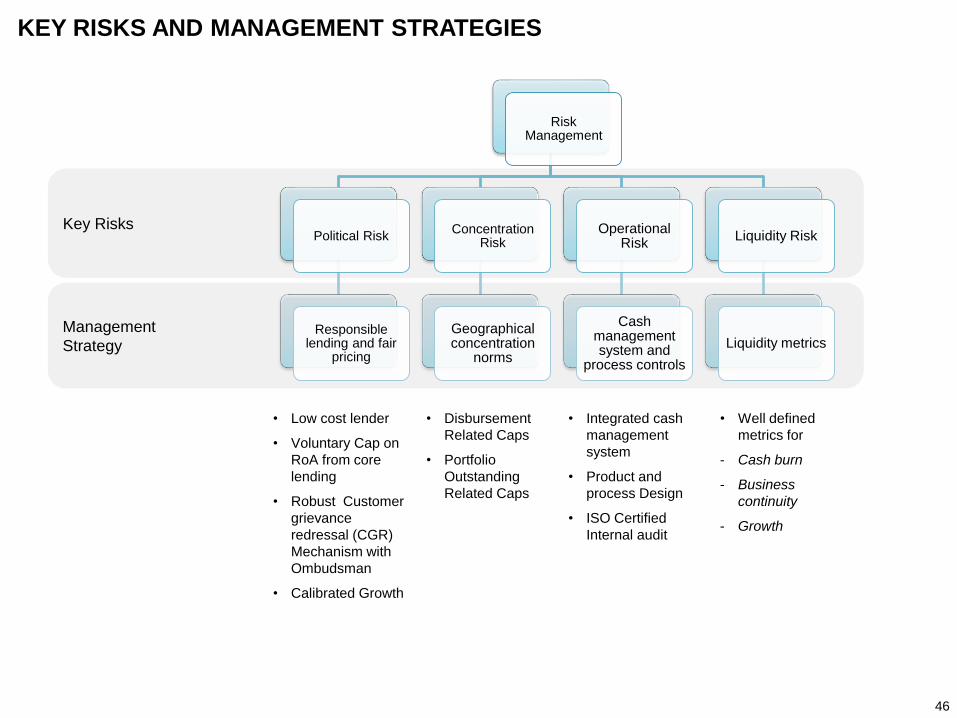
KEY RISKS AND MANAGEMENT STRATEGIES
Management
Strategy
Key Risks
Risk Management
Political Risk
Responsible lending and fair
pricing
Concentration Risk
Geographical concentration
norms
Operational Risk
Cash management system and
process controls
Liquidity Risk
Liquidity metrics
• Low cost lender
• Voluntary Cap on
RoA from core
lending
• Robust Customer
grievance
redressal (CGR)
Mechanism with
Ombudsman
• Calibrated Growth
• Disbursement
Related Caps
• Portfolio
Outstanding
Related Caps
• Integrated cash
management
system
• Product and
process Design
• ISO Certified
Internal audit
• Well defined
metrics for
- Cash burn
- Business
continuity
- Growth
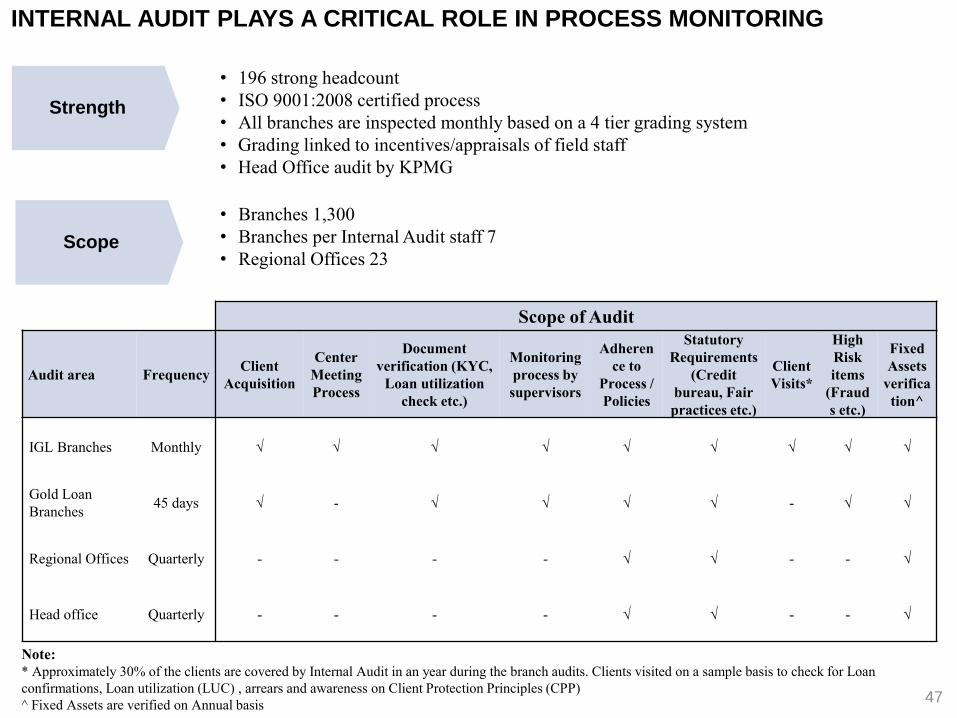
Scope of Audit
Audit area FrequencyClient
Acquisition
Center
Meeting
Process
Document
verification (KYC,
Loan utilization
check etc.)
Monitoring
process by
supervisors
Adheren
ce to
Process /
Policies
Statutory
Requirements
(Credit
bureau, Fair
practices etc.)
Client
Visits*
High
Risk
items
(Fraud
s etc.)
Fixed
Assets
verifica
tion^
IGL Branches Monthly √ √ √ √ √ √ √ √ √
Gold Loan
Branches45 days √ - √ √ √ √ - √ √
Regional Offices Quarterly - - - - √ √ - - √
Head office Quarterly - - - - √ √ - - √
Note:
* Approximately 30% of the clients are covered by Internal Audit in an year during the branch audits. Clients visited on a sample basis to check for Loan
confirmations, Loan utilization (LUC) , arrears and awareness on Client Protection Principles (CPP)
^ Fixed Assets are verified on Annual basis
• 196 strong headcount
• ISO 9001:2008 certified process
• All branches are inspected monthly based on a 4 tier grading system
• Grading linked to incentives/appraisals of field staff
• Head Office audit by KPMG
INTERNAL AUDIT PLAYS A CRITICAL ROLE IN PROCESS MONITORING
Strength
• Branches 1,300
• Branches per Internal Audit staff 7
• Regional Offices 23Scope
47

59%
37%
22%
12%
29%
0%
10%
20%
30%
40%
50%
60%
70%
Money Lender SHG Pawn Broker Bank DFC
WHAT ARE CLIENTS DOING POST THE ANDHRA PRADESH MFI CRISIS?
Interest rates charged by informal sources (in
the absence of MFIs)
Sources of Credit (in the absence of MFI Loans) Reasons for not repaying MFI loans
Willingness to repay
Source: “What are Clients doing post the Andhra Pradesh MFI Crisis?”, MicroSave, 2011 48
This report is for information purposes only and does not construe to be any investment, legal or
taxation advice. It is not intended as an offer or solicitation for the purchase or sale of any financial
instrument. Any action taken by you on the basis of the information contained herein is your
responsibility alone and SKS and its subsidiaries or its employees or directors, associates will not be
liable in any manner for the consequences of such action taken by you. We have exercised due
diligence in checking the correctness and authenticity of the information contained herein, but do not
represent that it is accurate or complete. SKS or any of its subsidiaries or associates or employees
shall not be in any way responsible for any loss or damage that may arise to any person from any
inadvertent error in the information contained in this publication. The recipient of this report should
rely on their own investigations. SKS and/or its subsidiaries and/or directors, employees or
associates may have interests or positions, financial or otherwise in the securities mentioned in this
report
Forward Looking Statement
Certain statements in this document with words or phrases such as “will”, “should”, etc., and similar
expressions or variation of these expressions or those concerning our future prospects are forward
looking statements. Actual results may differ materially from those suggested by the forward looking
statements due to a number of risks or uncertainties associated with the expectations. These risks
and uncertainties include, but are not limited to, our ability to successfully implement our strategy and
changes in government policies. The company may, from time to time, make additional written and
oral forward looking statements, including statements contained in the company’s filings with the
stock exchanges and our reports to shareholders. The company does not undertake to update any
forward-looking statements that may be made from time to time by or on behalf of the company
For any investor relations queries, please email to [email protected] 49