earth and planetary science letters - pages.uoregon.edupages.uoregon.edu/drt/reprints/earth and...
TRANSCRIPT
Earth and Planetary Science Letters 368 (2013) 51–60
Contents lists available at SciVerse ScienceDirect
Earth and Planetary Science Letters
0012-82http://d
⁎ CorrE-m
journal homepage: www.elsevier.com/locate/epsl
Evidence for slab rollback in westernmost Mediterranean fromimproved upper mantle imaging
M.J. Bezada a,⁎, E.D. Humphreys a, D.R. Toomey a, M. Harnafi b, J.M. Dávila c, J. Gallart d
a Department of Geological Sciences, University of Oregon, Eugene, OR 97403, USAb Institut Scientifique, Université Mohammed V Agdal, Rabat, Moroccoc Real Instituto y Observatorio de la Armada, San Fernando, Spaind CSIC-Institute of Earth Sciences “Jaume Almera”, Barcelona, Spain
a r t i c l e i n f o
Article history:Received 15 November 2012Received in revised form28 January 2013Accepted 19 February 2013
Editor: P. Shearer Available online 29 March 20131. Introduction
The prevailing idea for the geologic evolution of the westernMediterranean in the Cenozoic is based on north dipping subduc-tion near the gulf of Lyon undergoing vigorous rollback since∼30 Ma as a consequence of slow Africa–Eurasia convergenceacross the ∼130 My old Alpine Tethys oceanic lithosphere(Lonergan and White, 1997; Malinverno and Ryan, 1986; Royden,1993). As rollback propagated south, the subduction zone brokeinto three segments that continued to retreat independently to theeast, south and west (Faccenna et al., 2004; Lonergan and White,1997; Spakman and Wortel, 2004). The model for the evolution ofthe eastern slab is well established and generally accepted. Thatslab is now found under the Calabrian and Apenninic arcs and itsroll-back led to the rotation of the Corsica–Sardinia block and thestretching of the crust in a back-arc setting producing the Liguria–Provençal and Thyrrhenian basins (Fig. 1) (Faccenna et al., 2004;Rosenbaum and Lister, 2004; Spakman and Wortel, 2004). Thesouthern and western subduction segments are thought to haveretreated to the south towards Africa and west towards Gibraltar,leading to the opening the Algerian basin, and extension in theAlborán terrane (Fig. 1) (Faccenna et al., 2004; Lonergan andWhite, 1997; Spakman and Wortel, 2004).
The latter part of this accounting is controversial, especiallywith regard to the geologic history of the Alborán domain and theassociated Betic and Rif mountain range uplift (Fig. 1). From 27 to5 Ma the Alborán continental crust underwent an episode of high-temperature metamorphism, was then uplifted, and transported afew hundred km into the westernmost Mediterranean where itwas thrust onto the continental margins of Africa and Iberia as it
1X/$ - see front matter & 2013 Elsevier B.V. All rights reserved.x.doi.org/10.1016/j.epsl.2013.02.024
esponding author. Tel.: þ1 832 398 4976.ail address: [email protected] (M.J. Bezada).
gravitationally collapsed (Platt and Whitehouse, 1999; Platt et al.,2003, 1998). The cause of this activity and its association with thesubducting ocean lithosphere is where the controversy lies.Several authors attribute this series of events fundamentally to adelamination (Calvert et al., 2000; Docherty and Banda, 1995; Plattet al., 1998; Seber et al., 1996) or Rayleigh–Taylor foundering(Houseman, 1996; Platt and Vissers, 1989) of Alborán lithosphere,whereas others make a direct link to slab rollback (Faccenna et al.,2004) or slab break-off (Zeck, 1996). These models appear to beincompatible with each other.
Tomographic imaging of mantle structure could help discernbetween the competing hypotheses. While both hypotheses pre-dict the existence of a fast anomaly under the Alborán domain,these different hypothetical origins predict a significantly differentmorphology of the high-velocity structure. Extensive slab rollbackpredicts a vertically continuous anomaly reaching depths in excessof 600 km. Horizontal slices through this anomaly should show awell-defined linear or curvilinear shape, as the width of thesubducted lithosphere should be much greater than its thickness.This would be true both for models that involve only slab rollback(Spakman and Wortel, 2004) or those that incorporate someAlborán mantle lithosphere delamination (Faccenna et al., 2004).Lithospheric delamination alone could produce an anomaly similarin shape to that caused by slab rollback but it should have a muchshorter length, since the fast material found in the mantle wouldcorrespond only to the lithosphere directly under and to the west ofthe original position of the Alborán terrane. Foundering of a Rayleigh–Taylor stability would produce a much different anomaly. The high-velocity anomaly should in this case be detached from the surfaceand have a more rounded shape that is often described as blob-like.
The deep seismicity in the area provides additional andcomplementary information on mantle structure. A set ofintermediate-depth earthquakes, defines a N–S trend of seismicity

Fig. 1. (A) Setting of the study area and physiographic features mentioned in the text. Relevant geologic provinces and main thrust faults follow Lonergan and White (1997).Rectangle shows the location of panel B. (B) Location of stations (inverted triangles) and local events (stars) used in the inversion. Symbol colors represent station networksand event depths as indicated in the legend. (For interpretation of the references to color in this figure legend, the reader is referred to the web version of this article.)
M.J. Bezada et al. / Earth and Planetary Science Letters 368 (2013) 51–6052
that occurs to the east of the strait of Gibraltar at depths above160 km (Buforn et al., 2004) (Fig. 1). Because the Alborándomain was transported west a few hundred km (Platt et al.,2003), potentially over oceanic lithosphere, all models for thedeeper high-velocity anomaly are consistent with this structure.An additional cluster of deep-focus seismicity occurs undersouthern Spain at ∼640 km depth (Buforn et al., 2004) (Fig. 1).The occurrence of these earthquakes is consistent with acalculated low slab thermal parameter of 2800 km (Gorbatovand Kostoglodov, 1997) (using a lithospheric age of 130 m.y. anda time of initial subduction of 30 Ma). If this deep-focusseismicity were not occurring in old subducted ocean litho-sphere, it would be the only known exception. An alternativeinterpretation consistent with the delamination hypothesis isthat intermediate depth and the deep-focus seismicity occurwithin different bodies that are separated from each other: ashort shallow slab and a sunken piece of delaminated litho-sphere (Calvert et al., 2000).
There are two questions we must answer in order to discrimi-nate between the possible origins of the high velocity anomalyunder the Alborán: Is there one continuous high-velocity bodyextending from the shallow subsurface to the bottom of thetransition zone? And, does this body have a well-defined slabshape or is it a more massive, blob-like body?
Mantle imaging thus far has been ambiguous enough as toleave these two questions open to debate. Calvert et al. (2000)interpreted their model as showing two separate bodies, thussupporting a delamination model. While Blanco and Spakman(1993) interpret the imaged high-velocity structure as a detachedslab, Spakman and Wortel (2004) used improved images fromBijwaard and Spakman (2000) to suggest a continuous slab.Gutscher et al. (2002) used the model from Bijwaard andSpakman (2000) to make the case for the presence of a slab,although Platt and Houseman (2003) interpreted the same tomo-graphic images as supporting the delamination model. The diver-gent interpretations are possible because the anomaly imaged inSpakman and Wortel (2004) acquires a blob-like quality at depthsgreater than 400 km. Piromallo and Morelli (2003) and Faccennaet al. (2004) present mantle images that they interpret as resultingfrom slab-rollback followed by delamination, however the
geometry of the anomaly in their images also makes it subject tore-interpretation as a large lithospheric drip.
More recently, additional seismic studies have supported therollback hypothesis through the estimation of mantle strain basedon SKS splitting (Bokelmann et al., 2011; Diaz et al., 2010) andanalyses of seismic wave interaction with the high-velocity mantlestructure (Bokelmann and Maufroy, 2007; Bokelmann et al., 2011).However, a consensus has not yet been reached, mostly becausethe paleo-position and geologic history of the Alborán domain, aswell as the timing of under-thrusting and continental uplift in theNevado–Filabride complex of southern Spain seem inconsistentwith the evolution of the trench position predicted by the rollbackmodel. Therefore, the mantle imaging and the geologic constraintsappear to be at odds with one another and the mantle imaging hasthus far not been conclusive enough to settle the debate.
In this study, we take advantage of large, coordinated seismo-graph deployments in Spain and northern Morocco (Fig. 1) to builda dense, high-quality dataset. We also use an improved seismictomography procedure that combines frequency-dependent sensi-tivity kernels and iterative 3-D ray tracing to obtain an image ofmantle structure with significantly improved resolution. The result-ing velocity model shows a vertically continuous high-velocityanomaly under the Alborán domain and southern Spain that has awell-defined shape and is most consistent with the subducted slabhypothesis. With the new images, we propose a geodynamicinterpretation that reconciles the rollback hypothesis with thegeological observations.
2. Method
Classical (linear, ray-based) teleseimic tomography ignores ray-path dependence on velocity structure as well as the effects ontravel times of velocity anomalies located off the geometric ray.The first limitation is addressed with iterative ray tracing, wherethe model is progressively updated and new ray paths are found ateach iteration (e.g. Bijwaard and Spakman, 2000; Papazachos andNolet, 1997; Sambridge, 1990; Zhao et al., 1992) and the secondlimitation has been addressed by using finite-frequency sensitivitykernels, most commonly the Born or banana-doughnut kernels of
M.J. Bezada et al. / Earth and Planetary Science Letters 368 (2013) 51–60 53
Dahlen et al. (2000). Both of these limitations can be overcomemore completely by using methods in which the sensitivities ofthe travel time delays to all model parameters are calculated foreach waveform (e.g. Tromp et al., 2005). Of course, with each stepaway from simplification the computational burden rises. In thispaper we present an approach of intermediate sophistication thatcombines iterative ray tracing with the use of approximated Bornkernels, thereby addressing the two limitations mentioned abovewith a relatively modest computational cost.
We use a hybrid ray-tracing scheme that combines 1-D traveltimes to the outside of the model volume (the “box”) and 3-Dtravel times inside the box. Outside-the-box times are found usinga τ-p calculator, while inside-the-box times are found using agraph-theory method (Hammond and Toomey, 2003; Toomeyet al., 1994). For each event–station pair, in each iteration we findthe ray of minimum total travel time. To build the sensitivitymatrix, we use the approximated Born kernels of Schmandt andHumphreys (2010), which are conformed to the ray paths foundthrough the hybrid ray-tracing technique.
It should be noted that our inversion of relative travel-timedelays is not very sensitive to the mean velocity at any givendepth, and deviations from our 1-D reference model (AK-135,Kennett et al., 1995) would not be resolved. However, deviations inthe 1-D structure will influence raypath locations and introduceuncertainties that, while not large, are difficult to predict. Addi-tional uncertainty is introduced by the fact that we ignore 3-Dstructure outside of our model domain, which could affect thelocation of the entry point into the box, particularly for eventscoming from strongly heterogeneous regions like the Andeansubduction zone. Despite these misgivings, it is reasonable toassume that accounting for the perturbational 3D structure insidethe box yields ray paths that are closer to the real paths than thosetraced through a radial earth model.
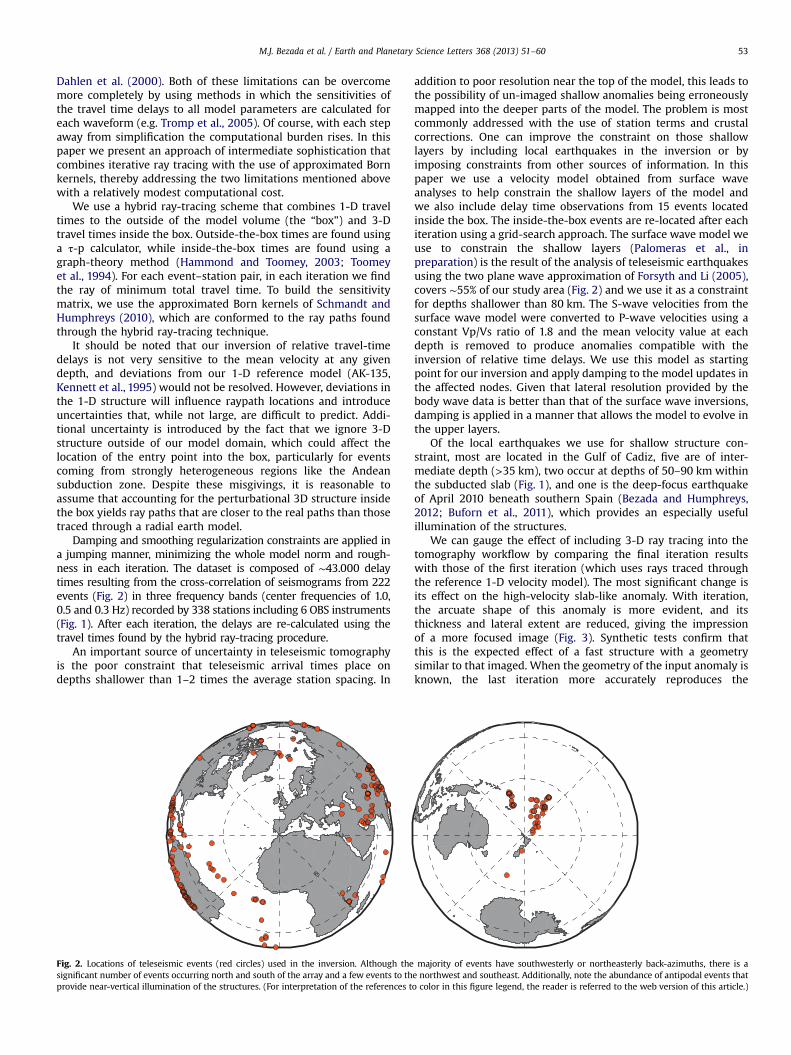
Damping and smoothing regularization constraints are applied ina jumping manner, minimizing the whole model norm and rough-ness in each iteration. The dataset is composed of ∼43.000 delaytimes resulting from the cross-correlation of seismograms from 222events (Fig. 2) in three frequency bands (center frequencies of 1.0,0.5 and 0.3 Hz) recorded by 338 stations including 6 OBS instruments(Fig. 1). After each iteration, the delays are re-calculated using thetravel times found by the hybrid ray-tracing procedure.
An important source of uncertainty in teleseismic tomographyis the poor constraint that teleseismic arrival times place ondepths shallower than 1–2 times the average station spacing. In
Fig. 2. Locations of teleseismic events (red circles) used in the inversion. Although thesignificant number of events occurring north and south of the array and a few events to thprovide near-vertical illumination of the structures. (For interpretation of the references t
addition to poor resolution near the top of the model, this leads tothe possibility of un-imaged shallow anomalies being erroneouslymapped into the deeper parts of the model. The problem is mostcommonly addressed with the use of station terms and crustalcorrections. One can improve the constraint on those shallowlayers by including local earthquakes in the inversion or byimposing constraints from other sources of information. In thispaper we use a velocity model obtained from surface waveanalyses to help constrain the shallow layers of the model andwe also include delay time observations from 15 events locatedinside the box. The inside-the-box events are re-located after eachiteration using a grid-search approach. The surface wave model weuse to constrain the shallow layers (Palomeras et al., inpreparation) is the result of the analysis of teleseismic earthquakesusing the two plane wave approximation of Forsyth and Li (2005),covers ∼55% of our study area (Fig. 2) and we use it as a constraintfor depths shallower than 80 km. The S-wave velocities from thesurface wave model were converted to P-wave velocities using aconstant Vp/Vs ratio of 1.8 and the mean velocity value at eachdepth is removed to produce anomalies compatible with theinversion of relative time delays. We use this model as startingpoint for our inversion and apply damping to the model updates inthe affected nodes. Given that lateral resolution provided by thebody wave data is better than that of the surface wave inversions,damping is applied in a manner that allows the model to evolve inthe upper layers.
Of the local earthquakes we use for shallow structure con-straint, most are located in the Gulf of Cadiz, five are of inter-mediate depth (>35 km), two occur at depths of 50–90 km withinthe subducted slab (Fig. 1), and one is the deep-focus earthquakeof April 2010 beneath southern Spain (Bezada and Humphreys,2012; Buforn et al., 2011), which provides an especially usefulillumination of the structures.
We can gauge the effect of including 3-D ray tracing into thetomography workflow by comparing the final iteration resultswith those of the first iteration (which uses rays traced throughthe reference 1-D velocity model). The most significant change isits effect on the high-velocity slab-like anomaly. With iteration,the arcuate shape of this anomaly is more evident, and itsthickness and lateral extent are reduced, giving the impressionof a more focused image (Fig. 3). Synthetic tests confirm thatthis is the expected effect of a fast structure with a geometrysimilar to that imaged. When the geometry of the input anomaly isknown, the last iteration more accurately reproduces the
majority of events have southwesterly or northeasterly back-azimuths, there is ae northwest and southeast. Additionally, note the abundance of antipodal events thato color in this figure legend, the reader is referred to the web version of this article.)

M.J. Bezada et al. / Earth and Planetary Science Letters 368 (2013) 51–6054
prescribed geometry and lateral extent of the anomaly, especiallyat depths greater than ∼200 km (Fig. S2, Supplementary Material).This improvement in the imaging is of critical importance in ourstudy area, given the necessity to accurately image the shape ofthe anomaly in order to distinguish between a subducted slab anda lithospheric drip.
Our final model adequately accounts for much of the observeddelay times. The RMS of the observed delays has a value of 0.57 s,whereas the RMS of the residuals after the last iteration has avalue of 0.23 s, corresponding to a total variance reduction of 84%.For details about the evolution of the model and the data misfitwith iteration see the Supplementary material.
3. Model description and comparison with previous models
Our model extends to the Earth's surface but the shallowerstructure is constrained mainly by the surface wave model ofPalomeras et al. (in preparation). We focus our discussion onanomalies deeper than 75 km, where the body wave constraintsare most important. The most prominent imaged feature is in thestructure we interpret to be the subducted Alpine Tethys slab. Thisarcuate, vertically continuous high-velocity anomaly is more than600 km long and is located beneath the western Alborán Sea and
Fig. 3. Comparison of horizontal slices through the resulting model at different depths (iteration (iterative 3-D ray-tracing, bottom row). Note that ray tracing reduces the spavelocities present near the slab in the 1-D case.
southern Spain (Fig. 4). Additional anomalies of interest includelow-velocity anomalies beneath the Middle Atlas and NE Moroccoand a small high-velocity velocity anomaly ∼450 km beneath theMiddle Atlas.
The Alborán slab anomaly dips steeply to the east, extendingcontinuously from 50 km to depths greater than 600 km.Below 350 km it is nearly vertical. Calvert et al. (2000) suggestedthat the uneven distribution of teleseismic raypaths in the wes-ternmost Mediterranean predisposes tomographic models towardscontinuous, steeply east dipping anomalies and advocates thepresence of a gap in the high-velocity feature. Synthetic tests withgaps at different depths show that a gap in the slab can be resolvedby our experimental geometry and method (Fig. 5), stronglysuggesting that the continuity of the anomaly in our model reflectsthe real geometry of the slab and is not an artifact of raydistribution.
At its greatest depth of ∼640 km, the anomaly is found mostlyunder southeastern Spain, elongated to the northeast. Above150 km, the anomaly is composed of 2 arms that are orientatedat right angles to each other. The arm of greater amplitudeanomaly is located east of the strait of Gibraltar, under the AlboránSea at a longitude of ∼4.5°W and trending N–S. The E–W trendingarm is imaged under southern Spain at a latitude of ∼37.5°N.The Spanish arm of the anomaly appears not to reach the surface
as indicated on the figure) for the first iteration (1-D ray-tracing, top row) and lasttial extent of the high-velocity anomaly and largely eliminates the “halo” of low

Fig. 4. (A) Horizontal slices through the final model at different depths as indicated on the figure. Red line on 390 km depth slice shows the location of the cross-section inpanel B. (B) East–west cross-section through the velocity model at ∼36°N, Black inverted triangle shows the location of the strait of Gibraltar. (C) Three-dimensional view ofthe þ2% velocity anomaly iso-surface viewed from the southeast. Dashed blue lines correspond to the þ2% contour at depths of 195, 290 and 580 km, the depths of thecorresponding map views are presented in bold type in panel A. (For interpretation of the references to color in this figure legend, the reader is referred to the web version ofthis article.)
M.J. Bezada et al. / Earth and Planetary Science Letters 368 (2013) 51–60 55
(as noted by Spakman and Wortel (2004) and Garcia-Castellanosand Villaseñor (2011)). Specifically, the anomaly under the Alboránis present at depths as shallow as 50 km (i.e. at depths below thesurface plate) with amplitudes greater than 4%, while the anomalyunder southern Spain is small and weak at a depth of 75 km, anddoes not attain the magnitude of the Alborán arm until depths of160 km. The two arms appear to be separated by a narrow verticalgap at depths shallower than 125 km. At this depth, the Alborán
arm of the anomaly has a horizontal length of ∼200 km and awidth of 75–100 km, and the Spanish arm is ∼150 km long and∼60 km wide. Below 150 km depth the two arms join to form asingle, laterally continuous anomaly.
In the model of Piromallo and Morelli (2003, PM), the fastanomaly does not extend above ∼200 km, and the area directlywest of the strait of Gibraltar shows slow velocities instead. Themodel presented in Spakman and Wortel (2004, BS) does show a

700
600
500
400
300
200
100
−400 −200 0 200 400700
600
500
400
300
200
100
700
600
500
400
300
200
100
−400 −200 0 200 400700
600
500
400
300
200
100
−400 −200 0 200 400
−400 −200 0 200 400
−400 −200 0 200 400
700
600
500
400
300
200
100
−400 −200 0 200 400700
600
500
400
300
200
100
−400 −200 0 200 400700
600
500
400
300
200
100
Distance (km)
−400 −200 0 200 400
Dep
th (k
m)
−3 −2 −1 0 1 2 3
Vp anomaly, %
Ai
Ar
Bi
Br
Ci
Cr
Di
Dr
Ei
Er
Fi
Fr
Gi
Gr
inpu
tre
cove
red
inpu
tre
cove
red
inpu
tre
cove
red
Fig. 5. East–West cross-sections through input and recovered models for seven test cases and the real model for reference. Location of the cross sections slightly north of thestrait of Gibraltar as in figure X. Test cases: A, continuous slab, no flat-lying segment; B, slab with a gap at 100–250 km depth, no flat lying segment; C, slab with a gap at250–300 km depth, no flat lying segment; D, continuous slab with a short flat-lying segment; E, continuous slab with a long flat-lying segment; F, continuous slab with adetached flat-lying segment. G, Same as A, but DC shifted by 2%. Magnitude of input anomalies is 5%. Test case is indicated in each cross section, subscripts “i” and “r”indicated input and recovered models respectively. The tests show that gaps in the slab are resolvable but the data are not very sensitive to a flat-lying section of slab at thebottom of the transition zone and a DC shift in the anomalies cannot be recovered. Notwithstanding the lack of sensitivity to flat-lying slabs, subtle differences in therecovered model for test cases D–F suggest that we may be able to tentatively discern between these three scenarios.
M.J. Bezada et al. / Earth and Planetary Science Letters 368 (2013) 51–6056

M.J. Bezada et al. / Earth and Planetary Science Letters 368 (2013) 51–60 57
fast velocity anomaly in this general area, although its shape is lesssharply defined and generally shifted to the west with respect toour image. In both the PM and BS models, the fast anomaly attainsa magnitude of ∼2%, in contrast to the ∼4% in our model.
Between 200 and 350 km depth, our model shows a fastanomaly with a generally arcuate shape that is concave to theeast or southeast. At this depth range, the anomaly we image isbroadly similar in shape to that in the PM and BS models, althoughgenerally our anomaly is laterally smaller and has greater ampli-tude. The difference between our model and previous onesbecomes strong at depths below ∼400 km. Whereas the PM andBS models show blob-like anomalies at these depths, the anomalyin our model preserves a well-defined concave-east arcuate shapedown to ∼600 km depth (Fig. 6). At 635 km depth, near the bottomof the model, our anomaly is greater in magnitude than previousmodels (3–4% in contrast to 1.5–2%), and although some slowanomalies appear in areas surrounding the fast anomaly in ourmodel, these are of smaller magnitude (∼1%) and different in formfrom the pervasive slow rim surrounding the fast anomaly in boththe BS and PM models. As noted in the previous section, becausewe are not able to resolve any mean shift in velocity away from thereference 1-D model (Fig. 5), we are thus unable to resolve arelatively slow ambient mantle (as imaged with absolute traveltimes in the BS and PM models). Hence, the amplitude of thevelocity anomaly in our model should be interpreted as therelative contrast between the slab and the surrounding mantle. Ifall velocities were made slower, the amplitude of our slab anomalywould then be closer to the values shown by BS and PM.
Both the PM and BS models image significant volumes of highvelocity mantle at the bottom of the transition zone, that in bothcases are interpreted as flat-lying sections of subducted slabs(Faccenna et al., 2004; Spakman and Wortel, 2004). Our modeldoes not show equivalent features, but there is a deep anomalyeast of the arcuate slab anomaly (Fig. 4) that suggests the presenceof fast mantle in the lower part of the transition zone in thispoorly-sampled part of our model. Resolution tests were carriedout to explore different scenarios and they show that our experi-mental geometry is not able to resolve a flat-lying piece of slab on
Fig. 6. A horizontal slice at 435 km through our velocity model and slices through recenSpakman (2000) (reproduced from Spakman and Wortel (2004)). Note the arcuate shapethe anomaly in previous models.
the bottom of the transition zone (Fig. 5, Supplementary material).Furthermore, these tests suggest that the deep anomaly SE of thearcuate slab anomaly near the bottom of the model (Fig. 4, 580 kmdepth slice) may indeed be an artifact caused by incorrect map-ping into the model of travel time advances occurring duringtransit through a flat piece of slab.
We conclude that our data is consistent with the presence of a flat-lying piece of subducted slab in the bottom of the transition zone eastof the Alborán slab and suggest that this piece of slab is not attachedto the Alborán slab (Fig. 7, Supplementary materials, Fig. S3).
Another noteworthy aspect of our model is a pair of anomaliesthat occur under the Atlas Mountains. At 75 km depth we findprominent low-velocity anomalies (∼3%) located under the MiddleAtlas range and near the coastline on the Morocco–Algeria border.Smaller low-velocity anomalies under the southwestern HighAtlas range complete a SW–NE trending corridor of low-velocityanomalies that follow the general trend of the Atlas mountainchain. Although these anomalies can be traced to depths as greatas 200 km, their magnitudes diminish substantially below 90 km.At depths between 390 and 530 km, under the Middle Atlas, wefind a high-velocity anomaly with a diameter of ∼100 km that isseparate from the Alborán slab anomaly. These two anomalies areinteresting because they provide evidence for a delaminationevent under the Middle Atlas. The slow anomaly could representasthenosphere at shallow depth while the fast anomaly couldcorrespond to the delaminated Atlas lithosphere.
4. Discussion
The high-velocity anomaly that we image under the westernmostMediterranean has the characteristics of a steeply east-dipping sub-ducted lithospheric slab. Our imaging shows this structure does nothave a blob-like quality at any depth and instead has an arcuate shape(Fig. 4) that is similar in appearance to the Calabrian slab(e.g., Piromallo and Morelli, 2003; Spakman and Wortel, 2004),as expected for a subducting narrow slab (Funiciello et al., 2003;Schellart et al., 2007). The structure is continuous from the surface,
t models at comparable depths. PM: Piromallo and Morelli (2003). BS: Bijwaard andof the anomaly in our model at this depth as opposed to the more blob-like shape of

M.J. Bezada et al. / Earth and Planetary Science Letters 368 (2013) 51–6058
east of Gibraltar, to the base of the transitions zone, and it is seismicallyactive at intermediate and deep depths.
The geometry of the high-velocity anomaly is consistent with aslab origin. If this feature is restored to the surface by unfolding itwithout significant in-plane strain, it fills the area occupied by thewestern Alpine Tethys at ∼30 Ma (Fig. 8). That is to say, theanomaly we image has roughly the shape of the lithosphere thatpresumably subducted.
Attributing the high-velocity anomaly in the westernmostMediterranean to subducted ocean lithosphere is not new (e.g.Blanco and Spakman, 1993; Faccenna et al., 2004; Gutscher et al.,2002; Piromallo and Morelli, 2003; Spakman and Wortel, 2004).However, this is not generally accepted. The primary objectioncomes from the apparent incompatibility of this model with the
Fig. 7. Cartoon interpretation of the geometry of the Alborán slab as imaged in ourmodel. The NS and EW trending arms of the shallow slab are separated by a smallvertical tear and the latter does not reach the surface. The gray area labeled Alborancorresponds to the part of the slab we infer is composed of the lower lithosphere of theAlborán domain. Dashed lines and question marks show a possible detached flat-lyingsection of slab at the bottom of the transition zone that cannot be adequately resolvedwith our data and method, see text for further explanation. Inverted black trianglelabeled “G” schematically shows the position of the strait of Gibraltar.
Present
Slab restored to the surface
Fig. 8. (A) Restoration of the high-velocity anomaly to the surface, with present-day locatet al., 2002a, 2002b). Restoration was produced by projecting the midlines of the anomdistance equivalent to their depth minus 70 km (blue lines in panel A, where we assumidlines are then unfolded about a hinge at constant latitude (red open circles) to obtcorrespond to the depths shown as contours in Fig. 4b. The probable position of the Albocolor in panel B. We note that these lines are purely aides in the geometric reconstructionthe references to color in this figure legend, the reader is referred to the web version o
presence of the thinned continental crust of the Alborán domain,which lies between Africa and Iberia, where rollback would haveoccurred. Previously, authors have attempted to address this pointby proposing that the Alborán domain migrated 500–700 km intoits current position following the retreating trench from theBalearic margin, with extension in the backarc creating theAlgerian Basin (Lonergan and White, 1997; Spakman and Wortel,2004). The amount of Alborán motion required by this model isnot consistent with palinspastic reconstructions based on balancedcross-sections of the Betic–Rif belts that constrain Alborán–Iberiaconvergence to ∼250 km since 20 Ma (Platt et al., 2003, 2013) andthere is no geologic evidence for the presence of Alborán domainremnants that far east or the existence of a strike-slip faultrequired for this transport (Platt et al., 2003).
The paleo-position of the Alborán terrane obtained fromgeological constraints places it on the subducting plate, withinthe area involved with subduction (Fig. 8). We therefore prefer amodel that has rollback beginning at the Balearic margin northeastof the Alborán domain and continuing under the Alborán crust,taking the Alborán mantle lithosphere with it. Such a model isconsistent with the thermal history of the Alborán domain.Starting at ∼27 Ma the base of the Alborán crust experiencednear-asthenospheric temperatures accompanied by uplift, suggest-ing that most of the lithospheric mantle was lost (Platt et al., 1998).This has been attributed to convective removal or delamination ofan over-thickened lower lithosphere (Houseman, 1996; Platt andVissers, 1989). We propose that the delamination event occurredas a result of subduction of the Alborán lithospheric mantle alongwith the larger slab that we find presently under the westernmostMediterranean. The Alborán crust, having avoided subduction,would have been transferred or accreted to the overriding plate.Given the early history of high pressure—low temperature meta-morphism of the Alborán crust (Azañón and Crespo-Blanc, 2000;Platt et al., 2005), it is probable that some degree of subductionand later exhumation of the crust preceded the delaminationevent (Bialas et al., 2011; Brun and Faccenna, 2008).
After the delamination–accretion event, rollback would havecontinued by consuming the lithosphere west of the Alborán,which we presume to be largely oceanic in nature (given theoccurrence of intermediate depth seismicity that usually is linkedto dehydration reactions in subducting oceanic lithosphere, Green
~30 Ma
Alboran Domain
ion of the shorelines, and (B) with position of the shorelines at ∼30 Ma (Rosenbaumaly at each model depth to the surface and shifting their location to the east by ame at 70 km the anomaly can be projected to the surface directly). The projectedain the projection of the unfolded anomaly (red lines). The thick, dashed red linesrán domain at the time of subduction initiation (Platt et al., 2003) is shownwith tanand are not meant to represent paleo-positions of the trench. (For interpretation off this article.)

M.J. Bezada et al. / Earth and Planetary Science Letters 368 (2013) 51–60 59
and Houston, 1995; Hacker et al., 2003; Kiser et al., 2011). Upliftand gravitational collapse of the Alborán crust and its translationfollowing trench retreat would have driven emplacement of theBetic–Rif thrust belts, while subduction under the western Alboránmargin would have caused the calc-alkaline magmatism thatintruded the Alborán at this time (Duggen et al., 2004). In this,our model differs from the otherwise similar model of Faccennaet al. (2004). They interpret the absence of ophiolitic remains asevidence for a lack of oceanic subduction following the delamina-tion of the Alborán lower crust implying that delamination was thefinal stage in the process. In our view, it is difficult to account forthe ∼200 km of westward translation undergone by the Alboránafter the thermal event (Platt et al., 2003) as well as the calc-alkaline magmatism in the Alborán (Duggen et al., 2004) withoutsubduction of ocean lithosphere in the area over which theAlborán crust moved.
The current position of the slab beneath southern Spain (Fig. 4),and its location when restored to the surface (Fig. 8b), suggeststhat relative motion between Iberia and Africa (Dewey et al., 1989;Jolivet and Faccenna, 2000; Rosenbaum et al., 2002a, 2002b) wasaccommodated by an underthrusting of ocean lithosphere beneaththe Iberian margin.
Our model resembles the westward-directed rollback model ofSpakman and Wortel (2004). The main difference lies in the initiallocation of the Alborán domain and the nature of its interactionwith the retreating subduction zone. In our interpretation theAlborán lower lithosphere is a part of the subducted slab.
5. Conclusions
We image the western Mediterranean upper mantle withimproved resolution through the use of a large teleseismic dataset,a crustal velocity structure derived from surface wave modeling(Palomeras et al., in preparation) iterative 3-D ray tracing andfinite-frequency kernels. Our main conclusions are:
1.
The dominant upper mantle feature is the 4–5% high-velocity,slab-like structure shown in Fig. 4. This structure is connectedto the surface and extends to the bottom of the transition zone.2.
Its form, when restored to the surface, fills the area occupied bythe Alpine Tethys ocean lithosphere and embedded continentalAlborán domain at 30 Ma (Fig. 8b).3.
We interpret the high-velocity structure as a slab of lithospherecomposed of subducted Alborán mantle lithosphere and thesurrounding Alpine Tethys ocean lithosphere.4.
This lithosphere is thought to have been subducted during∼30 m.y. of generally west-directed subduction rollback, whichcontinued beneath the Alborán domain by delaminating itsmantle lithosphere.5.
A more drip-like delamination of the Middle Atlas mantlelithosphere may be evidenced by the irregular but pronouncedzone of low velocities beneath these mountains at 50–125 kmdepth and an underlying high-velocity body at ∼400–500 kmdepth.Acknowledgments
We thank Claudio Faccenna and Wim Spakman for thoughtfuland insightful reviews that helped improve the manuscript.Our understanding of the westernmost Mediterranean has greatlybenefited from many conversations with John Platt. This workis funded by the PICASSO project (NSF grant EAR-0808939),The deployment and data processing for Spanish stations wasfunded by Consolider-Ingenio 2010 project TOPO-IBERIA
(CSD2006-00041) as well as ALERT-ES (CGL2010-19803-C03-02).We thank Ingo Grevemeyer for access to data from the TOPO-MEDOBS deployment as wells as Christine Thomas and James Wookeyfor access to data from Münster and Bristol stations in westernMorocco.
Appendix A. Supporting information
Supplementary data associated with this article can be found inthe online version at http://dx.doi.org/10.1016/j.epsl.2013.02.024.
References
Azañón, J.-M., Crespo-Blanc, A., 2000. Exhumation during a continental collisioninferred from the tectonometamorphic evolution of the Alpujarride Complex inthe central Betics (Alboran Domain, SE Spain). Tectonics 19, 549–565.
Bezada, M.J., Humphreys, E.D., 2012. Contrasting rupture processes during the April11, 2010 deep-focus earthquake beneath Granada, Spain. Earth Planet. Sci. Lett.353–354, 38–46.
Bialas, R.W., Funiciello, F., Faccenna, C., 2011. Subduction and exhumation ofcontinental crust: insights from laboratory models. Geophys. J. Int. 184, 43–64.
Bijwaard, H., Spakman, W., 2000. Non-linear global P-wave tomography by iteratedlinearized inversion. Geophys. J. Int. 141, 71–82.
Blanco, M., Spakman, W., 1993. The P-wave velocity structure of the mantle belowthe Iberian Peninsula—evidence for subducted lithosphere below southernSpain. Tectonophysics 221, 13–34.
Bokelmann, G., Maufroy, E., 2007. Mantle structure under Gibraltar constrained bydispersion of body waves. Geophys. Res. Lett. 34, L22305.
Bokelmann, G., Maufroy, E., Buontempo, L., Morales, J., Barruol, G., 2011. Testingoceanic subduction and convective removal models for the Gibraltar arc:seismological constraints from dispersion and anisotropy. Tectonophysics502, 28–37.
Brun, J.-P., Faccenna, C., 2008. Exhumation of high-pressure rocks driven by slabrollback. Earth Planet. Sci. Lett. 272, 1–7.
Buforn, E., Bezzeghoud, M., Udias, A., Pro, C., 2004. Seismic sources on the Iberia–African plate boundary and their tectonic implications. Pure Appl. Geophys.161, 623–646.
Buforn, E., Pro, C., Cesca, S., Udias, A., Del Fresno, C., 2011. The 2010 Granada, Spain,deep earthquake. Bull. Seismol. Soc. Am. 101, 2418–2430.
Calvert, A., Sandvol, E., Seber, D., Barazangi, M., Roecker, S., Mourabit, T., Vidal, F.,Alguacil, G., Jabour, N., 2000. Geodynamic evolution of the lithosphere andupper mantle beneath the Alboran region of the western Mediterranean:constraints from travel time tomography. J. Geophys. Res. 105, 898.
Dahlen, F.A., Hung, S.H., Nolet, G., 2000. Frechet kernels for finite-frequencytraveltimes; I, Theory. Geophys. J. Int. 141, 157–174.
Dewey, J.F., Helman, M.L., Knott, S.D., Turco, E., Hutton, D.H.W., 1989. Kinematics ofthe Western Mediterranean. Geological Society, London, Special Publications45, pp. 265–283.
Diaz, J., Gallart, J., Villasenor, A., Mancilla, F., Pazos, A., Cordoba, D., Pulgar, J.A.,Ibarra, P., Harnafi, M., 2010. Mantle dynamics beneath the Gibraltar Arc(western Mediterranean) from shear-wave splitting measurements on a denseseismic array. Geophys. Res. Lett. 37, L18304.
Docherty, C., Banda, E., 1995. Evidence for the eastward migration of the AlboranSea based on regional subsidence analysis: a case for basin formation bydelamination of the subcrustal lithosphere? Tectonics 14, 804–818.
Duggen, S., Hoernle, K., Van den Bogaard, P., Harris, C., 2004. Magmatic evolution ofthe Alboran region: the role of subduction in forming the western Mediterra-nean and causing the Messinian Salinity Crisis. Earth Planet. Sci. Lett. 218,91–108.
Faccenna, C., Piromallo, C., Crespo-Blanc, A., Jolivet, L., Rossetti, F., 2004. Lateral slabdeformation and the origin of the western Mediterranean arcs. Tectonics 23,TC1012.
Forsyth, D.W., Li, A., 2005. Array analysis of two-dimensional variations in surfacewave phase velocity and azimuthal anisotropy in the presence of multipathinginterference. Geophysical Monograph Series 157, pp. 81–97.
Funiciello, F., Faccenna, C., Giardini, D., Regenauer-Lieb, K., 2003. Dynamics ofretreating slabs: 2. Insights from three-dimensional laboratory experiments. J.Geophys. Res.: Solid Earth 108, 2207.
Garcia-Castellanos, D., Villasenor, A., 2011. Messinian salinity crisis regulated bycompeting tectonics and erosion at the Gibraltar arc. Nature 480 359–U108.
Gorbatov, A., Kostoglodov, V., 1997. Maximum depth of seismicity and thermalparameter of the subducting slab: general empirical relation and its application.Tectonophysics 277, 165–187.
Green, H., Houston, H., 1995. The mechanics of deep earthquakes. Annu. Rev. EarthPlanet. Sci. 23, 169–213.
Gutscher, M.A., Malod, J., Rehault, J.P., Contrucci, I., Klingelhoefer, F., Mendes-Victor, L.,Spakman, W., 2002. Evidence for active subduction beneath Gibraltar. Geology 30,1071–1074.

M.J. Bezada et al. / Earth and Planetary Science Letters 368 (2013) 51–6060
Hacker, B.R., Peacock, S.M., Abers, G.A., Holloway, S.D., 2003. Subduction factory 2.Are intermediate-depth earthquakes in subducting slabs linked to meta-morphic dehydration reactions? Journal of Geophysical Research: Solid Earth108, n/a–n/a.
Hammond, W.C., Toomey, D.R., 2003. Seismic velocity anisotropy and heterogeneitybeneath the Mantle Electromagnetic and Tomography Experiment (MELT)region of the East Pacific Rise from analysis of P and S body waves. J. Geophys.Res.-Solid Earth 108.
Houseman, G., 1996. From mountains to basin. Published online: 29 February 1996;http://dx.doi.org/10.1038/379771a0379, pp. 771–772.
Jolivet, L., Faccenna, C., 2000. Mediterranean extension and the Africa–Eurasiacollision. Tectonics 19, 1095–1106.
Kennett, B.L.N., Engdahl, E.R., Buland, R., 1995. Constraints on seismic velocities inthe Earth from traveltimes. Geophys. J. Int. 122, 108–124.
Kiser, E., Ishii, M., Langmuir, C.H., Shearer, P.M., Hirose, H., 2011. Insights into themechanism of intermediate-depth earthquakes from source properties asimaged by back projection of multiple seismic phases. J. Geophys. Res. 116,B06310.
Lonergan, L., White, N., 1997. Origin of the Betic–Rif mountain belt. Tectonics 16,504–522.
Malinverno, A., Ryan, W.B.F., 1986. Extension in the Tyrrhenian Sea and shorteningin the Apennines as result of arc migration driven by sinking of the lithosphere.Tectonics 5, 227–245.
Palomeras, I., Levander, A., Liu, K., Thurner, S. Finite-Frequency Rayleigh WaveTomography of the Western Mediterranean, in preparation.
Papazachos, C., Nolet, G., 1997. P and S deep velocity structure of the Hellenic areaobtained by robust nonlinear inversion of travel times. J. Geophys. Res.-SolidEarth 102, 8349–8367.
Piromallo, C., Morelli, A., 2003. P wave tomography of the mantle under the Alpine–Mediterranean area. J. Geophys. Res. 108, 2065.
Platt, J., Houseman, G., 2003. Evidence for active subduction beneath Gibraltar:comment and reply. COMMENT. Geology 31, e22–e22.
Platt, J., Vissers, R., 1989. Extensional collapse of thickened continental lithosphere—aworking hypothesis for the Alboran Sea and Gibraltar Arc. Geology 17, 540–543.
Platt, J.P., Allerton, S., Kirker, A., Mandeville, C., Mayfield, A., Platzman, E.S., Rimi, A.,2003. The ultimate arc: differential displacement, oroclinal bending, andvertical axis rotation in the External Betic–Rif arc. Tectonics 22, 1017.
Platt, J.P., Behr, W.M., Johanesen, K., Williams, J.R., 2013. The Betic–Rif arc and itsorogenic hinterland: a review. Annu. Rev. Earth Planet. Sci., 41, 1, http://dx.doi.org/10.1146/annurev-earth-050212-123951.
Platt, J.P., Kelley, S.P., Carter, A., Orozco, M., 2005. Timing of tectonic events in theAlpujárride Complex, Betic Cordillera, southern Spain. J. Geol. Soc. London 162,451–462.
Platt, J.P., Soto, J.I., Whitehouse, M.J., Hurford, A.J., Kelley, S.P., 1998. Thermalevolution, rate of exhumation, and tectonic significance of metamorphic rocksfrom the floor of the Alboran extensional basin, western Mediterranean.Tectonics 17, 671–689.
Platt, J.P., Whitehouse, M.J., 1999. Early Miocene high-temperature metamorphismand rapid exhumation in the Betic Cordillera (Spain): evidence from U–Pbzircon ages. Earth Planet. Sci. Lett. 171, 591–605.
Rosenbaum, G., Lister, G.S., 2004. Neogene and Quaternary rollback evolution of theTyrrhenian Sea, the Apennines, and the Sicilian Maghrebides. Tectonics 23,TC1013.
Rosenbaum, G., Lister, G.S., Duboz, C., 2002a. Relative motions of Africa, Iberia andEurope during Alpine orogeny. Tectonophysics 359, 117–129.
Rosenbaum, G., Lister, G.S., Duboz, C., 2002b. Reconstruction of the tectonicevolution of the western Mediterranean since the Oligocene. J. Virtual Explorer8, 6, http://dx.doi.org/10.3809/jvirtex.2002.00053.
Royden, L., 1993. Evolution of retreating subduction boundaries formed duringcontinental collision. Tectonics 12, 629–638.
Sambridge, M., 1990. Nonlinear arrival time inversion—constraining velocityanomalies by seeking smooth models in 3-D. Geophys. J. Int. 102, 653–677.
Schellart, W.P., Freeman, J., Stegman, D.R., Moresi, L., May, D., 2007. Evolution anddiversity of subduction zones controlled by slab width. Nature 446, 308–311.
Schmandt, B., Humphreys, E., 2010. Seismic heterogeneity and small-scale convec-tion in the southern California upper mantle. Geochem. Geophys. Geosyst 11,Q05004.
Seber, D., Barazangi, M., Ibenbrahim, A., Demnati, A., 1996. Geophysical evidence forlithospheric delamination beneath the Alboran Sea and Rif–Betic mountains.Nature 379, 785–790.
Spakman, W., Wortel, R., 2004. A tomographic view on Western Mediterraneangeodynamics. The TRANSMED Atlas: The Mediterranean Region from Crust toMantle, pp. 31–52.
Toomey, D., Solomon, S., Purdy, G., 1994. Tomographic imaging of the shallowcrustal structure of the East Pacific rise at 9-Degrees-30′n. J. Geophys. Res.-SolidEarth 99, 24135–24157.
Tromp, J., Tape, C., Liu, Q., 2005. Seismic tomography, adjoint methods, timereversal and banana-doughnut kernels. Geophys. J. Int. 160, 195–216.
Zeck, H.P., 1996. Betic–Rif orogeny: subduction of Mesozoic Tethys lithosphereunder eastward drifting Iberia, slab detachment shortly before 22 Ma, andsubsequent uplift and extensional tectonics. Tectonophysics 254, 1–16.
Zhao, D., Hasegawa, A., Horiuchi, S., 1992. Tomographic imaging of P-wave and S-wave velocity structure beneath Northeastern Japan. J. Geophys. Res.-SolidEarth 97, 19909–19928.