earth and planetary science - rosenstiel school of marine ... · pdf fileearth and planetary...
TRANSCRIPT
Earth and Planetary Science Letters 462 (2017) 169–179
Contents lists available at ScienceDirect
Earth and Planetary Science Letters
www.elsevier.com/locate/epsl
Seismicity patterns during a period of inflation at Sierra Negra
volcano, Galápagos Ocean Island Chain
Lindsey Davidge a, Cynthia Ebinger a,∗, Mario Ruiz b, Gabrielle Tepp c, Falk Amelung d, Dennis Geist e, Dustin Coté a, Juan Anzieta b
a Earth & Environmental Sciences, University of Rochester, Rochester, New York, United Statesb Instituto Geofísico Escuela Politécnica Nacional, Quito, Ecuadorc Department of Physics and Astronomy, University of Rochester, Rochester, New York, United Statesd Rosenstiel School of Marine and Atmospheric Sciences, Miami, Florida, United Statese University of Idaho, Moscow, Idaho, United States
a r t i c l e i n f o a b s t r a c t
Article history:Received 6 September 2016Received in revised form 16 December 2016Accepted 17 December 2016Available online 20 January 2017Editor: P. Shearer
Keywords:ocean island volcanoseismicityGalapagos
Basaltic shield volcanoes of the western Galápagos islands are among the most rapidly deforming volcanoes worldwide, but little was known of the internal structure and brittle deformation processes accompanying inflation and deflation cycles. A 15-station broadband seismic array was deployed on and surrounding Sierra Negra volcano, Galápagos from July 2009 through June 2011 to characterize seismic strain patterns during an inter-eruption inflation period and to evaluate single and layered magma chamber models for ocean island volcanoes. We compare precise earthquake locations determined from a 3D velocity model and from a double difference cluster method. Using first-motion of P-arrivals, we determine focal mechanisms for 8 of the largest earthquakes (ML ≤ 1.5) located within the array. Most of the 2382 earthquakes detected by the array occurred beneath the broad (∼9 km-wide) Sierra Negra caldera, at depths from surface to about 8 km below sea level. Although outside our array, frequent and larger magnitude (ML ≤ 3.4) earthquakes occurred at Alcedo and Fernandina volcano, and in a spatial cluster beneath the shallow marine platform between Fernandina and Sierra Negra volcanoes. The time–space relations and focal mechanism solutions from a 4-day long period of intense seismicity June 4–9, 2010 along the southeastern flank of Sierra Negra suggests that the upward-migrating earthquake swarm occurred during a small volume intrusion at depths 5–8 km subsurface, but there was no detectable signal in InSAR data to further constrain geometry and volume. Focal mechanisms of earthquakes beneath the steep intra-caldera faults and along the ring fault system are reverse and strike-slip. These new seismicity data integrated with tomographic, geodetic, and petrological models indicate a stratified magmatic plumbing system: a shallow sill beneath the large caldera that is supplied by magma from a large volume deeper feeding system. The large amplitude inter-eruption inflation of the shallow sill beneath the Sierra Negra caldera is accompanied by only very small magnitude earthquakes, although historical records indicate that larger magnitude earthquakes (Mw <6) occur during eruptions, trapdoor faulting episodes without eruptions, and large volume flank intrusions.
© 2016 Elsevier B.V. All rights reserved.
1. Introduction
Movement of oceanic plates over anomalously hot, upwelling mantle produces chains of volcanoes, as in Hawaii or the Galápa-gos. The upwelling mantle produces basaltic magmas, which are stored in crustal chambers, retained as cumulates, and intruded as dikes and sills, thickening the crust (e.g., Coffin and Eldholm, 1994;Lyons et al., 2007). The state of stress within the volcanoes is
* Corresponding author.E-mail address: [email protected] (C. Ebinger).
mostly controlled by magma replenishment and discharge from crustal reservoirs, gas exsolution, caldera formation, and edifice construction (e.g., Pinel and Jaupart, 2003; Gregg et al., 2012;Corbi et al., 2015). The spatial distribution and focal mechanisms of earthquakes provide constraints on state of stress in space and time, and geodetic methods detect pressure changes caused by gas exsolution or magma chamber discharge or replenishment (e.g., Amelung et al., 2000; Bagnardi and Amelung, 2012).
The 7 active volcanoes in the western Galápagos have pro-nounced surface deformation patterns, providing an opportunity to probe ocean island formation (Fig. 1). Each volcano has a wide
http://dx.doi.org/10.1016/j.epsl.2016.12.0210012-821X/© 2016 Elsevier B.V. All rights reserved.

170 L. Davidge et al. / Earth and Planetary Science Letters 462 (2017) 169–179
Fig. 1. Seismicity of Isabela Island with respect to the Galapagos archipelago, and the Galapagos spreading center between the Nazca and Cocos oceanic plates. PA is Puerto Ayora, the location of Global Seismic Network station PAYG. Global Centroid Moment Tensors spanning 1976 to June 2016 shown in red and scaled to mag-nitude (Ekstrom et al., 2012). The magnitude range is 4.5 to 5.9. Circles indicate earthquakes from the NEIC catalogue, with depths as indicated.
(∼9 km), deep (ca. 1 km) summit caldera. The flanks also deform: over 6 m of rapid uplift occurred along the western flank of Dar-win volcano in 1954, exposing several square kilometers of the seafloor of Urvina Bay and stranding corals, sharks, and other ma-rine life (Colgan and Malmquist, 1987). A similar event occurred on Fernandina’s northeast side in 1927 (e.g. Poland, 2014). More than 5 m of subsidence occurred within a period of hours dur-ing the 2005 Sierra Negra eruption, during which 150 × 106 m3
of basalt was erupted (Geist et al., 2008). The surface deforma-tion is attributed to magma intrusion, circumferential and unusual intra-caldera faulting, as well as dike intrusion (e.g., Amelung et al., 2000; Geist et al., 2006, 2008; Chadwick et al., 2006, 2011; Bagnardi and Amelung, 2012; Poland, 2014).
Despite these strong geodetic signals and potential for mod-erate magnitude earthquakes, little was known of the spatial or temporal distribution of seismicity associated with the rapid ver-tical deformation cycles on the Galápagos island volcanoes. The Sierra Negra Integrated Geophysical NETwork (SIGNET) array was deployed around Sierra Negra and Cerro Azul volcanoes, which form southern Isabela Island, between July 2009 and June 2011 (Fig. 2). Sierra Negra and Cerro Azul are two of the most ac-tive volcanoes in the Galápagos, with recent eruptions in 2005 and 2008, respectively. Using the SIGNET array and the perma-nent Global Seismic Network station PAYG on nearby Santa Cruz Island, we locate 2382 local earthquakes recorded on 3 or more temporary broadband seismic stations using absolute and double-difference algorithms. Our aim is to map the distribution of brittle strain within Sierra Negra volcano and the surrounding ocean is-land platform, and to provide new constraints on the geometry of magma reservoirs and conduits to the surface. Our analyses en-able us to evaluate the kinematics of faulting within the caldera, along the ring fault system, and the flanks of the rapidly deform-ing volcano. We compare earthquake locations from an absolute location algorithm, body wave tomography (Tepp et al., 2014), and double-difference methods, and we determine focal mechanisms of the largest earthquakes located within the network. Our results are used to inform the volcanic hazards monitoring program for the Galápagos Islands.
2. Background
Located on the eastward-moving Nazca plate ca. 1000 km west of continental Ecuador, the westward-younging Galápagos archipelago is marked by a chain of active and extinct volca-noes formed from repeated eruptions and intrusions of basaltic magma above the Galápagos hotspot (Fig. 1). Plume interactions with the nearby Galápagos spreading ridge to the north compli-cate the simple east-to-west younging pattern, locally imposing a NE–SW directed minimum stress direction, and explaining the NW-oriented volcanic ridges in the northern (near-ridge) sector
Fig. 2. Active volcanoes of the western Galapagos Archipelago, and the SIGNET broadband seismic array deployed on southern Isabela Island between July 2009 and June 2011, and GSN station PAYG on Isla Santa Cruz. See box in Fig. 1 for regional location.

L. Davidge et al. / Earth and Planetary Science Letters 462 (2017) 169–179 171
of the archipelago (Mittelstaedt and Ito, 2005; Harpp and Geist, 2002). The J-shaped Isabela Island comprises 6 active shield volca-noes, while Fernandina Island is a single shield volcano (Figs. 1, 2).
Receiver function and tomography studies reveal a thinned mantle transition zone beneath the western Galápagos Archipelago (Hooft et al., 2003), consistent with a mantle plume upwelling be-neath Fernandina volcano (e.g., Ito and Lin, 1995; Villagómez et al., 2014). Rayleigh wave tomography and receiver function studies of the Galápagos Archipelago reveal anomalously low-velocity upper mantle between 75 and 150 km, overlain by a variable-thickness high-velocity lid (Villagómez et al., 2007; Rychert et al., 2014). The lid is ∼30 km thicker beneath Isabela and Fernandina Islands than beneath the eastern part of the archipelago (Villagómez et al., 2007; Rychert et al., 2014). Fernandina, in particular, erupts basalts with anomalously high 3He/4He, which has been inter-preted as contributions from a deep mantle source (e.g., Graham et al., 1993; Kurz and Geist, 1999). SKS-splitting patterns show small amounts of anisotropy in directions sub-parallel to fissures on Isabela Island, suggesting that flow is either sub-vertical, or that anisotropy accrued from different depths has different azimuths (Fontaine et al., 2005).
Crustal thickness beneath the Galápagos is loosely constrained by a WSW-striking seismic refraction profile south of Isabela Island (Toomey et al., 2001), ambient noise tomography from a widely-spaced array (Villagómez et al., 2011), body-wave tomography from the SIGNET array (Tepp et al., 2014), gravity studies (Feighner and Richards, 1994), and receiver function studies (Rychert et al., 2014). Crustal thickness increases sharply from ∼8 km west of the platform, to more than 15 km on the platform (Villagómez et al., 2011; Rychert et al., 2014; Tepp et al., 2014). Crustal veloc-ities are ∼10% lower in the volcanically active western sector of the archipelago, as compared to its older, largely inactive eastern portion (Villagómez et al., 2011). Body-wave tomography from the SIGNET array reveals a broad low-velocity region (>25 km-wide) below Sierra Negra at depths ∼8–15 km interpreted as a volumet-rically large crystal-mush zone (Tepp et al., 2014). Tomography, re-ceiver function, and petrological results are consistent with crustal growth by accretion of mafic cumulates and eruption of evolved basalts (Reynolds and Geist, 1995; Tepp et al., 2014).
The shallow crustal structure of Sierra Negra largely is con-strained by models of surface deformation. Models of surface de-formation during and after the 2007 eruption are best fit with a flat-topped inflating body with top at ∼2 km subsurface, assumed to be a melt-rich sill (Yun et al., 2006, 2007). The geometry of the bottom of the sill(s) is poorly constrained by surface deformation patterns (Yun et al., 2007). The 3D attenuation model of Rodd et al. (2016) reveals patchy, highly attenuating zones between 0.5 km −3 km below sea level, interpreted as shallow magma bodies. The zone between the shallow sill and the deeper crystal mush zone remained poorly determined.
Most of the active volcanoes forming Isabela and Fernandina islands have wide, deep summit calderas (Fig. 2). Of Isabela’s volcanoes, the 60 km-long Sierra Negra volcano is the most vo-luminous and has the largest summit caldera with an area of 82 km2 (Reynolds et al., 1995). The caldera is surrounded by steep ring faults that may have accommodated magma cham-ber pressure changes in the past. Unusually, the ca. 9 km-wide caldera floor hosts a fault-bounded curvilinear ridge that has slipped during eruptions and during the inter-eruption cycle (e.g., Amelung et al., 2000; Jonsson et al., 2005; Chadwick et al., 2006;Yun et al., 2007) (Figs. 1, 2). Models of surface deformation and dip-slip displacements measured along fault surfaces indicate that the southern sector of the ridge accommodates inflation of a shal-low melt-rich sill in a trapdoor fashion (Amelung et al., 2000; Jonsson et al., 2005; Geist et al., 2008). Two trapdoor events oc-curred in 2005, with the second accompanied by a major eruption
along the northern caldera margin, which functioned as a leaky hinge zone (Chadwick et al., 2006; Geist et al., 2008, 2014). A mag-nitude 4.5 earthquake occurred during the first event (April, 2005; Chadwick et al., 2006), and mb 4.6 and Mw 5.5 events occurred prior to and during the eruption and trapdoor event (October, 2005; Geist et al., 2008). The source mechanism of the largest earthquake that occurred 3 hours before the effusive eruption had a vertical T-axis, and may have been associated with the faulting episode (Shuler et al., 2013).
Although seismometers have been deployed temporarily on some of the Galápagos islands, station spacing generally has been too wide, or data recovery too poor, to locate all but the largest events (Fig. 1). The NEIC catalogue of teleseismic and some lo-cal earthquakes shows moderate levels of seismicity within and around the Galápagos archipelago (M <6) and 91◦W transform fault. The proximity of volcanoes and the ∼30 km location ac-curacy of the global seismic network, however, makes it diffi-cult to correlate teleseisms with specific volcanoes, or to detect activity prior to or during eruptions (e.g., Filson et al., 1973;Fox et al., 2001) (Fig. 1). Global Centroid Moment Tensor (GCMT) solutions show a wide range of fault slip behaviors, including strike-slip mechanisms and E–W to NW–SE compression with a significant component of non double-couple deformation (Ekstrom et al., 2012).
Based on the orientation of aligned chains of eruptive centers on southern Isabela Island, Reynolds et al. (1995) suggest that the regional stress field is rotated from NE–SW to ENE–WSW, although the stress interactions between nearby volcanoes may be equally or more important (e.g., McGovern, 2007; Bagnardi and Amelung, 2012) (Fig. 2). The wide, deep caldera reduces the overburden above the magma chamber, promoting circumferen-tial diking around the caldera (e.g., Chestler and Grosfils, 2013;Corbi et al., 2015). The orientations and focal mechanisms pro-vide constraints on the interplay between these tectonic and body forces. The time–space distribution of earthquakes, as well as the surface deformation patterns, provide information on stress local-ization and kinematics needed to evaluate models of inter-eruption state-of-stress.
3. Data
A temporary, sparse IGEPN network (1999–2001) and our SIGNET seismic array (2009–2011) provide, for the first time, a baseline for monitoring Sierra Negra volcano, as well as activ-ity levels at Cerro Azul, Alcedo, and Fernandina volcanoes and the shallow platforms immediately outside our array. The SIGNET broadband seismic array was deployed around the coastline of southern Isabela Island through a collaboration between Instituto Geofísico Nacional Escuela Politécnica, University of Rochester, Uni-versity of Miami, the University of Idaho, and the Charles Darwin Foundation (Fig. 2). Ten IRIS-PASSCAL Guralp 3T, two Guralp 40T, and 1 University of Rochester Trillium 120 and 2 Trillium-Compact seismometers recorded local and teleseismic activity between Au-gust 3, 2009 and June 17, 2011. Data was recorded at 100 samples per second at GS08, GS14 and GS15, and 40 sps on the IRIS-PASSCAL stations.
4. Methods
4.1. Locations
P- and S-wave arrivals were hand-picked on Butterworth fil-tered vertical and transverse components, respectively, to produce a data base of 2382 events, with 13,188 P-wave phases and 7885 S-wave phases. Uncertainties in P-wave picks were estimated in 0.05 s intervals (e.g., 0.05 s, 0.1 s); uncertainties in S-wave picks were

172 L. Davidge et al. / Earth and Planetary Science Letters 462 (2017) 169–179
Fig. 3. Absolute earthquake locations with size scaled by magnitude, and color scaled by depth. The dashed line encloses the region with well-determined depths: earthquakes outside the dashed lines have large depth errors, or indeterminate depths (gray). Note the cluster of earthquakes on the shallow platform between Sierra Negra, Fernandina, and Alcedo volcanoes, and the persistent swarm in the shallow shelf between Sierra Negra and Fernandina volcanoes.
estimated in 0.1 s intervals. All events were initially located us-ing the absolute location program Hypoinverse2000 (Klein 2002). The program VELEST (Kissling et al., 1994) was used to invert si-multaneously for one-dimensional Vp and Vs assuming the initial starting velocity model of Toomey et al. (2001). This velocity model was developed using events with at least six recorded arrival times with <180◦ azimuthal gap, and was used with both the absolute and relative double-difference location methods, and as a start-ing model for the tomography. We estimate a Vp/Vs ratio for the crust of 1.8 using a Wadati diagram of all well-located arrivals from earthquakes within the array (Fig. SM1, Supplementary Material).
The double differencing relative earthquake algorithm HypoDDis used to relocate clusters of earthquakes (Waldhauser and Ellsworth, 2000). We use V2.1beta that allows for variations in the elevations of stations, enabling relocation of some earthquakes within the edifice. In this method, the observed minus predicted phase travel time differences between pairs of closely located earthquakes detected at common stations are related to the dif-ferences in the vector connecting their hypocenters. By effectively reducing seismic path length, location errors related to 3D ve-locity variations are minimized. The double-difference equations are used to linearize the earthquake location problem, effectively removing common mode errors, and reducing the effects of lo-cal velocity variations (Waldhauser and Ellsworth, 2000). While the double-difference method provides relative locations, iterative relative location solutions converge toward the absolute location (Waldhauser and Ellsworth, 2000). We use cross-correlation of waveforms to identify repeating earthquakes and to reduce loca-tion errors associated with arrival time picks in areas of clustered seismicity. Reported errors are estimated with singular-value de-composition.
4.2. Magnitudes
Local magnitudes (ML) for each earthquake were estimated by first measuring maximum zero-to-peak amplitude on simu-
lated N–S and E–W horizontal component Wood–Anderson dis-placement seismograms, after removal of instrument response. These measurements are used in conjunction with the computed hypocentral distance between the station and earthquake to esti-mate local magnitude (ML). We compute the magnitude at each horizontal component of each station discretely, and then use the average of these values as the overall earthquake magnitude. Earthquake magnitudes are estimated using a local magnitude scale and distance correction terms for incipient seafloor spread-ing zones where local attenuation is high (Keir et al., 2006), in the absence of a local magnitude scaling relation. This scaling is con-sistent with the high P-wave attenuation at depths of 0.5–8.5 km below sea level estimated by the attenuation tomography model of Rodd et al. (2016). A site-specific magnitude scale awaits a time series that spans an eruption cycle.
4.3. Focal mechanisms
The small magnitude of earthquakes recorded during the SIGNET deployment precludes waveform modeling, and we assume a double-couple solution. This may be an over-simplification based on earlier studies of teleseismic events associated with eruptive ac-tivity (e.g., Shuler et al., 2013). We use the first-motion modeling program FOCMEC, which finds the best-fitting strike, dip, and rake of 1 ≤ ML ≤ 4.6 earthquakes with standard errors (Snoke, 2003).
5. Results
5.1. Local magnitude and b-value
Magnitudes of earthquakes located within the array are all less than ML = 2.6 (Fig. 3, Fig. SM2). The b-value for the SIGNET database is estimated using the maximum-likelihood approach (Aki, 1965) (Fig. SM2). Based on the low-magnitude fall-off in the magnitude-frequency relation, the magnitude of completeness is ML = 1.1. The linear segment of the curve between 1.1 < ML < 1.6

L. Davidge et al. / Earth and Planetary Science Letters 462 (2017) 169–179 173
Fig. 4. Histogram of earthquake occurrence within the Isabela seismic array in days since August 1, 2009 (see Fig. SM7 for time histogram of Alcedo earthquakes). The two migrating swarms along the ring fault system (March 25, 2010, March 5, 2011), and the June 4–10, 2010 intrusion event on the SE flank of Sierra Negra dominate the background level of 5–10 earthquakes per day. Although some instruments had gaps in coverage, the array geometry was maintained throughout the experiment.
is fit with a b-value of 3.1, a very high value characteristic of earth-quakes around shallow magma chambers (e.g., Brandsdottir and Einarsson, 1979; Murru et al., 1999).
5.2. Absolute locations
Earthquakes recorded on 4 or more stations and with 6 or more P- and S-arrival time measurements are used for locations. Almost all of the 2382 earthquakes were volcano-tectonic events with im-pulsive P-arrivals, commonly indistinct S-arrivals, unusually long codas, and peak frequencies <10 Hz. No unusually low-frequency earthquakes were detected, although tremor was frequently de-tected at GS15 near the center of the 9-km-wide caldera. Wave noise at coastal stations complicates more rigorous analyses of spectral content. All depths we report are referenced to sea-level, rather than elevation. The mean depth of earthquakes within or near the array is 6.5 km, which places them within the upper oceanic crust and volcanic edifice where velocities are laterally variable (Tepp et al., 2014). The mean horizontal and vertical un-certainties are 1.98 and 2.19 km, respectively.
Earthquakes occurred throughout the Isabela Island region, with persistent spatial clusters around Sierra Negra and Alcedo calderas and on the shallow marine shelf between Fernandina and Sierra Negra volcanoes (Figs. 1, 3). Seismicity is largely restricted to the uppermost 2 km of Sierra Negra; depths of earthquakes on Al-cedo volcano and the shallow platform outside the array are not well constrained (Fig. 3). Cerro Azul volcano, which last erupted in May 2008, was largely inactive seismically during the 2009-11 period (Global Volcanism Program, 2008). The largest earthquakes occurred on Fernandina (ML ≤ 2.5) and Alcedo (ML ≤ 3.3), whereas the largest earthquakes on Sierra Negra were ML ≤ 1.5 (Fig. 3). An intense and persistent cluster of earthquakes occurred on the submarine southeastern flank of Fernandina volcano (Fig. 3). The subaerial southeastern flank of Fernandina was uplifted in 2007, and InSAR patterns were modeled as a sill intrusion sourced from a ca. 5 km bsl magma chamber (Bagnardi and Amelung, 2012). New seafloor imaging data reveal a zone of young submarine erup-tive centers about 3 km NW of the earthquake cluster (Soule et al., 2016). Given location errors of these events outside our array, they could be coincident with the young cones.
Sierra Negra seismicity is localized to the caldera region (Fig. 3). There is no clear correlation of seismicity and the circumferen-
Table 1Earthquake focal mechanism results. Depths below sealevel are from 3D velocity model. Solutions vary by <20◦ in strike, dip and rake; ∗ indicates results with nodal plane 1 fits to ±25◦ for strike, dip, rake.
Date Longitude Latitude Depth Strike Dip Rake ML
∗01/10/10, 16:49 −91.1653 −0.8217 1.5 301 51 77 1.1∗01/11/10, 06:10 −91.1618 −0.8100 0.3 44 52 71 1.002/13/10, 11:01 −91.0973 −0.8065 1.3 332 80 17 0.906/04/10, 13:37 −91.0410 −0.8930 5.7 13 54 56 1.206/04/10, 16:23 −91.0448 −0.8910 6.1 11 53 65 1.508/17/10, 23:03 −91.1550 −0.8147 0.2 51 80 39 1.108/24/10, 10:51 −91.4400 −0.7243 13.6 340 46 −54 1.112/11/10, 14:06 −90.9365 −0.7868 5.0 141 48 −63 0.9
tial and radial eruptive vents, except along the E–W striking chain east of the caldera (Figs. 3, 4). Several hundred ML ≤ 1.4 earth-quakes occurred on the southern flank of Sierra Negra between 4 and 10 June 2010; this swarm is analyzed in more detail below (Fig. 3). Two other hours-long migrating swarms initiated beneath the northern side of the caldera on March 25, 2014 and March 5, 2011 (Fig. 4). The histogram of time variations in seismicity shows no increase in seismicity during the El Niño in early 2011 when heavy rainfall occurred in normally arid areas.
Earthquakes near the edge of the network and shallow earth-quakes with only 6 phase readings have the largest errors. Owing to the shallow depths and clustered nature of the earthquakes, we use the double-difference algorithm to refine locations for earth-quakes along the caldera ring fault system during the June 2010 swarm locations.
5.3. Fault kinematics
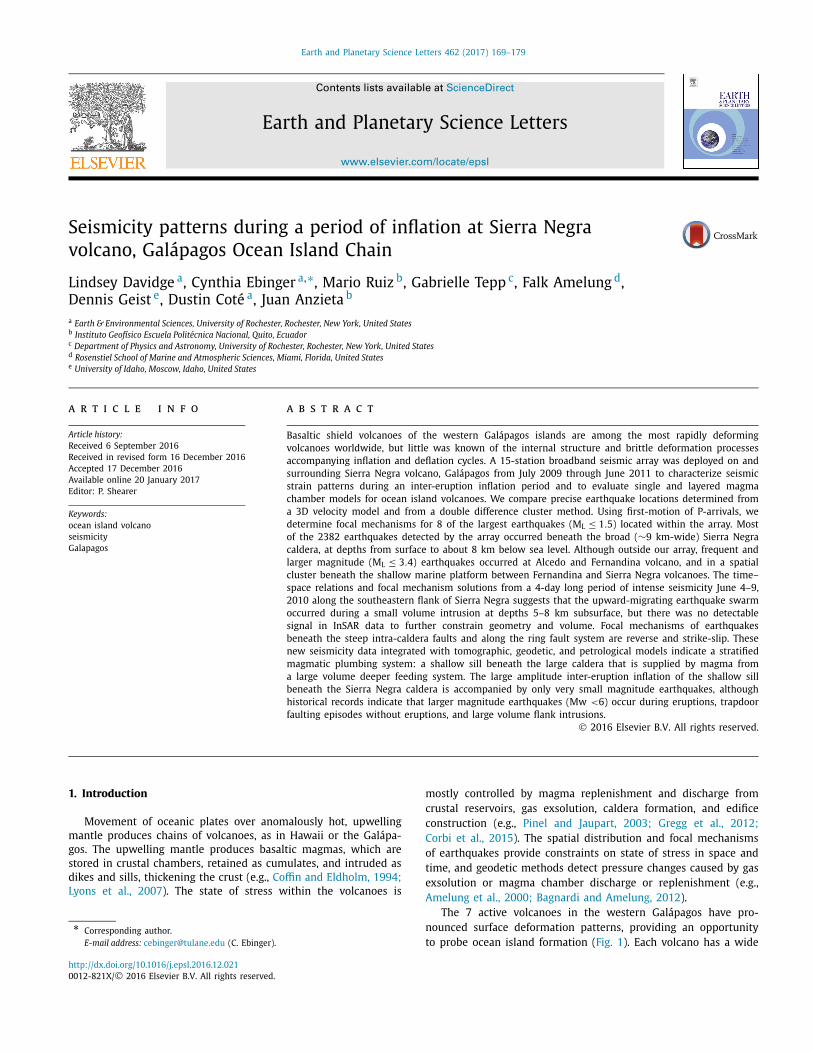
Earthquakes with clear P-arrivals on 7 or more stations and with good azimuthal distribution were screened for focal mech-anisms. Of the 18 earthquakes considered, 6 had azimuthal gaps < 120◦ and strike, dip and rake of the slip plane constrained to ±10◦ , with no phase errors (Table 1, Fig. 5, Fig. SM3). Two addi-tional events had strike, dip and rake of the slip plane constrained to ±25◦ . The resulting focal mechanisms show a wide range of solutions: reverse or oblique-reverse (4), strike-slip (2), and nor-mal (2). The 4 focal mechanisms of earthquakes beneath the sin-uous ridge have steep (51◦–80◦) nodal planes. The reverse fault planes indicate a compressional state within the uppermost 3 km
174 L. Davidge et al. / Earth and Planetary Science Letters 462 (2017) 169–179
Fig. 5. Eruptive vents and cones (stars) and focal mechanisms of earthquakes detected by the SIGNET array overlain on SRTM-30 digital elevation model of Sierra Negra and Cerro Azul volcanoes forming southern Isla Isabela in the western Galapagos Archipelago. Locations of eruptive vents, cones, and fissures mapped from Google Earth imagery, calibrated by maps of Reynolds et al. (1995). Cloud cover obscured a few areas on Cerro Azul volcano. A–A′ is line of cross-section shown in Fig. 9.
bsl beneath the caldera during the inter-seismic cycle (Table 1). Given the complexity of the sinuous ridge structure, we cannot dis-tinguish between inward and outward-dipping reverse faults from the distribution and mechanisms of earthquakes alone. These focal mechanisms, however, provide information on deformation along the hinge zone for the ∼E–W trending trapdoor fault. The February 13, 2010 strike-slip mechanisms occurred beneath the ring fault system, whereas the August 17, 2010 earthquake may have oc-curred along faults of the sinuous ridge or the nearby ring fault system. The two reverse mechanisms on the southeastern flank occurred during the June 2010 swarm, and the mechanisms are nearly identical.
5.4. Double difference analyses
We use the GISMO suite of Reyes and West (2011) to calcu-late the lag matrix needed to match both P- and S-wave arrival times. Correlation coefficients were determined for all selected waveforms and used to assign uncertainty values to the lag matrix, which contains the shift factor given to each adjusted waveform. The time window was varied to ensure that surface waves were excluded from the time window. Additionally, ocean wave micro-seismicity proved one of the biggest challenges to analyses, leading to variable station coverage in the correlated pairs. The maximum separation between hypocenters of linked events was set at 8 km to maximize the number of highly correlated pairs. The average offset between linked events was 2.21 km, with a maximum off-set of 7.96 km. Cross-correlation shift factors were applied for all linked events with a correlation coefficient higher than 0.6 (1289 events); 554 of those linked events were observed by correlated waveforms from 5 or more stations. We input 77935 total P-phase pairs and 49240 S-phase pairs, with the remaining 4845 phase pairs considered as outliers, based upon the conditions defined above.
We used both cross-correlation and catalogue differential travel times with equal weightings to iteratively solve for the caldera and flank cluster event locations. After testing, we chose a damping factor of 60 for the first 10 iterations, and a damping factor of 50 for the last ten iterations. For the caldera swarm, 73381 differ-ential times were used with 406 caldera earthquakes to relocate a cluster of 171 events. The average offset between linked events was 2.21 km. Inclusion of station elevations enables detection of some shallow earthquakes, but almost 70% of the P and S arrivals were rejected as ‘airquakes’, owing to complexity of ray tracing from stations at or near sealevel into the volcanic edifice with its
heterogeneous shallow velocity structure (e.g., Tepp et al., 2014;Rodd et al., 2016).
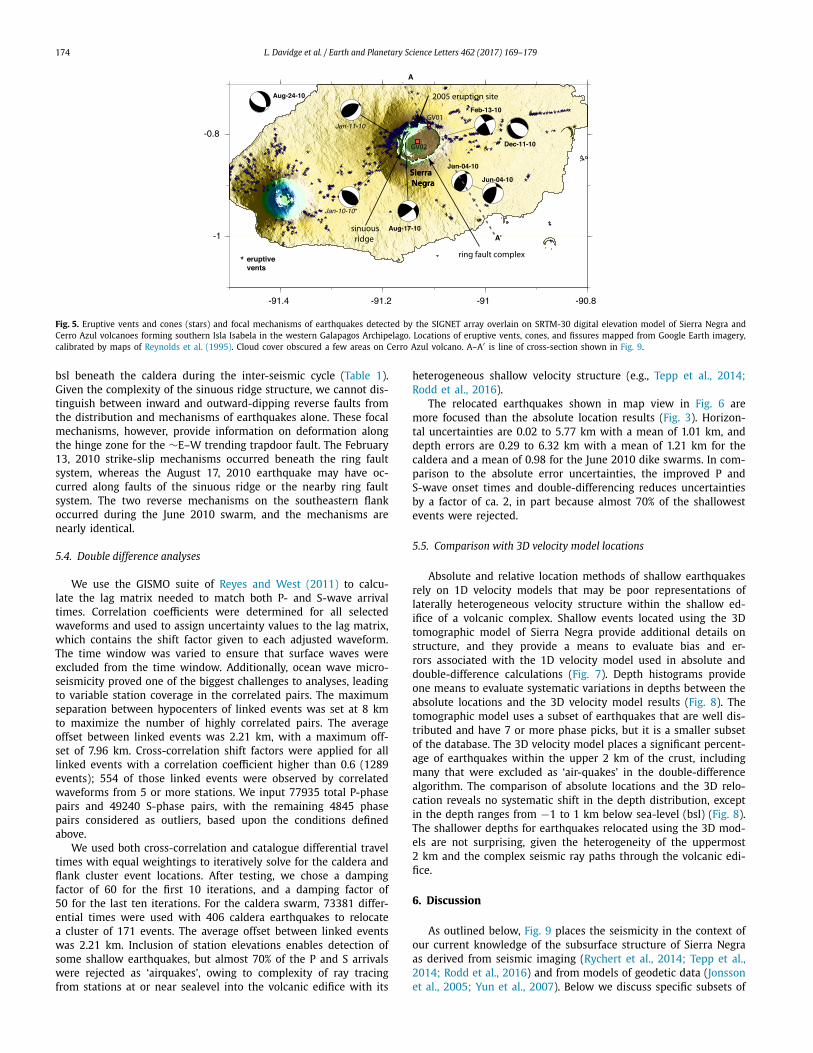
The relocated earthquakes shown in map view in Fig. 6 are more focused than the absolute location results (Fig. 3). Horizon-tal uncertainties are 0.02 to 5.77 km with a mean of 1.01 km, and depth errors are 0.29 to 6.32 km with a mean of 1.21 km for the caldera and a mean of 0.98 for the June 2010 dike swarms. In com-parison to the absolute error uncertainties, the improved P and S-wave onset times and double-differencing reduces uncertainties by a factor of ca. 2, in part because almost 70% of the shallowest events were rejected.
5.5. Comparison with 3D velocity model locations
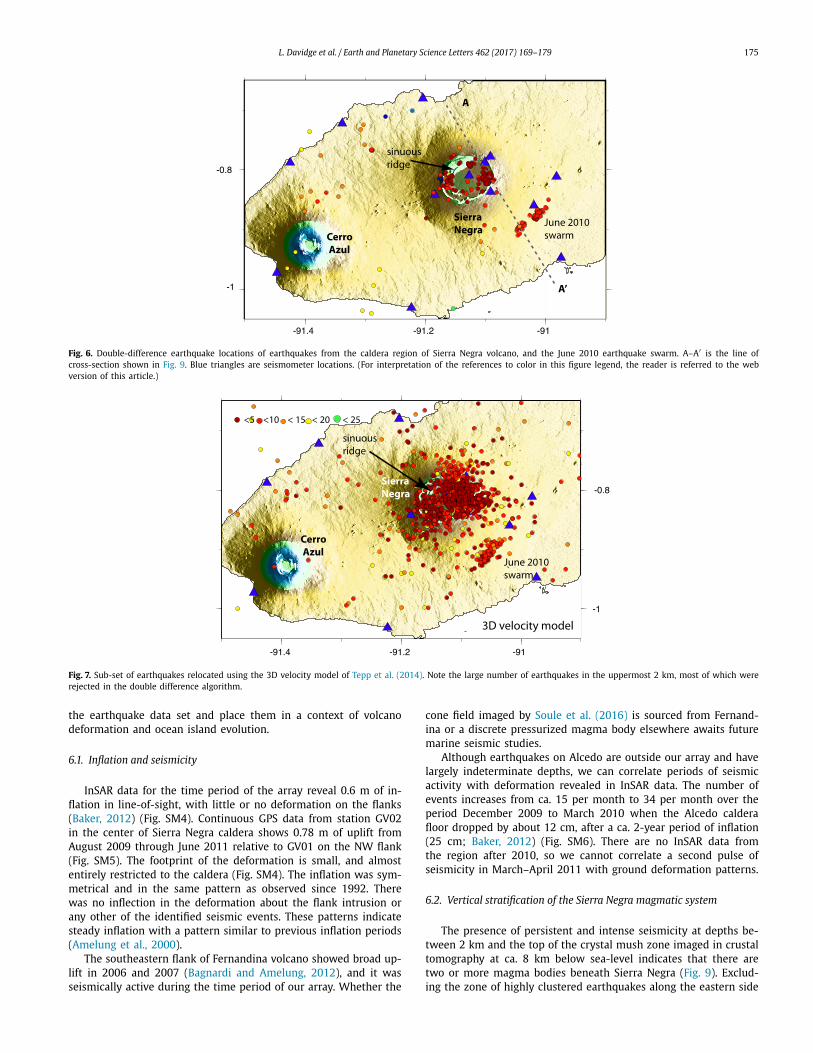
Absolute and relative location methods of shallow earthquakes rely on 1D velocity models that may be poor representations of laterally heterogeneous velocity structure within the shallow ed-ifice of a volcanic complex. Shallow events located using the 3D tomographic model of Sierra Negra provide additional details on structure, and they provide a means to evaluate bias and er-rors associated with the 1D velocity model used in absolute and double-difference calculations (Fig. 7). Depth histograms provide one means to evaluate systematic variations in depths between the absolute locations and the 3D velocity model results (Fig. 8). The tomographic model uses a subset of earthquakes that are well dis-tributed and have 7 or more phase picks, but it is a smaller subset of the database. The 3D velocity model places a significant percent-age of earthquakes within the upper 2 km of the crust, including many that were excluded as ‘air-quakes’ in the double-difference algorithm. The comparison of absolute locations and the 3D relo-cation reveals no systematic shift in the depth distribution, except in the depth ranges from −1 to 1 km below sea-level (bsl) (Fig. 8). The shallower depths for earthquakes relocated using the 3D mod-els are not surprising, given the heterogeneity of the uppermost 2 km and the complex seismic ray paths through the volcanic edi-fice.
6. Discussion
As outlined below, Fig. 9 places the seismicity in the context of our current knowledge of the subsurface structure of Sierra Negra as derived from seismic imaging (Rychert et al., 2014; Tepp et al., 2014; Rodd et al., 2016) and from models of geodetic data (Jonsson et al., 2005; Yun et al., 2007). Below we discuss specific subsets of
L. Davidge et al. / Earth and Planetary Science Letters 462 (2017) 169–179 175
Fig. 6. Double-difference earthquake locations of earthquakes from the caldera region of Sierra Negra volcano, and the June 2010 earthquake swarm. A–A′ is the line of cross-section shown in Fig. 9. Blue triangles are seismometer locations. (For interpretation of the references to color in this figure legend, the reader is referred to the web version of this article.)
Fig. 7. Sub-set of earthquakes relocated using the 3D velocity model of Tepp et al. (2014). Note the large number of earthquakes in the uppermost 2 km, most of which were rejected in the double difference algorithm.
the earthquake data set and place them in a context of volcano deformation and ocean island evolution.
6.1. Inflation and seismicity
InSAR data for the time period of the array reveal 0.6 m of in-flation in line-of-sight, with little or no deformation on the flanks (Baker, 2012) (Fig. SM4). Continuous GPS data from station GV02 in the center of Sierra Negra caldera shows 0.78 m of uplift from August 2009 through June 2011 relative to GV01 on the NW flank (Fig. SM5). The footprint of the deformation is small, and almost entirely restricted to the caldera (Fig. SM4). The inflation was sym-metrical and in the same pattern as observed since 1992. There was no inflection in the deformation about the flank intrusion or any other of the identified seismic events. These patterns indicate steady inflation with a pattern similar to previous inflation periods (Amelung et al., 2000).
The southeastern flank of Fernandina volcano showed broad up-lift in 2006 and 2007 (Bagnardi and Amelung, 2012), and it was seismically active during the time period of our array. Whether the
cone field imaged by Soule et al. (2016) is sourced from Fernand-ina or a discrete pressurized magma body elsewhere awaits future marine seismic studies.
Although earthquakes on Alcedo are outside our array and have largely indeterminate depths, we can correlate periods of seismic activity with deformation revealed in InSAR data. The number of events increases from ca. 15 per month to 34 per month over the period December 2009 to March 2010 when the Alcedo caldera floor dropped by about 12 cm, after a ca. 2-year period of inflation (25 cm; Baker, 2012) (Fig. SM6). There are no InSAR data from the region after 2010, so we cannot correlate a second pulse of seismicity in March–April 2011 with ground deformation patterns.
6.2. Vertical stratification of the Sierra Negra magmatic system
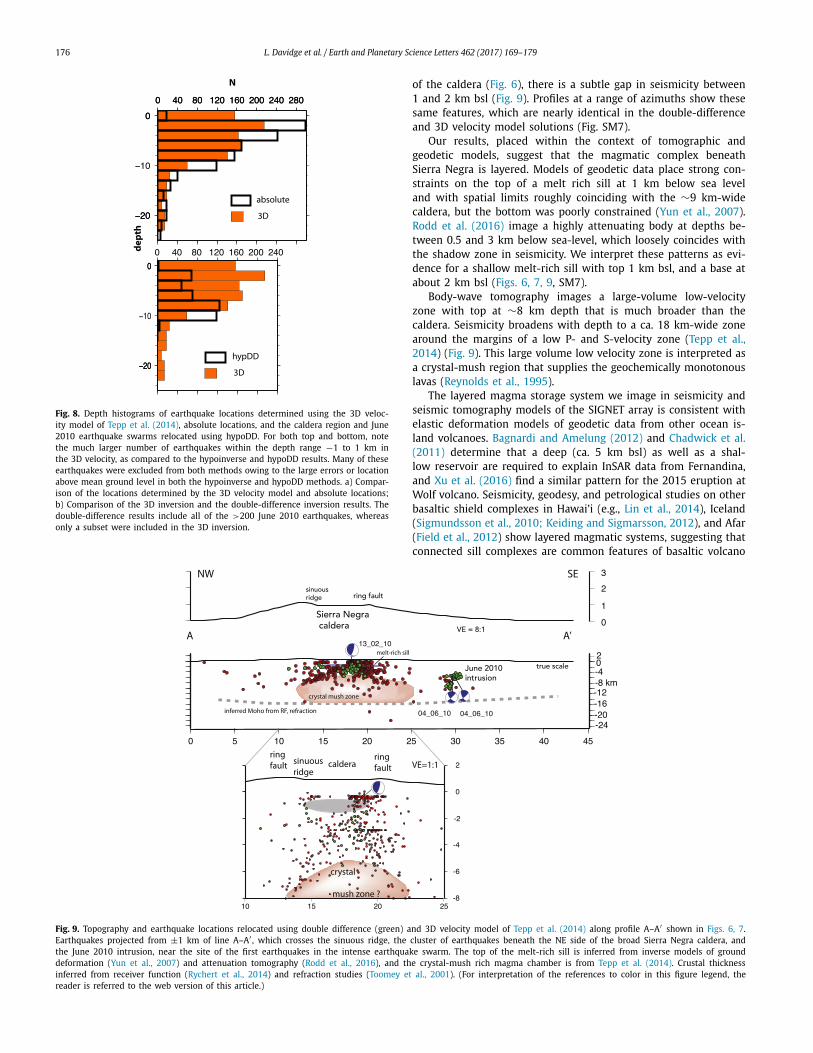
The presence of persistent and intense seismicity at depths be-tween 2 km and the top of the crystal mush zone imaged in crustal tomography at ca. 8 km below sea-level indicates that there are two or more magma bodies beneath Sierra Negra (Fig. 9). Exclud-ing the zone of highly clustered earthquakes along the eastern side
176 L. Davidge et al. / Earth and Planetary Science Letters 462 (2017) 169–179
Fig. 8. Depth histograms of earthquake locations determined using the 3D veloc-ity model of Tepp et al. (2014), absolute locations, and the caldera region and June 2010 earthquake swarms relocated using hypoDD. For both top and bottom, note the much larger number of earthquakes within the depth range −1 to 1 km in the 3D velocity, as compared to the hypoinverse and hypoDD results. Many of these earthquakes were excluded from both methods owing to the large errors or location above mean ground level in both the hypoinverse and hypoDD methods. a) Compar-ison of the locations determined by the 3D velocity model and absolute locations; b) Comparison of the 3D inversion and the double-difference inversion results. The double-difference results include all of the >200 June 2010 earthquakes, whereas only a subset were included in the 3D inversion.
of the caldera (Fig. 6), there is a subtle gap in seismicity between 1 and 2 km bsl (Fig. 9). Profiles at a range of azimuths show these same features, which are nearly identical in the double-difference and 3D velocity model solutions (Fig. SM7).
Our results, placed within the context of tomographic and geodetic models, suggest that the magmatic complex beneath Sierra Negra is layered. Models of geodetic data place strong con-straints on the top of a melt rich sill at 1 km below sea level and with spatial limits roughly coinciding with the ∼9 km-wide caldera, but the bottom was poorly constrained (Yun et al., 2007). Rodd et al. (2016) image a highly attenuating body at depths be-tween 0.5 and 3 km below sea-level, which loosely coincides with the shadow zone in seismicity. We interpret these patterns as evi-dence for a shallow melt-rich sill with top 1 km bsl, and a base at about 2 km bsl (Figs. 6, 7, 9, SM7).
Body-wave tomography images a large-volume low-velocity zone with top at ∼8 km depth that is much broader than the caldera. Seismicity broadens with depth to a ca. 18 km-wide zone around the margins of a low P- and S-velocity zone (Tepp et al., 2014) (Fig. 9). This large volume low velocity zone is interpreted as a crystal-mush region that supplies the geochemically monotonous lavas (Reynolds et al., 1995).
The layered magma storage system we image in seismicity and seismic tomography models of the SIGNET array is consistent with elastic deformation models of geodetic data from other ocean is-land volcanoes. Bagnardi and Amelung (2012) and Chadwick et al.(2011) determine that a deep (ca. 5 km bsl) as well as a shal-low reservoir are required to explain InSAR data from Fernandina, and Xu et al. (2016) find a similar pattern for the 2015 eruption at Wolf volcano. Seismicity, geodesy, and petrological studies on other basaltic shield complexes in Hawai’i (e.g., Lin et al., 2014), Iceland (Sigmundsson et al., 2010; Keiding and Sigmarsson, 2012), and Afar (Field et al., 2012) show layered magmatic systems, suggesting that connected sill complexes are common features of basaltic volcano
Fig. 9. Topography and earthquake locations relocated using double difference (green) and 3D velocity model of Tepp et al. (2014) along profile A–A′ shown in Figs. 6, 7. Earthquakes projected from ±1 km of line A–A′ , which crosses the sinuous ridge, the cluster of earthquakes beneath the NE side of the broad Sierra Negra caldera, and the June 2010 intrusion, near the site of the first earthquakes in the intense earthquake swarm. The top of the melt-rich sill is inferred from inverse models of ground deformation (Yun et al., 2007) and attenuation tomography (Rodd et al., 2016), and the crystal-mush rich magma chamber is from Tepp et al. (2014). Crustal thickness inferred from receiver function (Rychert et al., 2014) and refraction studies (Toomey et al., 2001). (For interpretation of the references to color in this figure legend, the reader is referred to the web version of this article.)

L. Davidge et al. / Earth and Planetary Science Letters 462 (2017) 169–179 177
Fig. 10. Cumulative histogram of seismic release between 1973 and May, 2016. Vertical bars denote the time period of surface eruptions and confirmed intrusion events at CA = Cerro Azul (cyan); SN = Sierra Negra (yellow); A = Alcedo (green); FN = Fernandina (red); W = Wolf (blue) volcanoes. Note the large jumps in seismic energy release corresponding to eruptions and independently confirmed magma intrusions.
systems. Note that these seismic results, which indicate a large number of earthquakes located between 2 and 6 km, precludes a crust-wide zone of mush (proposed by Geist et al., 2014).
6.3. Caldera fault systems
SIGNET data indicate brittle deformation along both caldera-bounding ring faults and the intra-caldera trapdoor fault system. The two fault systems are separated by less than 1 km along the western and southern side of the caldera, a distance within the range of earthquake location errors. Although larger earth-quakes were detected on other volcanoes and on the platform between Sierra Negra and Fernandina volcanoes, only small mag-nitude (ML < 1.2) earthquakes occurred on Sierra Negra volcano during the time period of the experiment, which was a period of rapid inflation (Fig. 9). The majority of microseisms occurred be-neath the caldera rim and the sinuous ridge at depths 0–4 km bsl (Figs. 6, 7, 9). The two migrating swarms of earthquakes in March 2010 and March 2011 may have occurred during fluid mi-gration or degassing episodes. The concentration of brittle defor-mation near the edges of the caldera, as well as the kinematics of faulting are consistent with numerical simulations of caldera de-formation (Jonsson, 2009; Gregg et al., 2012). The trapdoor fault at the sinuous ridge enables the ca 2 km-thick caldera lid to rise during high pressure periods, and to deflate extremely rapidly af-ter magma withdrawal (e.g., Amelung et al., 2000), such as the 5 m of subsidence that occurred over a few hours during the 2005 eruption (Geist et al., 2008). The steep reverse fault focal mecha-nisms we determine indicate compression in the brittle layer above the shallow melt-rich sill during the inter-eruption period, as pre-dicted by numerical models of stress changes during magma cham-ber inflation (Chadwick and Howard, 1991; Jonsson, 2009; Gregg et al., 2012; Corbi et al., 2015). Compression above the inflating magma chamber is more pronounced in models that assume a visco-elastic rheology (Gregg et al., 2012) that may be more ap-propriate for Sierra Negra volcano, given the very small amount of strain accommodated by microseisms. During periods of infla-tion, the sinuous ridge may localize compressive strain across the caldera.
6.4. June 2010 earthquake swarm
Precise locations of well-correlated waveforms from the June 4–9, 2010 earthquake swarm show an initial upward migration, followed by a more spatially dispersed swarm on the southeast-ern flank of Sierra Negra volcano (Figs. 6, 7, 9). The earthquake sequence started with a ML 1.5 earthquake at 13:34 on 4 June, 2010, and activity intensified on June 7 as activity migrated to the SW (Fig. SM8). Earthquake magnitudes range from 1.4–0.9 over the following 6 days, unlike a fault rupture and aftershock sequence.
They converge to a segmented structure rising from 11 km to about 4 km below sea-level. The initial rupture depth occurred at 11 km, too deep for hydrothermal fluid migration. Taken together, the time–space relations suggest a dike or sill intrusion into the southern flank of Sierra Negra volcano (Fig. SM8). The intrusion lies along the edge of the deeper low-velocity zone imaged in tomo-graphic models (Tepp et al., 2014). The associated reverse faulting focal mechanisms are consistent with compression at the margins of a sill intrusion where stress concentrates (e.g., Maccaferri et al., 2011; Magee et al., 2016), but they are not diagnostic.
Although no deformation signal was detected in InSAR data, and the GPS array does not enclose the intrusion site, indepen-dent analyses support the interpretation of a lower crustal sill or dike intrusion. Kelly et al. (2013) use back projection methods to map a time variation in seismic velocity on the southeastern flank of Sierra Negra. Shear-wave splitting measurements of crustal anisotropy showed a 90◦ rotation in the fast direction during and after the June 2010 swarm (Anzieta, 2013). By analogy to temporal changes in anisotropy direction at Ruapehu volcano, the tempo-ral change in crustal anisotropy direction suggests a possible stress field change associated with depressurization of the magma cham-ber (e.g, Gerst and Savage, 2004). Possible analogies at other Galá-pagos volcanoes include a subvolcanic lateral sill intrusion at ∼5 km below sealevel on the southern flank of Fernandina volcano in 2007 (Bagnardi and Amelung, 2012), and the Urvina bay up-lift associated with sill intrusion (Poland, 2014). These observations suggest that ocean island volcanoes regularly grow by intrusion as well as eruption.
6.5. Earthquakes and the eruption cycle
Given the proximity of the volcanoes in the Western Galápagos, teleseismic events cannot be well correlated with specific volca-noes. Instead, we construct a cumulative frequency diagram in Fig. 10 showing teleseismic moment release in an area encom-passing Isabela and Fernandina Islands to evaluate the relationship between teleseismic activity and eruptions and large volume in-trusions. We superpose dates of eruptions and confirmed dike/sill intrusions on the 7 Isabela and Fernandina volcanoes during the same time period (Fig. 10). For those eruptions and intrusions with geodetic constraints (since 1995), most of the earthquake activ-ity is along ring fault systems bounding the calderas, dike intru-sions and fissure eruptions, and the trapdoor fault at Sierra Negra (e.g., Chadwick et al., 2006; Yun et al., 2007; Geist et al., 2008;Bagnardi and Amelung, 2012; Shuler et al., 2013) (Fig. 3). One of the main outcomes of this study is documenting that the inter-eruption inflation cycle on Sierra Negra occurs largely aseismically.
Our comparison, and historic data, indicate that M > 4 earth-quakes are largely restricted to eruptions and known large volume intrusion events beneath the main caldera and flanks. Considering
178 L. Davidge et al. / Earth and Planetary Science Letters 462 (2017) 169–179
that only small magnitude earthquakes occurred during the pe-riod of rapid inflation of the Sierra Negra caldera in 2009–2011 and the b-value indicates efficient stress release, our results in-dicate that almost all of the inter-eruption inflation was accom-modated by aseismic deformation. The longer-term record indi-cates that potentially damaging earthquakes (M4–M6) occur dur-ing eruption, large volume intrusions, and trapdoor faulting events (Fig. 10).
7. Conclusions
Using the SIGNET seismic array and GSN station PAYG, we were able to locate 2382 earthquakes on Sierra Negra volcano (ML < 1.5) and the surrounding areas during a period of magma inflation as determined from InSAR and GPS data. Larger magnitude earth-quakes occurred in swarms at Alcedo (ML ≤ 3.5) and Fernand-ina (ML ≤ 3.2), and at the persistent spatial cluster beneath the shallow submarine platform between Sierra Negra and Fernandina volcanoes. The correlation of the offshore swarm (within location errors) with morphologically young eruptive cones suggests that a pressurized magma body between the two volcanoes.
We interpret the temporal and spatial patterns of seismicity, the focal mechanisms, and existing tomographic and geodetic models as evidence for a shallow melt-rich sill with a top at ca. 1 km bsl below the Sierra Negra caldera, and a base at 2 km bsl. Focal mechanisms indicate compression in the rocks around the shal-low sill, a pattern consistent with models of stresses induced by shallow sill inflation. The melt-rich sill is underlain by a seismo-genic crust above the tomographically-imaged low-velocity zone interpreted as a broad, crystal-mush magma chamber with a top between 6–8 km depth. Upward migrating swarms of earthquakes occurred on the southeastern flank of Sierra Negra volcano in June 2010, and their spatially segmented pattern suggests an intru-sion at depths 5–11 km bsl. Seismic strain was very small during the 2-year period of caldera inflation, indicating that almost all of the inter-eruption inflation (0.78 m) occurred aseismically. The time–space distribution of seismicity and the high b-value suggest potentially damaging earthquakes are unlikely during the inter-seismic cycle, whereas historic data demonstrate increased hazard during large volume intrusions, eruptions, and trapdoor faulting events.
Acknowledgements
L.D. thanks the Southern California Earthquake Center for pro-viding the opportunity to develop a 3D visualization of the data set. Bill Chadwick and an anonymous reviewer provided many in-sightful comments that greatly improved the paper. We are very grateful for the assistance of Marco Bagnardi, Daniel Pacheco, Alex Steele, Sandro Vaca, Luis Manzanillas from Instituto Geofisico, un-dergraduate students Caitlin Smigelski, Megan O’Connor, and Nate Lindsey, science teacher Lisa Hjelm (Girls Middle School, Mountain View), and Eliana Arias of PASSCAL in the physically challenging data acquisition by foot, pony, and boat. We are grateful to Captain Lenin Cruz and Roberto Pepolas for their continued advice and for ensuring our safety during the land and sea travels. This work was supported by NSF grant EAR 0924239 to C.E., F.A. and D.G., Parque Nacional de Galápagos, and the Charles Darwin Foundation. D.G.’s effort is based upon work while serving at the National Science Foundation.
Appendix A. Supplementary material
Supplementary material related to this article can be found on-line at http://dx.doi.org/10.1016/j.epsl.2016.12.021.
References
Aki, K., 1965. Maximum likelihood estimate of b in the formula log N = a − bM and its confidence limits. Bull. Earthq. Res. Inst. Univ. Tokyo 43, 237–239.
Amelung, F., Jónsson, S., Zebker, H., Segall, P., 2000. Widespread uplift and trap door faulting on Galápagos volcanoes observed with radar interferometry. Nature 407 (6807), 993–996.
Anzieta, J., 2013. Estudio de anisotropia sismica para la determinacion de los es-fuerzos tectonicos en el volcan Sierra Negra, Galápagos. MSc Thesis. Escuela Politecnica Nacional, Quito, Ecuador.
Bagnardi, M., Amelung, F., 2012. Space-geodetic evidence for multiple magma reser-voirs and subvolcanic lateral intrusions at Fernandina Volcano, Galápagos Is-lands. J. Geophys. Res. 117, B10406. http://dx.doi.org/10.1029/2012JB009465.
Baker, M.S., 2012. Investigating the Dynamics of Basaltic Volcano Magmatic Systems with Space Geodesy. Open Access Dissertations. Paper 917.
Brandsdottir, B., Einarsson, P., 1979. Seismic activity associated with the September 1977 deflation of the Krafla central volcano in northeastern Iceland. J. Volcanol. Geotherm. Res. 6 (3–4), 197–212.
Chadwick Jr., W.W., Howard, K.A., 1991. The pattern of circumferential and radial eruptive fissures on the volcanoes of Fernandina and Isabela islands, Galápagos. Bull. Volcanol. 53 (4), 259–275.
Chadwick Jr., W.W., Geist, D.J., Jonsson, S., Poland, M., Johnson, D.J., 2006. A volcano bursting at the seams: inflation, faulting, and eruption at Sierra Negra Volcano, Galápagos. Geology 34, 1025–1028.
Chadwick Jr., W.W., Jónsson, S., Geist, D.J., Poland, M., Johnson, D.J., Batt, S., Harpp, K.S., Ruiz, A., 2011. The May 2005 eruption of Fernandina volcano, Galápagos: the first circumferential dike intrusion observed by GPS and InSAR. Bull. Vol-canol. 73 (6), 679–697. http://dx.doi.org/10.1007/s00445-010-0433-0.
Chestler, S.R., Grosfils, E.B., 2013. Using numerical modeling to explore the origin of intrusion patterns on Fernandina volcano, Galápagos Islands, Ecuador. Geophys. Res. Lett. 40 (17), 4565–4569.
Coffin, M.F., Eldholm, O., 1994. Large igneous provinces: crustal structure, dimen-sions, and external consequences. Rev. Geophys. 32 (1), 1–36.
Colgan, M.W., Malmquist, D.L., 1987. The Urvina Bay uplift – a dry trek through a Galápagos coral reef. Oceanus 30 (2), 61–68.
Corbi, F., Rivalta, E., Pinel, V., Maccaferri, F., Bagnardi, M., Acocella, V., 2015. How caldera collapse shapes the shallow emplacement and transfer of magma in ac-tive volcanoes. Earth Planet. Sci. Lett. 431, 287–293.
Ekström, G., Nettles, M., Dziewonski, A.M., 2012. The global CMT project 2004–2010: centroid-moment tensors for 13,017 earthquakes. Phys. Earth Planet. Inter. 200, 1–9.
Feighner, M.A., Richards, M.A., 1994. Lithospheric structure and compensation mech-anisms of the Galápagos Archipelago. J. Geophys. Res. 99 (B4), 6711–6729. http://dx.doi.org/10.1029/93JB03360.
Field, L., Blundy, J., Brooker, R.A., Wright, T., Yirgu, G., 2012. Magma storage condi-tions beneath Dabbahu Volcano (Ethiopia) constrained by petrology, seismicity and satellite geodesy. Bull. Volcanol. 74 (5), 981–1004.
Filson, J., Simkin, T., Leu, L.K., 1973. Seismicity of a caldera collapse: Galápagos Is-lands 1968. J. Geophys. Res. 78 (35), 8591–8622.
Fontaine, F.R., Hooft, E.E., Burkett, P.G., Toomey, D.R., Solomon, S.C., Silver, P.G., 2005. Shear-wave splitting beneath the Galápagos archipelago. Geophys. Res. Lett. 32 (21).
Fox, C.G., Matsumoto, H., Lau, T.-K.A., 2001. Monitoring Pacific Ocean seismicity from an autonomous hydrophone array. J. Geophys. Res. 106 (B3), 4183–4206. http://dx.doi.org/10.1029/2000JB900404.
Geist, D., Bergantz, G., Chadwick Jr., W.W., 2014. Galápagos magma chambers. In: Harpp, K.S., et al. (Eds.), The Galápagos: A Natural Laboratory for the Earth Sci-ences. American Geophysical Union, Washington DC, pp. 55–70.
Geist, D.J., Fornari, D.J., Kurz, M.D., Harpp, K.S., Soule, S.A., Perfit, M.R., Koleszar, A.M., 2006. Submarine Fernandina: magmatism at the leading edge of the Galápa-gos hot spot. Geochem. Geophys. Geosyst. 7, Q12007. http://dx.doi.org/10.1029/2006GC001290.
Geist, D.J., Harpp, K.S., Naumann, T.R., Poland, M., Chadwick, W.W., Hall, M., Rader, E., 2008. The 2005 eruption of Sierra Negra volcano, Galápagos, Ecuador. Bull. Volcanol. 70 (6), 655–673. http://dx.doi.org/10.1007/s00445-007-0160-3.
Gerst, A., Savage, M.K., 2004. Seismic anisotropy beneath Ruapehu volcano: a possi-ble eruption forecasting tool. Science 306 (5701), 1543–1547.
Global Volcanism Program, 2008. Report on Cerro Azul (Ecuador). In: Wunderman, R. (Ed.). Bull. Glob. Volcanism Netw. 33 (5). http://dx.doi.org/10.5479/si.GVP.BGVN200805-3353060. Smithsonian Institution.
Graham, D.W., Christie, D.M., Harpp, K.S., Lupton, J.E., 1993. Mantle plume helium in submarine basalts from the Galápagos platform. Science 262 (5142), 2023–2026.
Gregg, P.M., De Silva, S.L., Grosfils, E.B., Parmigiani, J.P., 2012. Catastrophic caldera-forming eruptions: thermomechanics and implications for eruption triggering and maximum caldera dimensions on Earth. J. Volcanol. Geotherm. Res. 241, 1–12.
Harpp, K., Geist, D., 2002. Wolf–Darwin lineament and plume–ridge interaction in northern Galápagos. Geochem. Geophys. Geosyst. 3 (11), 1–19.
Hooft, E.E., Toomey, D.R., Solomon, S.C., 2003. Anomalously thin transition zone be-neath the Galápagos hotspot. Earth Planet. Sci. Lett. 216 (1), 55–64.
L. Davidge et al. / Earth and Planetary Science Letters 462 (2017) 169–179 179
Ito, G.T., Lin, J., 1995. Mantle temperature anomalies along the past and paleoaxes of the Galápagos spreading center as inferred from gravity analyses. J. Geophys. Res. 100, 3733–3745.
Jónsson, S., 2009. Stress interaction between magma accumulation and trapdoor faulting on Sierra Negra volcano, Galápagos. Tectonophysics 471 (1), 36–44.
Jónsson, S., Zebker, H., Amelung, F., 2005. On trapdoor faulting at Sierra Negra vol-cano, Galápagos. J. Volcanol. Geotherm. Res. 144, 59–71.
Keiding, J.K., Sigmarsson, O., 2012. Geothermobarometry of the 2010 Eyjafjallajökull eruption: new constraints on Icelandic magma plumbing systems. J. Geophys. Res., Solid Earth 117 (B9).
Keir, D., Stuart, G.W., Jackson, A., Ayele, A., 2006. Local earthquake magnitude scale and seismicity rate for the Ethiopian rift. Bull. Seismol. Soc. Am. 96 (6), 2221–2230.
Kelly, C.L., Lawrence, J.F., Ebinger, C.J., 2013. Imaging spatial and temporal seis-mic source variations at Sierra Negra Volcano, Galápagos Islands using back-projection methods. AGU Fall Meeting Abstracts, 1. 2860.
Kissling, E., Ellsworth, W.L., Eberhart-Phillips, D., Kradolfer, U., 1994. Initial reference models in local earthquake tomography. J. Geophys. Res. 99 (B10), 19635–19646. http://dx.doi.org/10.1029/93JB03138.
Klein, F.W., 2002. User’s Guide to HYPOINVERSE-2000, a Fortran Program to Solve for Earthquake Locations and Magnitudes (No. 2002-171). US Geological Survey.
Kurz, M.D., Geist, D., 1999. Dynamics of the Galapagos hotspot from helium isotope geochemistry. Geochim. Cosmochim. Acta 63 (23), 4139–4156.
Lin, G., Shearer, P.M., Matoza, R.S., Okubo, P.G., Amelung, F., 2014. Three-dimensional seismic velocity structure of Mauna Loa and Kilauea volcanoes in Hawaii from local seismic tomography. J. Geophys. Res., Solid Earth 119 (5), 4377–4392.
Lyons, J., Geist, D., Harpp, K., Diefenbach, B., Olin, P., Vervoort, J., 2007. Crustal growth by magmatic overplating in the Galápagos. Geology 35, 511–514.
Maccaferri, F., Bonafede, M., Rivalta, E., 2011. A quantitative study of the mecha-nisms governing dike propagation, dike arrest and sill formation. J. Volcanol. Geotherm. Res. 208 (1), 39–50.
Magee, C., Muirhead, J.D., Karvelas, A., Holford, S., Jackson, C.A.L., Bastow, I., Schofield, N., Stevenson, C.T.E., McLean, C., McCarthy, W., Sthukert, O., 2016. Lat-eral magma flow in mafic sill complexes. Geosphere 12, 1–68.
McGovern, P.J., 2007. Flexural stresses beneath Hawaii: implications for the October 15, 2006, earthquakes and magma ascent. Geophys. Res. Lett. 34 (23).
Mittelstaedt, E., Ito, G., 2005. Plume–ridge interaction, lithospheric stresses, and the origin of near-ridge volcanic lineaments. Geochem. Geophys. Geosyst. 6 (6).
Murru, M., Montuori, C., Wyss, M., Privitera, E., 1999. The locations of magma chambers at Mt. Etna, Italy, mapped by b-values. Geophys. Res. Lett. 26 (16), 2553–2556.
Pinel, V., Jaupart, C., 2003. Magma chamber behavior beneath a volcanic edifice. J. Geophys. Res., Solid Earth 108 (B2). http://dx.doi.org/10.1029/2002JB001751.
Poland, M., 2014. Contrasting volcanism in Hawai’i and the Galápagos. In: Harpp, K.S., Mittelstaedt, E., d’Ozouville, N., Graham, D.W. (Eds.), The Galápagos: A Nat-ural Laboratory for the Earth Sciences, Geophysical Monograph 204, pp. 5–26.
Reyes, C.G., West, M.E., 2011. The waveform suite: a robust platform for manipulat-ing waveforms in MATLAB. Seismol. Res. Lett. 82 (1), 104–110.
Reynolds, R.W., Geist, D.J., 1995. Petrology of lavas from Sierra Negra volcano, Isabela Island, Galápagos archipelago. J. Geophys. Res. 100 (B12), 24537–24553. http://dx.doi.org/10.1029/95JB02809.
Reynolds, R.W., Geist, D., Kurz, M.D., 1995. Physical volcanology and structural de-velopment of Sierra Negra volcano, Isabela island, Galápagos archipelago. Geol. Soc. Am. Bull. 107 (12), 1398–1410.
Rodd, R.L., Lees, J.M., Tepp, G., 2016. Three-dimensional attenuation model of Sierra Negra Volcano, Galápagos archipelago. Geophys. Res. Lett. 43 (12), 6259–6266.
Rychert, C.A., Harmon, N., Ebinger, C., 2014. Receiver function imaging of litho-spheric structure and the onset of melting beneath the Galápagos Archipelago. Earth Planet. Sci. Lett. 388, 156–165.
Shuler, A., Nettles, M., Ekström, G., 2013. Global observation of vertical-CLVD earth-quakes at active volcanoes. J. Geophys. Res., Solid Earth 118 (1), 138–164.
Sigmundsson, F., Hreinsdóttir, S., Hooper, A., Árnadóttir, T., Pedersen, R., Roberts, M.J., Óskarsson, N., Auriac, A., Decriem, J., Einarsson, P., Geirsson, H., 2010. Intrusion triggering of the 2010 Eyjafjallajokull explosive eruption. Nature 468 (7322), 426–430.
Snoke, J.A., 2003. FOCMEC: FOCal MEChanism determinations. In: International Geo-physics Ser., vol. 81. chap. 85.12, pp. 1629–1630.
Soule, S.A., Wanless, V.D., Fornari, D., Jones, M., Schwartz, D., Richards, M.A., 2016. Morphology of Galapagos Platform Seamounts: A History of Emergence and Submergence. Eos, Trans. Amer. Geophys. Union.
Tepp, G., Ebinger, C., Ruiz, M., Belachew, M., 2014. Imaging rapidly deforming ocean island volcanoes in the western Galápagos archipelago, Ecuador. J. Geophys. Res. 119, 442–463.
Toomey, D.R., Hooft Toomey, E.E., Hooft Toomey, E.E., Detrick, R.S., 2001. Crustal thickness variations and internal structure of the Galápagos Archipelago. In: AGU Fall Meeting Abstracts, 1, 0939.
Villagómez, D.R., Toomey, D.R., Hooft, E.E., Solomon, S.C., 2007. Upper mantle struc-ture beneath the Galápagos Archipelago from surface wave tomography. J. Geo-phys. Res., Solid Earth 112 (B7).
Villagómez, D.R., Toomey, D.R., Hooft, E.E., Solomon, S.C., 2011. Crustal structure beneath the Galápagos Archipelago from ambient noise tomography and its im-plications for plume-lithosphere interactions. J. Geophys. Res., Solid Earth 116 (B4).
Villagómez, D.R., Toomey, D.R., Geist, D.J., Hooft, E.E., Solomon, S.C., 2014. Mantle flow and multistage melting beneath the Galápagos hotspot revealed by seismic imaging. Nat. Geosci. 7 (2), 151–156.
Waldhauser, F., Ellsworth, W., 2000. A double-difference earthquake location algo-rithm; method and application to the northern Hayward Fault, California. Bull. Seismol. Soc. Am. 90 (6), 1353–1368.
Xu, W., Jónsson, S., Ruch, J., Aoki, Y., 2016. The 2015 Wolf volcano (Galápagos) eruption studied using Sentinel-1 and ALOS-2 data. Geophys. Res. Lett. 43 (18), 9573–9580.
Yun, S., Segall, P., Zebker, H., 2006. Constraints on magma chamber geometry at Sierra Negra Volcano, Galápagos Islands, based on InSAR observations. J. Vol-canol. Geotherm. Res. 150, 232–243.
Yun, S.-H., Zebker, H., Segall, P., Hooper, A., Poland, M., 2007. Interferogram forma-tion in the presence of complex and large deformation. Geophys. Res. Lett. 34, L12305. http://dx.doi.org/10.1029/2007GL029745.