earth and planetary science lettersstutz/2012_vinnik_al_stutzmann_epsl.pdf · 2012-03-07 · 260 l....
TRANSCRIPT

Earth and Planetary Science Letters 319-320 (2012) 259–268
Contents lists available at SciVerse ScienceDirect
Earth and Planetary Science Letters
j ourna l homepage: www.e lsev ie r .com/ locate /eps l
Cape Verde hotspot from the upper crust to the top of the lower mantle
Lev Vinnik a,⁎, Graça Silveira b,c, Sergei Kiselev a, Veronique Farra d, Michael Weber e,f, Eleonore Stutzmann d
a Institute of physics of the Earth, B. Grouzinskaya 10, 123995 Moscow, Russian Federationb Instituto Dom Luiz, Campo Grande, Edificio C8, 1749-016 Lisboa, Portugalc Area Cientifica de Fisica, Instituto Superior de Engenharia de Lisboa, 1959-007 Lisboa, Portugald Institut de Physique du Globe de Paris, PRES Sorbonne Paris Cité, CNRS UMR 7154, 1 rue Jussieu, 75005 Paris, Francee Deutsches GeoForschungsZentrum, Potsdam, Germanyf Institut fuer Erd- und Umweltwissenschaften, Universitaet Potsdam, Potsdam, Germany
⁎ Corresponding author.E-mail address: [email protected] (L. Vinnik).
0012-821X/$ – see front matter © 2011 Elsevier B.V. Aldoi:10.1016/j.epsl.2011.12.017
a b s t r a c t
a r t i c l e i n f oArticle history:Received 26 May 2011Received in revised form 8 November 2011Accepted 14 December 2011Available online xxxx
Editor: L. Stixrude
Keywords:hotspotplumecrustupper mantlemantle transition zonereceiver function
We investigate the crust, upper mantle andmantle transition zone of the Cape Verde hotspot by using seismicP and S receiver functions from several tens of local seismograph stations. We find a strong discontinuity at adepth of ~10 km underlain by a ~15-km thick layer with a high (~1.9) Vp/Vs velocity ratio. We interpret thisdiscontinuity and the underlying layer as the fossil Moho, inherited from the pre-hotspot era, and the plume-related magmatic underplate. Our uppermost-mantle models are very different from those previouslyobtained for this region: our S velocity is much lower and there are no indications of low densities. Contraryto previously published arguments for the standard transition zone thickness our data indicate that thisthickness under the Cape Verde islands is up to ~30 km less than in the ambient mantle. This reduction is acombined effect of a depression of the 410-km discontinuity and an uplift of the 660-km discontinuity. Theuplift is in contrast to laboratory data and some seismic data on a negligible dependence of depth of the660-km discontinuity on temperature in hotspots. A large negative pressure–temperature slope which issuggested by our data implies that the 660-km discontinuity may resist passage of the plume.Our data reveal beneath the islands a reduction of S velocity of a few percent between 470-km and 510-kmdepths. The low velocity layer in the upper transition zone under the Cape Verde archipelago is very similarto that previously found under the Azores and a few other hotspots. In the literature there are reports on aregional 520-km discontinuity, the impedance of which is too large to be explained by the known phasetransitions. Our observations suggest that the 520-km discontinuity may present the base of thelow-velocity layer in the transition zone.
© 2011 Elsevier B.V. All rights reserved.
1. Introduction
Hotspots present a controversial topic, especially from geophysicalperspective. Many experts follow Morgan (1971) in the idea thathotspots are generated by plumes ascending from the boundarylayer at the base of the mantle. Courtillot et al. (2003) suggested thatthere are three distinct types of hotspots: primary or ‘Morganian’, ofa very deep origin (1); secondary, from the transition zone (2); and‘tertiary’ or ‘Andersonian’, of a superficial origin (3). Interpretationsof seismic data for the deep mantle either claim evidence of deeproots of many hotspots (e.g., Montelli et al., 2006) or put it in doubt(Ritsema and Allen, 2003). Seismic anomalies that are found in themantle transition zone beneath hotspots (e.g., Deuss, 2007) are refutedin other studies (Tauzin et al., 2008), and there are other arguments infavor of shallow origins of hotspots (e.g., Anderson, 2010; Doglioniet al., 2005) A reason for the contradictions is, partly, in a highly variable
l rights reserved.
quality and resolution of seismic data. In many global studies the onlyrobustmantle anomalies beneath hotspots are lowS velocities at depthsless than ~200 km, but they lack continuity at larger depths (Ritsemaand Allen, 2003; Silveira et al., 2006). The best chances for resolvingthe details are provided by arrays of seismic stations sampling theEarth beneath hotspots in different directions and at a close range, butsuch arrays are few.
In this paper we use a local array of seismograph stations to inves-tigate architecture of the Cape Verde hotspot in the Atlantic (Fig. 1).The Cape Verde archipelago consists of 9 main islands (Fig. 1) in thesouth-western part of the Cape Verde Rise, the underwater swell1200 km in diameter. The swell is ~2 km high over the surroundingocean floor 125–150 Myrs old. It is associated with elevated surfaceheat flow (Courtney and White, 1986) and a geoid anomaly of+8 m (Monnereau and Casenave, 2000). The Cape Verde Rise formedin the earlyMiocene, around 22 Myrs. The onset of volcanism on easternislands (Sal, Boavista and Maio) is in the middle Miocene (~15 Myrs).The volcanism continued in Pliocene but on a reduced scale. Thevolcanism on the north-western (Santo Antão, Sao Vicente, Sao Nicolau)and south-western (Brava, Fogo, Santiago) islands is younger (~6 Myrs),

MLOSSACV
MAIO
SNIC
MINGPJOR
SALA
SantoAntãoSanto Antão
São Vicente
São Nicolau
Sal
Boavista
MaioSantiago
Fogo
Brava
Fig. 1. Map of the region. The stations deployed in 2009 are shown by filled triangles. SACV is the station of the Global Seismograph Network. The other stations shown by opentriangles were deployed in 2002–2004 (Helffrich et al., 2010). (For interpretation of the references to color in this figure legend, the reader is referred to the web version of thisarticle.)
260 L. Vinnik et al. / Earth and Planetary Science Letters 319-320 (2012) 259–268
and it continues until today (Holm et al., 2008). The Cape Verde hotspotis almost stationary (Gripp and Gordon, 2002).
Seismic data are, generally, in favor of deep origins of the CapeVerde swell. Davaille et al. (2005) relate it to a large-scale velocityanomaly in the lower mantle but note the lack of reliable images ofthemantle between 400-km and 1000-kmdepths. Seismic tomographydata suggest that the origin of the Cape Verde plume is near the core–mantle boundary (Montelli et al., 2006). Thermochemical modeling ofseismic and gravity data (Forte et al., 2010) reveals beneath the CapeVerde islands a deep-seated large-scale hot upwelling.
Seismic data for the crust, upper mantle and transition zone in theCape Verde region are controversial. A hotspot swell can be explainedby a thermal reheating of the lithosphere and/or magmaticunderplating and/or dynamic support of upwelling asthenosphere. Ajoint analysis of gravity (free air anomalies) and seismic data (wideangle seismic reflections) suggests that the first two reasons areunlikely for the Cape Verde archipelago (Pim et al., 2008). The resultsof our work disagree with this solution.
Lodge and Helffrich (2006) inferred from receiver functions thatthe S velocity in the uppermost mantle is very high (4.8 km/s) andthe mantle root of the swell is depleted. Thermal anomalies in thetransition zone are expressed by anomalous depth separationsbetween the 410-km and 660-km discontinuities. Helffrich et al.(2010) state that beneath the Cape Verde islands this separation isnormal, with implication of ‘Andersonian’ origin of this hotspot. Theresults of our work are very different, practically the opposite.
We use recordings of station SACV of the Global SeismographicNetwork (GSN) on the island of Santiago and of two temporarynetworks. One network of ~40 stations was deployed in 2009 for9 months. The recordings of several stations on each island werestacked to reduce noise and then treated as recordings of one stationon this island. The 2nd network of several stations was deployed for2 years from 2002 to 2004 (Lodge and Helffrich, 2006). Data of goodquality were obtained at 6 stations: MLOS, MAIO, SALA, SNIC, MINGand PJOR (Fig. 1). We will discuss the data with reference to thestation codes (for the 2nd network) or to the island name (for the
first network). Like in geological studies (Holm et al., 2008) we dividethe islands into eastern (Sal, Boavista, Maio), north-western (SantoAntão, Sao Vicente, Sao Nicolau) and south-western (Brava, Fogo,Santiago) groups. We investigate the subsurface structure with Pand S receiver function techniques, and, in this respect, this study issimilar to the recent study of the Azores hotspot (Silveira et al.,2010). In Section 2 we present results of application of P receiverfunction techniques. These data illuminate the structure of the transitionzone. P receiver functions are then complemented by S receiverfunctions (Section 3). Simultaneous inversion of the P and S receiverfunctions provides data on velocity profiles in the crust and uppermantle to a depth of ~300 km (Section 4). Finally, in Section 5 wesummarize and discuss our findings.
2. P receiver functions
P receiver functions (PRFs) are used in our work for two purposes.First, we are interested in the structure of the mantle transition zone.Second, PRFs in the time interval from −5 s to 35 s are invertedsimultaneously with SRFs for the crust and upper mantle velocitymodels. We use the LQ coordinate system (Vinnik, 1977) where theL axis corresponds to the principal direction of the P wave particlemotion in the wave propagation plane and Q is perpendicular to Lin the same plane. The records were low-pass filtered with a cornerperiod of 6 s. To remove the effect of seismic source, the Q componentof each seismic event is deconvolved by the L component, and thedeconvolved Q components are stacked with move-out time correc-tions. The corrections are calculated for several assumed depths ofconversion from 0 to 1000 km. The reference slowness for stacking,as in other similar studies, is 6.4 s/°. Seismic events used in the calcu-lations of PRFs are distributed in a broad distance and azimuth range(Fig. 2).
PRFs in Fig. 3 consist mainly of Ps converted phases and multiplereflections. The Ps converted phases from transition-zone discontinuitiesand reverberations may arrive in the same time window but with adifferent slowness. The slowness of the Ps converted phases is less

a cb
Fig. 2. Epicenters of seismic events used for constructing PRFs and SRFs: a) PRFs, station SACV; b) PRFs, stations deployed in 2009 (red) and 2002–2004 (yellow); c) SRFs, stationSACV (yellow) and stations deployed in 2002–2004 (red). (For interpretation of the references to color in this figure legend, the reader is referred to the web version of this article.)
261L. Vinnik et al. / Earth and Planetary Science Letters 319-320 (2012) 259–268
than of the P wave at the same epicentral distance, whilst that of themultiples is larger. To identify the converted phases with confidence,we follow Chevrot et al. (1999) and present in Fig. 1S (Supplementarymaterial) the results of slant stacking, where the move-out correctionsare calculated as product of the differential slowness (difference of thetrial slowness relative to the P wave) and the differential distance(separation in epicentral distance between the seismic event and theaverage distance of the group of events). In this stack the largest ampli-tudes of the converted Ps phases and themultiples should be observed ata negative and positive differential slowness, respectively. All phasesthat are discussed in this Section are with a negative slowness. All stackscontain a large Ps phase from a crustal boundary at a time near 2 s. Tojudge on the region in the upper mantle sampled by PRFs, we showpiercing points of the converted phases at 410-km and 660-km depths(Fig. 4).
a) b)
e)d)
Fig. 3. Stacked PRFs from a) stations deployed in 2009 on the north-western islands, b) statioislands, e) all stations on the north-western islands, southern events and all stations on theobtained by migration to the depth shown on the left-hand side; Ps phases from the tran400 km (P410s), 500 km (M) and 700 km (P660s).
The stack in Fig. 3a is obtained for the receiver functions from 9events at ~15 stations on the north-western islands. Beyond thecrustal phase, the stack contains a large pulse of negative polarity ata time of 53.6 s. It is labeled “M” because its waveform resemblesthe capital letter M. The piercing points (Fig. 4a) surround thenorth-western islands.
The stack of 20 PRFs for station PJOR (Fig. 3b) contains Ps phasesfrom both 410-km and 660-km discontinuities at a time of 47.2 s and70.6 s. The difference in time of the two phases (23.4 s) is reasonablyclose to the standard value (23.9 s) of IASP91 model with implicationthat the discontinuities in the transition zone sampled by PJOR arelocated close to their standard depths, but these arrivals are delayedby 3.2 s and 2.7 s with respect to the standard times of IASP91 model(Kennett and Engdahl, 1991). The times of IASP91 for P410s andP660s phases are very close to the average observational values in the
c)
f)
n PJOR, c) all stations on the north-western islands, d) all stations on the south-westernsouth-western islands, northern events, and f) stations SALA and MAIO. Each trace issition zone are marked by ±2σ error bars on the traces for the migration depths of

a) b) c)
d) e) f)
Fig. 4. Piercing points of the Ps converted phases at 410-km (open circles) and 660-km (filled circles depths); a,b,c,d,e,f correspond to Figs. 2 and 3.
262 L. Vinnik et al. / Earth and Planetary Science Letters 319-320 (2012) 259–268
continents (Chevrot et al., 1999). The delays of ~3 s indicate that thewaves in the upper mantle over the 410-km discontinuity are slowrelative to the standard. Similar delays are observed in peripheralregions of Iceland (Du et al., 2006). Piercing points for this set of PRFsare located mostly west of the islands (Fig. 4b). Apparently, west ofthe islands the structure of the transition zone is nearly normal.
The stack of PRFs for all stations on the north-western islands(Fig. 3c) contains in the time interval from 40 s to 75 s the arrivalsthat are present in (a) and (b). The M-shaped phase at a time of53.4 s is preceded by the P410s phase which arrives several secondsearlier (~47.5 s). The times of these two phases can be distorted byinterference, but they are close to those in (a) and (b). The P660sphase is outside the interference zone, where it can be easilydistorted, but its time (69.6 s) is 1 s less than in (b). The separationbetween P410s and P660s is 22.1 s. That is 1.8 s less than the standardvalue. Time anomalies in a range of a fraction of a second can be easilyexplained by measurement errors (Chevrot et al., 1999), but theanomaly of 1.8 s is too large for this. The piercing points surroundthe north-western islands; many piercing points are located southand north-east of the islands (Fig. 4c).
In the PRFs from all stations on the south-western islands(Fig. 3d), only an arrival at 45.6 s is detected with confidence in thetransition zone window. Most piercing points are located south-westof the south-western islands (Fig. 4d). The reduced delay of P410srelative to IASP91 (1.6 s versus 3.2 s at PJOR) means that the upper-mantle velocities are higher or the 410-km discontinuity is relativelyshallow south-west of the Cape Verde archipelago. However, an upliftof the 410-km discontinuity relative to the normal depth at PJOR in ahotspot region is unlikely, and this leaves the relatively high velocitiesas a likely possibility.
The stack in Fig. 3e differs from the others: PRFs from differentstations in this stack sample the same region in the transition zone.This is achieved by using PRFs of all stations on north-western islandsfor southern events and of all stations on the south-western islands
for northern events. Piercing points of this group (Fig. 4e) providethe best sampling of the transition zone under the archipelago. Theobserved wave field in the transition zone window looks similar tothat in Fig. 3c with the M-shaped, P410s and P660s phases. Theseparation between P410s at 48.5 s and P660s at 68.8 s is 20.3 s,3.6 s less than the standard time of 23.9 s.
Finally, the stack in Fig. 3f is calculated for PRFs of stations SALAand MAIO on the eastern islands. These data provide good samplingof the transition zone of the Cape-Verde Rise (Fig. 4f). The wavefield in Fig. 3f contains P410s and P660s at 46.5 s and 67.4 s with aseparation of 20.9 s or 3.0 s less than the standard time. The time ofthe P660s phase is 3.2 s less that at PJOR which cannot be explainedby measurement errors. This is, at least partly, the effect of an upliftof the 660-km discontinuity: 1 s in time is equivalent to ~10 km indepth of the discontinuity.
3. S receiver functions
In S receiver functions (SRFs) the Sp converted phases do notinterfere with multiple reflections. In the SRF technique (Farra andVinnik, 2000) the record of the S wave train is decomposed into Qand L components. For the sketch of the coordinate system seeVinnik et al. (2010). The Q axis is parallel to the principal S-waveparticle-motion direction in the wave propagation plane. The L axisis normal to Q in the same plane. The L axis is not disturbed by theS wave motion and, for this reason, is optimal for detecting S-to-Pconverted phases. The L components of a number of seismic eventsare equalized by deconvolution. With the adopted sign convention,positive or negative polarity of Sp phase in the L component correspondsto a discontinuity with the lower or higher S velocity at the lower side ofthe discontinuity. To suppress noise, the deconvolved L components of anumber of SRFs are stackedwithweights. To account for the difference inslowness between S and Sp phases in the same recording, the SRFs arestacked with move-out time corrections. The corrections are calculated

263L. Vinnik et al. / Earth and Planetary Science Letters 319-320 (2012) 259–268
as product of the difference in slowness between the Sp phase and S(differential slowness) and the difference between the epicentraldistance of the seismic event and the reference distance. The details ofthe processing procedure can be found elsewhere (e.g., Silveira et al.,2010; Vinnik et al., 2010).
To construct SRFs with the optimum signal/noise ratio, the recordswere low-pass filtered with the corner period of 9 s. Sometimes, tomaximize the signal/noise ratio in the stack the individual SRFswere combined into groups of two or more stations. The stack of135 receiver functions from stations SACV, MLOS, SALA and MAIO(Fig. 5a) is calculated for all available good quality recordings in theepicentral distance interval from 65° to 89°. The stack contains aclear S410p phase at a time of −59.8 s. The time of IASP91 modelfor this phase is −56.1 s (Vinnik et al., 2010), which means that thesignal arrives 3.7 s earlier than predicted by the model. The phase,equivalent to the M-shaped phase in Fig. 3, should be recorded infront of S410p with the same amplitude and opposite polarity, but itis not observed. Piercing points of the S410p phase are scattered ina large region outside the Cape Verde Rise (Fig. 5b).
4. Simultaneous inversion of PRFs and SRFs
The simultaneous inversion of PRFs and SRFs was previouslyapplied in several regions, including the Azores (Silveira et al.,2010). The technique was described in detail by Kiselev et al.(2008). We assume that the Earth in the vicinity of the station islaterally homogeneous and isotropic. A search for the optimummodels is conducted by using iterative algorithm similar to SimulatedAnnealing (Mosegaard and Vestergaard, 1991). The procedure isrepeated for 4 randomly selected starting points in the model space.For each starting point 105 models are tested which is sufficient forthe trial models to converge. We divide the model space into cellsand present results of the search by a number of hits (color code) ineach cell for the last several thousand models. A similar statistics isobtained for the data space. The trial model consists of 9 layers. At adepth of 300 km the velocities are forced to merge with IASP91velocities.
The synthetics are calculated by using the Thomson–Haskellmatrix formalism (Haskell, 1962) for plane waves and plane layers,with Earth flattening transformation (Biswas, 1972). The model is
a
Fig. 5. Stacked SRFs of stations SACV, MLOS, SALA and MAIO (a) and the related piercing poinproduct of differential slowness and differential distance. Each trace corresponds to differenterror bar.
defined by velocities Vp, Vs, thickness and density of each layer.Density is derived from Vp by using Birch's law (Birch, 1961). Toreduce the spread of the velocity profiles we invert jointly the receiverfunctions and teleseismic travel time residuals. The residuals relativeto IASP91 can be inferred from the residuals of P410s and P660s. Ifthe time separation between P660s and P410s is close to normal, theaverage of the residuals of P410s and P660s can be attributed to theEarth's medium above the 410-km discontinuity. This average can beinterpreted as the difference between the teleseismic residuals ofthe S and P waves. The profiles presented in Figs. 6–8 are obtainedby assuming that the teleseismic P and S residuals are 1 s and 3 srespectively, and these residuals are accumulated in a depth range ofthe inversion (300 km). The equivalent residuals of the Ps phasesfrom the transition-zone discontinuities are 2 s, consistent with thedata in Fig. 3. For comparison similar profiles with the residuals of1 s and 4 s are shown in Supplementary material.
The assumption of lateral homogeneity is easily violated incomplicated geological structures. To minimize the effects of lateralheterogeneity, we stack receiver functions in wide azimuthal sectors(Figs. 4 and 5b) and combine the receiver functions of neighboringstations. Moreover, we interpret only stable details which are presentin the velocity profiles of different stations. The main features of theprofiles for station SALA (the eastern islands) (Fig. 6) are: the largediscontinuity at a depth of ~10 km, labeled a; the underlying layer~10 km thick with the S velocity of ~3.8 km/s and elevated Vp/Vsratio (~1.9), labeled b; the mantle lid with the S velocity of~4.1 km/s between the depths of ~20 km and ~65 km, labeled c andthe underlying layer with a reduced S velocity (~3.8 km/s). Thesenumbers correspond to the medians, whereas the actual values arespread around the medians. The synthetic PRFs and SRFs are closeto the actual PRFs and SRFs, and the resulting travel-time residualsfor the P and S waves are close to 1 s and 3 s.
The same features are present in the profiles for stations MINGand SNIC on the north-western islands (Fig. 7), although there arechanges in the parameters: S velocity in the layer b is 4.1 km/s insteadof 3.8 km/s, the Vp/Vs velocity ratio in this layer is ~2.0 instead of 1.9,and the bottom of this layer is at a depth of ~30 km, instead of 20 km.S velocity in the layer c is ~4.2 km/s instead of 4.1 and the upperboundary of the low S-velocity layer is at a depth of ~70 km insteadof 65 km. In the profiles for stations SACV and MLOS on the south-
b
ts of S410p at a depth of 410 km (b). Move-out corrections for stacking are obtained asial slowness shown on the left-hand side. The arrival of S410p phase is marked by ±2 σ

300
250
200
150
100
50
04 5 6 7 8 9 3 4 5 1. 2. 3.
0 10 20 30
-0.2
-0.1
0
0.1
0.2
-40 -30 -20 -10 0-0.2
-0.1
0
0.1
0.2
102 103 104
Vp (km/s) Vs (km/s) Vp/VsD
epth
(km
)
Time(s) Time(s)
SRFPRF
SAL
0 1 2 2 3 4
P wave residual s S wave residual s
ab
c
Fig. 6. Simultaneous inversion of PRFs and SRFs from station SALA. Histograms of Vp, Vsand Vp/Vs are shown by color code (upper row). Dash lines are for medians; black solidlines are for IASP91 velocities and their ratio. Labels a, b and are for the fossil Moho,magmatic underplate and the upper-mantle lid. Middle — histograms of the syntheticPRFs and SRFs, shown by the same color code as the models; dash lines are for theactual PRF and SRF. Bottom — histograms of the travel time residuals of the P and Swaves for the models in the upper row. (For interpretation of the references to colorin this figure legend, the reader is referred to the web version of this article.)
300
250
200
150
100
50
0
102 103 104
SRFPRF
MING SNIC
0 1 2 2 3 4
4 5 6 7 8 9 3 4 5 1. 2. 3.Vp (km/s) Vs (km/s) Vp/Vs
Dep
th (
km)
-0.2
-0.1
0
0.1
0.2
0 10 20 30 -40 -30 -20 -10 0
Time(s) Time(s)
-0.2
-0.1
0
0.1
0.2
ab
c
Fig. 7. The same as in Fig. 6 but for stations MING and SNIC.
264 L. Vinnik et al. / Earth and Planetary Science Letters 319-320 (2012) 259–268
western islands (Fig. 8) Vp and Vp/Vs ratio in the layer b are upwardbiased, but otherwise the structure is similar to those in Figs. 6 and 7.
The profiles for the residuals of 1 s and 4 s (Figs. 2S–4S of Supple-mentary materials) are broadly similar to those in Figs. 6–8. A high(relative to the standard 1.8) Vp/Vs velocity ratio in the mantle low-S-velocity zone is a notable detail of the profiles in Figs. 2S–4S.
5. Discussion and conclusions
5.1. Crust and upper mantle
The velocity models in Figs. 6–8 contain a strong boundary a at adepth of ~10 km and an underlying layer b 10–20 km thick. The Vsand Vp/Vs values in the layer b in the profiles for stations SALA andMING+SNIC (~3.9 km/s and ~1.9) are consistent with the data forgabbronorite–troctolite (Christensen, 1996): 3.93±0.12 km/s and1.86±0.05, respectively. Therefore, in our interpretation, this layer
belongs to the crust. As a result, the thickness of the crust(20–30 km) is at least three times the thickness of the normal oceaniccrust and is close to other estimates for regions directly above thecentral rising cores of mantle plumes (20.1 km, White et al., 1992).We interpret the boundary a and the underlying layer b as the fossilMoho, inherited from the pre-hotspot era, and the magmatic under-plate, associated with the plume.
Pim et al. (2008) find in their wide-angle reflection data noevidence for magmatic underplating or a reheating of the uppermantle and a related reduction of the mantle velocity beneath theCape Verde archipelago. This problem might arise because thedifference in P-wave velocities between the crustal layer b and theupper-mantle layer c is small. In our data layer b differs from cmainlyby the Vp/Vs ratio. Density of gabbro is ~3 g/cm3 versus 3.3 g/cm3 fordunite (Christensen, 1996). With a thickness of 10 km the layer bmaycompensate the load of an underwater swell 2 km high. Our data forthe crust beneath the Cape Verde islands are fairly similar to thoseobtained with a similar method for the Azores (Silveira et al., 2010).Indications of underplating are known for other oceanic islands(e.g., Leahy and Park, 2005). Magmatic underplating may supportthe Cape Verde swell, but we cannot confirm this by gravity modeling,because of a large uncertainty in the required parameters.

300
250
200
150
100
50
0
102 103 104
Dep
thkm
SRFPRF
SACV MLOS
0 1 2 2 3 4
4 5 6 7 8 9 3 4 5 1. 2. 3.Vp (km/s) Vs (km/s) Vp/Vs
0 10 20 30 -40 -30 -20 -10 0
Time(s) Time(s)
-0.2
-0.1
0
0.1
0.2
-0.2
-0.1
0
0.1
0.2
ab
c
Fig. 8. The same as in Fig. 6 but for stations SACV and MLOS. The synthetic PRFs andSRFs for the model from Lodge and Helffrich (2006) are shown by blue lines. (Forinterpretation of the references to color in this figure legend, the reader is referred tothe web version of this article.)
265L. Vinnik et al. / Earth and Planetary Science Letters 319-320 (2012) 259–268
Like under the Azores, the upper mantle beneath the Cape Verdeislands contains the high-velocity lid (layer c in Figs. 6–8) and theunderlying low S-velocity layer. Qualitatively similar structures arefound in a number of oceanic regions (for references see Silveiraet al., 2010). This layer is usually interpreted as a residuum formedthrough basaltic melt extraction (e.g., Gaherty et al., 1996). Beneaththe Azores, the S velocity in the lid is ~4.4 km/s, and the Vp/Vs ratio isreduced relative to the normal 1.8 (Silveira et al., 2010). By comparison,the S velocity in the lid beneath the CapeVerde islands (~4.2 km/s) is 5%lower, and the Vp/Vs anomaly is missing. We tentatively relate thisdifference to the Mid-Atlantic ridge location of the Azores and themid-plate location of the Cape Verde islands. The S-wave velocityreduction in the low-velocity layer beneath the Cape Verde archipelagoand the Azores is 13–15% relative to IASP91 model.
Our uppermost-mantle models are very different from thosepreviously obtained for this region from PRFs by Lodge and Helffrich(2006), furthermore LH: our S velocity is much lower (4.2 km/sversus 4.8 km/s) and there are no indications of extremely low density(2.74 g/cm3 in LHmodel versus the standard 3.3 g/cm3). In comparisonwith our data, LHmodels are obtained at a shorter-period (~2 s) range.
The lowdensity is invoked in order to reduce the theoretical amplitudesof the multiple reflections from the crust/mantle boundary which areabsent in the actual PRFs obtained by LH. This discrepancy may haveother reasons. For instance, the reflected phases cannot be observed ifthe width of the discontinuity is around a quarter of the wavelengthor more. For transmitted Ps phases this threshold is roughly 3 timesthe threshold for reflected phases. If the S-wave period is 2 s, S-wavevelocity is 4 km/s and a width of the discontinuity is 3–4 km versuswave-length of 8 km, this discontinuity may produce a large Ps phaseand at the same time be transparent for reflected phases, as in the LHdata. This, rather than the very low density, is a consistent explanationfor incompatibility of the short-period transmitted and reflectedphases. The problem of sharpness of the discontinuity is less significantat the longer periods of our study. Another possible reason for theapparent incompatibility of the transmitted and reflected phases is adestructive interference between the multiple reflections from thecrust–mantle boundary and the Ps phase from the bottomof themantlehigh-velocity lid.
The synthetic receiver functions calculated for LH model differfrom our receiver functions of stations MLOS+SACV (Fig. 8). TheLH model is obtained only for station SACV, but in our combineddata set of SACV+MLOS the data from SACV are strongly dominant.In the PRFs a substantial discrepancy is present in the time intervalfrom 6 to 10 s. This interval contains those seismic phases that areaffected by the low density in the LH model. A dramatic disagreementis found between the synthetics and the actual SRFs. Note that the LHmodel is based only on PRFs, and no wonder that the effect of itsnon-uniqueness is so large in the SRFs. Separate inversions of bothPRFs and SRFs are non-unique, but the non-uniqueness is reducedby the simultaneous inversion in our approach (Vinnik et al., 2004).
To finish the discussion of the low density in the LH model, wenote that the material with the ultra-mafic velocity (Vs=4.8 km/s)and felsic density proposed by LH is very exotic. LH describes thisrock as depleted. However, from petrology the fertile mantle hasonly a 2.5% higher density than the depleted one (O'Hara, 1975), ratherthan 20% reported by LH. A more realistic density deficit of 2.5% is toosmall to be inferred directly from seismic amplitudes as attempted byLH.
5.2. Mantle transition zone
Our analysis demonstrates that the separation in time betweenthe P660s and P410s phases beneath the Cape Verde islands isreduced by up to 3.6 s relative to IASP91. The corresponding effectin the thickness of the transition zone is ~30 km. This is a joint effectof uplift of the 660-km discontinuity and depression of the 410-kmdiscontinuity. The times of the P660s phase in the best data are68.8 s and 67.4 s (Figs. 3e,f), close to 67.9 s in IASP91. For the standarddepth of 660 km they should be ~2 s larger, owing to the low velocitiesin the upper mantle. The discrepancy can be eliminated by moving the660-km discontinuity to a depth of ~640 km. This is an importantobservation, because thinning of the transition zone beneath hotspotsis usually caused only by depression of the 410-km discontinuity(Deuss, 2007; Du et al., 2006).
The 660-km discontinuity is a combined effect of the post-spinelphase transition with a negative Clapeyron slope of −2.8 MPa/Kand the post-majorite transition with a positive Clapeyron slope of1.3 MPa/K (Hirose, 2002). At a temperature, which can be expected inhigh-temperature plumes (above 1700–1800 °C), pressure of thecombined transition in pyrolite is practically temperature-independentor the pressure–temperature slope is positive (Hirose, 2002). In otherwords, the depth of the 660-km discontinuity is insensitive totemperature or it is increased by high temperature in such a model.Our observation of the uplift of the 660-km discontinuity contradictsthis. If the post-spinel transition is dominant and its pressure-temperature slope is −2.8 MPa/K, the corresponding rate of change of
266 L. Vinnik et al. / Earth and Planetary Science Letters 319-320 (2012) 259–268
depth of the 660-km discontinuity is −0.07 km/K, and the uplift of20 km corresponds to a temperature anomaly of +300 K. The negativepressure–temperature slope of the 660-km discontinuity implies thatthe discontinuity may resist passage of the plume (e.g., Solheim andPeltier, 1994). This is consistent with tomographic images of a fewplumes, including the Cape Verde plume (Nolet et al., 2006). Davailleet al. (2005) speculated that the plume may be stopped below/by thetransition zone.
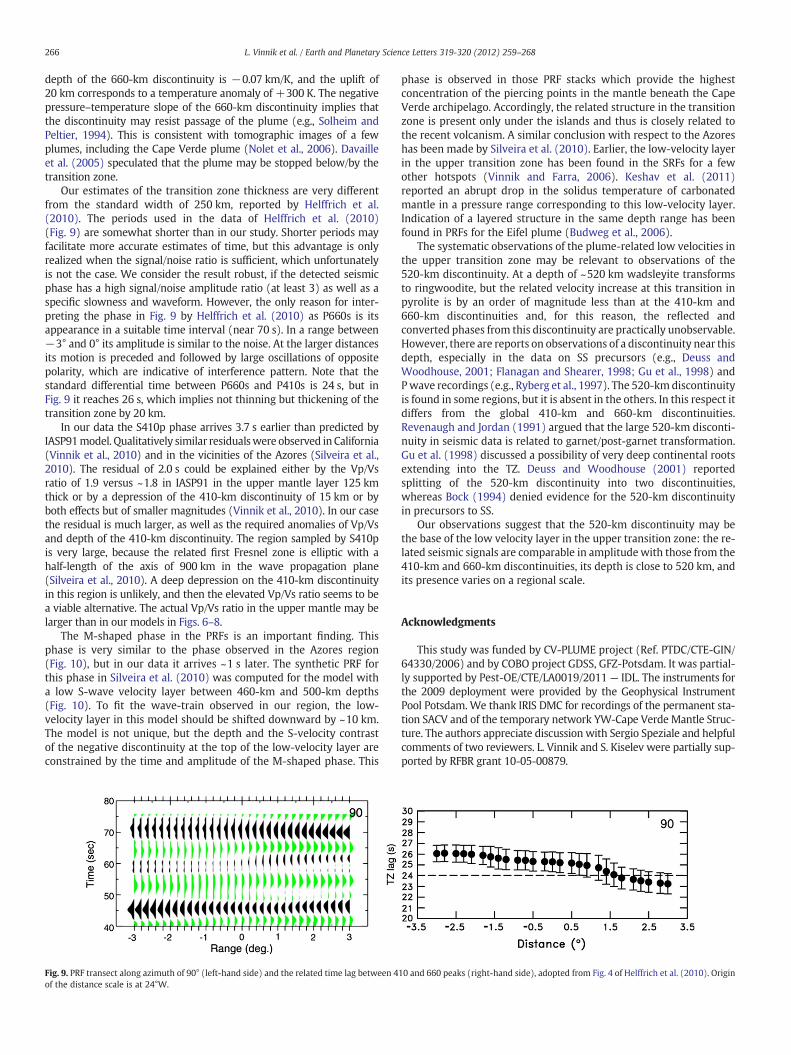
Our estimates of the transition zone thickness are very differentfrom the standard width of 250 km, reported by Helffrich et al.(2010). The periods used in the data of Helffrich et al. (2010)(Fig. 9) are somewhat shorter than in our study. Shorter periods mayfacilitate more accurate estimates of time, but this advantage is onlyrealized when the signal/noise ratio is sufficient, which unfortunatelyis not the case. We consider the result robust, if the detected seismicphase has a high signal/noise amplitude ratio (at least 3) as well as aspecific slowness and waveform. However, the only reason for inter-preting the phase in Fig. 9 by Helffrich et al. (2010) as P660s is itsappearance in a suitable time interval (near 70 s). In a range between−3° and 0° its amplitude is similar to the noise. At the larger distancesits motion is preceded and followed by large oscillations of oppositepolarity, which are indicative of interference pattern. Note that thestandard differential time between P660s and P410s is 24 s, but inFig. 9 it reaches 26 s, which implies not thinning but thickening of thetransition zone by 20 km.
In our data the S410p phase arrives 3.7 s earlier than predicted byIASP91model. Qualitatively similar residualswere observed in California(Vinnik et al., 2010) and in the vicinities of the Azores (Silveira et al.,2010). The residual of 2.0 s could be explained either by the Vp/Vsratio of 1.9 versus ~1.8 in IASP91 in the upper mantle layer 125 kmthick or by a depression of the 410-km discontinuity of 15 km or byboth effects but of smaller magnitudes (Vinnik et al., 2010). In our casethe residual is much larger, as well as the required anomalies of Vp/Vsand depth of the 410-km discontinuity. The region sampled by S410pis very large, because the related first Fresnel zone is elliptic with ahalf-length of the axis of 900 km in the wave propagation plane(Silveira et al., 2010). A deep depression on the 410-km discontinuityin this region is unlikely, and then the elevated Vp/Vs ratio seems to bea viable alternative. The actual Vp/Vs ratio in the upper mantle may belarger than in our models in Figs. 6–8.
The M-shaped phase in the PRFs is an important finding. Thisphase is very similar to the phase observed in the Azores region(Fig. 10), but in our data it arrives ~1 s later. The synthetic PRF forthis phase in Silveira et al. (2010) was computed for the model witha low S-wave velocity layer between 460-km and 500-km depths(Fig. 10). To fit the wave-train observed in our region, the low-velocity layer in this model should be shifted downward by ~10 km.The model is not unique, but the depth and the S-velocity contrastof the negative discontinuity at the top of the low-velocity layer areconstrained by the time and amplitude of the M-shaped phase. This
Fig. 9. PRF transect along azimuth of 90° (left-hand side) and the related time lag between 4of the distance scale is at 24°W.
phase is observed in those PRF stacks which provide the highestconcentration of the piercing points in the mantle beneath the CapeVerde archipelago. Accordingly, the related structure in the transitionzone is present only under the islands and thus is closely related tothe recent volcanism. A similar conclusion with respect to the Azoreshas been made by Silveira et al. (2010). Earlier, the low-velocity layerin the upper transition zone has been found in the SRFs for a fewother hotspots (Vinnik and Farra, 2006). Keshav et al. (2011)reported an abrupt drop in the solidus temperature of carbonatedmantle in a pressure range corresponding to this low-velocity layer.Indication of a layered structure in the same depth range has beenfound in PRFs for the Eifel plume (Budweg et al., 2006).
The systematic observations of the plume-related low velocities inthe upper transition zone may be relevant to observations of the520-km discontinuity. At a depth of ~520 km wadsleyite transformsto ringwoodite, but the related velocity increase at this transition inpyrolite is by an order of magnitude less than at the 410-km and660-km discontinuities and, for this reason, the reflected andconverted phases from this discontinuity are practically unobservable.However, there are reports on observations of a discontinuity near thisdepth, especially in the data on SS precursors (e.g., Deuss andWoodhouse, 2001; Flanagan and Shearer, 1998; Gu et al., 1998) andPwave recordings (e.g., Ryberg et al., 1997). The 520-kmdiscontinuityis found in some regions, but it is absent in the others. In this respect itdiffers from the global 410-km and 660-km discontinuities.Revenaugh and Jordan (1991) argued that the large 520-km disconti-nuity in seismic data is related to garnet/post-garnet transformation.Gu et al. (1998) discussed a possibility of very deep continental rootsextending into the TZ. Deuss and Woodhouse (2001) reportedsplitting of the 520-km discontinuity into two discontinuities,whereas Bock (1994) denied evidence for the 520-km discontinuityin precursors to SS.
Our observations suggest that the 520-km discontinuity may bethe base of the low velocity layer in the upper transition zone: the re-lated seismic signals are comparable in amplitude with those from the410-km and 660-km discontinuities, its depth is close to 520 km, andits presence varies on a regional scale.
Acknowledgments
This study was funded by CV-PLUME project (Ref. PTDC/CTE-GIN/64330/2006) and by COBO project GDSS, GFZ-Potsdam. It was partial-ly supported by Pest-OE/CTE/LA0019/2011 — IDL. The instruments forthe 2009 deployment were provided by the Geophysical InstrumentPool Potsdam. We thank IRIS DMC for recordings of the permanent sta-tion SACV and of the temporary network YW-Cape Verde Mantle Struc-ture. The authors appreciate discussion with Sergio Speziale and helpfulcomments of two reviewers. L. Vinnik and S. Kiselev were partially sup-ported by RFBR grant 10-05-00879.
10 and 660 peaks (right-hand side), adopted from Fig. 4 of Helffrich et al. (2010). Origin

Fig. 10. S velocity profile of the transition zone beneath the Azores (left-hand side). The related synthetic Ps phase, the observed Ps phases from station CMLA on the Azores andfrom Fig. 3e are shown on the right-hand side. The data for the Azores are adopted from Silveira et al. (2010). Note the striking similarity between the observed Ps phases on theAzores and Cape Verde islands.
267L. Vinnik et al. / Earth and Planetary Science Letters 319-320 (2012) 259–268
Appendix A. Supplementary data
Supplementary data to this article can be found online at doi:10.1016/j.epsl.2011.12.017.
References
Anderson, D.L., 2010. Hawaii, boundary layers and ambient mantle—geophysical con-straints. J. Petrol. 52 (7–8), 1547–1577. doi:10.1093/petrology/egq068.
Birch, F., 1961. The velocity of compressional waves in rocks to 10 kilobars. Part 2. J.Geophys. Res. 66, 2199–2224.
Biswas, N.N., 1972. Earth-flattening procedure for the propagation of Rayleigh waves.Pure Appl. Geophys. 96, 61–74.
Bock, G., 1994. Synthetic seismogram images of upper mantle structure: no evidencefor a 520-km discontinuity. J. Geophys. Res. 99, 15843–15851.
Budweg, M., Bock, G., Weber, M., 2006. The Eifel Plume-imaged with converted seismicwaves. Geophys. J. Int. 166, 579–589.
Chevrot, S., Vinnik, L., Montagner, J.-P., 1999. Global scale analysis of the mantle Pdsphases. J. Geophys. Res. 104B, 20,203–20,219.
Christensen, N.I., 1996. Poisson's ratio and crustal seismology. J. Geophys. Res. 101,3139–3156.
Courtillot, V., Davaille, A., Besse, J., Stock, J., 2003. Three distinct types of hotspots in theEarth's mantle. Earth Planet. Sci. Lett. 205 (3–4), 295–308.
Courtney, R.C., White, R.S., 1986. Anomalous heat flow across the Cape Verde Rise: ev-idence for a thermal plume in the Earth's mantle. J. R. Astron. Soc. 87, 815–869.
Davaille, A., Stutzmann, E., Silveira, G., Besse, J., Courtillot, V., 2005. Convective patternsunder the Indo-Atlantic “box”. Earth Planet. Sci. Lett. 239 (3–4), 233–252.
Deuss, A., 2007. Seismic observations of transition-zone discontinuities beneath hot-spot locations. In: Foulger, G.R., Jurdy, D.M. (Eds.), Plates, Plumes, and PlanetaryProcesses: Geological Society of America, Special Papers, 430, pp. 121–131.
Deuss, A., Woodhouse, J., 2001. Seismic observations of splitting of the mid-transitionzone discontinuity in Earth's mantle. Science 294 (5541), 354–357.
Doglioni, C., Green, D., Mongelli, F., 2005. On the shallow origin of ‘hotspots’ and thewestward drift of the lithosphere. In: Foulger, G.R., Natland, J.H., Presnall, D.C., An-derson, D.L. (Eds.), Plates, Plumes, and Paradigms: Geological Society of America,Special Papers, 388, pp. 733–749.
Du, Z., Vinnik, L.P., Foulger, G.R., 2006. Evidence from P-to-S mantle converted wavesfor a flat 660-km discontinuity beneath Iceland. Earth Planet. Sci. Lett. 241,271–280.
Farra, V., Vinnik, L., 2000. Upper mantle stratification by P and S receiver functions.Geophys. J. Int. 141, 699–712.
Flanagan, M.P., Shearer, P.M., 1998. Global mapping of topography of transition zonevelocity discontinuities by stacking SS precursors. J. Geophys. Res. 103, 2673–2692.
Forte, A.M., Quere, S., Moucha, R., Simmons, N.A., Grand, S.P., Mitrovica, J.X., Rowly, D.B.,2010. Joint seismic–geodynamic-mineral physical modeling of African geody-namics: a reconciliation of deep-mantle convection with surface geophysical con-straints. Earth Planet. Sci. Lett. 295 (3–4), 329–341.
Gaherty, J.B., Jordan, T.H., Gee, L.S., 1996. Seismic structure of the upper mantle in acentral Pacific corridor. J. Geophys. Res. 101 (B10), 22291–22309. doi:10.1029/96JB01882.
Gripp, A.E., Gordon, R.G., 2002. Young tracks of hotspots and current plate velocities.Geophys. J. Int. 150, 321–361. doi:10.1046/j.1365-246X.2002.01627.x.
Gu, Y.J., Dziewonski, A.M., Agee, C.B., 1998. Global de-correlation of the topography oftransition zone discontinuities. Earth Planet. Sci. Lett. 157, 57–67.
Haskell, N.A., 1962. Crustal reflection of plane P and SV waves. J. Geophys. Res. 67,4751–4767.
Helffrich, G., Faria, B., Fonseca, J.F.B.D., Lodge, A., Kaneshima, S., 2010. Transition zonestructure under a stationary hot spot: Cape Verde. Earth Planet. Sci. Lett. 289(1–2), 156–161.
Hirose, K., 2002. Phase transitions in pyrolitic mantle around 670-km depth: implica-tions for upwelling of plumes from the lower mantle. J. Geophys. Res. 107 (B4),2078. doi:10.1029/2001JB000597.
Holm, P.M., Grandvuinet, T., Friis, J., Wilson, J.R., Barker, A.K., Plesner, S., 2008. An40Ar–39Ar study of the Cape Verde hot spot: temporal evolution in a semi-stationary plate environment. J. Geophys. Res. 113, B08201. doi:10.1029/2007/JB005339.
Kennett, B., Engdahl, E.R., 1991. Travel times for global earthquake location and phaseidentification. Geophys. J. Int. 105, 429–465.
Keshav, S., Gudfinnsson, G.H., Presnall, D.C., 2011. Melting phase relations of simplifiedcarbonated peridotite at 12–26 GPa in the systems CaO–MgO–SiO2–CO2 and CaO–MgO–Al2O3–SiO2–CO2: highly calcic magmas in the transition zone of the Earth. J.Petrol. 52, 2265–2291.
Kiselev, S., Vinnik, L., Oreshin, S., Gupta, S., Rai, S.S., Singh, A., Kumar, M.R., Mohan, G.,2008. Lithosphere of the Dharwar craton by joint inversion of P and S receiverfunctions. Geophys. J. Int. 173, 1106–1118. doi:10.1111/j1365-246X.2008.03777.x.
Leahy, G.M., Park, J., 2005. Hunting for oceanic island Moho. Geophys. J. Int. 160 (3),1020–1026.
Lodge, A., Helffrich, G., 2006. Depleted swell root beneath the Cape Verde Islands. Ge-ology 36 (6), 449–452. doi:10.1130/G22030.
Monnereau, M., Casenave, A., 2000. Depth and geoid anomalies over oceanic hotspotswells: a global survey. J. Geophys. Res. 95, 15429–15438.
Montelli, R., Nolet, G., Dahlen, F.A., Masters, G., 2006. A catalogue of deep mantleplumes: new results from finite-frequency tomography. Geochem. Geophys. Geo-syst. 7 (Q11007), 69. doi:10.1029/2006GC001248.

268 L. Vinnik et al. / Earth and Planetary Science Letters 319-320 (2012) 259–268
Morgan, W.J., 1971. Convection plumes in the lower mantle. Nature 230, 42–43.Mosegaard, K., Vestergaard, P.D., 1991. A simulated annealing approach to seismic
model optimization with sparse prior information. Geophys. Prospect. 39, 599–611.Nolet, G., Karato, S.-I., Montelli, R., 2006. Plume fluxrs from seismic tomography. Earth
Planet. Sci. Lett. 248 (3–4), 685–699.O'Hara, M.J., 1975. Is there an Icelandic plume? Nature 253, 708–710.Pim, J., Peirce, C., Watts, A.B., Grevemeyer, I., Krabbenhoeft, A., 2008. Crustal structure
and origin of the Cape Verde Rise. Earth Planet. Sci. Lett. 272 (1–2), 422–428.Revenaugh, J., Jordan, T., 1991. Mantle layering from ScS reverberatios 1. Waveform in-
version of zeroth-order reverberations. J. Geophys. Res. 96 (B12), 19749–19762.Ritsema, J., Allen, R.M., 2003. The elusive mantle plumes. Earth Planet. Sci. Lett. 207,
1–12. doi:10.1016/S0012-821X(02)01093-2.Ryberg, T., Wenzel, F., Egorkin, A.V., Solodilov, L., 1997. Short-period observation of the
520 km discontinuity in northern Eurasia. J. Geophys. Res. 102 (B3), 5413–5422.Silveira, G., Stutzmann, E., Davaille, A., Montagner, J.-P., Mendes-Victor, L., Sebai, A.,
2006. Azores hotspot signature in the upper mantle. J. Volcanol. Geotherm. Res.156 (1–2), 23–34.
Silveira, G., Vinnik, L., Stutzmann, E., Farra, V., Kiselev, S., Morais, I., 2010. Stratificationof the Earth beneath the Azores from P and S receiver functions. Earth Planet. Sci.Lett. 299, 91–103.
Solheim, L.P., Peltier, W.R., 1994. Phase boundary deflections at 660-km depth and ep-isodically layered isochemical convection in the mantle. J. Geophys. Res. 99 (B8),15861–15875.
Tauzin, B., Debayle, E., Wittlinger, G., 2008. The mantle transition zone as seen by glob-al Pds phases: no clear evidence for a thin transition zone beneath hotspots. J. Geo-phys. Res. 113, B08309. doi:10.1029/2007/B005364.
Vinnik, L., 1977. Detection of waves converted from P to SV in the mantle. Phys. EarthPlanet. Inter. 15, 39–45.
Vinnik, L., Farra, V., 2006. S velocity reversal in the mantle transition zone. Geophys.Res. Lett. 33, L18316. doi:10.1029/2006GL027120.
Vinnik, L.P., Reigber, Ch., Aleshin, I.M., Kosarev, G.L., Kaban, M.K., Oreshin, S.I., Roecker,S.W., 2004. Receiver function tomography of the central Tien Shan. Earth Planet.Sci. Lett. 225 (1–2), 131–146.
Vinnik, L., Ren, Y., Stutzmann, E., Farra, V., Kiselev, S., 2010. Observations of S410p andS350p phases at seismograph stations in California. J. Geophys. Res. 115, B05303.doi:10.1029/2009JB006582.
White, R.S., McKenzie, D., O'Nions, R.K., 1992. Oceanic crustal thickness fromseismic measurements and rare earth elements. J. Geophys. Res. 97 (B13),19,683–19,715.