earth observation big data analytics in operating mode for
TRANSCRIPT

HAL Id: hal-01958406https://hal.univ-reunion.fr/hal-01958406
Submitted on 12 Apr 2019
HAL is a multi-disciplinary open accessarchive for the deposit and dissemination of sci-entific research documents, whether they are pub-lished or not. The documents may come fromteaching and research institutions in France orabroad, or from public or private research centers.
L’archive ouverte pluridisciplinaire HAL, estdestinée au dépôt et à la diffusion de documentsscientifiques de niveau recherche, publiés ou non,émanant des établissements d’enseignement et derecherche français ou étrangers, des laboratoirespublics ou privés.
Earth observation big data analytics in operating modefor GIScience applications. The (GE)OBIA acronym(s)
reconsideredAndrea Baraldi, Stefan Lang, Dirk Tiede, Thomas Blaschke
To cite this version:Andrea Baraldi, Stefan Lang, Dirk Tiede, Thomas Blaschke. Earth observation big data analytics inoperating mode for GIScience applications. The (GE)OBIA acronym(s) reconsidered. GEOBIA 2018 -From pixels to ecosystems and global sustainability , Centre d’Etudes Spatiales de la BIOsphère (CES-BIO); Office national d’études et de recherches aérospatiales (ONERA); Espace pour le développement(ESPACE DEV); UMR TETIS, Jun 2018, Montpellier, France. �hal-01958406�

GEOBIA'2018 – Montpellier, 18-22 June, 2018
Earth observation big data analytics in
operating mode for GIScience applications
– The (GE)OBIA acronym(s) reconsidered
Andrea Baraldi1,2,*
, Stefan Lang1, Dirk Tiede
1, and Thomas
Blaschke1
1. Department of Geoinformatics – Z_GIS, University of Salzburg
Schillerstr. 30, 5020 Salzburg, Austria
2. Italian Space Agency (ASI), Via del Politecnico, 00133 Roma RM, Italy
* Correspondence: [email protected]
ABSTRACT. Pre-dated by spatial context-sensitive image classification algorithms, developed
by the remote sensing (RS) and computer vision (CV) communities as viable alternatives to
traditional pixel-based image analysis since the late ‘70s, in year 2006 the geographic
information science (GIScience) community introduced terms “object-based image analysis”
(OBIA) and geographic OBIA (GEOBIA) to “bridge the gap between geographic information
systems (GIS) and RS”. Following year 2000, two driving forces working in closed-loop
fostered the emergence of a GEOBIA subfield within the GIScience community. On the one
hand, a portion of the GIScience community adopted de-facto the eCognition commercial
image processing software toolbox, brought to market in year 2000, as a CV system reference
standard. On the other hand, the GIScience community lacked communication with the multi-
disciplinary realm of cognitive science, encompassing philosophy, psychophysics,
neouroscience, machine learning-from-data, artificial general intelligence (AGI), which
includes CV as superset of Earth observation (EO) image understanding, and GIScience. One
fundamental proof of the self-referential syndrome affecting the GEOBIA community is that,
to date, the mainstream RS and CV solutions ignore standard GEOBIA algorithms and vice
versa. Unequivocal true-facts about biological vision and primate visual perception
recommend reconsidering the relevance of acronyms OBIA/GEOBIA. Acknowledged that
“science progresses one funeral at a time”, to successfully cope with EO big data analytics
characterized by the five Vs of volume, velocity, variety, veracity and value, the GEOBIA
community is wished to gather sufficient intellectual fortitude to change its own name into a
more exact one, such as EO for GIScience (EO4GEO), meaning EO big data analytics in
operating mode for GIScience applications, constrained by 2D (retinotopic, spatial topology-
preserving) image analysis in cognitive science (2D-EO4GEO).
KEYWORDS: hybrid (combined deductive and inductive) inference, object-based image
analysis (OBIA), physical and statistical data models, radiometric calibration, spatial
topological and spatial non-topological information components, vision, world model.

2 GEOBIA'2018
1. Introduction
Synonym of scene-from-image reconstruction and understanding, vision is an
inherently ill-posed cognitive (information-as-data-interpretation) problem
(Capurro and Hjørland, 2003), see Figure 1. Encompassing both biological vision
and computer vision (CV), vision is inherently ill-posed because affected by: (I) a
data dimensionality reduction, from the 4D space-time scene-domain to the (2D)
image-domain, and (II) a semantic information gap from ever-varying sensory data
(sensations) in the image-domain to stable percepts in the mental model of the
world-scene (conceptual world model) (Matsuyama and Hwang, 1990). Hence,
vision is very difficult to solve. It is non-polynomial hard (NP-hard) in
computational complexity (Frintrop, 2011; Tsotsos, 1990) and requires a priori
knowledge in addition to sensory data to become better conditioned for numerical
solution (Cherkassky and Mulier, 1998).
FIGURE 1. Vision is synonym of scene-from-image reconstruction and understanding.
This is an inherently ill-posed cognitive problem, non-polynomial (NP)-hard in
computational complexity and requiring a priori knowledge in addition to sensory
data to become better conditioned for numerical solution. Vision is inherently ill-
posed in the Hadamard sense because it is affected by: (i) a 4D-to-2D data
dimensionality reduction problem from the spatiotemporal 4D world-domain to the
(2D) image-domain, e.g., responsible of visual occlusion phenomena; (ii) a semantic
information gap, from ever-varying sensory data (sensations) in the (2D) image-
domain to stable concepts (percepts) in the 4D scene-domain.
In a Bayesian approach to vision, Bayesian priors, also known as Marr’s
constraints (Marr, 1982; Quinlan, 2012), have been incorporated into the human

The (GE)OBIA acronym(s) reconsidered 3
visual system over the course of its evolutionary history (Poggio, 2012). For
example, in biological vision, panchromatic and chromatic image understandings are
nearly as effective. It means that spatial information typically dominates color
information in vision (Matsuyama and Hwang, 1990). Hence, one possible
constraint eligible for use by inherently ill-posed CV systems to become better
conditioned for numerical solution is to perform nearly as well when input with
panchromatic and chromatic imagery, whose necessary not sufficient pre-condition
is exploitation of primary spatial information in addition to secondary color
information. Noteworthy, color information is the sole visual information
component available at sensor (pixel) resolution. The undisputable true-fact that, in
vision, spatial information dominates color information is foundational for the
“object-based image analysis” (OBIA) and geographic OBIA (GEOBIA) paradigm
(Benz et al., 2004; Blaschke and Lang, 2006; Blaschke et al., 2014; Hay and
Castilla, 2008; Lang and Blaschke, 2006), proposed as a spatial context-sensitive
CV solution alternative to traditional spatial context-insensitive (pixel-based) 1D
image analysis, where spatial topological and/or spatial non-topological information
components are totally ignored, see Figure 2.
FIGURE 2. Example of 1D image analysis, either spatial context-insensitive (pixel-
based) or spatial context-sensitive (e.g., local window-based). Synonym of 1D
analysis of a 2D gridded dataset, it is affected by spatial data dimensionality
reduction. The (2D) image at left is transformed into the 1D vector data stream
shown at bottom, where vector data are either pixel-based or spatial context-
sensitive, e.g., local window-based. This 1D vector data stream, either pixel-based
or local window-based, means nothing to a human photointerpreter. When it is input
to a traditional inductive data learning classifier, such as a Support Vector Machine
(SVM) or Random Forest (RF), this 1D vector data stream is what the inductive
classifier actually sees when watching the (2D) image at left. Undoubtedly,
computers are more successful than humans in 1D image analysis, invariant to
permutations in the input vector data sequence, such as in orderless pooling
encoders (Cimpoi et al., 2014). Nonetheless, humans are still far more successful
than computers in 2D image analysis, synonym of spatial topology-preserving

4 GEOBIA'2018
(retinotopic) image analysis (Tsotsos, 1990), sensitive to permutations in the input
vector data sequence, such as in order-sensitive pooling encoders (Cimpoi et al.,
2014).
As an instance of cognitive tasks, vision is investigated by the multi-disciplinary
realm of cognitive science, encompassing philosophy, psychophysics,
neouroscience, machine learning-from-data, artificial general intelligence (AGI),
which includes CV as superset of Earth observation (EO) image pre-processing and
understanding (IU), i.e., CV EO-IU, and geographic information science
(GIScience), see Figure 3.
FIGURE 3. Cognitive science is the interdisciplinary scientific study of the mind and
its processes. It examines what cognition (learning) is, what it does and how it
works. It especially focuses on how information/knowledge is represented, acquired,
processed and transferred within nervous systems (distributed processing systems in
humans, such as the human brain, or other animals) and machines (e.g., computers).
Neurophysiology studies nervous systems, including the brain. Human vision is
expected to work as lower bound of computer vision (CV), i.e., ‘human vision
(part-of) CV’, such that inherently ill-posed CV is required to comply with human
visual perception phenomena to become better conditioned for numerical solution.
The development of artificial satellites in the latter half of the 20th century
allowed remote sensing (RS) in general, and EO-IU in particular, to progress to a
global scale by the end of the Cold War. Ever since, EO-IU CV applications have
been a typical example of big data analytics, well before term “big data”, associated
with the five Vs of volume, velocity, variety, veracity and value (Yang et al., 2017),
became increasingly popular with the diffusion of the world wide web, starting from
the ‘90s. In recent decades, spaceborne/airborne EO imagery has been increasingly
adopted as a relevant sensory data source in GIScience applications at large spatial
extents, from regional to world scale, due to high-frequency data acquisition, coarse-

The (GE)OBIA acronym(s) reconsidered 5
to-fine spatial resolution, low costs for data purchase or free-of-cost data policies,
and ever-decreasing costs in storage and processing.
Pre-dated by spatial context-sensitive image classification algorithms developed
by the RS and CV communities as viable alternatives to traditional pixel-based
image analysis since the late ‘70s (Haralick and Shapiro, 1985; Horowitz and
Pavlidis, 1974, Ketting and Landgrebe, 1976; Matsuyama and Hwang, 1990; Nagao
and Matsuyama, 1980; Ohlander et al., 1978), in year 2006 the GIScience
community introduced terms “object-based image analysis” (OBIA) and geographic
OBIA (GEOBIA) to “bridge the gap between geographic information systems (GIS)
and RS” (Benz et al., 2004; Blaschke and Lang, 2006; Blaschke et al., 2014; Hay
and Castilla, 2008; Lang and Blaschke, 2006). Following year 2000, two driving
forces working in closed-loop fostered the emergence of a GEOBIA subfield within
the GIScience community. On the one hand, a portion of the GIScience community
adopted de-facto the eCognition commercial image processing software toolbox,
brought to market in year 2000, as a CV system reference standard (Trimble, 2015).
On the other hand, the GIScience community lacked communication with the RS
and CV communities within the multi-disciplinary realm of cognitive science, see
Figure 3.
FIGURE 4. Mach bands illusion. In black: Ramp in luminance units across space.
In red: Brightness (perceived luminance) across space. One of the best-known
brightness illusions is the psychophysical phenomenon of the Mach bands: where a
luminance (radiance, intensity) ramp meets a plateau, there are spikes of brightness,
although there is no discontinuity in the luminance profile. Hence, human vision
detects two boundaries, one at the beginning and one at the end of the ramp in
luminance. Since there is no discontinuity in luminance where brightness is spiking,
the Mach bands effect is called a visual “illusion”. Along a ramp, no image-contour
is perceived by human vision, irrespective of the ramp’s local contrast (gradient) in
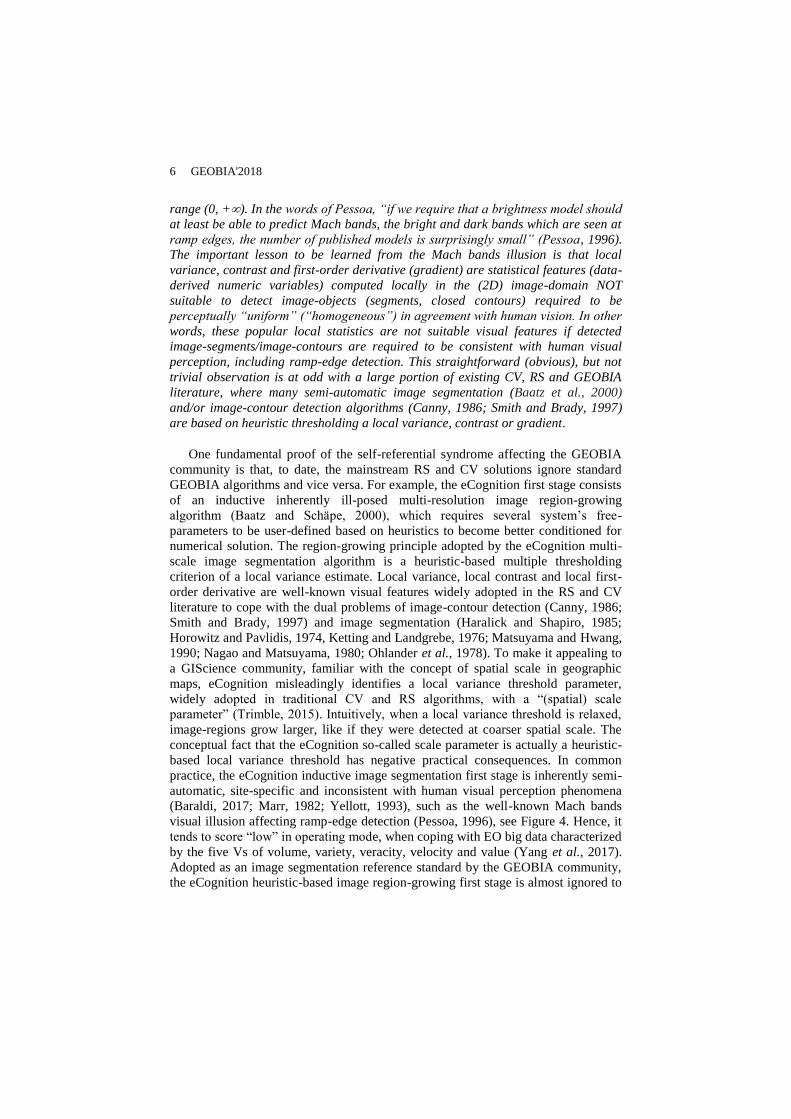
6 GEOBIA'2018
range (0, +). In the words of Pessoa, “if we require that a brightness model should
at least be able to predict Mach bands, the bright and dark bands which are seen at
ramp edges, the number of published models is surprisingly small” (Pessoa, 1996).
The important lesson to be learned from the Mach bands illusion is that local
variance, contrast and first-order derivative (gradient) are statistical features (data-
derived numeric variables) computed locally in the (2D) image-domain NOT
suitable to detect image-objects (segments, closed contours) required to be
perceptually “uniform” (“homogeneous”) in agreement with human vision. In other
words, these popular local statistics are not suitable visual features if detected
image-segments/image-contours are required to be consistent with human visual
perception, including ramp-edge detection. This straightforward (obvious), but not
trivial observation is at odd with a large portion of existing CV, RS and GEOBIA
literature, where many semi-automatic image segmentation (Baatz et al., 2000)
and/or image-contour detection algorithms (Canny, 1986; Smith and Brady, 1997)
are based on heuristic thresholding a local variance, contrast or gradient.
One fundamental proof of the self-referential syndrome affecting the GEOBIA
community is that, to date, the mainstream RS and CV solutions ignore standard
GEOBIA algorithms and vice versa. For example, the eCognition first stage consists
of an inductive inherently ill-posed multi-resolution image region-growing
algorithm (Baatz and Schäpe, 2000), which requires several system’s free-
parameters to be user-defined based on heuristics to become better conditioned for
numerical solution. The region-growing principle adopted by the eCognition multi-
scale image segmentation algorithm is a heuristic-based multiple thresholding
criterion of a local variance estimate. Local variance, local contrast and local first-
order derivative are well-known visual features widely adopted in the RS and CV
literature to cope with the dual problems of image-contour detection (Canny, 1986;
Smith and Brady, 1997) and image segmentation (Haralick and Shapiro, 1985;
Horowitz and Pavlidis, 1974, Ketting and Landgrebe, 1976; Matsuyama and Hwang,
1990; Nagao and Matsuyama, 1980; Ohlander et al., 1978). To make it appealing to
a GIScience community, familiar with the concept of spatial scale in geographic
maps, eCognition misleadingly identifies a local variance threshold parameter,
widely adopted in traditional CV and RS algorithms, with a “(spatial) scale
parameter” (Trimble, 2015). Intuitively, when a local variance threshold is relaxed,
image-regions grow larger, like if they were detected at coarser spatial scale. The
conceptual fact that the eCognition so-called scale parameter is actually a heuristic-
based local variance threshold has negative practical consequences. In common
practice, the eCognition inductive image segmentation first stage is inherently semi-
automatic, site-specific and inconsistent with human visual perception phenomena
(Baraldi, 2017; Marr, 1982; Yellott, 1993), such as the well-known Mach bands
visual illusion affecting ramp-edge detection (Pessoa, 1996), see Figure 4. Hence, it
tends to score “low” in operating mode, when coping with EO big data characterized
by the five Vs of volume, variety, veracity, velocity and value (Yang et al., 2017).
Adopted as an image segmentation reference standard by the GEOBIA community,
the eCognition heuristic-based image region-growing first stage is almost ignored to

The (GE)OBIA acronym(s) reconsidered 7
date by the RS and CV communities when involved with low-level image
segmentation tasks.
In the rest of this work, a CV EO-IU system (see Figure 3) is defined in
operating mode if and only if it scores “high” in all indexes belonging to a
minimally dependent and maximally informative (mDMI) set of EO outcome and
process (OP) quantitative quality indicators (Q2Is), to be community-agreed upon to
be used by members of the community, in agreement with the intergovernmental
Group on Earth Observations (GEO)-Committee on Earth Observation Satellites
(CEOS) Quality Accuracy Framework for Earth Observation (QA4EO)
calibration/validation (Cal/Val) guidelines (GEO-CEOS, 2010). A proposed
instantiation of an mDMI set of EO OP-Q2Is includes (Baraldi, 2017): (i) degree of
automation, inversely related to human-machine interaction, (ii) effectiveness, e.g.,
thematic mapping accuracy, (iii) efficiency in computation time and in run-time
memory occupation, (iv) robustness (vice versa, sensitivity) to changes in input data,
(v) robustness to changes in input parameters to be user-defined, (vi) scalability to
changes in user requirements and in sensor specifications, (vii) timeliness from data
acquisition to information product generation, (viii) costs in manpower and
computer power, (ix) value, e.g., semantic value of output products, economic value
of output services, etc.
FIGURE 5. 2D image analysis, synonym of spatial topology-preserving (retinotopic)
feature mapping in a (2D) image-domain (Tsotsos, 1990). Activation domains of
physically adjacent processing units in the 2D array of convolutional spatial filters
are spatially adjacent regions in the 2D visual field. Provided with a superior
degree of biological plausibility in modelling 2D spatial topological and spatial
non-topological information, distributed processing systems capable of 2D image
analysis, such as deep convolutional neural networks (DCNNs), typically
outperform traditional 1D image analysis approaches. Will computers become as
good as humans in 2D image analysis?

8 GEOBIA'2018
A reverse case proving the relative isolation of the GEOBIA community is the
recent hype on deep convolutional neural networks (DCNNs), which has been
spreading from the CV to the RS community, without affecting the GEOBIA
subfield, yet. Provided with a superior degree of biological plausibility in modelling
2D spatial topological and spatial non-topological information (Tsotsos, 1990),
distributed processing systems capable of 2D image analysis, such as DCNNs and
order-sensitive pooling encoders (Cimpoi et al., 2014), see Figure 5, are sensitive to
changes in the order of presentation of the input sequence, i.e., they are sensitive to
permutations in the input data set. 2D image analysis algorithms typically
outperform traditional 1D image analysis approaches, either spatial context-
dependent (e.g., window-based, image-object-based) or spatial context-independent
(pixel-based), insensitive to permutations in the 1D input vector data sequence, see
Figure 2. Typical examples of 1D image analysis approaches are orderless pooling
encoders (Cimpoi et al., 2014) together with a great portion of GEOBIA solutions
where an image segmentation first stage, followed by a per-segment shape and color
feature extraction, is input as 1D vector data sequence to a vector data classifier,
such as a plug-in maximum likelihood (ML) classifier or an inductive learning-
from-data multi-layer perceptron (MLP), support vector machine (SVM) or random
forest (RF) (Cherkassky and Mulier, 1998), where spatial topological information is
ignored, see Figure 2.
FIGURE 6. Approximating receptive fields (RF) of single-opponent cells (Type I),
double-opponent cells (Type II) and achromatic Type III visual cells with Gabor
wavelet filters (Jain and Healey, 1986; Marr, 1982; Baraldi, 2017). These trimodal
2D wavelet-based spatial filters are necessary and sufficient to accomplish: (i)
automated panchromatic and chromatic image-contour detection as zero-crossings
(spatial changes in sign) of a second-order derivative of a local Gaussian function
(low-pass filter), equivalent to a local concavity estimator, (ii) well-posed
(deterministic) image segmentation (superpixel detection, texel detection) from
image-contours, see Figure 7, and (iii) texture segmentation from texels based on
third-order spatial autocorrelation statistics (Baraldi, 2017; Yellott, 1993), in
agreement with the Marr’s raw and full primal sketch in low-level vision (Marr,
1982).

The (GE)OBIA acronym(s) reconsidered 9
In addition to failing to communicate with each other, the GEOBIA, RS and CV
communities typically share little or no knowledge about cognitive science in
general, see Figure 3, encompassing biological vision (Hubel and Wiesel, 1959;
Kandel and Schwartz, 1991; Jain and Healey, 1998; DiCarlo, 2017), see Figure 6
and Figure 7, and primate visual perception (Baraldi, 2017; Marr, 1982; Pessoa,
1990; Vecera and Farah, 1997), see Figure 4. As a consequence, inherently ill-posed
CV systems typically rely on heuristics rather than complying with human visual
perception phenomena to become better conditioned for numerical solution, so that
‘human vision (part-of) CV’, see Figure 3. In the words of Iqbal and Aggarwal:
“frequently, no claim is made about the pertinence or adequacy of the digital models
as embodied by computer algorithms to the proper model of human visual
perception... This enigmatic situation arises because research and development in
computer vision is often considered quite separate from research into the functioning
of human vision. A fact that is generally ignored is that biological vision is currently
the only measure of the incompleteness of the current stage of computer vision, and
illustrates that the problem is still open to solution” (Iqbal and Aggarwal, 2001).
(a) (b) (c)
(d) (e)

10 GEOBIA'2018
(f) (g) (h)
(i) (l)
(m) (m) (o)
(p) (q)
The (GE)OBIA acronym(s) reconsidered 11
(r) (s) (t)
(u) (v)
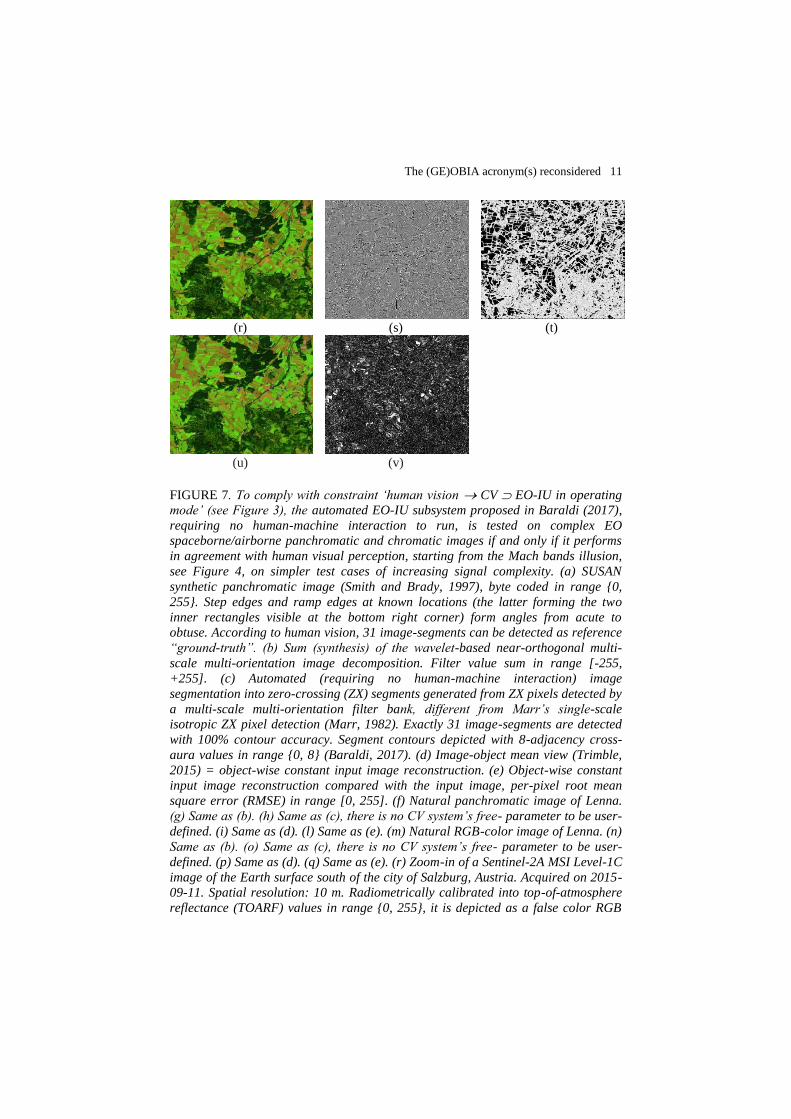
FIGURE 7. To comply with constraint ‘human vision CV EO-IU in operating
mode’ (see Figure 3), the automated EO-IU subsystem proposed in Baraldi (2017),
requiring no human-machine interaction to run, is tested on complex EO
spaceborne/airborne panchromatic and chromatic images if and only if it performs
in agreement with human visual perception, starting from the Mach bands illusion,
see Figure 4, on simpler test cases of increasing signal complexity. (a) SUSAN
synthetic panchromatic image (Smith and Brady, 1997), byte coded in range {0,
255}. Step edges and ramp edges at known locations (the latter forming the two
inner rectangles visible at the bottom right corner) form angles from acute to
obtuse. According to human vision, 31 image-segments can be detected as reference
“ground-truth”. (b) Sum (synthesis) of the wavelet-based near-orthogonal multi-
scale multi-orientation image decomposition. Filter value sum in range [-255,
+255]. (c) Automated (requiring no human-machine interaction) image
segmentation into zero-crossing (ZX) segments generated from ZX pixels detected by
a multi-scale multi-orientation filter bank, different from Marr’s single-scale
isotropic ZX pixel detection (Marr, 1982). Exactly 31 image-segments are detected
with 100% contour accuracy. Segment contours depicted with 8-adjacency cross-
aura values in range {0, 8} (Baraldi, 2017). (d) Image-object mean view (Trimble,
2015) = object-wise constant input image reconstruction. (e) Object-wise constant
input image reconstruction compared with the input image, per-pixel root mean
square error (RMSE) in range [0, 255]. (f) Natural panchromatic image of Lenna.
(g) Same as (b). (h) Same as (c), there is no CV system’s free- parameter to be user-
defined. (i) Same as (d). (l) Same as (e). (m) Natural RGB-color image of Lenna. (n)
Same as (b). (o) Same as (c), there is no CV system’s free- parameter to be user-
defined. (p) Same as (d). (q) Same as (e). (r) Zoom-in of a Sentinel-2A MSI Level-1C
image of the Earth surface south of the city of Salzburg, Austria. Acquired on 2015-
09-11. Spatial resolution: 10 m. Radiometrically calibrated into top-of-atmosphere
reflectance (TOARF) values in range {0, 255}, it is depicted as a false color RGB

12 GEOBIA'2018
image, where: R = Medium InfraRed (MIR) = Band 11, G = Near IR (NIR) = Band
8, B = Blue = Band 2. Standard ENVI histogram stretching applied for visualization
purposes. (s) Same as (b). (t) Same as (c), there is no CV system’s free- parameter to
be user-defined. (u) Same as (d). (v) Same as (e).
In line with the quote from Iqbal and Aggarwal and with Figure 3, Marcus states
“there is no need for machines to literally replicate the human mind… But there
remain many areas, from natural language understanding to commonsense
reasoning, in which humans still retain a clear advantage; learning the mechanisms
underlying those human strengths could lead to advances in AI, even if its goal is
not, and should not be, an exact replica of human brain. For many people, learning
from humans means neuroscience... We don’t yet know enough about neuroscience
to literally reverse engineer the brain... in the meantime, it should certainly be
possible to use techniques and insights drawn from cognitive science and
developmental psychology, now, in order to build more robust and comprehensive
AI, building models that are motivated not just by mathematics, but also by clues
from the strengths of human psychology.” (Marcus, 2018).
The rest of this paper is organized as follows. Stemming from preliminary
concepts, definitions and observations discussed in the present Chapter 1, a critical
appraisal of acronyms OBIA and GEOBIA is proposed in Chapter 2. In Chapter 3,
acknowledged that “science progresses one funeral at a time” (Axios, 2017), which
reduces the risk of getting trapped in a local minimum of a solution space, the
GEOBIA community is recommended to reconsider the relevance of acronyms
OBIA/GEOBIA when coping with the five Vs of volume, velocity, variety, veracity
and value characterizing EO big data analytics, It means the GEOBIA community is
encouraged to find the intellectual fortitude to change its name into a more exact
one.
2. Critical appraisal of acronyms OBIA and GEOBIA
Alternative to traditional pixel-based image analysis where spatial topological
and spatial non-topological information components are totally ignored, the
OBIA/GEOBIA paradigm (Benz et al., 2004; Blaschke and Lang, 2006; Blaschke et
al., 2014; Hay and Castilla, 2008; Lang and Blaschke, 2006) is founded upon the
unquestionable true-fact that spatial information dominates color information in
vision (Matsuyama and Hwang, 1990). Stemming from preliminary concepts,
definitions and observations proposed in Chapter 1, a first consideration is that
acronym OBIA is equivocal because word ‘object’ in vision may refer to either a
sub-symbolic planar object in the image-domain or a real-world symbolic object in
the 4D spatio-temporal scene-domain, see Figure 1. To avoid this ambiguity,
acronym OBIA should be reformulated as image-object-based image analysis,
synonym of “segment-based image-analysis” predated in the RS and CV literature
since the late ‘70s. Unfortunately, image-object-based image analysis is a tautology.
In primates, low-level image segmentation is pre-attentive, fast and parallel (Kandel
and Schwartz, 1991; Baraldi, 2017; DiCarlo, 2017). It is also known as raw primal
The (GE)OBIA acronym(s) reconsidered 13
sketch for token detection (Marr, 1982), where tokens include: (a) closed-contours
as texture elements (texels), to be input to a full primal sketch detector for texture
segmentation, and (b) keypoints (end-points, corners, T-junctions and X-junctions)
eligible for saliency map detection as input to an attentional high-level vision second
stage (Frintrop, 2011; Kandel and Schwartz, 1991; Baraldi, 2017). In the Marr
terminology, pre-attentional (low-level) image segmentation is followed by a pre-
attentional full primal sketch (Marr, 1982), known as texture segmentation (Yellott,
1993; Baraldi, 2017). In primate low-level vision, image segmentation is a hybrid
(combined deductive/top-down and inductive/bottom-up) inference process (Vecera
and Farah, 1997). In other words, there is no vision without image segmentation for
token detection and texture segmentation. Hence, OBIA as synonym of image-
object-based image analysis is a tautology, in contrast with spatial context-
insensitive (pixel-based) 1D image analysis.
A second critical consideration is that acronym GEOBIA, originally introduced
to emphasize EO-IU applications for GIScience, is erroneous, which means
misleading at best. If it reads as “image analysis based on geographic objects in the
image-domain”, then it is a contradiction in terms because no image-object in the
image-domain features geographic coordinates pertaining to the scene-domain. If it
reads as “image analysis based on geographic objects in the scene-domain”, then it
is a contradiction in terms because vision means scene-from-image reconstruction
and understanding and not vice versa, although psychophysics proved that vision
combines inductive/bottom-up with deductive/top-down inference (Vecera and
Farah, 1997).
A third critical consideration is that the OBIA/GEOBIA paradigm (Benz et al.,
2004; Blaschke and Lang, 2006; Blaschke et al., 2014; Hay and Castilla, 2008; Lang
and Blaschke, 2006) comprises a mandatory image segmentation first stage, but it
lacks spatial topology-preserving constrains to make an inherently ill-posed image-
object-based classification second stage better posed for numerical solution and
consistent with human visual perception. In the OBIA/GEOBIA paradigm, a second-
stage classifier was let free to be implemented as either (i) a 2D topology-preserving
image analysis approach, where primary spatial topological and spatial non-
topological information components are fully exploited together with secondary
color information, or (ii) a segment-specific 1D image analysis approach, which is
spatial topology-non-preserving. The latter is in contrast with the true-fact that
spatial information dominates color information in vision and with the well-known
fact that the brain’s organizing principle is topology-preserving feature mapping
(Feldman, 2016), including 30 visual areas or so in primates, e.g., V1, V2, V3, MT
and V4, with various degree of retinotopy (Tsotsos, 1990). Unfortunately, in the RS
common practice, the vagueness of the original OBIA/GEOBIA paradigm has
fostered the ever-increasing development by the GEOBIA community of “easy”
spatial context-sensitive 1D image analysis approaches, where spatial topological
information is completely ignored, see Figure 8, rather than urging the development
of “difficult” 2D image analysis approaches where primary spatial topological and
spatial non-topological information components are fully exploited together with
secondary color information, see Figure 7.
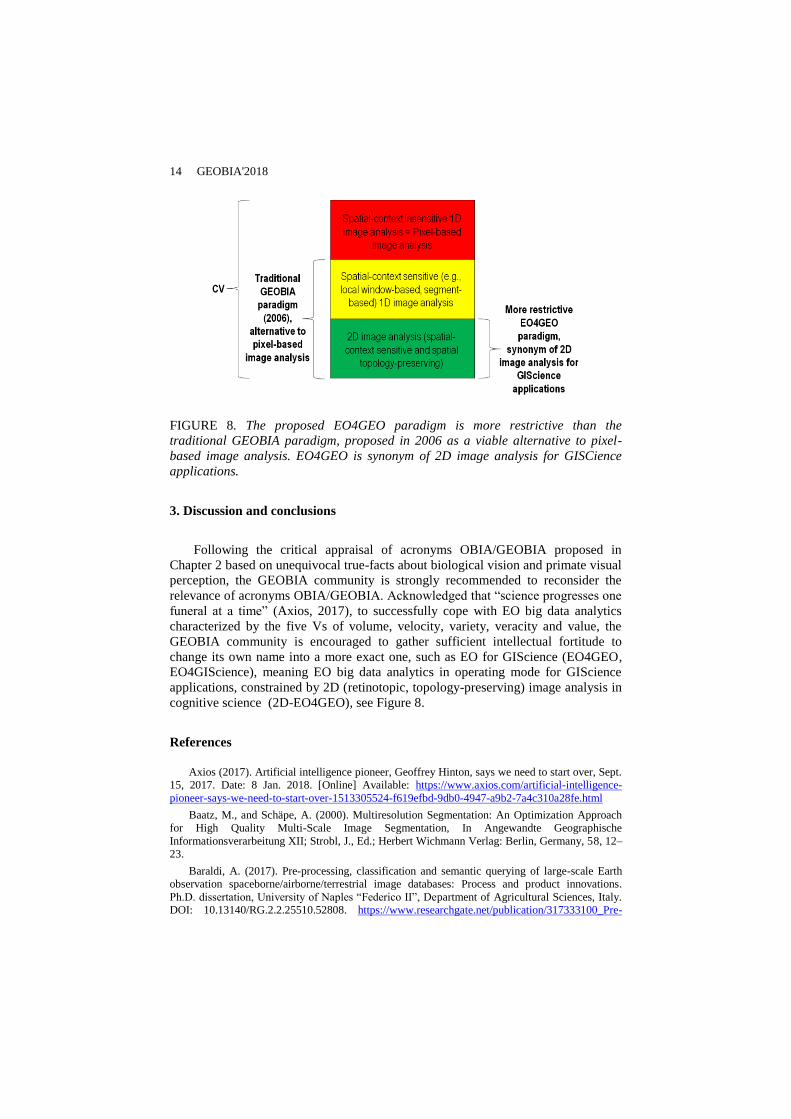
14 GEOBIA'2018
FIGURE 8. The proposed EO4GEO paradigm is more restrictive than the
traditional GEOBIA paradigm, proposed in 2006 as a viable alternative to pixel-
based image analysis. EO4GEO is synonym of 2D image analysis for GISCience
applications.
3. Discussion and conclusions
Following the critical appraisal of acronyms OBIA/GEOBIA proposed in
Chapter 2 based on unequivocal true-facts about biological vision and primate visual
perception, the GEOBIA community is strongly recommended to reconsider the
relevance of acronyms OBIA/GEOBIA. Acknowledged that “science progresses one
funeral at a time” (Axios, 2017), to successfully cope with EO big data analytics
characterized by the five Vs of volume, velocity, variety, veracity and value, the
GEOBIA community is encouraged to gather sufficient intellectual fortitude to
change its own name into a more exact one, such as EO for GIScience (EO4GEO,
EO4GIScience), meaning EO big data analytics in operating mode for GIScience
applications, constrained by 2D (retinotopic, topology-preserving) image analysis in
cognitive science (2D-EO4GEO), see Figure 8.
References
Axios (2017). Artificial intelligence pioneer, Geoffrey Hinton, says we need to start over, Sept.
15, 2017. Date: 8 Jan. 2018. [Online] Available: https://www.axios.com/artificial-intelligence-
pioneer-says-we-need-to-start-over-1513305524-f619efbd-9db0-4947-a9b2-7a4c310a28fe.html
Baatz, M., and Schäpe, A. (2000). Multiresolution Segmentation: An Optimization Approach
for High Quality Multi-Scale Image Segmentation, In Angewandte Geographische
Informationsverarbeitung XII; Strobl, J., Ed.; Herbert Wichmann Verlag: Berlin, Germany, 58, 12–
23.
Baraldi, A. (2017). Pre-processing, classification and semantic querying of large-scale Earth
observation spaceborne/airborne/terrestrial image databases: Process and product innovations.
Ph.D. dissertation, University of Naples “Federico II”, Department of Agricultural Sciences, Italy.
DOI: 10.13140/RG.2.2.25510.52808. https://www.researchgate.net/publication/317333100_Pre-

The (GE)OBIA acronym(s) reconsidered 15
processing_classification_and_semantic_querying_of_large-
scale_Earth_observation_spaceborneairborneterrestrial_image_databases_Process_and_product_in
novations
Benz, U., Hofmann, P., Willhauck, G., Lingerfelder, I. & Heynen, M. (2004). Multi-resolution,
object-oriented fuzzy analysis of remote sensing data for GIS-ready information. ISPRS
International Journal of Photogrammetry and Remote Sensing, 58, 239-258.
Blaschke, T., Hay, G. J., Kelly, M., Lang, S., Hofmann, P., Addink, E., Feitosa, R. Q., Van der
Meer, F., Van der Werff, H., Van Coillie, F. and Tiede, D. (2014). Geographic Object-based Image
Analysis: A new paradigm in Remote Sensing and Geographic Information Science. International
Journal of Photogrammetry and Remote Sensing, 87, 180-191.
Blaschke, T. and Lang, S. (2006). Object based image analysis for automated information
extraction-a synthesis. Measuring the Earth II ASPRS Fall Conference, 6-10.
Canny, J. (1986). A computational approach to edge detection. IEEE Trans. Pattern Anal.
Mach. Intell., 8(6): 679–698.
Capurro, R., and B. Hjørland. (2003). The concept of information.” Annual Review of
Information Science and Technology 37: 343-411.
Cimpoi M., Maji, S., Kokkinos, I., and Vedaldi. A. (2014). Deep filter banks for texture
recognition, description, and segmentation. CoRR, abs/1411.6836.
DiCarlo, J. (2017). Keynote: The Science of Natural intelligence: Reverse engineering primate
visual perception, CVPR17.
Feldman, J. (2016). The neural binding problem(s), Cogn. Neurodyn., 7, 1-11.
Frintrop, S. (2011). Computational visual attention, in Computer Analysis of Human Behavior,
Advances in Pattern Recognition, A. A. Salah and T. Gevers, Eds,. Springer.
Group on Earth Observation / Committee on Earth Observation Satellites (GEO-CEOS).
(2010). A Quality Assurance Framework for Earth Observation, version 4.0.
http://qa4eo.org/docs/QA4EO_Principles_v4.0.pdf
Hay, G. and Castilla, G. (2008). Geographic object-based image analysis (GEOBIA): a new
name for a new discipline. In: Blaschke, T., Lang, S. & Hay, G. (eds.) Object-based Image
Analysis: Spatial Concepts for Knowledge-driven Remote Sensing Applications. Berlin: Springer.
Haralick, R. and Shapiro, L. (1985). Image segmentation techniques, Comput. Vision, Graph.
Image Process. 29: 100-132.
Horowitz, S., and Pavlidis, T. (1974). Picture segmentation by a directed split and merge
procedure, Proc. ICPR, Denmark, pp.424-433.
Hubel, D., and Wiesel, T. (1959). Receptive fields of single neurons in the cat’s striate cortex,"
Journal of Physiology, vol. 148, pp. 574–591.
Iqbal, Q. and Aggarwal, J. K. (2001). Image retrieval via isotropic and anisotropic mappings, in
Proc. IAPR Workshop Pattern Recognit. Inf. Syst., Setubal, Portugal, Jul., 2001, pp. 34–49.
Jain, A., and Healey, G. (1998). A multiscale representation including opponent color features
for texture recognition," IEEE Trans. Image Proc. 7(1): 124-128.
Kandel, E., Schwartz, J., Eds. (1991). Principles of Neural Science, Appleton and Lange:
Norwalk, CT, USA; pp. 441–466.
Ketting, R. and Landgrebe, D. (1976). Classification of multispectral image data by extraction
and classification of homogeneous objects. IEEE Trans. Geosci. Electron. vol. GE-14, pp., 19-26.
Lang, S. and Blaschke, T. (2006). Bridging remote sensing and GIS–What are the main
supportive pillars? In: LANG, S., SCHÖPFER, E. & BLASCHKE, T., eds. Proceedings of the 1st
International Conference on Object-based Image Analysis, 2006 Salzburg. ISPRS, 4-5.
Marcus, G. (2018). Deep Learning: A Critical Appraisal. arXiv: 1801.00631. Accessed: 16
Jan., 2018. https://arxiv.org/ftp/arxiv/papers/1801/1801.00631.pdf

16 GEOBIA'2018
Matsuyama, T. and Hwang, V. (1990). SIGMA – A Knowledge-based Aerial Image
Understanding System. New York, NY: Plenum Press.
Cherkassky, V. and Mulier. F. (1998). Learning from Data: Concepts, Theory, and Methods.
New York, NY: Wiley.
Nagao, M. and Matsuyama, T. (1980). A structural analysis of complex aerial photographs,
New York, Plenum Press.
Ohlander, R., Price, K., Reddy Raj, D. (1978). Picture segmentation using a recursive region
splitting method, Computer Graphics and Image Processing. 8 (3): 313–333.
Pessoa, L. (1996). Mach Bands: How Many Models are Possible? Recent Experimental
Findings and Modeling Attempts. Vision Res., 36(19), 3205–3227.
Poggio, T. (2012). The Levels of Understanding framework, revised. Computer Science and
Artificial Intelligence Laboratory, Technical Report, MIT-CSAIL-TR-2012-014, CBCL-308.
Quinlan, P. (2012). Marr’s Vision 30 years on: From a personal point of view. Perception, 41:
1009 – 1012.
Smith, S. M. and Brady, J. M. (1997). SUSAN - a new approach to low level image processing.
Int. J. of Computer Vision, 23(1), 45--78.
Trimble (2015). eCognition® Developer 9.0 Reference Book.
Tsotsos, J. K. (1990). Analyzing vision at the complexity level. Behavioral and Brain Sciences
13: 423-469.
Vecera, S., and Farah, M. (1997). Is visual image segmentation a bottom-up or an interactive
process?. Percept. Psychophys., 59, 1280–1296.
Yang, C., Huang, Q., Li, Z., Liu K. & Hu, F. (2017). Big Data and cloud computing:
innovation opportunities and challenges, International Journal of Digital Earth. 10:1, 13-53, DOI:
10.1080/17538947.2016.1239771.
Yellott, J. (1993). Implications of triple correlation uniqueness for texture statistics and the
Julesz conjecture. Optical Society of America, 10(5), 777-793.