earth surface processes and landforms submerged bulk … 2005b.pdf · sampling sediment from the...
TRANSCRIPT

Submerged bulk and freeze-core samples 1405
Copyright © 2005 John Wiley & Sons, Ltd. Earth Surf. Process. Landforms 30, 1405–1417 (2005)
Earth Surface Processes and LandformsEarth Surf. Process. Landforms 30, 1405–1417 (2005)Published online 16 August 2005 in Wiley InterScience (www.interscience.wiley.com). DOI: 10.1002/esp.1202
Biases of submerged bulk and freeze-core samples†
André Zimmermann,1* Moise Coulombe-Pontbriand2 and Michel Lapointe3
1 Department of Geography, University of British Columbia, Vancouver, BC, Canada2 Recon Inc., Calgary, Alberta, Canada3 Department of Geography, McGill University, Montreal, PQ, Canada
AbstractFreeze-coring and bulk sampling are routine methods used to sample subsurface spawninggravel under shallow water. Both methods have limitations. Freeze-coring is not believedto representatively sample coarse grain sizes and the sample volumes are relatively small.Conversely, when bulk sampling, even within an enclosure, some fine sediment is suspendedand washed away from the sample. This paper assesses the biases in sampling performancebetween the two methods and determines whether the loss of fines that occurs when bulksampling could be predicted and thus corrected for.
At six riffles the spawning substrate was sampled under approximately 50 cm of waterwith a bulk sample and three adjacent freeze-cores. For each riffle, data from the twosamples were combined using the method of Fripp and Diplas (1993) and the resultantcomposite sample was compared with the original freeze-core and bulk samples to assess therelative precision and biases of the two techniques.
On average, the D50 of the bulk samples was 4 mm larger and a one-third loss of the <<<<<2 mmfraction occurred compared with the composite samples. In contrast, freeze-core samplescontain on average 32% more sediment >>>>>16 mm compared with composite samples. Basedon six samples, taken from six riffles, the amount of sediment finer than 0·5 mm lost usingour bulk sampling technique with an enclosure appears to be predictable and correctable.Copyright © 2005 John Wiley & Sons, Ltd.
Keywords: sediment sampling; sub-aqueous; freeze-core; bulk sample; gravel-bed
Received 4 February 2004;Revised 30 September 2004;Accepted 18 November 2004
*Correspondence to:A. Zimmermann,Department of Geography,University of British Columbia,1984 West Mall, Vancouver,BC, V6T 1Z2, Canada. E-mail:[email protected]† A contribution to the scientificprogram of CIRSA, the CentreInteruniversitaire de Recherchesur le Saumon Atlantique.
Introduction
Freeze-core and bulk samples extracted using shovel-like devices are two commonly used methods to determinethe subsurface grain size distribution of gravel-bed river sediments. Biologists and geomorphologists use freeze-coreand bulk samples to quantify fish and macroinvertebrate habitat (e.g. Milan et al., 2000; Payne and Lapointe, 1997;Scrivener and Brownlee, 1989) and to monitor changes in gravel substrate as a result of development (Adams andBeschta, 1980; Petts and Thoms, 1986; Petts et al., 1989; Rood and Church, 1994; Spillos and Rothwell, 1998;Thoms, 1987). In addition, subsurface sediment composition is needed when studying gravel transport processes(Parker and Klingeman, 1982) and when searching for gold deposits (Hughes et al., 1995; Petts et al., 1991).
Despite their extensive use, both the sub-aqueous freeze-core and bulk sampling methods are biased. The use offreeze-cores is believed to imprecisely sample coarse sediment and the samples are too small to establish with anyprecision the coarse end of the grain size distribution (Klingeman, 1987; Rood and Church, 1994). Increasing thenumber of freeze-core samples to attain a reasonable total sample weight (see, e.g., Church et al., 1987; Milan et al.,1999; Thoms, 1992) does not necessarily resolve the problem as uncertainty remains as to whether or not theproportion of coarser grains that remain attached to the freeze-core is representatively sampled (Klingeman, 1987;Petts and Thoms, 1986). While truncating the sample to remove the largest grains is a possible solution (Milan et al.,1999), if the entire grain size distribution of the population is sought, truncation cannot be used as it biases the wholegrain size distribution (Fripp and Diplas, 1993). The physical impact and displacement that occurs when inserting thefreeze-core tube may also bias the grain size distribution near the core in some manner.
The principle problem with sub-aqueous bulk samples is that some fine sediment is washed out of the sample andlost. It is possible that there may also be a bias introduced when shovelling sediment out of the sampling hole as larger

1406 A. Zimmermann, M. Coulombe-Pontbriand and M. Lapointe
Copyright © 2005 John Wiley & Sons, Ltd. Earth Surf. Process. Landforms 30, 1405–1417 (2005)
stones are easier to identify underwater than fines and the larger stones must generally be removed before the fines canbe removed.
Due to the sampling problems with freeze-core and bulk samples, other methods of sampling the subsurfacegrain size distribution are sought. McNeil samplers (McNeil and Ahnell, 1964) are an alternative means of samplingsub-aqueous substrate; however, they are limited to fine gravel and shallow water depths. In addition, fine sediment islost with McNeil samplers unless special care is taken to trap the fine sediment suspended in the water (Rood andChurch, 1994). Alternatively, depending on the nature of the project, subsurface bulk samples can be taken from drygravel bars where the loss of fine sediment is not a problem (e.g. Mosley and Tindale, 1985; Rice and Haschenburger,2004). Unfortunately, many studies require knowledge about the substrate that remains underwater during low flowconditions (e.g. spawning habitat surveys). Combining freeze-core and bulk samples may provide a sampling proce-dure that is unbiased and can be used to sample substrate underwater. The objectives of this paper are to quantify therelative biases of the freeze-core and bulk sampling techniques against more accurate composite samples and toexamine whether systematic losses of fines can be predicted. If so, this might provide a means of correcting bulksample data, thereby avoiding the costly and difficult work associated with freeze-coring (Rood and Church, 1994).We are not aware of any attempt to combine the freeze-core and bulk sampling methods, nor an evaluation of thebiases of these two techniques.
Methods
The approach used exploits the fact that freeze-cores tend to sample coarse fractions inaccurately while bulk samplestend to inaccurately sample the finer fractions. To quantify the individual biases of both bulk and freeze-core samples,three freeze-cores were first paired with a bulk sample and combined to create an unbiased composite grain sizedistribution using the methods of Fripp and Diplas (1992, 1993). In order to combine the samples, the grain sizeclasses where both methods sampled sediment in an identical manner were identified (the so called match fraction;Rice and Haschenburger, 2004). The match fraction was identified by comparing the rate of change between adjacentgrain size classes (Fi/Fi−1, where Fi is the amount of sediment in fraction i and Fi−1 is the amount of sediment in thenext finer fraction). Over the range of fractions for which the difference in these ratios was near zero, the two methodswere considered to be sampling the sediment in an identical manner. Once the match fraction was determined, thebulk sample data was used to reconstruct the full grain size distribution for the portion of the sample composed ofsediment the same size as or larger than the match fraction. The freeze-core data were then matched to the bulksample data using the match fraction and used to complete the portion of the grain size distribution finer than thematch fraction. For more information on the method see Fripp and Diplas (1992, 1993) and Rice and Haschenburger(2004).
In total seven composite grain size distributions were created from samples collected at seven differentriffles in four different streams within the Cascapédia River watershed, Québec (Figure 1). The seven submergedriffles had particularly coarse substrate (subsurface D90 = 75–230 mm, average = 135 mm; D50 = 18–46 mm, average =33 mm) and a relatively large silt fraction (D < 64 µm, average = 1·2%), which is particularly difficult to sampleunderwater.
To take the freeze-core samples, freeze-core tubes built to the specifications of Rood and Church (1994) weredriven into the riverbed to a depth of 30 cm. About 8 litres of liquid nitrogen was then poured into each tube at a slowcontinuous rate. Once all the liquid nitrogen had been poured, the tubes were left to sit for approximately 45 secondstill the freezing process was completed. The freeze-core was then removed with the sample attached (Figure 2). Thesurface layer (surface sediment to a depth of the D90) did not freeze to the core and thus the surface sediment was notincluded in the freeze-core samples. The surface layer was also excluded from the bulk samples. Freeze-core samplesvaried in weight from 1 to 9·3 kg with an average weight of 4·6 kg. The samples were taken to the laboratory, driedand mechanically sieved at phi intervals and in some cases at 1/ 2 phi intervals. The largest stone collected by anindividual freeze-core varied between 32 and 128 mm. The samples were not truncated.
At each of the seven riffles sampled, three freeze-core samples were collected. One core was extracted immediatelydownstream of the area that would later be bulk sampled; the remaining two were extracted on either side of the samearea. At each sampling site (one per riffle) it was assumed that the three freeze-cores and the bulk sample weresampling sediment from the same population of bed material. The data from different riffles was not combined.
At each study riffle, the bulk sample was then taken with a flow isolation cell (Coulombe-Pontbriand and Lapointe,2004; Payne and Lapointe, 1997). The flow isolation cell attempts to let water flow through the cell into a mesh(77 µm) bag downstream. Our cell was outfitted with three centimetres of soft foam along its base in order to reducethe size of the gaps between the rough river bed and the base of the cell and further reduce water flow over the sample

Submerged bulk and freeze-core samples 1407
Copyright © 2005 John Wiley & Sons, Ltd. Earth Surf. Process. Landforms 30, 1405–1417 (2005)
Figure 1. Map illustrating location of study streams (a) and a schematic of the sampling strategy at the seven riffles (b). The rifflesare implicit between the pools.

1408 A. Zimmermann, M. Coulombe-Pontbriand and M. Lapointe
Copyright © 2005 John Wiley & Sons, Ltd. Earth Surf. Process. Landforms 30, 1405–1417 (2005)
Figure 2. Freeze-core sample.
hole and the loss of fine sediment. Some very fine sediment was, however, still entrained from under the cell(Figure 3). Once the cell was in place the bed surface layer was removed to a depth of about the D90 of the surface.The underlying sediment was then sampled until the hole was about 30 cm deep and 65 cm in diameter. On averagesubsurface samples contained 130 kg of dry sediment. The largest stone in the samples was generally between 128and 256 mm in diameter, thus the precision of the samples varied between 2 and 18%, assuming the stone wasapproximately ellipsoidal (Church et al., 1987). Milan et al. (1999) note that the precision of the sample may differslightly from what is predicted with the Church et al. (1987) criteria if the stone’s shape differs significantly from anellipsoid. The excavated sediment was subsequently sieved to 16 mm at phi increments in the field. Five kilogramand larger sub-samples of the sediment less than 16 mm (the 16 mm sub-samples were sampled at a 0·1% accuracybased on Church et al., 1987) were taken to a laboratory, dried and sieved at the same intervals as the freeze-coresamples.
During the research, 29 additional bulk samples were also collected to increase the amount of information about thestudy sites and examine seasonal changes in substrate (see Zimmermann and Lapointe, in press). While this data wasnot used to examine the biases of bulk or freeze-core samples, it does help illustrate the precision of bulk samples. Theadditional bulk samples were taken from the same seven riffles that were sampled with the freeze-cores (see Figure 1).At each of the four streams three sampling sites were chosen for a total of 12 sites. Seven of these sites correspondedto the original seven bulk sampling sites while the remaining five sampling sites were new. Within a stream, the three
Figure 3. Flow isolation cell used for bulk sampling; note fines in suspension.

Submerged bulk and freeze-core samples 1409
Copyright © 2005 John Wiley & Sons, Ltd. Earth Surf. Process. Landforms 30, 1405–1417 (2005)
sampling sites were located either on the same riffle, where the channel width allowed, or on consecutive riffles. Oneach of these 12 sampling sites, three bulk samples were extracted. Each subsequent sample was taken 1–2 mupstream of the previous bulk sample as variability in grain size is greater across the stream channel than along thestream channel (Adams and Beschta, 1980). The first sample was taken in July, the second in September and the thirdin November. Between the sampling periods a few modest sediment transporting events occurred that transported finegravel and sand but no major events occurred (see Zimmermann and Lapointe, in press, for details). As no significantchange in bed texture (ANOVA, p > 0·1) was observed among the replicate samples (Zimmermann and Lapointe, inpress), these bulk samples have been treated as replicates and are used here to assess the precision (i.e. repeatability)of bulk sampling.
Results
Table I illustrates the sample weights for both the three combined freeze-cores and the paired bulk samples for eachof the seven original study sites. To construct the composite grain size distribution, the match fraction was deter-mined by subtracting the weight ratio between adjacent grain size classes (Fi/Fi−1) for the three combined freeze-coresfrom the weight ratio for the paired bulk sample. As an example, a ratio difference of 1 could reflect a weight ratiofor a given pair of adjacent fractions of 1:1 using one sample method and 2:1 with the other. For each grain size classthe absolute values of these differences for each of the seven study sites are plotted in Figure 4. For the grain sizeclasses between 2·8 and 11·2 mm the difference between the ratios is consistently near zero at all sites, indicating thatthis is the best match fraction. Once the match fraction was determined, the portion of the bulk grain size distribu-tion larger than 2 mm was used as the coarse limb of the composite sample. The freeze-core data was then scaledup so that the amount of freeze-core sediment in the 2–11·2 mm grain size class matched the amount of sedimentbetween 2 and 11·2 mm measured with the bulk sample. The scaled up data was then used to complete the fine end ofthe grain size distribution for the 2 mm and finer grain size classes of the composite grain size distribution (bottomof Table I).
The three freeze-core samples from the Salmon site had a total weight of only 2·9 kg and have thus been excludedfrom further analysis as this is felt to be too small a sample to be accurate. The data also plotted as an outlier for muchof the analysis, suggesting the small sample size affected the results.
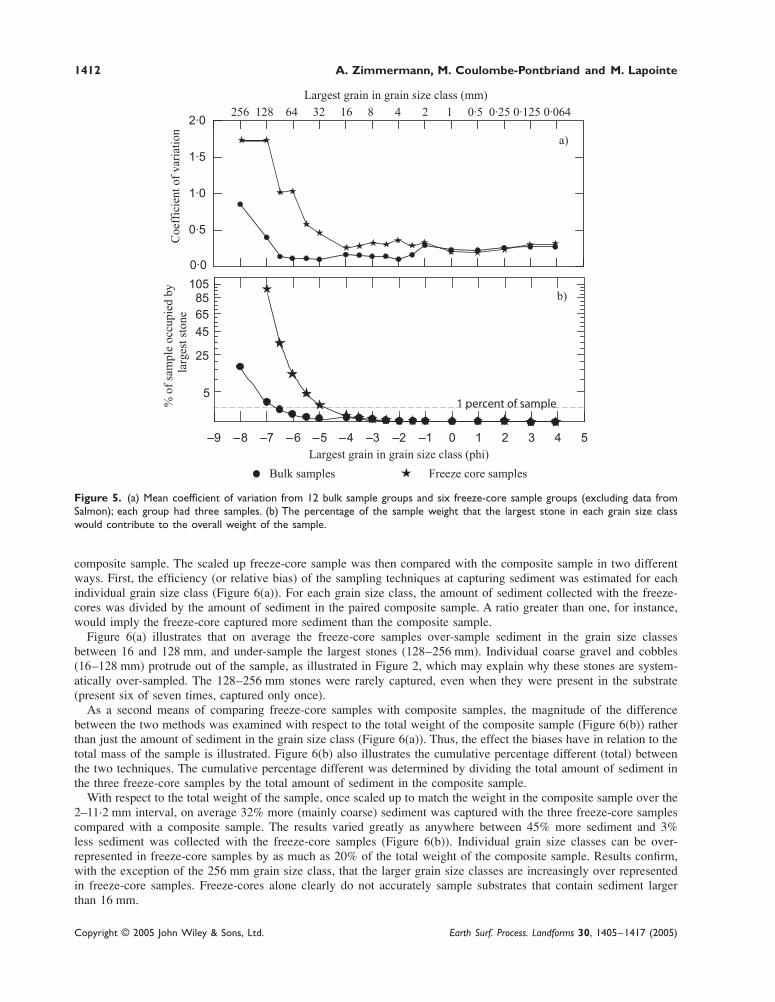
To assess the precision (repeatability) of the bulk samples, a coefficient of variation was calculated for each grainsize fraction and each of the 12 bulk sample sites that were repeatedly (n = 3) sampled (see Figure 1). In the samemanner, for each grain size class, six different freeze-core coefficients of variation were calculated, one for each rifflethat was repeatedly (n = 3) sampled with freeze-cores, excluding the data from the Salmon site (see Figure 1). Themean coefficient of variation from the 12 bulk sampling sites and six freeze-core sampling sites (excluding the freeze-core sample from the Salmon site) characterized the average variability of bulk and freeze-core samples for this study(Figure 5(a)). Figure 5(b) illustrates the proportion of the sample that the largest stone in a grain size class wouldcontribute to the sample according to the average size of the sediment samples. An ellipsoidal shape and a bulkdensity of 2650 kg/m3 have been assumed as per Church et al. (1987).
Repeated freeze-core samples yield greater imprecision (random variation measure as coefficient of variation) infractional contents than bulk samples for all grain size classes coarser than 1 mm (Figure 5(a)). Precision is compara-ble to that of bulk samples for grain size classes finer than 1 mm. As expected, based on Church et al. (1987) andGale and Hoare (1994), when the largest stone occupies more than 1% of the total sample weight the coefficient ofvariability significantly increases for both bulk and freeze-core samples. As a result, bulk samples generally yieldmuch more precise gravel and cobble content data since it is much easier to take larger substrate samples with bulksamples than with freeze-cores.
To construct a composite sample, it is necessary to ensure that the three freeze-cores provide an accurate sample ofthe sediment finer than 11·2 mm. Figure 5(a) shows that the coefficient of variation, based on three freeze-cores,remains relatively low (under 0·5) for all of the 16 mm and finer grain size classes but increases rapidly for coarserfractions. In addition, if the Church et al. (1987) method is applied, an 11·2 mm stone would on average make up only0·2% of the weight of a three freeze-core sample. This level of precision is felt to be sufficient to ensure that thematching of the bulk and freeze-core samples is reasonably precise. Milan et al. (1999) argues that if the stones arenot ellipsoidal, the level of precision may vary slightly from the predicted 0·2%. Thoms (1992) has illustrated that fivefreeze-cores are needed to sample substrate composed entirely of sediment finer than 32 mm. For the purpose of ourstudy, three freeze-cores were used since this study is only concerned with accurate samples of sediment finer than11·2 mm. As we will illustrate, no number of replicate freeze-cores would permit an accurate sample of a populationif sediment larger than 16 mm exists within the population.

1410 A. Zimmermann, M. Coulombe-Pontbriand and M. Lapointe
Copyright © 2005 John Wiley & Sons, Ltd. Earth Surf. Process. Landforms 30, 1405–1417 (2005)
Tabl
e I.
For
each
sam
ple
site
the
mas
s of
sed
imen
t (k
g) i
n ea
ch g
rain
siz
e cl
ass
base
d on
thr
ee f
reez
e co
res,
a bu
lk a
nd t
he c
ompo
site
sam
ple
Lar
gest
gra
in i
n gr
ain
size
cla
ss (
mm
)To
tal
sam
ple
Sam
ple
type
Sam
ple
site
256
128
9064
4532
1611
·28
5·6
42·
82
10·
50·
250·
125
0·06
4w
eigh
t (k
g)
Free
ze-c
ores
Berr
y lo
wer
2·0
2·8
1·3
0·9
1·6
0·8
0·4
0·3
0·4
0·3
0·3
0·4
0·3
0·3
0·1
0·1
0·1
12·2
Free
ze-c
ores
Berr
y up
per
2·4
5·0
3·4
0·7
0·9
2·0
0·6
0·6
0·5
0·5
0·4
0·4
0·5
0·3
0·3
0·1
0·1
0·1
18·8
Free
ze-c
ores
Bran
dy lo
wer
4·4
1·8
0·5
2·2
2·2
1·1
0·9
0·8
0·7
0·6
0·4
0·6
0·6
0·5
0·3
0·3
0·2
18·2
Free
ze-c
ores
Bran
dy m
iddl
e2·
83·
31·
11·
21·
90·
90·
60·
50·
50·
40·
30·
60·
50·
30·
20·
20·
215
·5Fr
eeze
-cor
esBr
andy
upp
er2·
31·
91·
11·
81·
50·
70·
50·
40·
50·
40·
30·
50·
50·
30·
20·
10·
113
·2Fr
eeze
-cor
esLa
c1·
11·
21·
82·
80·
70·
60·
50·
40·
30·
30·
50·
50·
50·
20·
10·
111
·6Fr
eeze
-cor
esSa
lmon
0·2
0·4
0·5
0·3
0·2
0·2
0·1
0·1
0·2
0·2
0·2
0·1
0·1
0·0
2·91
Bulk
Berr
y lo
wer
20·0
5·9
18·4
10·4
9·5
15·1
4·5
5·3
5·0
4·8
4·2
4·8
7·5
4·4
2·2
0·6
0·2
0·3
123·
2Bu
lkBe
rry
uppe
r29
·115
·812
·69·
212
·514
·86·
16·
15·
65·
34·
33·
33·
21·
51·
60·
50·
20·
213
1·7
Bulk
Bran
dy lo
wer
20·6
17·8
10·3
9·4
8·4
14·5
4·6
5·5
5·5
4·8
3·4
3·0
3·7
4·6
1·7
0·5
0·5
0·6
119·
2Bu
lkBr
andy
mid
dle
12·3
11·0
14·0
12·1
9·2
16·0
4·4
5·0
5·8
5·3
4·8
4·7
7·4
4·3
1·4
0·6
0·4
0·8
119·
6Bu
lkBr
andy
upp
er3·
612
·216
·612
·011
·319
·79·
28·
18·
27·
36·
05·
06·
54·
21·
80·
70·
40·
813
3·7
Bulk
Lac
3·5
15·6
10·7
14·9
22·9
7·3
9·4
7·3
7·3
4·9
5·1
8·5
6·2
3·1
0·7
0·2
0·2
127·
7Bu
lkSa
lmon
18·7
13·5
13·5
12·4
10·9
19·3
7·6
7·7
6·8
5·7
4·1
3·7
6·0
5·6
1·9
0·3
0·1
0·2
138·
1
Com
posit
eBe
rry
low
er20
·05·
918
·410
·49·
515
·14·
55·
35·
04·
84·
24·
85·
54·
74·
01·
60·
91·
112
5·7
Com
posit
eBe
rry
uppe
r29
·115
·812
·69·
212
·514
·86·
16·
15·
65·
34·
33·
35·
43·
42·
81·
50·
80·
813
9·2
Com
posit
eBr
andy
low
er20
·617
·810
·39·
48·
414
·54·
65·
55·
54·
83·
43·
04·
24·
13·
62·
12·
21·
612
5·4
Com
posit
eBr
andy
mid
dle
12·3
11·0
14·0
12·1
9·2
16·0
4·4
5·0
5·8
5·3
4·8
4·7
6·8
6·1
3·5
2·1
2·1
1·9
127·
2C
ompo
site
Bran
dy u
pper
3·6
12·2
16·6
12·0
11·3
19·7
9·2
8·1
8·2
7·3
6·0
5·0
8·9
7·8
5·4
3·2
1·9
2·4
148·
8C
ompo
site
Lac
3·5
15·6
10·7
14.9
22·9
7·3
9·4
7·3
7·3
4·9
5·1
7·7
7·5
7·3
3·4
1·6
1·7
138·
0C
ompo
site
Salm
on18
·713
·513
·512
·410
·919
·37·
67·
76·
85·
74·
13·
75·
35·
24·
42·
91·
41·
314
4·3
1 Due
to
the
smal
l tot
al s
ampl
e w
eigh
t of
the
thr
ee f
reez
e-co
res
from
the
Sal
mon
site
the
dat
a fro
m t
he S
alm
on s
ite w
as n
ot u
sed
to e
xam
ine
the
bias
es o
f fre
eze-
core
or
bulk
sam
ples
.

Submerged bulk and freeze-core samples 1411
Copyright © 2005 John Wiley & Sons, Ltd. Earth Surf. Process. Landforms 30, 1405–1417 (2005)
Figure 4. The absolute value of the ratio of the amount of sediment in adjacent grain size classes for three combined freeze-cores, minus the conjugate ratio from the paired bulk sample for the seven study riffles: (a) Berry lower; (b) Berry upper;(c) Brandy lower; (d) Brandy middle; (e) Brandy upper; (f) Lac; (g) Salmon. Sediment texture analysed at phi and 1/2 phi intervals.Dashed lines mark the interval over which freeze-cores and bulk samples are believed to be unbiased. The absolute values of thedifferences are plotted against the largest grain size class in the ratio (i.e. 4 mm = 4/2·8 mm).
The accuracy of the composite samples was still largely limited by the proportion of the sample that the largeststone contributed (see Church et al., 1987). To increase the overall accuracy of the sample, larger samples or bulksamples combined with grid by number samples should be taken (see Rice and Haschenburger, 2004).
Freeze-core biases: grain size specific sampling efficienciesTo compare mean freeze-core sample data with the more accurate composite samples the entire freeze-core samplewas scaled up such that the mass of sediment in the 2–11·2 mm grain size class matched the amount of sediment in the
1412 A. Zimmermann, M. Coulombe-Pontbriand and M. Lapointe
Copyright © 2005 John Wiley & Sons, Ltd. Earth Surf. Process. Landforms 30, 1405–1417 (2005)
Figure 5. (a) Mean coefficient of variation from 12 bulk sample groups and six freeze-core sample groups (excluding data fromSalmon); each group had three samples. (b) The percentage of the sample weight that the largest stone in each grain size classwould contribute to the overall weight of the sample.
composite sample. The scaled up freeze-core sample was then compared with the composite sample in two differentways. First, the efficiency (or relative bias) of the sampling techniques at capturing sediment was estimated for eachindividual grain size class (Figure 6(a)). For each grain size class, the amount of sediment collected with the freeze-cores was divided by the amount of sediment in the paired composite sample. A ratio greater than one, for instance,would imply the freeze-core captured more sediment than the composite sample.
Figure 6(a) illustrates that on average the freeze-core samples over-sample sediment in the grain size classesbetween 16 and 128 mm, and under-sample the largest stones (128–256 mm). Individual coarse gravel and cobbles(16–128 mm) protrude out of the sample, as illustrated in Figure 2, which may explain why these stones are system-atically over-sampled. The 128–256 mm stones were rarely captured, even when they were present in the substrate(present six of seven times, captured only once).
As a second means of comparing freeze-core samples with composite samples, the magnitude of the differencebetween the two methods was examined with respect to the total weight of the composite sample (Figure 6(b)) ratherthan just the amount of sediment in the grain size class (Figure 6(a)). Thus, the effect the biases have in relation to thetotal mass of the sample is illustrated. Figure 6(b) also illustrates the cumulative percentage different (total) betweenthe two techniques. The cumulative percentage different was determined by dividing the total amount of sediment inthe three freeze-core samples by the total amount of sediment in the composite sample.
With respect to the total weight of the sample, once scaled up to match the weight in the composite sample over the2–11·2 mm interval, on average 32% more (mainly coarse) sediment was captured with the three freeze-core samplescompared with a composite sample. The results varied greatly as anywhere between 45% more sediment and 3%less sediment was collected with the freeze-core samples (Figure 6(b)). Individual grain size classes can be over-represented in freeze-core samples by as much as 20% of the total weight of the composite sample. Results confirm,with the exception of the 256 mm grain size class, that the larger grain size classes are increasingly over representedin freeze-core samples. Freeze-cores alone clearly do not accurately sample substrates that contain sediment largerthan 16 mm.

Submerged bulk and freeze-core samples 1413
Copyright © 2005 John Wiley & Sons, Ltd. Earth Surf. Process. Landforms 30, 1405–1417 (2005)
Figure 6. (a) The efficiency of freeze-cores compared with composite samples for six riffles sampled (i.e. n = 6, Salmon dataexcluded). The efficiency was calculated by dividing the mass of sediment in each grain size class from the freeze-core sample bythe mass of sediment in the same grain size class from the composite sample. Note that the efficiency is at a minimum of zerowhen no sediment in a grain size class is measured with the freeze-cores. (b) The percentage over-sampled with three freeze-coresin relation to the total sample weight of the composite samples based on six paired samples. See the text for details. The middleline represents the median, boxes the first quartile and lines the second quartile.
Bulk sample biases: grain size specific sampling efficienciesNext, to compare the bulk samples to the composite samples, the same analysis as was preformed on the freeze-coredata was reproduced with the bulk sample data, except that the analysis focused on the grain size classes finer than thematch fraction (<2 mm). The relative efficiency of bulk samples relative to composite samples at capturing sedimenton a per grain size class basis is illustrated in Figure 7(a). A ratio less than one implies the bulk samples under-samplesediment compared with a composite sample. As a second means of comparing bulk samples with composite samples,the difference between the two methods with respect to the total weight of the composite sample was evaluated(Figure 7(b)).

1414 A. Zimmermann, M. Coulombe-Pontbriand and M. Lapointe
Copyright © 2005 John Wiley & Sons, Ltd. Earth Surf. Process. Landforms 30, 1405–1417 (2005)
Figure 7. (a) The efficiency of bulk samples compared with composite samples for six riffles (i.e. n = 6, Salmon data excluded).The efficiency was calculated by dividing the mass of sediment in each grain size class from the bulk sample by the mass ofsediment in the same grain size class from the composite sample. (b) The percentage lost with bulk samples compared to thecomposite samples for six riffles. The total percentage lost was determined by calculating the ratio between the total mass in thecomposite sample and the total mass in the bulk sample. The middle line represents the median, boxes the first quartile and linesthe second quartile.
The grain size distribution of the composite samples was consistently finer than that of the bulk samples. Asillustrated in Figure 7(b), in relation to the total weight of the sample, the seven bulk samples lost anywhere from 2to 10% of the sediment finer than 2 mm (average = 5·4%; median = 6%). This on average corresponds to a loss of overone-third (38%) of the amount of sediment finer than 2 mm as no sediment larger than 2 mm was lost. As a resultgrain size descriptors such as the D50 (reduced 4 mm) and the percentage of the sample composed of sand (increased5·4%) differed significantly (t-test, n = 7, p < 0·003) between bulk samples and composite samples. Figure 7(a) showsthat the proportion of the sediment lost in relation to the amount present, on a per grain size class basis, increases forsmaller sediments.
Do systematic and predictable losses occur with bulk samples?The hypothesis that systematic and predictable, and therefore correctable, losses of fine sediment with bulk samplesoccurs was tested with the data from the six bulk samples (excluding the Salmon site) and their paired compositesamples for the 2 mm and finer grain size classes. The results are summarized in Table II.
A significant positive relationship (p < 0·05) was found between the amount of sediment measured by compositesamples and the amount of sediment measured by bulk samples for the less than 63, 125, 250 and 500 µm grain size

Submerged bulk and freeze-core samples 1415
Copyright © 2005 John Wiley & Sons, Ltd. Earth Surf. Process. Landforms 30, 1405–1417 (2005)
Table II. Comparing composite samples and bulk samples for sand and silt grain size classes based on six sets of paired samples(excludes data from Salmon site)
P-value ofBulk Composite
Grain size slope of% of sample % of sample
Paired t-test,class regression r2 % composite Ave. Max. Min. Ave. Max. Min. p-value
<64 µm 0·04 0·68 =1·35 × % bulk + 0·66 0·37 0·67 0·12 1·2 1·6 0·54 <0·00164–125 µm 0·02 0·79 =3·82 × % bulk + 0·18 0·26 0·43 0·10 1·2 1·8 0·54 =0·002125–250 µm 0·008 0·86 =7·52 × % bulk − 1·8 0·47 0·55 0·39 1·7 2·4 1·1 =0·001250–500 µm 0·017 0·79 =2·1 × % bulk + 0·039 1·6 2·4 1·2 3·3 5·3 2·1 =0·0020·5–1 mm 0·12 0·49 3·4 4·8 1·1 4·1 5·4 2·4 0·101–2 mm 0·13 0·48 4·9 6·6 2·4 4·7 6·0 3·4 0·80
classes (Figure 8). For the four finest grain size classes, bulk samples always sample less fine sediment than compositesamples. For the 1 and 2 mm grain size classes, composite samples were not statistically different from bulk samples(paired t-test, p = 0·10 and 0·8 respectively). This suggests that medium and coarse sands were not easily suspendedwhile sampling and were representatively sampled using our bulk sampling technique.
Figure 8. Relationships between the amount of sediment measured with bulk samples and the amount measured with acomposite sample for four grain size classes based on samples taken from six riffles (Salmon data excluded): the four grain sizeclasses are the <64 (a), the 125 (b), the 250 (c), and the 500 µm (d) grain size classes. The solid line indicates the best fit linearregression relationship and the dashed line represents the 1:1 line, which the data would be expected to follow if the two methodswere equivalent.

1416 A. Zimmermann, M. Coulombe-Pontbriand and M. Lapointe
Copyright © 2005 John Wiley & Sons, Ltd. Earth Surf. Process. Landforms 30, 1405–1417 (2005)
The relationships in Table II could be used to correct bulk samples taken in similar conditions, thereby limiting theneed for costly and difficult freeze-core sampling (Rood and Church, 1994). The coefficients in Table II, however, areunlikely to be universal as the type of flow isolation cell used, compactness of the substrate and the water velocity atthe sampling locations may affect the coefficients. Studies performed under different conditions would require thefitting of site specific correction equations.
Discussion
As early as 1973 (Walkotten, 1973), freeze-cores were used to sample river substrate. While Klingeman (1987) raisedthe concern that freeze-cores may be biased towards coarse substrate and Thoms (1992) showed that samples fromgravels containing sediment larger than 64 mm had an unexplained bias whereas those containing sediment finer than32 mm were not biased, the amount of bias associated with freeze-cores has not been documented and researchershave continued to use freeze-cores in coarse substrate (e.g. Milan et al., 1999). While this practice is entirely reason-able when a sample of the fine matrix fraction alone is sought (up to pea gravel, Figure 6) (see, e.g., Hughes et al.,1995; Petts et al., 1991, 1989), our results have clearly demonstrated that freeze-cores cannot be used to construct acomplete grain size distribution in cobble-gravel-bed rivers. Using freeze-cores alone can result in substantial errorsthat may effect the interpretation of channel stability as the coarse fraction can be substantially over-estimated.
Thoms (1992) also notes that bulk samples or grab samples have been plagued by the loss of fines due to washoutwhen sampling. Herein the amount of sediment actually lost with bulk samples has been shown to be significant(Figure 7). Nonetheless bulk sampling remains an attractive technique as it can be used to acquire large, unbiasedsamples of the coarse fraction of the substrate (diameter > 2 mm, Figure 7) and is relatively easy to complete inremote settings. The ability to correct for the loss of fines while bulk sampling holds some promise that bulk samplesalone may be used if a lower level of precision is acceptable. Using uncorrected bulk samples can result in errors andsome caution is warranted. As an example, egg emergence predictions based on the sand index (Peterson and Metcalfe,1981) for the data from the Lac branch are 80% using uncorrected bulk sample data and 10% using the compositegrain size distribution. While this is an extreme example, the other streams had similar, albeit not so extreme changes(Brandy, 90% bulk, 50% composite; Berry Mountain, 90% bulk, 80% composite; Salmon site, 90% bulk, 70%composite). Bulk samples alone can be used if the purpose of a project is only to compare sites within a single studyas the relative rank of the sites is preserved. In general, however, some caution is needed when using uncorrectedsubmerged bulk sample data.
Conclusion
Our results show that freeze-core and bulk samples can be combined using the Fripp–Diplas (1993) method toovercome the biases associated with each technique. The biases are demonstrated to be significant. In particular,sediment finer than 2 mm is underestimated with bulk samples (especially for particles finer than 0·5 mm) andmaterial coarser than 16 mm is demonstrated to be over-estimated with freeze-core samples. The biases associatedwith the techniques are sufficiently large that predictions based on either technique can be outright incorrect. Freeze-cores rarely sample sediment larger than 128 mm even when it is present in the population and salmon emergencepredictions can be as high as 80% using bulk samples, but as low as 10% if a combined sample is used. Clearlycaution should be used if bulk or freeze-core samples are to be used alone.
The loss of fine sediment when bulk sampling with our flow isolation cell does appear to be predictable andcorrectable, suggesting that calibration relationships can be used to estimate the amount of fines lost with a particularbulk sampling technique. This would enable researchers to predict the loss of fines and reduce the number of freeze-core samples that must be paired with bulk samples in order to accurately measure the complete grain size distributionof sub-aqueous cobble-gravel substrate.
Acknowledgements
This work was funded by the National Science and Engineering Research Council of Canada (NSERC) in the form of postgraduatescholarships for Zimmermann and Coulombe-Pontbriand. The field work was funded by M. Lapointe’s NSERC operating grant,CIRSA and the Cascapédia Society Inc. Northwest Hydraulic Consultants lent us the freeze-coring equipment and Laura Lapp andErich Zimmermann were terrific assistants in the field. The paper has also benefited greatly from the comments of an anonymousreviewer as well as comments from Dr. Marwan Hassan (Department of Geography, UBC).

Submerged bulk and freeze-core samples 1417
Copyright © 2005 John Wiley & Sons, Ltd. Earth Surf. Process. Landforms 30, 1405–1417 (2005)
References
Adams JN, Beschta RL. 1980. Gravel bed composition in Oregon coastal streams. Canadian Journal of Fisheries and Aquatic Sciences 37:1514–1521.
Church MA, McLean DG, Wolcott JF. 1987. River bed gravels: sampling and analysis. In Sediment Transport in Gravel-Bed Rivers, ThorneCR, Bathurst JC, Hey RD (eds). Wiley: Chichester; 43–88.
Coulombe-Pontbriand M, Lapointe M. 2004. Geomorphic controls, riffle substrate quality and spawning site selection in two semi-alluvialsalmon rivers in the Gaspé Peninsula, Canada. Rivers Research and Applications 20: 577–590.
Fripp J, Diplas P. 1992. Surface sampling of dry and underwater sediment deposits. In Hydraulic Engineering: Saving a ThreatenedResources – in Search of Solutions, Jennings M, Bhowmik NG (eds). ASCE: Baltimore, MD; 853–858.
Fripp JB, Diplas P. 1993. Surface sampling in gravel streams. Journal of Hydraulic Engineering, ASCE 119(4): 473–490.Gale SJ, Hoare PG. 1994. Reply: Bulk sampling of coarse clastic sediments for particle size analysis. Earth Surface Processes and
Landforms 19: 263–268.Hughes N, Coats JS, Petts GE. 1995. Local variability of gold in active stream sediments. Journal of Geochemical Exploration 54: 137–148.Klingeman PW. 1987. Discussion of Church MA, McLean DG, Wolcott JF 1987. In Sediment Transport in Gravel-Bed Rivers, Thorne CR,
Bathurst JC, Hey RD (eds). Wiley: Chichester; 81–83.McNeil JW, Ahnell WH. 1964. Success of Pink Salmon Spawning Relative to Size of Spawning Bed Materials. US Fish and Wildlife Service
Special Scientific Report Fisheries No. 469, p. 15.Milan DJ, Heritage GL, Large ARG, Brunsdon CF. 1999. Influence of particle shape and sorting upon sample size estimates for a coarse-
grained upland stream. Sedimentary Geology 129: 85–100.Milan DJ, Petts GE, Sambrook H. 2000. Regional variations in the sediment structure of trout streams in southern England: benchmark data
for siltation assessment and restoration. Aquatic Conservation: Marine and Freshwater Ecosystems 10: 407–420.Mosley MP, Tindale DS. 1985. Sediment variability and bed material sampling in gravel-bed rivers. Earth Surface Processes and Landforms
10: 465–482.Parker G, Klingeman PC. 1982. On why gravel bed streams are paved. Water Resources Research 18(5): 1409–1423.Payne BA, Lapointe MF. 1997. Channel morphology and lateral stability: effects on distribution of spawning and rearing habitat for Atlantic
salmon in a wandering cobble-bed river. Canadian Journal of Fisheries and Aquatic Sciences 54: 2627–2636.Peterson RH, Metcalfe JL. 1981. Emergence of Atlantic Salmon Fry from Gravels of Varying Compositions: A Laboratory Study,
No. 1020, Fisheries and Environmental Sciences, Department of Fisheries and Oceans, Biological Station, St-Andrews, New Brunswick,August, p. 15.
Petts GE, Coats JS, Hughes N. 1991. Freeze-sampling method of collecting drainage sediments for gold exploration. Transactions of theInstitution of Mining and Metallurgy, Section B: Applied Earth Sciences 100 (January–April): B28–B32.
Petts GE, Thoms MC. 1986. Channel aggradation below Chew Valley Lake, Somerset, UK Catena 13: 305–320.Petts GE, Thoms MC, Brittan K, Atkin B. 1989. A freeze-coring technique applied to pollution by fine sediments in gravel-bed rivers. The
Science of the Total Environment 84: 259–272.Rice S, Haschenburger J. 2004. A hybrid method for size characterization of coarse subsurface fluvial sediments. Earth Surface Processes
and Landforms 29(3): 401–421.Rood K, Church M. 1994. Modified freeze-core technique for sampling the permanently wetted streambed. North American Journal of
Fisheries Management 14: 852–861.Scrivener JC, Brownlee MJ. 1989. Effects of forest harvesting on spawning gravel and incubation survival of Chum (Oncorhynchus keta)
and Coho salmon (O. kitsutch) in Carnation Creek, British Columbia. Canadian Journal of Fisheries and Aquatic Sciences 46: 681–695.Spillos LC, Rothwell RL. 1998. Freeze-core sampling for sediment intrusion from road and stream crossings in Alberta’s foothills: a
preliminary discussion. In Forest-Fish Conference: Land Management Practices Affecting Aquatic Ecosystems, Brewin MK, MonitaDMA (eds). Natural Resources Canada, Canadian Forest Service, Northern Forestry Centre: Calgary, Alberta; 445–450.
Thoms MC. 1987. Channel sedimentation within the urbanized river Tame, UK Regulated Rivers: Research and Management 1: 229–246.Thoms MC. 1992. A comparison of grab- and freeze-sampling techniques in the collection of gravel bed river sediment. Sedimentary
Geology 78: 191–200.Walkotten WJ. 1973. A Freezing Technique for Sampling Streambed Gravels. US Forest Service Pacific Northwest Forest and Range
Experiment Station Research Note, No. PNW-281.Zimmermann AE, Lapointe M. In press. Sediment infiltration traps: their use to monitor salmonid spawning habitat in headwater tributaries
of the Cascapedia River, Québec. Hydrological Processes.