earthquake response spectrum models for … · earthquake response spectrum models for australia...
TRANSCRIPT

EARTHQUAKE RESPONSE SPECTRUM MODELS FOR AUSTRALIA
AUTHORS:
NELSON LAM AND JOHN WILSON UNIVERSITY OF MELBOURNE
Nelson Lam is Senior Lecturer at The University of Melbourne. He joined Scott Wilson Kirkpatrick & Partners in 1982 and was bridge engineer with the firm until 1989 when he began his academic career at The University of Melbourne specialising in the field of earthquake engineering.
John Wilson is Senior Lecturer at the University of Melbourne. He was with Ove Arup and Partners before becoming Senior Lecturer at The University of Melbourne in 1992. He is co-author of a book and numerous publications in many different areas of earthquake engineering and structural dynamics.
ABSTRACT:
Response spectrum provisions in the current Australian Earthquake Loading Standard (AS 1170.4) were based on recommendations by the 199 I edition of the Uniform Building Code for the United States. Since publication of AS 1170.4 in 1993, a number of alternative response spectrum models have been developed in Australia to address local seismic conditions. A normalised velocity response spectrum model was first developed by the Australian Geological Survey Organisation (AGSO) based on the averaging of results obtained from the analyses of strong motion accelerograms collected from worldwide intraplate regions. A generic response spectrum attenuation model, known as the Component Attenuation Model (CAM), has also been developed by the authors at the University of Melbourne based on stochastic simulations of seismological parameters. Design response spectra have been developed for different parts of Australia using CAM, based on locally developed parameters together with generic information. The comparison between the independently developed models (AGSO and CAM) reveal interesting similarities, but also highlights some differences. This paper provides a critical review of the recent design response spectra proposed for rock sites in the new Joint Australian New Zealand Earthquake Loading Standard and makes further recommendations.
Paper No.8
1. INTRODUCTION
The response spectrum model stipulated in the current Australian Earthquake Loading Standard (AS 1170.4: 1993) is based on the 1991 edition of the Uniform Building Code of the Lnited States (UBC91 ). The flathyperbol ic ( x r ') response spectrum shape is based on observations of moderate and large magnitude events in California. and the shape has been modified lo provide addilional conservatism for long period structures. The drafting of a new joint Australian New Zealan I :arthquake Loading Standard (DR00902-00904 ). denoted herein as "Draft A:-:Z". proYides the opportunity to reYise the shape of the notmalised design response spectnun. The Australian Geological Survey Organisation (AGSO) undertook a detailed study of 13 accelerograms measured at rock sites from reverse thrust fault events with magnitude ranging from 5.4-6.6 (Somerville. l998) . Records ,,·ere normalised to a peak ground ,·elocity (PGV) of 50mm/sec. A new normalised design response spectrum (NDRS) model has been proposed for the draft ANZ based on this study.
An alternative NDRS has been recommended based on the stochastic simulations of the seismological model known as the Component Attenuation Model (CAM). CAM is based on the following fonnulation:
Y = cx(M).G(R).[3(R.Q).y,nc. Yuc (1)
where Y is the maximum response parameter of interest . a(M) is the source factor , G(R) is the geometrical factor (geometric clamping). ~(R,Q) is the anelastic attenuation factor (crustal damping). and Y111c .:mel Yuc are the mid and upper crustal modification factors respectively.
Detailed descriptions of CAM and the associated parameters shown in Eq.l are provided in Lam (2000a-c). The CAM model was developed from stochastic simulations of the seismological model of Atkinson ( 1993.1995.1997 & 1998) . Rigorous seismological validation studies of the seismological model have been carried out as reported in Atkinson (I 998). Importantly, predictions based on the CAM model are in good agreement with field measurements obtained fi"om different regions around the world including low seismicity regions in Eastern North America (L<:~m, 2000c), Australia (Koo,2000) and Southeast Asia ( Lam.2000cl; Bala.200 I ).
Jn this paper, the NDRS proposed for the draft ANZ is compared with that developed hom CAM. Based on this comparison, a full range NDRS for rock sites is proposed which is considered to be representative for both small magnitude and large magnitude earthquake events in Australia.
The scope of this paper has been necessarily restricted to the considerations of rock sites due to space limitations. A number of models have been developed for extrapolating soil response spectra from the rock spectrum (Crouse, 1996; Lam200 I) . Thus, the establishment of a representative rock response spectrum is of fundamental importance.
2. COMPARISON OF NORtVIALISED DESIGN RESPONSE SPECTRA
Design response spectra in contemporary codes of practice are typically in the form of response spectral acceleration (RSA), or seismic design force per unit weight, plotted against the natmal period of the structure. A more informative representation frequently used in engineering seismology is to plot the response spectral velocity (RS V) in the logaritlm1ic-tripartite format. Response spectra presented in this format clearly indicate three distinct regions of constant (and maximum) response spectral acceleration (SA ,,11 ), velocity (S V,,,11 ) and displacement (SD,,"-,) as shown in Fig.!. Conveniently, the SA"''" and SD"''". values can be obtained from the S V, 11111 values with knowledge of the corner periods T1 and T_,.
Page 8-1

The velocity amplification ratio S 1',,.,/PG I ' estimated by :\c\\ mark-Hall ( 1982 ). Somen·ille ( 1998) !referred to as the "AGSO" model] and Lam t2000c) !referred to as the "C'\\-1'' model] are listed in Table 1. The ratios are generally consistent. '' ith a \'alue of S 1 ·,.,,,, in the order of I\\ ice the PG 1: considered representati\'e.
['able I Recommended Ratios of Sl ·,,,, PG I' (based on median estnnates)
:vtodel :\ewmark-Hall( 1982) Somer\'i lie( 1998) Lam( 2000c) 1.6:' 1.8 2.0
The corner period (· controls the 111<1'\Jmum response spectral displacement (SD,,,,,). :\e\\ mark-Hall recommends a consen·atin~ ,·alue nf ( - =3 seconds based on awrage site conditions in Califomia. The :'I.GSO model recommends a much lower period ofT_. =0.7secs rcllecting magnitude 5..+-6.6 events on rock sites in predominantly stable continental 1·egions as sho\\·n in Fig.2 . The alternati,·c CAM fommlation \\'hich accounts for the magnitude dependence ofT_. ( Eq. 1 ). is in general agreement with the AGSO model at \ 11=6. Derintion for ( Eq.l) can be found in Lam t2000c).
(for \'1;~.5) (2)
From Eq.2. a magnitude 7 event is associated \\·ith T: = 1.5sccs \\'hich implies a 50'% increase in the maximum displacement demand (SD, 11 ,,x) on a rock site compared with the AGSO model as shown in Fig.3.
The comer period T1 controls the m:1Ximum response spectral acceleration. with SA, 11 ,"- increasing with decreasing Yalues of T1 The T; =0.3scc period recommended by the AGSO model is generally consistent with that predicted by the CA:VI model l~'1r earthquakes with magnitude in the order of 6-7 for rock sites possessing an a\·crage shear wa\'e velocity of about 600-700mmJsec. However, a lower T1 value in the order of 0.1 sec is possible for \'Cry hard10ck sites (shear wa\·e velocity exceeding 1000m/scc) and for smaller magnitude events.
3. RECOMME~DATIONS FOR ~OR!\IALISED DESIGN RESPONSE SPECTR<\
A design response spectrum has been developed based on CAM for a peak ground velocity (PG V) of
60nun/sec. This CO!Tesponcls to an acceleration coefficient a =0.08g in accordance with AS 1170.4 ( 1993) for a .500 year return period e\·ent and is therefore representative for many of the major capital cities in Australia such as Melbourne and Sydney. The maximum response spectral velocity (SV""") of 120mm is simply twice the PG V as obtained from Table 1 for CAM. The maximum response spectral displacement (SD,,.,,) has been determined in accordance with Eq.3, using T:= 1.5sccs.
SD,," = ( T':'2rr) .)'1",," ~ ( 1.5 -'2;-r) 120 = 30mm (3)
Similarly. the maximum response spectral acceleration (SA""") has been determined in accordance with Eq.4 using T1=0 .3secs.
SA"'"·' = (2rr: T1) SV,.,," = (2rr/ 0.3) 120 = 2500nun/sec2 = 0.25g (4)
The PGA is estimated to be in the order of 0.08g. since the maximum response spectral acceleration (SA111
nr) is approximately equal to three times the PGA (refer Table I). The estimated PGA value is consistent with
the acceleration coefficient of u =0.08 as specified by AS 1170.4. The response parameters for the 2500 year return period event can obtained by scaling the 500 year estimates by a return period factor of 1.9 (DR00902-00904 ). These CAM parameters have been listed in Table 2 for both return periods as the "recommended" values.
The response parameters nominated in the latest draft for the joint Australian New Zealand Earthquake
Loading Standard (DR00902-00904 ). denoted herein as "Draft ANZ'', are listed in Table 2 for a=0.08. This apparently has been developed tJ·om the AGSO empirical model described in Section 2. In addition, the
Page 8-2

<'
"'U Ill
(Q
CD OJ w
·u-. 0~ 0 C':3 :..- ~
~ -~ "->"=:1
sv""" Cunstanl velocity
_ ~ amplification ~,~ _r,- ----,.....
s ~!:-'"'"' Amax ~~
.;._,o''~~ ;o..c~"')l< ~t..., ,. .:!
~,~ ,.,' i
r"''-'1- SD,"' iltJ, (/,
'Jil;. "'r,.
'~>J~..~,, ~-~ 0 "" u 0 ~~
_,_., 'l>..
CP~~ ~rj r · ~''::04-;z c~,,(J,,
"' 0..
TA T[l Tt T, Natural Penod (logarithmic scale)
Figure 1 The Tripartite Response Spectrum Model
*results normalised to PGV=50mmfsec
IUUI> r---"7':----"'?o:-----,~
u
~ E > (/)
a: ., -~ .... E 0 z
!lUI IO Natlllal Period (sec)
tit
Figure 2 Nonnalised Response Spectrum Model of AGSO
Figure 3
~ ~ > Vl a:
IW~I'r-----------------~
1101 01 Ill
Natural Period (sec)
Legend
C'AM (M7)
CAM (M6.4)
CAM(M6)
AGSO results of similar magnitude for comparison with CAM
((1-1--------------'
Comparison between the AGSO model and CAM
,.., --- H-=comrncnded-CAM(:2!i00yrs RP)
-Rccornmcndcd-CAM(SOOyrs RP)
AGSO (500yrs RP)
-AS11704 1g93(500yrsRP)
:§ ;;\ ~
...
-Rccommcndcd·CAM(500yr-; RP)
- -Hccommcnded·CAM(2500y~ RP)
AGSO (500yr-> RP)
-AS1170 4 1993 (SOOyrs HP)
"'---- ------
..
NOIIUr.!.l P11rlod {UC:O)
(a) Velocity Spectrum
-R!!COmmcndcd-CAM(!;()Oyrs RPJ
- Rccommcndcd-C.b.M(2500yrs RPJ
AG$0 (SOOyrs RP)
-AS1170 4 1993 (500yrs RF-')
0 1~1
•• " N.;~tural Period (sees)
(b) Acceleration Spectrum
-Rc<xmrcndod ISOO,.. ~~
-~t25CXlyc>~)
I'GSO (SOO,.. Rl~
- AS1170 4 1993(SOO,.. RP)
01
1---OllG
.!..
" ;>O ... 5)
Natural Porlod (sees) RSD(nrn)
(c) Displaccm..:nt Spectrum (tl) Capacity (ADRS) Spectrum
Figure 4 Comparison of Response Spectra (PGV=60mm/sec and a=0.08g for 500 yrs return period)
1()1)

response parameters stipulated by the current Australian Earthquake Loading Standard (AS 1170.4) have also been included in Table 2 for comparative purposes. The AS 1170.4 spectrum is considered conservative as the response velocity and response displacement increase indefinitely with increasing natural period. which does not ref1ect physical reality.
Table 2 Summarv of Response Parameters fcx Rock Sites -Pa1·amctcr Rccom111endccl Rcco111111enclecl D1·aft A~Z (Class B Site) AS\170.4 (S-1 s1te)
51Hlyrs RP 2500yrs RP 500yrs RP 500yrs RP .~:~ l ,liiH 0.25g () 50g 0.15g 0.20g SJ :WJ\ I 20111111'scc 230111111/sec 70111111/sec Variable .\ '/)JII/I' :, 0111111 CiOm111 8111111 Variable
The response spectra for acceleration. \·elocity and displacement corresponding to the models shown in Table 2 have been plotted in figs.4a-4c. The recommended response spectra for 500 year return period is generally consistent \\'ith the AS 1170.4 spectrum in the low period range. Importantly, the recommended spectrum more accurately represents the displacement demand expected in the higher period range. The Draft AN Z response spectra appear to significantly underestimate the response parameters, patticularly the displacement demand in the high period range.
The response spectra can be conveniently represented in ADRS format (acceleration-displacement response spectra) where the displacement demand is plotted against the corresponding acceleration demand for the full range of natural periods (O<T<infinity) as shown in Fig.4d. This ADRS format has gained considerable popularity amongst the international earthquake engineering community as it allows the earthquake demand to be compared directly against the specific force-displacement properties of a structure. Hence in one plot, the performance of a structure in terms of force and displacement can be readily observed. Clearly. the design response spectrum proposed in the Draft ANZ standard appears to significantly underestimate the earthquake demand in tenns of both acceleration and displacement as shown in Fig. 4d.
4. CONCLUSIONS
A new normalised design response spectrum is recommended for rock sites in Australia based on a response spectral velocity or twice the peak ground velocity, and comer periods of T1=0.3secs and T_,= 1.5secs (based on a magnitude 7 earthquake event). The reconunended response spectra for 500 year reh1rn period is generally consistent with the AS 1170.4 spectrum in the low period range, however, more :J.ceurately represents the displacement demand expected in the higher period range . In comparison, the Draft ANZ response spectra appears to be unconservative particularly in the high period range.
5. ACKNOWLEDGEMENTS
The CAM model described in this paper has been developed as part of a project funded by the Australian Research Council (large grant), entitled: "Earthquake Induced Displacements for Building Stmctures in Australia".
6. REFERENCES
AS 1170.4 ( 1993) Standards Association of Australia: "Minimum design loads on structures : Part 4 : Earthquake Loads- AS I 170.4 and Commentary".
Atkinson G M ( 1993) "Earthquake source spectra in Eastern North A mcrica". Bulletin of the Seismological Society of A mcrica; 83: 1778-1798.
Atkinson GM, Boorc OM ( 1995). Ground-motion relations for Eastern North America. Bulletin of the Seismological Society of America; 85( I): 17-30.
Atkinson,G. and Silva, W.( 1997), An Empirical Study of Earthquake Source Spectra for Califomian Earthquakes, Bulletin of the Seismological Society of America, 87, 97-113 .
Atkinson GM, Boorc DM ( 1998). Evaluation of models for earthquake source spectra in Eastcm North America. 8u//etin of" the Seisnw/ogica/ Societ1 · o{America; 88(4):917-937.
Page 8-4
Balendra, T., Lam, )'.;.T.IC Wilson, .I.L. and Kong, IU-1.(2001): "Analysis of long-distance earthquake tremors and base shear demand for buildings in Singapore, .Joumal o(Enginccring Stmctures. (in press)
Crouse CB, McGuire .I W ( 1996 ). Site response studies for purpose of revising NEHRP seismic provisions . .lou mal of' Earthquake .\jJectra; 12(3 ): 407-439.
DRAFT ANZ(2000), IJmfi Auslmlian/NeH' Zealand Standardfor Comment, Standards Australia and Standards Nc\\' Zealand Joint Document: DR00902-DR00904, issued 17th :\ovcmber.2000.
Koo. R., Bro\\'n, A . , Lam \ LT.K ., \\'ilson.J.L . and Gibson,G (2000).:'' A Full Range Response Spectrum Model for Rock Sites in The 1vlelboumc !'v·lctropolitnn Area .. , Pmcc>eding.1· o(thc AEES Seminar, Tasmania,
paper no.16. Lam. :-\ .T.I<.. \\'ilson. J.L. & Hutchinson. G.L. (2000a). Generation of Synthetic Eanhquake Accelerograms
L:sing SeismologJcal Modelling: A Re1 iew . .lou mal of" Earthquake Engineering. 4(3 ), 321-354. Lam. \i.T.K .. Wilson . .I.L., Chandler. A.'VI. & Hutchinson, G.L. (2000b). Response Spectral Relationships for
Rock Sites Derived from the Component Attenuation Model. Ear1hquake Engineering and Structural DrnamiC.\' 29( 1 0), 1457-1490.
Lam NTK, Wilson JL, Chandler AM, Hutchinson GL (2000c). Response spectrum modelling for rock sites in low and moderate seismicity regions combining velocity, displacement and acceleration predictions. Earthquake Engineeri11g and Structural 1Jynw11ics; 29: 1491-1525.
Lam, N.T.K .. Chandler. A.M. , Wilson, J.L. and Hutchinson, G.L., (2000d): "Seismic Hazard Determination for the Coastal Region of South China (ll) Regional Crustal Modelling ", Joumal of' Seismology and Earthquake Engineering. 2(2), 1-16.
Lam, N.T.K., Wilson, J.L. & Chandler, A.M. (2001 ). Seismic Displacement Response Spectrum Estimated from the Frame Analogy Soil Amplification Model. Joumal of' Engineering Structures, 23,143 7- 1452 .
Newmark,N.i'vl. & Hall,W.J. (1982), Earthquake Spectra and Design, Em1hquakc Engineering Research Institute Monograph Series on Earthquake Criteria, Structural Design and Strong Motion Records.
Somerville. M., McCue, 1(. & Sinadinovski, C. ( 1998), .. Rcponse Spectra Recommended for Australia", Australian Structural Engineering Conference, Auckland, 439-444.
Uniform Building Code ( 1991 ). lntemational Conference of Building Officials, Whittier, Califomia, USA .
Page 8-5
!-

THE NEXUS BETWEEN REGULATION ENFORCEMENT AND ENGINEERING FAILURES
ATHOL YATES THE INSTITUTION OF ENGINEERS, AUSTRALIA
AUTHORS:
Athol Yates, MA (Public Policy), BEng, Grad Dip Soviet Studies, is the Senior Policy Analyst at the Institution of Engineers. He has been a guidebook writer, journalist and engineer before joining the IEAust in 1996. He undertakes government lobbying and research to promote the interests of the engineering profession. His recent publications include Government as an informed buyer, The future of engineers in the public sector and Risk allocation in major W A projects.
ABSTRACT:
The deaths caused by the recent Turkish earthquake, the Canberra hospital implosion and the Esso Longford gas plant explosion all have one thing in common. Good building codes and safety procedures existed but they were not followed nor enforced.
Over the last 2 decades, the trends of de-regulation and self-conformance have effected most engineering activities. These trends have the potential to reduce costs, increase innovation and benefit the nation. But they also may lead to a decline in design quality, a failure to apply relevant codes and an increase in safety risks for the community.
The maintenance of engineering standards is a critical factor in ensuring that the reforms actually benefit society in the long-term. This presentation examines the evidence of the development and enforcement of engineering regulation, and finds that there is much to be concerned about.
Paper No.9
THE NEXUS BETWEEN REGULATION ENFORCEMENT AND
ENGINEERING FAILURES
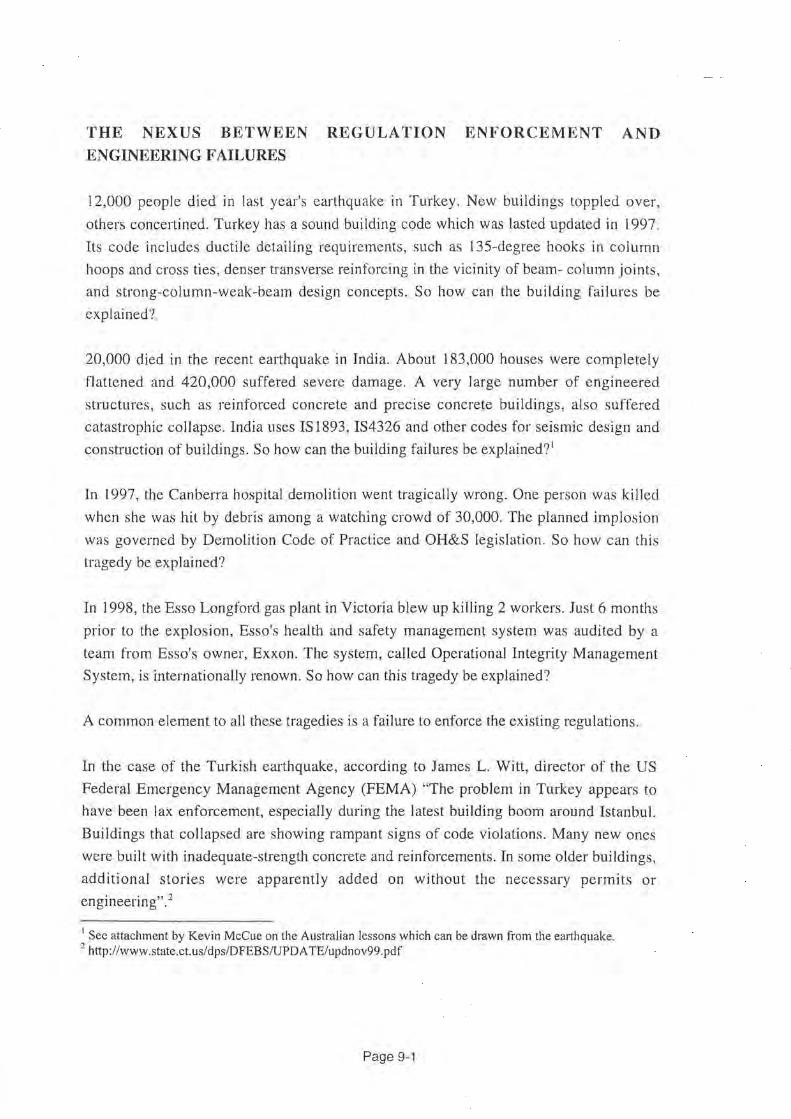
12,000 people died in last year' s earthquake in Turkey. New buildings toppled over,
others concerti ned. Turkey has a sound building code which was lasted updated in 1997.
Its code includes ductile detailing requirements, such as 135-degree hooks in column
hoops and cross ties, denser transverse reinforcing in the vicinity of beam- column joints,
and strong-column-weak-beam design concepts. So how can the building failures be
explained?
20,000 died in the recent earthquake in India. About 183,000 houses were completely
flattened and 420,000 suffered severe damage. A very large number of engineered
structures, such as reinforced concrete and precise concrete buildings, also suffered
catastrophic collapse. India uses IS 1893, IS4326 and other codes for seismic design and
construction of buildings. So how can the building failures be explained?'
In 1997, the Canberra hospital demolition went tragically wrong. One person was killed
when she was hit by debris among a watching crowd of 30,000. The planned implosion
was governed by Demolition Code of Practice and OH&S legislation. So how can this
tragedy be explained?
In 1998, the Esso Longford gas plant in Victoria blew up killing 2 workers. Just 6 months
prior to the explosion, Esso's health and safety management system was audited by a
team from Esso's owner, Exxon. The system, called Operational Integrity Management
System, is internationally renown. So how can this tragedy be explained?
A common element to all these tragedies is a failure to enforce the existing regulations.
In the case of the Turkish earthquake, according to James L. Witt, director of the US
Federal Emergency Management Agency (FEMA) "The problem in Turkey appears to
have been lax enforcement, especially during the latest building boom around Istanbul.
Buildings that collapsed are showing rampant signs of code violations. Many new ones
were built with inadequate-strength concrete and reinforcements. In some older buildings,
additional stories were apparently added on without the necessary permits or
engineering". 2
1 See attachment by Kevin McCue on the Australian lessons which can be drawn from the earthquake. 2 http://www.state .ct.us/dps/DFEBS/UPDATE/updnov99.pdf
Page 9-1

In the case of the Indian earthquake, according to an international expert review, there
was a "lack of enforcement of code provisions in some government organisation, and the
large-scale violation of code provisions in the private sector".3
"The design codes [in India] are only technical guidelines and their compliance is not
mandatory since enactment of building codes is a state subject. In most states, compliance
with the IS codes is required for government structures, while very few urban areas have
adopted compliance with IS codes for private constructions. Even when compliance with
IS codes is mandatory, the enforcement of the code specification is often found lacking
and the codes are violated with impunity. The process is further complicated since, as per
the relevant building bye laws, the structural engineers do not assume any legal
responsibility of their designs."
In the case of the Canberra hospital implosion, the coroner found that ACT WorkCover
did not follow established safety processes. It failed to ensure that the explosive workplan
required by the Demolition Code of Practice was met. It also failed to scrutinise
departures from the original demolition workplans and to issues appropriate prohibition
notices in accordance with the OH&S Act to ensure the methodology was safe not only to
the workplace employees but also to the public at large. 4
In the case of the Esso Longford explosion, the Royal Commission found that Esso failed
to protect its workers by not delivering on the self-regulatory requirement of the OH&S
Act and not implementing corporate policy of undertaking a hazard and operability study
(HAZOP). HAZOPs have been common practice in the process industry since the mid
1980s. The Royal Commission stated that "Esso recognised the particular significance of
a HAZOP study for Gas Plant 1 (GP 1 ), given the age of the plant, the modifications made
to its initial design and the changes to design standards since the plant was built. These
reasons grew stronger with the passage of time. Indeed, a HAZOP study for GP 1 was
planned to take place in 1995 and the cost of such a study was included by Esso in
successive budgets during the years 1995 to 1998".5 The Royal Commission identified
that the failure to undertake this process was a contributing factor to the disaster. "The
3 The Bhuj Earthquake of January 26, 2001 Consequences and Future Challenges http://www.civil .iitb.ac.in/BhujEarthquake/Chapter.04.pdf 4
ACT Coroner, 19998, Executive Summmy of the Inquest findings, comments and recommendations into the Death of Katie Bender on Sunday, 1 3'11 July /997 on the demolition of the Royal Canberra Hospital Acton Peninsula, ACT, pp. 273-274. 5 Parliament of Victoria, 1999, The Esso Longford Gas Plant Accident: Report of the Longford Royal Commission, Victoria, p 203.
Page 9-2
failure to conduct a HAZOP study or to carry out any other adequate procedure for the
identification of hazards in GP 1 contributed to the occurrence of the explosion and fire." 6
These examples are not unique. They are just the most public examples of regulatory
enforcement failures. Any regulation system can suffer the same fate. Any can degenerate
from effective to ineffectual without enforcement.
Systems are not enough to ensure compliance. This was one of the most useful thing to
come out of the review of the ACT Government response to the Coroner's Report into the
Canberra Hospital implosion. According to the reviewer, Tom Sherman, "WorkCover
now has good procedures in place for monitoring the use of explosives in the ACT.
Blasting Plans have to be submitted and those plans are vetted by an inqependent expert.
Post-blast reports are also required. I am reasonably confident that the procedures, skills
and culture now in place in WorkCover provide good prospects for effective regulation of
the use of explosives". 7 However he noted that changes to a system alone are not
sufficient to ensure that established processes are followed. "The best legislation and
contracts will be of little use if those responsible for the monitoring compliance with
workplans fail to carry out their tasks."8
Enforcement failures are particularly common during periods of massive change. Over
the last 2 decades, the engineering environment in Australia has been experienced this.
Under the mantras of slashing red tape, unshackling business and other de-regulatory
euphemisms, we have seen the rise in self-regulation, self-conformance, voluntary codes
of practice, performance standards and best practice guidelines.
These have the potential to reduce costs, increase innovation and benefit the nation. But
they also may lead to a decline in design quality, a failure to apply relevant codes and an
increase in safety risks for the community.
Much of the reform has been achieved through the Legislative Review process under
National Competition Policy. This started in 1995 and aimed to review about 1,800
pieces of legislation. It states that a review should:
• 6 Parliament: 235 7 Sherman, T, 2000, Report of an assessment of the ACT Government's response to the Coroner's Report on the inquest into the death of Katie Bender at the demolition of the Royal Canberra Hospital on I 3 July 1997, p. 33. 8 Sherman, p 343.
Page 9-3

• clarify the objectives of the legislation;
• identify the nature of the restriction on competition;
• analyse the likely effect of the restriction on competition and on the economy
generally;
• assess and balance the cost and benefits of the restriction; and
• consider alternative means for achieving the same result including non-legislative
approaches. 9
All reviews were predicated on the assumption that any legislative restriction to
competition is unnecessary unless proved otherwise. The only acceptable justifications
for legislation that restricts competition is that:
• the benefits of the restriction to the community as a whole outweigh the costs
(normally called the public interest test); and
• the objectives of the legislation can only be achieved by restricting competition. 10
This approach reflects the neo-classical economists' view of government intervention in
the economy. Neo-classical economics states, among other things, that the market
provides the most efficient allocation of resources and that government intervention is
only justified if three requirements are all met. They are:
• a demonstrated market failure;
• the market failure imposes a significant cost to society; and
• government intervention will actually correct the failure.
Neo-classical economic theory groups market failure into five main varieties; public
goods, monopolies, negative externalities, information asymmetry and disequilibrium.
These reviews were normally undertaken by consultants with an economics background
on behalf of governments. The quantification of the cost-benefit analysis can be highly
complex and consequently, non-economists had difficulty contributing to the process. In
addition, due to the difficulty in quantifying the public interest component of a piece of
legislation (often through a lack of knowledge by the consultant), the public interest
hurdle was frequently not met. Consequently de-regulation has occurred where a more
multi-disciplinary analysis may have resulted in a different outcome.
As an illustration of how the evaluation of regulation needed to be framed, below is a
breakdown of the costs and benefits using this taxonomy for the regulation of
9 Competition Principles Agreement, Clause 5 (9), 1995. 10 Competition Principles Agreement, Clause 5 (I), 1995.
Page 9-4
professional engineers. As you read it, think about the difficulties of quantifying these
costs and benefits in economic and other ways.
BENEFITS
• Overcoming information asymmetry: A registration system aids the market by
providing information to consumers on the education and experience levels of the
people who can offer engineering services. This enables consumers to make more
informed decisions. In particular it reduces the tendency for consumers to choose on
price alone due to their inability to consider other factors .
• Lower transaction costs: A registration system lowers the transaction costs for
consumers as it provides them with information on how to identify appropriate
service providers. Without this, some consumers, particularly one-off consumers, will
probably either abandon the search or make a less than optimal decision.
• Reducing negative externalities: As engineers are responsible for the integrity of
buildings, structures and numerous consumer items, many people besides the
consumer of the engineering services are affected by the service. A registration
system provides some guarantee of reducing this externality by eliminating non
qualified engineers and preventing engineers found guilty of misconduct from
continuing to practice. This externality is enhanced by requiring companies to have
professional indemnity insurance.
• Increasing positive externalities: A registration system provides a competitive edge
over other jurisdictions and countries when exporting goods and services. This is
because in the international trade of engineering products, certificates of compliance
from registered engineers are often required and one country may give preference to
other countries with registration systems.
COSTS
• Increased cost of engineering services: A registration system increases the cost of
services to the consumer by limiting the number of potential providers by enforcing
entry or experience restrictions; and forcing up costs for engineers by requiring them
to hold professional indemnity insurance and paying licence fees.
• Reduction in the choice of engineering services: A registration system reduces the
options for consumers who prefer lower quality advice and lower costs which could
be provided by engineering para-professionals and non-engineers who can substitute
for professional engineers.
Page 9-5
My contention is that due to the lack of involvement by those who understand the
beneficial outcomes of regulation, too many engineering functions have been de
regulated. These people, including engineers, probably didn't get involved as they either
didn't know the legislation was being reviewed or felt unequipped to influence the
decisions. Incidentally, the failure of engineers to engage in these debates is one of the
reasons why the profession is loosing respect in the community. If you don't publicly
stand up for the public interest against short-term financial interest, how does the public
know engineers abide by a code of ethics and are not simply technocrats for hire? The
legislative reform process offered a stage for this but engineers rarely stood on it.
So instead of a legislation-based regime, numerous non-legislative schemes were
introduced. These included:
• codes of practice
• voluntary agreements
• education campaigns
• self-regulatory codes
• co-regulatory systems
• laissez faire
All of them rely, ultimately, on some form of enforcement to ensure that good outcomes
are delivered. This enforcement can be grouped together under the 3 principles of
deterrence, detection and prosecution.
I will discuss each in turn and comment on their applicability and limitations under rare
extreme events, such as earthquakes, floods, fires, and severe impacts.
Deterrence can be achieved through several ways, notably market forces.
Market forces are fine if both buyers and sellers are informed and can weigh up the costs
and benefits of different price and service offerings. However in the case of extreme
events, it is unsuitable. This is because most buyers are not informed. The general person
does poorly at weighing up risks. For example, they give higher weighing to more
frequent, lower consequence hazards than to less frequent, higher consequence hazards.
Even for organisations which you would think are informed, my observation is that they
are becoming less so. This may be because there are less technical people in senior roles,
such as asset buyers , than in the past. For proof, look at the IEAust 2001 survey of
government agencies. We asked government engineers involved in contracts if they had
Page 9-6
sufficient technical expertise to be an informed buyer for their project. About 25% said
the expertise was inadequate.
A couple of interesting issues arise if an enforcement system relies on market forces but
these are not effective in regulating behaviour. Even if building owners were fully
informed of the risks of earthquakes, they still would not buy the appropriate level of
earthquake insurance. This is because they know that if a severe earthquake occurs,
government relief will be forthcoming. Given that insurance companies also know that
the government would underwrite them, they put far less effort into encomaging building
owners to buy more resilient designs or upgrade existing buildings. This in turn results in
diminished incentives for engineers and architects to gain the knowledge required to
build better structures.
In addition, if there is no penalty for those who do not follow a voluntary code nor get
benefit if they do, then not following the code can result in an unfair advantage.
The second principle of enforcement, detection, requires skilled people, sufficient
resources and an appropriate detection strategy.
Detection resources have always been in short supply but over the last decade, they have
been reduced even further. Government detection agencies have downsized, detection
staff have moved to policy development, or on-site inspections have been replaced by
paper based audits of systems.
A typical response from government when the regulatory system shift from prescriptive
regulation to self-regulation is that as certain work was no longer needed, such as sending
inspectors to companies to identify breaches of prescriptive rules and regulations, staff
are shed. But when new functions are identified, such as sending inspectors to sites to
ensure employers were providing a safe workplace and issuing prohibition or
improvement notices, instead of increasing staff numbers, the tired mantra of doing more
with less is trotted out.
One of the key difficulties for regulators is obtaining skilled staff. The consequences of
this can be seen in the delayed introduction of safety case regimes for major hazardous
facilities around Australia. Although the need for this approach was identified 15 years
ago, only 2 states have introduced the enabling legislation and even then they had to
import staff from the UK and US to ensure the system was monitored properly.
Page 9-7
The final principle of enforcement is prosecution. For this to be effective, prosecutions
actually have to occur and be seen to occur.
Unfortunately, in the rare event of a prosecution, most are settled out of court with non
disclosure clauses a condition of agreement. This limits the awareness of a prosecution
and undermines the effectiveness of enforcement.
There is no one best solution for ensuring enforcement is effective across all engineering
activities. Whatever approach is selected, it requires that the regulatory approach is
appropriate in the first place, appropriate strategies for enforcement are implemented and
that the system is continually reviewed. Interlocking checks and balances are essential.
Another critical element, notably for rare extreme events, is the active participation of
practitioners in the regulatory environment. If practitioners believe that the system is not
working, they are the ones with the greatest chance of changing it. Relying on
government to see the impending disaster is to wait for godot.
Don't believe the clap-trap about regulation stifling business. Just like financial regulation
and fair trading rules, sound building codes build prosperity, not endanger it. They can
turn a disaster into a minor disruption.
Arguing for increased regulation is not popular. But this is the distinction between
leadership and popularity- you do what needs to be done rather than what the majority of
people want in the short-term. If professional engineers want to start regaining the
community's respect, then they have to show strong leadership and do what is right,
rather than what today's ideology rewards.
The Gujarat earthquake near Bhuj, Western India- 26 January 2001, by Kevin McCue
The major earthquake that struck in the western Indian State of Gujarat (the region of Kutch) near the city
of Bhuj on January 26, 2001 (Indian Republic day) resulted in the worst natural disaster in India; at latest
count more than 20 000 people are known to have died and more than 200 000 made homeless. The death
toll will undoubtedly rise as the recovery operation proceeds.
The earthquake At magnitude (Mw) 7.7 the earthquake was indeed a major event. The causative fault was
perhaps 100 km long with a maximum throw of a few metres though no details of surface faulting have yet
been reported. More importantly for structures, the ground shaking on firm foundations would have been
quite strong within about 50 km of the fault. Numerous aftershocks have been and are being reported, the
largest magnitude (mb) 5.8 just 2 days after the mainshock on 28 January.
Page 9-8
The damage The graphic TV footage and photograrhs show massive and widespread destruction and
collapse, particularly of 3 to 5 storey apartment buildings. Already Indian engineers have attributed the
destruction to the total lack of resilience of homes and multi-storey dwellings due to roor mortar and
workmanship, the codes not being followed and obviously no inspection/certification by competent
engineering authorities.
The Hazard The earthquake hazard map of India shown on the Global Seismic Hazard Assessment Project
(GSHAP) map rates this area the highest risk in reninsula India, comparable to the highest earthquake
hazard in Australia which is centred on the Mcckering area cast of Perth Western Australia. Indian
Standards for earthquake resistant construction date back to 1893 and the Standard was last revised in 1994.
Most buildings designed and built to the Standard should have withstood the earthquake without collapse
the goal of the Standard.
Tectonic setting and History of Seismicity Peninsula India is considered to be a Stable Continental
Region (SCR) like Australia but, like Australia, has a history of strong earthquakes . The epicentre in the
Kutch (Cutch) region is some 450 k.m from the nearest plate boundary to the west but the historical record
shows a remarkable level of activity there. Many sources such as Richter (1958) describe the effects of the
1819 Rann of Kutch earthquake (see the abstract below)
Prior to this latest Kutch earthquake, the worst of the most recent peninsula India earthquakes was that at
Latur (Killari) on 30 September 1993 which killed about I 0 000 people when their adobe homes collapsed
in the magnitude (Ms) 6.2 earthquake (the same size as the 2 June 1979 Cadoux W A earthquake).
Records of earthquakes in the Kutch region go back to at least 1844, the most recent large earthquake
occurred there in 1956 when 'there was great damage and loss of life' (Richter, 1958). In 1906 there was a
magnitude (Ms) 6.2 earthquake there (Ambrascys, 2000).
Lessons for Australia If the 1819 event in the Kutch region had occurred in Central or Western Australia
we would probably have no knowledge of it because of the sparse population and non existence of
seismographs then. The largest known Australian earthquake occurred offshore W A in 1906, its magnitude
(Ms) 7.2. There is no reason to suppose that a magnitude 7.7 earthquake could not occur in Australia and if
it struck a populated area there would be great damage and collapse of structures. Few buildings in
Australia have been designed or constructed to resist earthquake shaking. After the magnitude (Ms) 6.8
Meckering WA earthquake only some large buildings in Adelaide and Perth and large Commonwealth
Government buildings were so built. Domestic housing was not considered in the Loading Code until after
the 1989 Newcastle earthquake when Australian Standard AS 1170.4 -1993 was introduced and even then
compliance was required only in a few of the higher risk regions. In the main Australian buildings are
neither designed nor built to resist earthquakes so they will not.
Australia and Peninsula India have similar levels of hazard, they are both SCR's or intraplate regions and
whilst large earthquakes do occur they are infrequent. The consequences however of a large infrequent
earthquake in an urban area are terrible as recent earthquakes in Kobe Japan, Turkey, Taiwan and now
India continue to demonstrate. The earthquake near Newcastle in 1989 was a relatively small earthquake
but caused widespread damage to unreinforced masonry structures, hospitals, schools, an ambulance station
and fire station.
Page 9-9
Even if a eountry has a modern building code, and Australia is about to introduce a new joint Loading Code with New Zealand, there is no benefit if the code can be ignored , if the reg11la.tions of the code are not
applied, or the structure designed but not inspected for compliance during construction. No one in Australia has addressed the problem or pre-code buildings, those not designed for earthquakes but which are more vu lnerable because they have also suffered loss of strength and resilience due to aging and di fferential
settlement. The populace may think they are protected when in fact they are not.
In recent years some effort has been made to study the paleoseismicity (prehistoric ea rthquakes) or the Kutch region. Below is aJ1 abstract of a paper on the deformati.on characteristics in the Kutch seismic zone.
A similar study should be done in AustraJia after all Recent fault scarps have been identified and mapped.
Links
hllp://ne ic.us~ov/neis/eqhaz/0 I 0 126.html USGS site with seismological info including a number of
links lo other sites of porcnrial interest.
http://www.ceri.org/ Earthquake Engineering Research Institute site with information on damage and post
event investigations
htlp://mac.s.:e.uiuc.cdu/ Mid America Earthquake Center site with discussions of similarities of this event to
the New Madrid earthquakes, plus information on a post disaster reconnaissance team being sent by the
Center.
Page 9-10

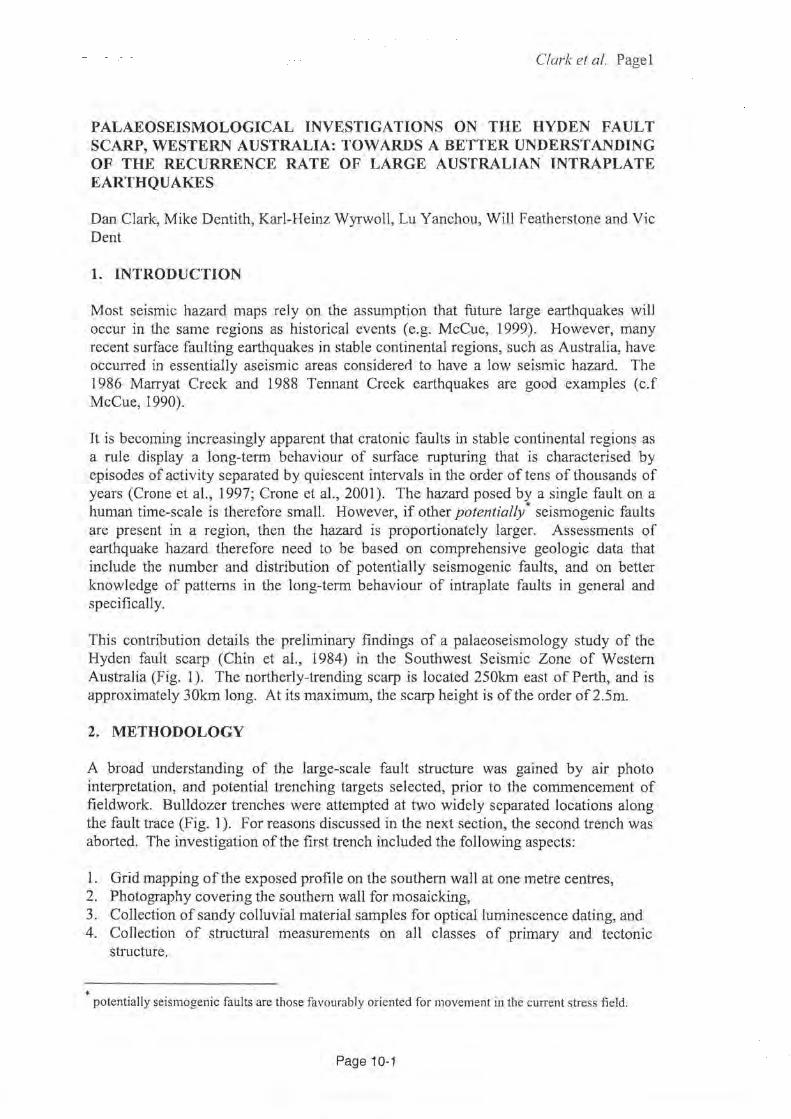
PALEOSEISMOLOGICAL INVESTIGATIONS ON THE HYDEN FAULT SCARP, WESTERN AUSTRALIA: TOWARDS A BETTER
UNDERSTANDING OF THE RECURRENCE RATE OF LARGE AUSTRALIAN INTRAPLATE EARTHQUAKES
DAN CLARK, MIKE DENTITH, KARL-HEINZ WYRWOLL, LU Y ANCHOU, WILL FEATHERSTONE AND VIC DENT
AUTHORS:
Dr Dan Clark, B.Sc. (Hans) Uni. Sydney 1994, Ph.D. UNSW 1999. AGSO- Geoscience Australia Resume: Worked as an engineering/tunnel geologist for Connell Wagner until 12/2000. Joined AGSO Geohazards division 2/2001 working in the Neotectonics project. Research interests include tying seismicity with geological structure and palaeoseismology.
Associate Professor Mike Dentith, B.Sc(Hons) Nottingham 1984, Ph.D Glasgow, 1987. Department of Geology and Geophysics, University of Western Australia Resume: Responsible for geophysical teaching and research at The University of Western Australia. Research intere ts include processing and interpretation of potential field data, geophysical signatures of mineral deposits and Australian seismicity.
Dr. Karl-Heinz Wyrwoll, B.Sc.(Lond), M.Sc. (McGill), Ph.D. (Land) Department of Geography, University of Western Australia Resume: Senior Lecturer in geomorphology, Quaternary geology, paleoclimatology and neotectonics. Research interests include geomorphology, Quaternary geomorphology and environmental history .
Professor Lu Yanchou Affiliation: Institute of Geology, China Seismological Bureau, Beijing, China. Resume: Extensive experience in dating recent fault movements using optical luminescence methods.
Professor Will Featherstone Qual(fications: B.Sc. (Honsl) Geophysics and Planetary Physics, School of Physics, University of Newcastle upon Tyne, England; Ph.D. Geodesy, Department of Earth Sciences, University of Oxford, England. Affiliation: Department of Spatial Sciences, Curtin University of Technology, Perth, W A 6009. Resume: Lecturer in Surveying and geodesy. Research interests include Physical Geodesy, Geometrical Geodesy, Satellite Geodesy and Geophysics.
Vic Dent MSc. University of WA, BSc., Univ of Sydney Affiliation: Deparlment of Geology and Geophysics, University of Western Australia, Resume: . Seismologist with AGSO for 25 years, working in Antarctica, Papua New Guinea, ACT and Perth. Now an Honorary Research A istant at UW A
ABSTRACT:
Preliminary results are presented for a palaeoseismological investigation conducted over the Hyden fault scarp in southwest Western Australia. Structures revealed in a 36m x 4m bulldozer trench indicate that one, or at the most two, large shallow earthquake events are responsible for formation of the scarp. The geometry of faulting is consistent with thrusting under east-west directed compression, similar to nearby scarps at Meckering, Calingiri and Cadoux. Empirical relationships developed to estimate the magnitude of prehistoric earthquakes suggest that one magnitude Ml 6.8 event or two Ml 6.0 events are required to produce the observed fault length and scarp height.
The ages obtained from optical luminesence dating currently in progress will constrain the time of scarp formation. This will lead to better constraints on the spatial distribution and frequency of large shallow earthquakes in Australia, and could be used to extrapolate observed earthquake recurrence relationships for hazard analyses.
Paper No.lO
Clark eta!. Page 1
PALAEOSEISMOLOGICAL INVESTIGATIONS ON THE HYDEN FAULT SCARP, WESTERN AUSTRALIA: TOWARDS A BETTER UNDERSTANDING OF THE RECURRENCE RATE OF LARGE AUSTRALIAN INTRAPLATE EARTHQUAKES
Dan Clark, Mike Dentith, Karl-Heinz Wyrwoll, Lu Yanchou, Will Featherstone and Vic Dent
1. INTRODUCTION
Most seismic hazard maps rely on the assumption that future large earthquakes will occur in the same regions as historical events (e.g. McCue, 1999). However, many recent surface faulting earthquakes in stable continental regions, such as Australia, have occurred in essentially aseismic areas considered to have a low seismic hazard. The 1986 Marryat Creek and 1988 Tennant Creek earthquakes are good examples (c.f McCue, 1990).
It is becoming increasingly apparent that cratonic faults in stable continental regions as a rule display a long-term behaviour of surface rupturing that is characterised by episodes of activity separated by quiescent intervals in the order of tens of thousands of years (Crone et al., 1997; Crone et al., 2001). The hazard posed by a single fault on a human time-scale is therefore small. However, if other potentially* seismogenic faults are present in a region, then the hazard is proportionately larger. Assessments of earthquake hazard therefore need to be based on comprehensive geologic data that include the number and distribution of potentially seismogenic faults, and on better knowledge of patterns in the long-term behaviour of intraplate faults in general and specifically.
This contribution details the preliminary findings of a palaeoseismology study of the Hyden fault scarp (Chin et al., 1984) in the Southwest Seismic Zone of Western Australia (Fig. 1 ). The northerly-trending scarp is located 250km east of Perth, and is approximately 30km long. At its maximum, the scarp height is ofthe order of2.5m.
2. METHODOLOGY
A broad understanding of the large-scale fault structure was gained by air photo interpretation, and potential trenching targets selected, prior to the commencement of fieldwork. Bulldozer trenches were attempted at two widely separated locations along the fault trace (Fig. 1). For reasons discussed in the next section, the second trench was aborted. The investigation of the first trench included the following aspects:
1. Grid mapping of the exposed profile on the southern wall at one metre centres, 2. Photography covering the southern wall for mosaicking, 3. Collection of sandy colluvial material samples for optical luminescence dating, and 4. Collection of structural measurements on all classes of primary and tectonic
structure.
* potentially seismogenic faults are those favourably oriented for movement in the current stress field.
Page 10·1

Hyden 40km
! )
I
I
,..-
'. I '
119'20'
<t ' __ / ' I
Trenc~Jj {
, ' ~ I
Building
L __ Road
' ~~~ce
I Fault scarp
I Airpholo lineament
Exposed bedrock
". Ephemeral \ drainage
0 1 2 J 4 !,,! I I I
K~omctres
Clark eta!. Page2
Fig. 1. Hyden fault with location of previous studies and our trenches marked.
In addition to the above, four separate fault-perpendicular levelling traverses were conducted, extending for one kilometre each side of the trace. Three were located near to the south end of the fault proximal to the first trench, and the fourth proximal to the second trench. The precise spirit-levelling traverses were tied in to the Australian Height Datum with dual-frequency carrier-phase GPS data collected at at least one point per traverse (Featherstone et al., 2001).
3. RESULTS
Four important features of the fault geometry became apparent as a result of the preliminary airphoto interpretation (Fig. 1 ).
1. The fault is linear over approximately 35km, 2. the fault comprises two strands joined by a central accommodation structure, 3. at its southern extent, the fault deviates to a southeasterly trend. Several other
lineaments parallel the deviated trend in this area, 4. at least one, and maybe as many as three sag pond features are apparent near the
southern end ofthe fault.
The gross structure of the fault, its linearity over 35km, the geometry of lineaments at its southern termination, and the geometry of the 'accommodation structure' linking the two strands are suggestive of sinistral strike slip movement. However, the formation of a prominent fault scarp requires a significant vertical component to the movement as well.
Page 10-2
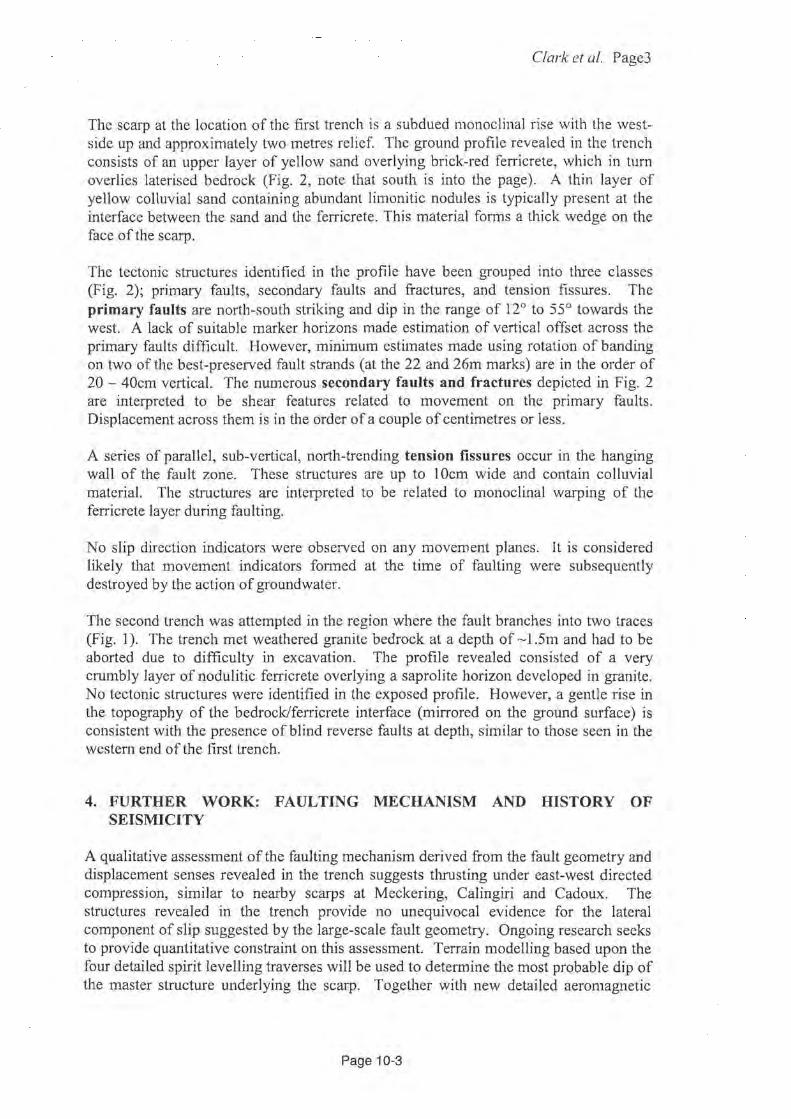
Clark eta!. Page3
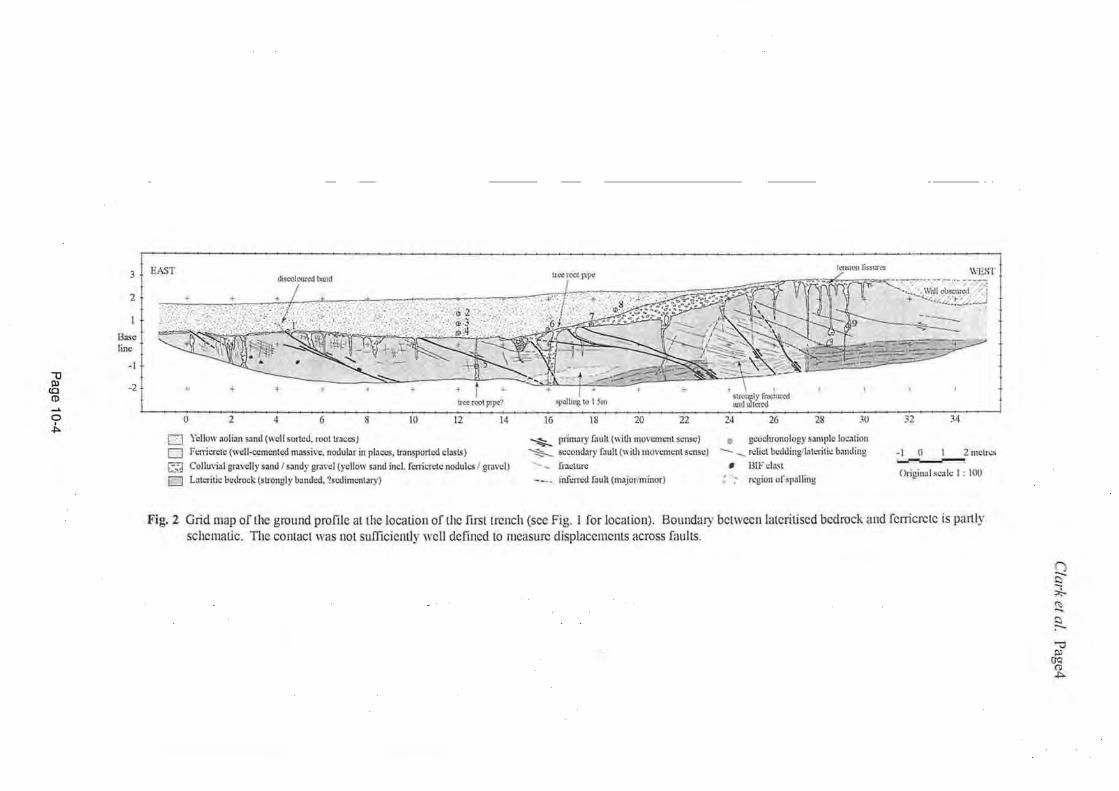
The scarp at the location of the first trench is a subdued monoclinal rise with the westside up and approximately two metres relief. The ground profile revealed in the trench consists of an upper layer of yellow sand overlying brick-red ferricrete, which in tum overlies laterised bedrock (Fig. 2, note that south is into the page). A thin layer of yellow colluvial sand containing abundant limonitic nodules is typically present at the interface between the sand and the ferricrete. This material forms a thick wedge on the face ofthe scarp.
The tectonic structures identified in the profile have been grouped into three classes (Fig. 2); primary faults, secondary faults and fractures, and tension fissures. The primary faults are north-south striking and dip in the range of 12o to 55° towards the west. A lack of suitable marker horizons made estimation of vertical offset across the primary faults difficult. However, minimum estimates made using rotation of banding on two of the best-preserved fault strands (at the 22 and 26m marks) are in the order of 20 - 40cm vertical. The numerous secondary faults and fractures depicted in Fig. 2 are interpreted to be shear features related to movement on the primary faults. Displacement across them is in the order of a couple of centimetres or less.
A series of parallel, sub-vertical, north-trending tension fissures occur in the hanging wall of the fault zone. These structures are up to 1 Ocm wide and contain colluvial material. The structures are interpreted to be related to monoclinal warping of the ferricrete layer during faulting.
No slip direction indicators were observed on any movement planes. It is considered likely that movement indicators formed at the time of faulting were subsequently destroyed by the action of groundwater.
The second trench was attempted in the region where the fault branches into two traces (Fig. 1 ). The trench met weathered granite bedrock at a depth of -1.5m and had to be aborted due to difficulty in excavation. The profile revealed consisted of a very crumbly layer of nodulitic ferricrete overlying a saprolite horizon developed in granite. No tectonic structures were identified in the exposed profile. However, a gentle rise in the topography of the bedrock/ferricrete interface (mirrored on the ground surface) is consistent with the presence ofblind reverse faults at depth, similar to those seen in the we stem end of the first trench.
4. FURTHER WORK: FAULTING MECHANISM AND HISTORY OF SEISMICITY
A qualitative assessment of the faulting mechanism derived from the fault geometry and displacement senses revealed in the trench suggests thrusting under east-west directed compression, similar to nearby scarps at Meckering, Calingiri and Cadoux. The structures revealed in the trench provide no unequivocal evidence for the lateral component of slip suggested by the large-scale fault geometry. Ongoing research seeks to provide quantitative constraint on this assessment. Terrain modelling based upon the four detailed spirit levelling traverses will be used to determine the most probable dip of the master structure underlying the scarp. Together with new detailed aeromagnetic
Page 10-3
3
2
l
13nsc line
·I -:o Ill co -2 m ...... 0
I
~ 0 2 " 6 8 10 12 14
[] Yo!Jow aolian saml (well sorfud, roollroccs) 0 Ft:nicrele (well·ccmmlcd massive. nodular in pl~ccs, lrnnsportccl clasts) ~ Colluvial gravelly sand / sandy gr:>\'cl (ydlow sand incl. fcnic:rctc nodules / gravel) D Latorltic bedrock (slrongly bonded, ?scdimenlnry)
$J~Oilin;tla Lim
16 18 20 22
~ primal)' foul! (wiU1 movcm<;.11l sense) ~ SI.'CCJUdary foul!(\\ ilh III0\'~111Cnl St.'IISC)
.._ - frnclure
- -. infm-.::d foul! (mojorlminor)
r..-n:Uot\fi~Jll'~ \VEST
24 26 28 :;o n 34
C!l gw.:lmmology SDIIl(lh: local ion - -. relict bcddingilatcrilic bamling ·I 0 2mc~-,;
• ULFclo~t
~ . ~ n:gion or!IJlaltinJ:: CJriginaL~calc 1 : IOU
Fig. 2 Grid map of the ground profile at the location of the first trench (see Fig. I for location). Boundary between lcllerilised bedrock and ferricrcte is panly schematic. The contact was not sufficiently well defined to measure displacements across faults.
(') --9 ::i--~ t::l :--..., PJ
~ .j::.>..

Clark eta!. PageS
data, a better estimate of the in-section movement required to produce the scarp and the horizontal component of slip, respectively, may be obtained.
A selection ofthe nine samples collected from the first trench (see Fig. 2) will be dated using optical luminescence methods in Beijing later this year. It is anticipated that the results will help establish the number of phases of movement represented by the structures exposed in the trench profile, and constrain the time(s) of faulting. The age data will also help in correlating structures recognised in our trench with those described from a trench 4km to the north of ours excavated by the USGS in the late 1990's (Fig. 1).
The above dating, modelling and geophysical information will be used to derive an accurate estimate of the number and magnitude of surface-rupturing earthquakes that have occurred on the Hyden Fault, thus providing insight into its long-term behaviour, and the long-term patterns of activity on Southwest Seismic Zone faults in general. This will lead to an improvement in earthquake hazard assessments in the Southwest Seismic Zone, which currently rely on the unproven assumption that future large earthquakes will occur in the same regions as historical events.
REFERENCES
Chin, R., Hickman, A. and Thorn, R. (1984). Hyden 1:250,000 geological senes explanatory notes. Geological Survey of Western Australia, 21 p.
Crone, A., Machette, M. and Bowman, J. (1997). Episodic nature of earthquake activity in stable continental regions revealed by palaeoseismicity studies of Australian and North American Quaternary faults. Australian Journal of Earth Science, Vol 44, pp 203-214.
Crone, A., De Martini, P., Machette, M., Okumura, K. and Prescott, J. (2001). Palaeoseismicity of aseismic Quaternary faults in Australia - implications for fault behaviour in stable continental regions. Bulletin of the Seismological Society of America, submitted.
Featherstone, W., Dentith, M., Dent, V., Wyrwoll, K., Clark, D. and Yanchou, L. (2001). Transfer ofvertical geodetic control using only one GPS receiver: a case study from palaeoseismology. in prep.
McCue, K. (1990). Australia's large earthquakes and Recent fault scarps. J. Structural Geology, Voll2, pp 761-766.
McCue, K. (1999). Seismic hazard mapping in Australia, the Southwest Pacific and Southeast Asia. Annali di Geofisica. Vol 42, pp 1191-1198.
Page 10-5
LIFELINES ENGINEERING IN NZ: MOVING INTO THE SECOND DECADE
DAVID BRUNSDON NATIONAL LIFELINES CO-ORDINATOR, NZNSEE
AUTHOR:
David Brunsdon is the current President of the New Zealand Society for Earthquake Engineering, and is the National Lifelines Co-ordinator. He is Director, Special Projects of Spencer Holmes Ltd, a consulting engineering, surveying and planning practice. He spent two years assisting in Newcastle following the 1989 earthquake.
ABSTRACT:
Over the past decade in New Zealand, Lifelines Projects have played an important role in helping individual utility organisations address mitigation and preparedness for regional scale natural hazard events. Lifelines Projects involve the facilitation of a regionally-based collective physical risk management process for natural hazards. Through this process, the vulnerability of many of New Zealand's utility and transportation network operators has been reduced.
This paper describes the New Zealand lifelines engineering methodology, and the mitigation and response preparedness achievements over the past decade. The challenges faced by the utility sector in continuing to reduce its vulnerability to regional scale natural hazard events are also outlined.
Paper No.ll

Lifelines Engineering in New Zealand:
1. INTRODUCTION
Moving into the Second Decade
David Brunsdon National Lifelines Co-ordinator
Lifelines are those essential services which support the life of communities. These are either utility services such as water, wastewater, power, gas and telecommunications, or transportation networks involving roading, rail, pmts and airports.
Significant developments have occurred in the field of lifelines engineering over the past decade both in New Zealand and internationally. In New Zealand, this period encompassed both the beginnings of lifelines activity and its development into being an established discipline across virtually all regions.
The overall objectives of Lifelines Engineering are: (i) to reduce damage levels following a major disaster event; and (ii) to reduce the time taken by lifelines services to restore their usual level of service.
2. THE NEW ZEALAND LIFELINES ENGINEERING PROCESS
2.1 Origins and Current Status Lifelines engineering in New Zealand began as a separate discipline with the Lifelines in Earthquakes: Wellington Case Study project. This project was initiated, produced and largely funded by the Centre for Advanced Engineering, and was completed in 1991 (CAE, 1991 ). This project has provided the impetus and a point of reference for all subsequent lifelines work in New Zealand.
There are currently 15 Lifelines Projects either planned or underway across New Zealand. This essentially correlates to one Project for each of the country's regions. Once the many positive benefits from the initial projects became apparent, the regional lifelines model and methodology spread rapidly across NZ in the late 1990's.
Page 11-1

2.2 NZ Approach The New Zealand Lifelines process is based around the following risk management steps: • Identifying the hazards which could affect each lifelines network • •
• •
Compiling common inventories of the various utility and transportation networks Assessing the vulnerability of the lifeline network to those hazards (the potential damage to and consequences for each network) Identifying and implementing practical mitigation measures Facilitating the preparation of comprehensive emergency response plrtns
This process is based on risk management methodology encapsulated in AS/NZS 4360:1999 (SA & SNZ, 1999), and is described more fully elsewhere (Brunsdon, 2001)
With respect to hazards, the focus of lifelines work in New Zealand is on regional scale events that are beyond the ability of individual organisations to respond to and control. The responsibility however for taking appropriate mitigation and preparedness steps remains with the individual organisations.
The five key Lifelines steps typically take from 3 to 5 years to work through for each region, and result in a major report. Reports have been completed by Lifelines Projects in the major metropolitan centers of Wellington (CAE, 1991), Christchurch (CAE, 1998), Dunedin (DELP, 1999) and Auckland (ARC, 1999). Projects currently underway in the remaining regions face the challenge of adapting the metropolitan methodologies to suit smaller and more dispersed centres with much less dense and/ or widely spread utility networks.
The Lifelines process is however an ongoing one, reflecting the iterative nature of risk management generally. Communication of the findings, outcomes and recommended mitigation and response preparedness measures to stakeholder groups and the wider community follows the completion of the initial report. This is a progressive and continuous process, often leading to a review of individual asset management plans. A review of mitigation and preparedness progress and achievements across all organisations involved is typically conducted on an annual basis. This important step maintains the momentum and information exchange achieved by the earlier work.
Page 11-2

2.3 Achievements There has been a range of physical mitigation undertaken by the various utility sectors over the past decade. While some of this work was or would have been initiated by the respective individual utility asset management plans, the lifelines process has provided a sharper focus and often a greater sense of urgency in the 'toughening' of networks.
A sample of generic mitigation projects for each of the key sectors is outlined below:
Water Supply Seismic upgrading of reservoirs, often with the addition of automatic shutoff valves Creation of medium-term (1 0 to 20 year) mitigation programmes integrated with Asset Management plans
Electricity Strengthening or replacement of substation buildings Upgrading of switchyard facilities, including transformer mountings and switchgear suppOtt frames
Gas Relining of old cast iron gas mains in the capital city of Wellington with modern PVC mains operating at higher pressures Improved the ability to isolate gas distribution networks into smaller sectors b_y the introduction of more valving
Telecommunications Strengthening of exchange buildings Achieving greater route diversity by developing new cable routes
Transportation Developed seismic evaluation methodologies for road bridges that take the availability of alternative routes into account ]trengthening of vulnerable road and rail bridges
Virtually all utilities have undertaken programmes to brace and tie down control cabinets and computers in control rooms. Some utilities have developed new systems of equipment and spare parts inventories and storage ( eg. horizontal storage of critical and brittle spares to minimise damage).
With respect to response preparedness, there has been a growing awareness of the implications of dependence of many utility organisations on their maintenance contractors. Maintenance contracts are now subject to more careful scrutiny to ensure that appropriately experienced repair personnel are available on a stand-by basis and, more importantly, they are available on an exclusive basis rather than being shared with other utility companies. This highlights one of the key thrusts of the new Civil Defence Emergency Management arrangements in New Zealand, which is to place greater emphasis on self-sufficiency by key utility organisations. 3. CURRENT AND FUTURE CHALLENGES
Lifeline utilities have undergone considerable transformation over the past decade. The restructuring in most sectors has led to a greater commercial focus, particularly for those with revenue directly at risk. This in turn has led to significant advances in financial risk management. However many of the 'newer' utilities have not given the same level of attention to mitigation and preparedness for longer return period hazard events. The same can also be said for some from the category of utilities that do not have revenue
Page 11-3
directly at risk.
A major need is the development of a consistent economic framework for justifying investment for mitigation and preparedness for low probability/ high impact natural hazard events. This remains a significant challenge.
There is also a need to recognise at the governance level of many utility organisations that in the absence of 'real' events, specific steps need to be taken to achieve an appropriate level of robustness. This is otherwise known as establishing a defensible position.
4. CONCLUDING OBSERVATIONS
The response of a utility organisation after a major emergency is heavily influenced by the performance of other utility agencies. The key feature of the Lifelines process is that by working together, utility organisations can identify the common areas of physical vulnerability, and understand the problems faced by those utilities upon which they in turn depend. A clearer set of mitigation priorities results, with benefits also flowing on into the critical response phase operations.
New Zealand's regionally-based approach to lifelines work is considered to be unique internationally. This is due to the close technical co-operation between the various organisations involved which cuts across commercial considerations.
The key to the success of lifelines work in New Zealand lies in its ability to portray the wider view of risk from natural hazards, with particular emphasis on earthquakes given New Zealand's seismic context. Lifelines studies and the analysis of recent international earthquakes have generated a much clearer picture of what the real situation is likely to be following a major natural hazard event. This information is being applied in a range of ways by Civil Defence Emergency Management agencies, with whom utility organisations have developed stronger working relationships.
Many organisational challenges however remain for New Zealand in creating an integrated response capability within and across the various utility sectors.
References
Auckland Regional Council, 1999. Auckland Engineering Lifelines Project: Final Report -Stage 1 ARC Technical Publication No. 112, ISSN No. 1172 6415, Auckland, New Zealand.
Brunsdon D R, 2001. Lifelines Engineering in New Zealand: A Decade of Collaboration and Achievement, Proc. Wellington Lifelines Group International Workshop, Wellington Regional Council, ISBN 0909016771, Wellington, New Zealand.
Centre for Advanced Engineering, 1991. Lifelines in Engineering - Wellington Case Study, Project Summary and Project Report, Centre for Advanced Engineering,
Page 11-4

University of Canterbury, Christchurch, New Zealand.
Centre for Advanced Engineering, 1998. Risks & Realities: A Multi-discipUnaty Approach to the Vulnerability of Lifelines to Natural Hazards, Christchurch Engineering Lifelines Group Report, University of Canterbury, Christchurch, New Zealand.
Dunedin City Lifelines Project, 1999. Dunedin City Lifelines Project Report, ISBN No. 0-9597722-2-7, Dunedin, New Zealand.
Standards Australia and Standards New Zealand, 1999. Risk Management AS/ NZS 4360, Sydney and Wellington.
G:\ol Wf'Uscrs\DavcBruniNZNSJ;E\Con fercncc\AEilS 200 I \AEESPnJll:rBrunstfon.dcx:
Page 11-5

EARTHQUAKE RISK ASSESSMENT FOR LIFELINES NETWORK SYSTEM USING GIS
AUTHORS:
JOHN PRABAHARAN AND BERT VEENENDAAL CURTIN UNIVERSITY OF TECHNOLOGY
D. John Prabaharan is a postgraduate student at Curtin University of technology. He completed his M.Tech in Remote sensing from India and M.Phil in GIS and Remote sensing from Cambridge. He received awards from Overseas Development Authority and Cambridge Common Wealth Trust, England. He is also the recipient of the IPRS and Department of Spatial Science scholarships.
Dr. Bert Veenendaal is a senior lecturer at Curtin University of Technology and has been instrumental in the development of the teaching and research program in Geographic Information Science since its inception in 1988. Dr. Veenendaal has several awards, scholarships and grants to his credit, together with over 40 publications in his areas of interest. He is the recipient of the prestigious 1998 AISIST Award as well as a Curtin Innovative Practice Teaching 2000 award . Currently, he is Project Coordinator for the 2001-2003 Learning Effectiveness Alliance Program (LEAP) Spatial Sciences Project as well as for projects utilising GIS in risk management and rural health development. Dr. Veenendaal has recently been elected as president-elect of AURISA, the spatial information association.
ABSTRACT
Lifelines are very essential civil infrastructures that provide the basic networks/linkages among people and essential services to business and industry. This paper presents an overview of lifeline risk assessment method using Geographic Information System (GIS). The complex interaction between different types of lifelines such as water supply, electrical, communication, gas, oil, transportation and wastewater network systems are examined. The possible direct damages i.e primary effects and indirect or secondary effects related to the lifeline system due to earthquake are also discussed. In addition, the importance of the lifelines during the earthquake crisis period, disaster recovery and loss reduction processes is also examined. The highest credible loss and loss levels by probability methods are proposed for lifeline risk assessment. A future vision, scope and extent of lifeline risk assessment process in Australian urban communities are also presented.
Paper No.12

An Overview of Earthquake Risk Assessment for Lifeline Network Systems using GIS
D. John Prabaharan and Dr. Bert Veenendaal
Curtin University ofTechnology, GPO Box U 1987, Perth, WA 6845, Australi a. Tel : +618 9266 7566, Fax: 618 9266 2703.
Email : [email protected] .au and [email protected]
• D. John Prabaharan is a postgraduate student at Curtin University of technology. He completed his M.Tech in Remote sensing from India and M.Phil in GIS and Remote sensing from Cambridge. He received awards from Overseas Development Authority and Cambridge Common Wealth Trust, England. He is also the recipient of the IP RS and Department of Spatial Science scholarships.
• Dr. Bert Veenendaal is a senior lecturer at Curtin University of Technology and has been instrumental in the development of the teaching and research program in Geographic Information Science since its inception in 1988. Dr. Veenendaal has several awards, scholarships and grants to his credit, together with over 40 publications in his areas of interest. He is the recipient of the prestigious 1998 AISIST Award as well as a Curtin Innovative Practice Teaching 2000 award. Currently, he is Project Coordinator for the 2001-2003 Learning Effectiveness Alliance Program (LEAP) Spatial Sciences Project as well as for projects utilising GIS in risk management and rural health development. Dr. Veenendaal has recently been elected as president-elect of AURISA, the spatial information association.
Summary
Lifelines are essential civil infrastructures that provide the basic linkages and networks among people and provide essential services to business and industry . This paper presents an overview of lifeline risk assessment methods using geographic information systems (GIS). The characteristics and complex interaction between different types of lifelines such as, water supply, electricity, communication, gas, oil, transportation and wastewater network systems are examined. The potential damages involving primary and secondary effects related to lifeline systems are discussed. In the context of earthquake disasters, the importance of lifelines during the earthquake crisis period, disaster recovery and loss reduction processes are examined. The highest credible loss and loss levels by probability methods are analysed based on the 1979 Cadoux earthquake scenario. A proposed vision, scope and extent of the lifeline risk assessment process in Australian urban communities are presented.
1. Introduction
Australian cities and towns have an enormous social, economic and environmental diversity . Despite this diversity, the common challenge is socio-economic development of Australia's cities and towns . Central to this socio-economic development is the need to develop a number of important strategies for managing risk associated with natural hazards and providing people with safe, healthy and economically competitive environments in which to live and work. In this context, lifelines play a major role. Lifelines provide the basic linkages and networks among people and provide essential services to business and industry . Risk, in the context of lifelines refers to the expected damage of a lifeline system, and disruption to people and/or economic activity due to loss of functionality caused by a particular natural hazard . The purpose of this paper is to provide an overview of earthquake risk assessment methods related to lifeline network systems.
1.2 Characteristics of Lifeline Systems
Lifelines are typically divided into six categories, namely, electricity, water supply, sewerage, gas and liquid fuels, transportation, and communication systems (Lau et a!., 1995 cited in Anderson and Gow, 2000). Lifeline systems have properties involving diversity in their components, geographic distribution, interaction within and between lifeline systems and
Page 12-1

variation in their performance, particularly during earthquake crisis time (0' Rourke, 1998). Lifeline systems are often interconnected and interdependent, and interaction between them can be very complex (Figure Ia). Electricity and gas generated fires resulting from an earthquake will place demand on the water supply system (O'Rourke, 1998). The \Vater supply system may, in turn, be disrupted by damage to powerlines.
.. I T
s-ystem
·· .. -.--'.-:f""';.,-,--' .....
:.;~,:.r;~ ~=·~r~l'liGn +-- -i.!; ... ~t~.:!.l~ u;la.-!o:t'.(•:i ~ -···-~-
'!i::-ak :l<·!r:£bcon <C
a b Figure 1 a) Interaction between life! ine systems during an earthquake crisis period .
b) Earthquake risk scenario for lifeline systems
2. GIS and Lifeline Risk Assessment
Earthquake prediction in both space and time, remains a very difficult task for researchers, especially in a continent like Australia. The lack of ability to predict earthquake in both time and space directly influences the necessity of risk assessment in earthquake hazard areas. Risk assessment can help to improve planning, mitigation measures, preparedness and post earthquake performance, involving response and recovery processes, resulting in the protection of lives and preservation of the health ofthe economy.
GIS is an important tool for studying lifeline risk because, as mentioned earlier, lifeline systems can span multiple geographic features and can vary structurally among the various components of the network. GIS is capable of integrating a wide range of spatially varying and related data for detailed modelling and analysis. GIS functionality allows a more appropriate consideration of spatial patterns and relationships and hence a better understanding of earthquake damage and loss. The boolean overlay functions involve spatial mathematics and are suitable for complex analyses (Gaus and Nikolaous, 1997). In addition, spatial and attribute data may be combined and re-generated through the development of spatial scripts and algorithms that can simulate interactions between user specified variables. This is a form of dynamic modelling and can be applied to generate simulated scenarios for studying the impact of eatthquake hazards on selected lifeline systems (Anderson and Gow, 2000).
3.Earthquake and its Impact to the Lifeline Systems
Earthquakes can initiate a variety of other hazards, including fault ruptures, ground shaking, liquefaction and tsunamis. The earthquake effects on the lifeline systems can be divided into two major groups: primary (eg. direct) effects and secondary effects. The earthquake risk scenarios for lifeline systems are shown in Figure 1 b. The consequences of physical impacts and/or damage to the lifeline systems resulting from an earthquake are referred to as direct damage. For example, a transportation network system comprising roads, rail, bridges, airpmts, harbours and communication structures, can collapse due to a severe eatthquake. The losses due to direct damage are referred to as direct losses.
Direct damage can induce further damage or disruption to lifeline systems. This is referred to as indirect damage. Fires frequently occur after earthquakes because damaged gas pipelines can release flammable fuels and cause numerous ignitions. This can result in widespread damage to properties involving additional lifeline systems and affect essential emergency
Page 12-2
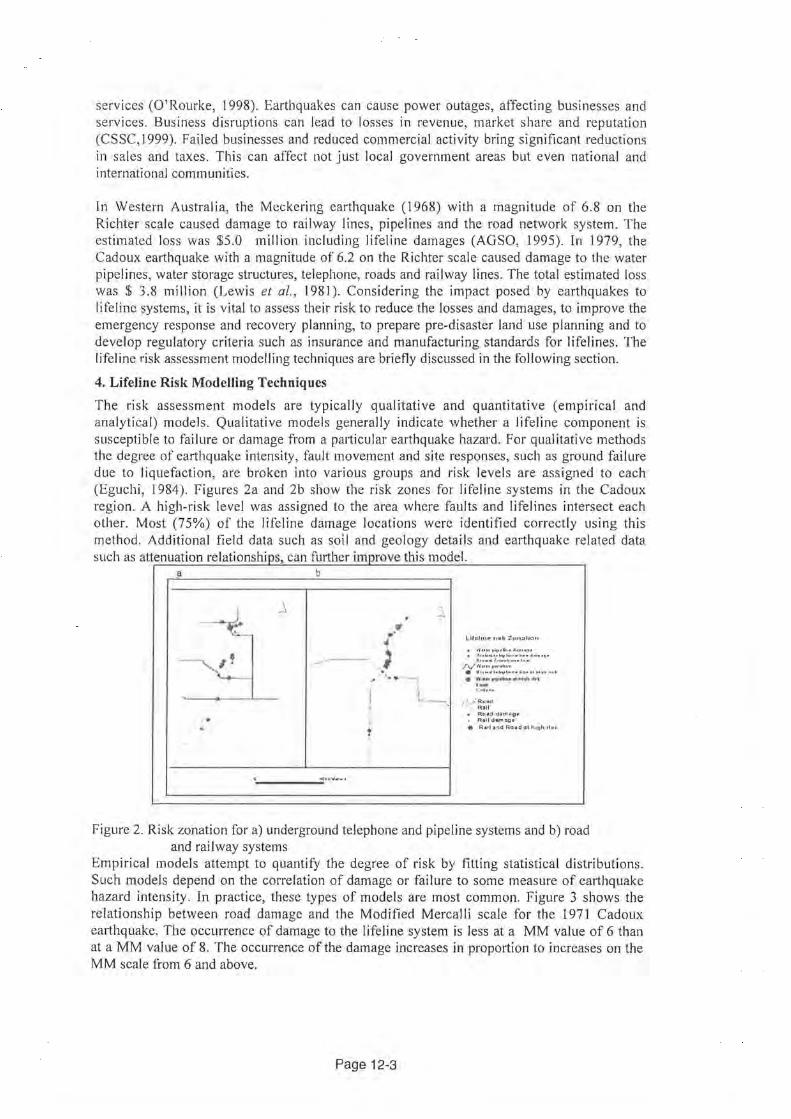
services (O'Rourke, 1998). Earthquakes can cause power outages, affecting businesses and services. Business disruptions can lead to losses in revenue, market share and reputation (CSSC, 1999). Failed businesses and reduced commercial activity bring significant reductions in sales and taxes. This can affect not just local government areas but even national and international communities.
In Western Australia, the Meckering earthquake (1968) with a magnitude of 6.8 on the Richter scale caused damage to railway lines, pipelines and the road network system. The estimated loss was $5.0 million including lifeline damages (AGSO, 1995). In 1979, the Cadoux earthquake with a magnitude of 6.2 on the Richter scale caused damage to the water pipelines, water storage structures, telephone, roads and railway lines. The total estimated loss was $ 3.8 million (Lewis et al., 1981). Considering the impact posed by earthquakes to lifeline systems, it is vital to assess their risk to reduce the losses and damages, to improve the emergency response and recovery planning, to prepare pre-disaster land use planning and to develop regulatory criteria such as insurance and manufacturing standards for lifelines. The lifeline risk assessment modelling techniques are briefly discussed in the following section.
4. Lifeline Risk Modelling Techniques
The risk assessment models are typically qualitative and quantitative (empirical and analytical) models. Qualitative models generally indicate whether a lifeline component is susceptible to failure or damage from a particular earthquake hazard. For qualitative methods the degree of earthquake intensity, fault movement and site responses, such as ground failure due to liquefaction, are broken into various groups and risk levels are assigned to each (Eguchi, 1984 ). Figures 2a and 2b show the risk zones for lifeline systems in the Cadoux region. A high-risk level was assigned to the area where faults and lifelines intersect each other. Most (75%) of the lifeline damage locations were identified correctly using this method. Additional field data such as soil and geology details and earthquake related data such as attenuation relationshi s, can further im rove this model.
a b .
j j
~· ,
~ ..
4
-- --- ._; ~ '• .. J I . I . t
O:O:IlliW•-•
\ , ~
' l __
Ufe:llne n:~~k Zonaho"
,. I\'U.Hj>"'4Bo,oj,oi.<JioAilu • llout.o-d.trl"" '"'"" lu· • ,4,..,....,~,,
p..,,.,..._r,j•pthoon•U•,.. /\/ l'll'.ot••••it>•lito• • "'""'41•1"'91"·"·""""'"'"""'" • l'f ...... ~- ..... ,ttt4t l ....
J ' / Rc'lld RaJ I
• H.CJ&::f <f~rtutg~ • Raildllnl~g~
4t RJotl ;,.~d Raad ~t h !g tl rhto.
Figure 2. Risk zonation for a) underground telephone and pipeline systems and b) road and railway systems
Empirical models attempt to quantify the degree of risk by fitting statistical distributions. Such models depend on the correlation of damage or failure to some measure of earthquake hazard intensity. In practice, these types of models are most common. Figure 3 shows the relationship between road damage and the Modified Mercalli scale for the 1971 Cadoux ea11hquake. The occurrence of damage to the lifeline system is less at a MM value of 6 than at a MM value of 8. The occurrence of the damage increases in proportion to increases on the MM scale from 6 and above.
Page 12-3

Relationship between Road damage and MM Scale
18 ~16+-------------------~~-~·~·~~,~~,~------~ 14+---------------------~~~---/~---0 12+-----------------------------~----~ 10 +---------------------------~/~---~ 8+---------------------------~/~----~ 6 +--------------------------TL~-----~ 4+-------------------------~/~-------0 2+-----------------------~/~·~------
o+---~--~--.---~--~--·~/--~--~--~ 0 6 II
MM Scale
The relationship between road damage and the MM damage index for the Cadoux region is:
}' = 7.5x- 45 .833 {1)
where y - Occurrence of damage x- MM scale.
Figure 3. Relationship between road damage and the MM earthquake damage index.
The spatial relationship between number of damage occurrences and the corresponding MM scale is depicted in the Figures 4a and 4b. The number of occurrences of lifeline damage is greater in the region where the MM index values are 8 and above. In this region, the damage rate for roads is higher than that for the underground telephone and water pipeline system . Further, the damage rate for railway lines is lower than that of the other lifeline systems. The incidence of the damage to the lifelines is principally due to the proximity or intersection with fault lines. The proportion of intersection with fault lines for both roads and railway lines was s imilar. The difference in damage rate is attributed to other properties of the lifelines, including construction material, age and length of the lifeline systems, and associated geology and soil features . These properties are effectively catered for by the MM index.
\ ....
..
,\
, . · ~
' ..
• R.&il D;atr;•;• ., RtHdDll~e
/··.~~ P,ll<&tl!f Plll~IH<: 8>JIItll 'l'eiL'phon~ Um
• Tc-lctlot-D<I~I"!).f
• Plp#l!n~ D.l:"'>ll!i''" 1-wubm.tl
~~ Full J,~·«;i.t-
Figure 4a) Rail and road damage and b) water pipeline and telephone line damage from the Cadoux earthquake.
Analytical models can represent earthquake damage to lifelines and their components at a more detailed level. Tested and developed through empirical and experimental data, these models allow one to relate damage to factors that directly influence the response of the components, such as rigidity or expected energy dissipation. Typical lifeline response models use such parameters as fault line orientation, effective lifeline free lengths and joint types, and surrounding soil and geology parameters. The applications of these models are often limited to the most critical components because of the greater amount of information and analyses required (Eguchi, I 984). Gaus and Nikolaou ( 1997) estimated lifeline damage using the highest credible losses (HCL) method and the loss levels by probability (LLP) method. Using the HCL method, the maximum number of lifeline damage/breaks is calculated as:
D=0*L m where r1 -Occurrence rate of lifeline failure ; L- Length of the lifeline
The HCL method can give an overall inventory estimation of lifeline damage due to an earthquake. Figure Sa shows the HCL method for lifelines for the Cadoux region. As the length of the lifeline increases, the number of occurrences of damage increases especially in
Page 12-4
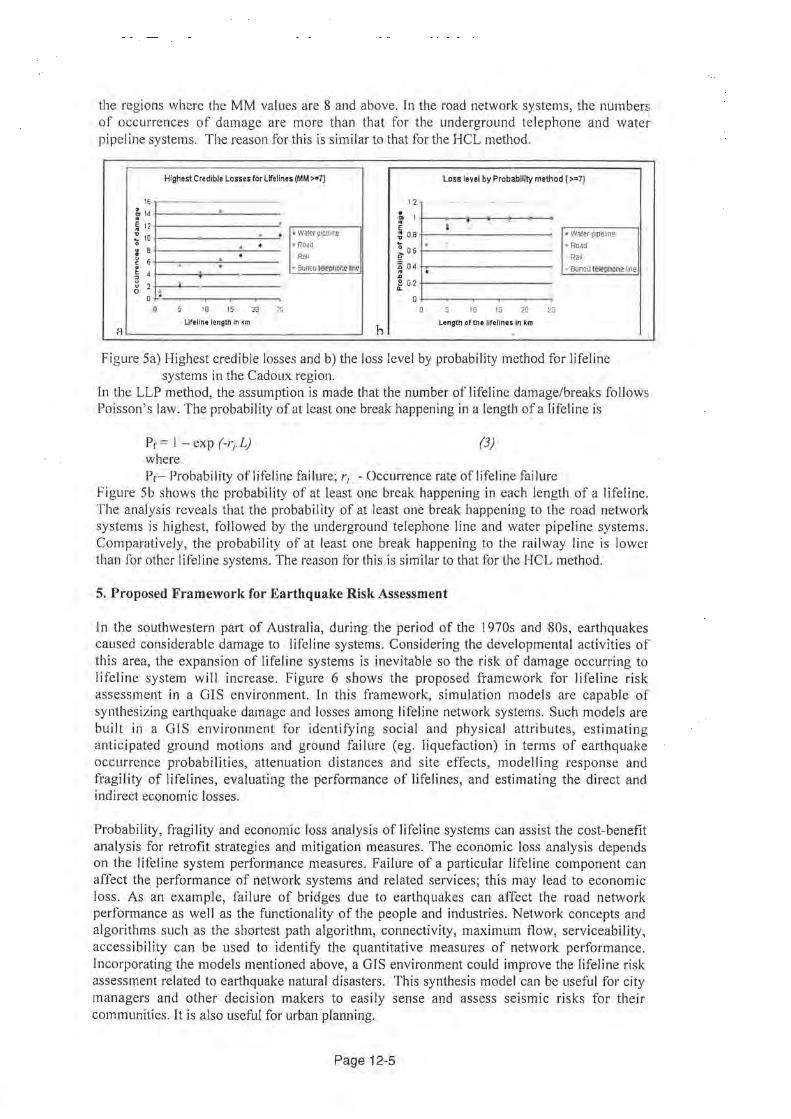
the regions where the MM values are 8 and above. In the road network systems, the numbers of occurrences of damage are more than that for the underground telephone and water pipeline systems. The reason for this is similar to that for the HCL method.
Highest Credible Losses for Lifelines (MM >=7) Loss level by Probability method ( >=7)
16 1.2 - -g, 14 ~ • . .. I . ~ 12
.. • Water pipei'ne
E l ~ 10 . : 0.8 • water pipeline 0 . • • Roa~ ~ 0 6
. " P.oad . B ~ X • Ral' ~ · Rati c 6 . . 'ii 04 ~ 4 . , BunEO telepnor.e ltil: .. • ' Buned tele1l!lonei:ne
~ ... e o.2 2 .. 0 : 0 0
0 5 10 15 20 25 0 5 10 15 20 25
Ufeline length In km h
Length or the lifelines In km H .
Figure Sa) Highest credible losses and b) the loss level by probability method for lifeline systems in the Cadoux region.
In the LLP method, the assumption is made that the number of lifeline damage/breaks follows Poisson's law. The probability of at least one break happening in a length of a lifeline is
Pr = 1 - exp (-r1.L) (3) where Pr- Probability of lifeline failure; r1 -Occurrence rate of lifeline failure
Figure Sb shows the probability of at least one break happening in each length of a lifeline. The analysis reveals that the probability of at least one break happening to the road network systems is highest, followed by the underground telephone line and water pipeline systems. Comparatively, the probability of at least one break happening to the railway line is lower than for other lifeline systems. The reason for this is similar to that for the HCL method .
5. Proposed Framework for Earthquake Risk Assessment
In the southwestern part of Australia, during the period of the 1970s and 80s, earthquakes caused considerable damage to lifeline systems. Considering the developmental activities of this area, the expansion of lifeline systems is inevitable so the risk of damage occurring to lifeline system will increase. Figure 6 shows the proposed framework for lifeline risk assessment in a GIS environment. In this framework, simulation models are capable of synthesizing earthquake damage and losses among lifeline network systems. Such models are built in a GIS environment for identifying social and physical attributes, estimating anticipated ground motions and ground failure (eg. liquefaction) in terms of earthquake occurrence probabilities, attenuation distances and site effects, modelling response and fragility of lifelines, evaluating the performance of lifelines, and estimating the direct and indirect economic losses.
Probability, fragility and economic loss analysis of lifeline systems can assist the cost-benefit analysis for retrofit strategies and mitigation measures. The economic loss analysis depends on the lifeline system performance measures. Failure of a particular lifeline component can affect the performance of network systems and related services; this may lead to economic loss. As an example, failure of bridges due to earthquakes can affect the road network performance as well as the functionality of the people and industries. Network concepts and algorithms such as the shortest path algorithm, connectivity, maximum flow, serviceability, accessibility can be used to identify the quantitative measures of network performance. Incorporating the models mentioned above, a GIS environment could improve the lifeline risk assessment related to earthquake natural disasters. This synthesis model can be useful for city managers and other decision makers to easily sense and assess seismic risks for their communities. It is also useful for urban planning.
Page 12-5
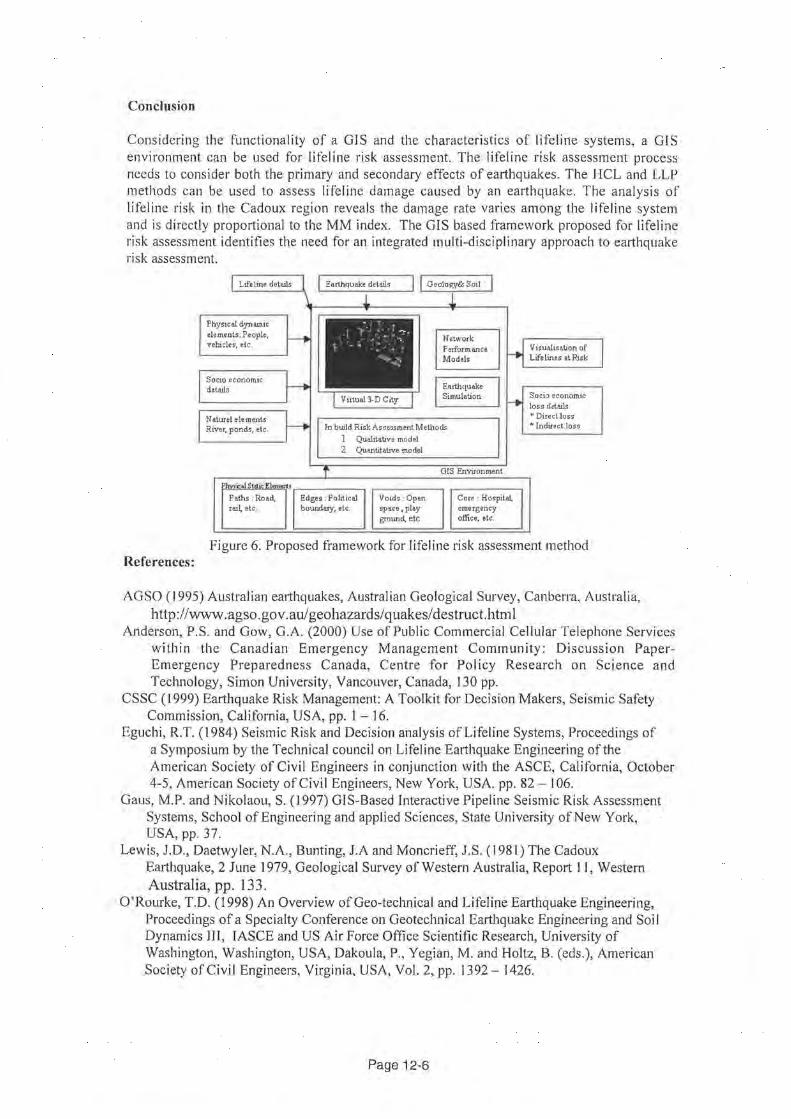
Conclusion
Considering the functionality of a GIS and the characteristics of lifeline systems, a GIS environment can be used for lifeline risk assessment. The lifeline risk assessment process needs to consider both the primary and secondary effects of earthquakes. The HCL and LLP methods can be used to assess lifeline damage caused by an earthquake. The analysis of lifeline risk in the Cadoux region reveals the damage rate varies among the lifeline system and is directly proportional to the MM index. The GIS based framework proposed for lifeline risk assessment identifies the need for an integrated multi-disciplinary approach to earthquake risk assessment.
References:
Phys1cal dyruunic elements: People, vehicles, etc.
Socia economic details
N a.turel elements River, ponds, etc.
Paths : Road, roi~ etc
• I •
! i_ ~-~;.< ~-. ~ ... .:.:~
Virtual 3. D City
Network Performance Models
In build Risk Asoessment Methods
1 Qualitative model 2 Quantitative model
Edge • : Political Voids: Opon boundary-, etc. space, play
ground, etc
GIS Environment
Core : Hospit~ emergency office, etc.
Visualisation of Lifelines at Risk
Socia economic loss details * Direcl loss ""Indirect loss
Figure 6. Proposed framework for lifeline risk assessment method
AGSO ( 1995) Australian earthquakes, Austral ian Geological Survey, Canberra, Australia, http://www. agso. gov .au/ geohazards/ quakes/ destruct. html
Anderson, P.S . and Gow, G.A. (2000) Use of Public Commercial Cellular Telephone Services within the Canadian Emergency Management Community: Discussion PaperEmergency Preparedness Canada, Centre for Policy Research on Science and Technology, Simon University, Vancouver, Canada, 130 pp.
CSSC (1999) Earthquake Risk Management: A Toolkit for Decision Makers, Seismic Safety Commission, California, USA, pp. 1 - 16.
Eguchi, R.T. (1984) Seismic Risk and Decision analysis of Lifeline Systems, Proceedings of a Symposium by the Technical council on Lifeline Earthquake Engineering of the American Society of Civil Engineers in conjunction with the ASCE, California, October 4-5, American Society of Civil Engineers, New York, USA. pp. 82-106.
Gaus, M.P. and Nikolaou, S. (1997) GIS-Based Interactive Pipeline Seismic Risk Assessment Systems, School of Engineering and applied Sciences, State University of New York, USA, pp. 37.
Lewis, J.D., Daetwyler, N.A., Bunting, J.A and Moncrieff, J.S. (1981) The Cadoux Earthquake, 2 June 1979, Geological Survey of Western Australia, Report 11, Western Australia, pp. 133.
O'Rourke, T.D. (1998) An Overview of Geo-technical and Lifeline Earthquake Engineering, Proceedings of a Specialty Conference on Geotechnical Earthquake Engineering and Soil Dynamics III, IASCE and US Air Force Office Scientific Research, University of Washington, Washington, USA, Dakoula, P., Yegian, M. and Holtz, B. (eds.), American Society of Civil Engineers, Virginia, USA, Vol. 2, pp. 1392- 1426.
Page 12-6
SEISMIC ASSESSMENT OF NON-DUCTILE MULTI-STOREY BUILDINGS
AUTHORS:
TUAN NGO, NELSON LAM, JOHN WILSON AND PRIY AN MEND IS UNIVERSITY OF MELBOURNE
Tuan Ngo is a PhD student at the University of Melbourne. He got his Master degree in Civil Engineering at the same university in 2000. He worked in Vietnam for 3 years as structural engineer. He is currently investigating the seismic behaviour of limited-ductile multi-storey buildings.
Nelson Lam is Senior Lecturer at The University of Melbourne. He joined Scott Wilson Kirkpatrick & Partners in 1982 and was bridge engineer with the firm until 1989 when he began his academic career at The University of Melbourne specialising in the field of earthquake engineering.
John Wilson is Senior Lecturer at the University of Melbourne. He was with Ove Arup and Partners before becoming Senior Lecturer at The University of Melbourne in 1992. He is co-author of a book and numerous publications in many different areas of earthquake engineering and structural dynamics.
Priyan Mendis is Associate Professor and Reader in Civil Engineering at the University of Melbourne. He is author of a book and more than one hundred papers on High-strength /Highperformance Concrete, Seismic Design of Reinforced and Prestressed Concrete Structures and Design of Tall Buildings.
ABSTRACT:
The current Australian Earthquake Loading Standard allows the use of the Equivalent Static Load procedure or the Dynamic Analysis procedure, to assess the seismic performance of structural systems. While these conventional force-based (FB) procedures are reasonable design tools, there are difficulties in applying them to assess existing buildings. More rational displacement-based (DB) assessment procedures such as the Capacity Spectrum Method have been developed recently in the United States to provide the seismic assessment for a range of structures, particularly structures which develop well defined collapse mechanisms and possess reasonable amount of ductility. However, such static procedures may not be reliable and effective in assessing limited-ductile buildings in which the potential failure mechanism is uncertain.
This paper introduces an alternative DB procedure which can effectively identify the likely potential failure mechanism in existing limited-ductile multi-storey buildings. The procedure estimates the building dynamic deflection profile which is then translated into curvature and flexural strain demand, based on a bi-linear displacement spectrum. The formation of plastic hinge is predicted at the location where the strain demand exceeds the material yield strain. Contributions by the fundamental and the higher modes of vibration are accounted for. The procedure is both simple and accurate enough to be carried out in normal practice, as is demonstrated in the paper using three multi-storey buildings (12, 15 and 20-storeys) as examples.
Paper No.13

1. INTRODUCTION
In the conventional equivalent static force procedure specified by design codes of practice, the design base shear for the building is first determined in accordance with the acceleration response spectrum . Thus. the procedure begins with the determination of the building's natural period (T), which is normally estimated by some simple rule-of-the-thumb formulae. The estimated Tis then used to define the response spectral acceleration (RSA) and the seismic inertia force, that is typically distributee\ triangularly up the building's height. The estimated seismic force is then used to analyse the internal forces. which includes the bending moment and shear forces, using a suitable analytical model for the structure . The condition of yielding is identified from comparison of the moment demand with the moment capacity at yield.
Whilst such a procedure has been used in building design codes, there are recognized uncertainties in the estimates ofT. It should be noted that the design spectral acceleration (and hence the base shear) is actually proportional to I 1f2 in the region of constant displacement demand when the building period exceeds a dependable limit. For rock sites, constant displacement demand occurs when the building period exceeds between 0.5 and 1.5secs depending on the earthquake magnitude (Koo, 2000; Lam. 200lb) . For soil sites prone to resonance, the limit of constant displacement is simply the site natural period which is approximately I sec for a 50m deep sediment possessing an average shear wave velocity of 200m/sec (Lam 2000, 200 I a). Whilst displacement demand is insensitive to the building period in this constant displacement region, the spectral acceleration (and hence seismic force) is ultra sensitive to the building period. In this period sensitive range of the acceleration spectrum, uncertainties in the estimation of T can be translated into significant errors in the estimated seismic forces . In such situations. the force based (FB) approach is not entirely satisfactory particularly when making retrofit decisions, since conservatism in the FB assessment can lead to significant economical and social implications.
The a\ternati ve displacement based (DB) approach appears to eliminate the problems associated with the natural period uncertainties since the displacement spectrum is approximately constant (i.e. period independent) in the high period range . Thus, the seismic response in high-rise buildings can be conveniently predicted by the displacement spectrum, whilst the response in medium-rise buildings can be conservatively predicted if the peak displacement demand defined for the flat part of the spectrum is used. However, recent studies using different approaches indicated that this peak displacement demand based on very onerous site conditions in Australia was only in the order of 1 00mm-200mm. Consequently, the DB method based on the peak displacement limit (constant region of RSD) may be used as a rapid assessment tool for both high-rise and medium-rise buildings.
Currently developed DB assessment procedures (Priestley, 1995 & 2000; ATC-40) are typically associated with an ine lastic quasi-static analysis (also known as "push-over analysis") in which the applied load is consistent with the observed static displacement profile. Whilst these DB procedures are gaining wide '\CCeptance, iL is also recognised that the static analysis cannot adequ ately C<ller ror dynami c (or hi gher mode) effects. Limited-ductile buildings, in particular, can I ve lop unexpected mechani sm which cannot always be identified by the push-over analysis p rocedure. Thus , furth er deve lopment of the DB method is required for adaptations to low and rn derate seismic region · lik Austra lia (where buildings are generally limited-ductile and the
Page 13-1
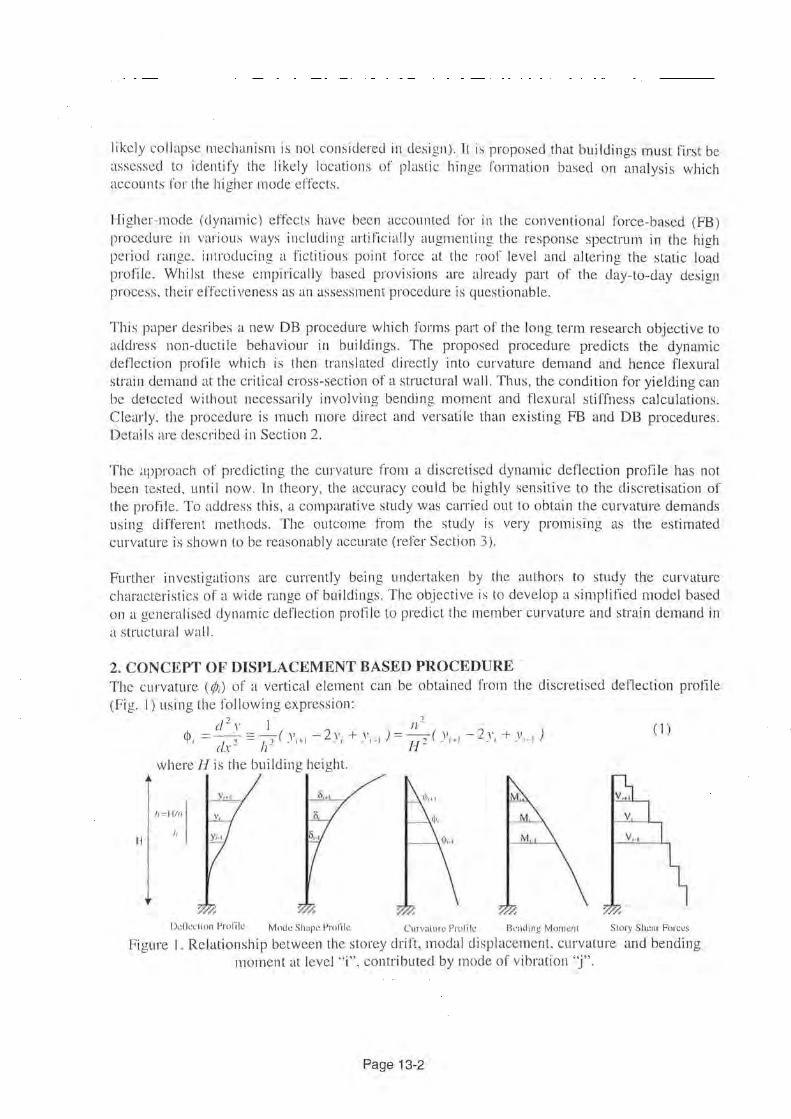
likely collapse mechanism is not considered in design). It is proposed that buildings must first be assessed to identify the likely locations of plastic hinge formation based on analysis which accounts for the higher mode effects .
Higher-mode (dynamic) effects have been accounted for in the conventional force-based (FB) procedure in various ways inc I udi ng arli ficiall y augmenting the response spectrum in the high period range. introducing a fictitious point force at the roof level and altering the static load profile. Whilst these empirically based provisions are already part of the clay-to-day design process. their effectiveness as an assessment procedure is questionable.
This paper desribes a new DB procedure which forms part of the long term research objective to address non-ductile behaviour in bui !dings. The proposed procedure predicts the dynamic deflection profile which is then translated directly into curvature demand and hence flexural strain demand at the critical cross-section of a structural wall. Thus, the condition for yielding can be detected without necessarily involving bending moment and flexural stiffness calculations. Clearly, the procedure is much more direct and versatile than existing FB and DB procedures. Details are described in Section 2.
The approach of predicting the curvature from a discretised dynamic deflection profile has not been tested, until now. In theory, the accuracy could be highly sensitive to the discretisation of the profile. To address this, a comparative study was carried out to obtain the curvature demands using different methods. The outcome from the study is very promising as the estimated curvature is shown to be reasonably accurate (refer Section 3).
Further investigations are currently being undertaken by the authors to study the curvature characteristics of a wide range of buildings. The objective is to develop a simplified model based on a generalised dynamic defl ection profile to predict the member curvature and strain demand in a .structural wall.
2. CONCEPT OF DISPLACEMENT BASED PROCEDURE The curvature ( ¢1) of a vertical element can be obtained from the discretised detlection profile (Fig. I) using the following expression:
d2
y I 112
(I) <P, = - -·, = -, ( -",+,- 2v, + y,_,) = --, ( Y,+,- 2y, + y,_, )
de h- H-where His the building height.
...
li =Hiu
H
Ddkcllon l'lllf'ilc Mode Shape Prolile Curvallll'c Pl'llfik Bending Moment S1o1y S hem Forces
Figure 1. Relationship between the storey drift, modal displacement. curvature and bending moment at level "i", contributed by mode of vibration "j".
Page 13-2
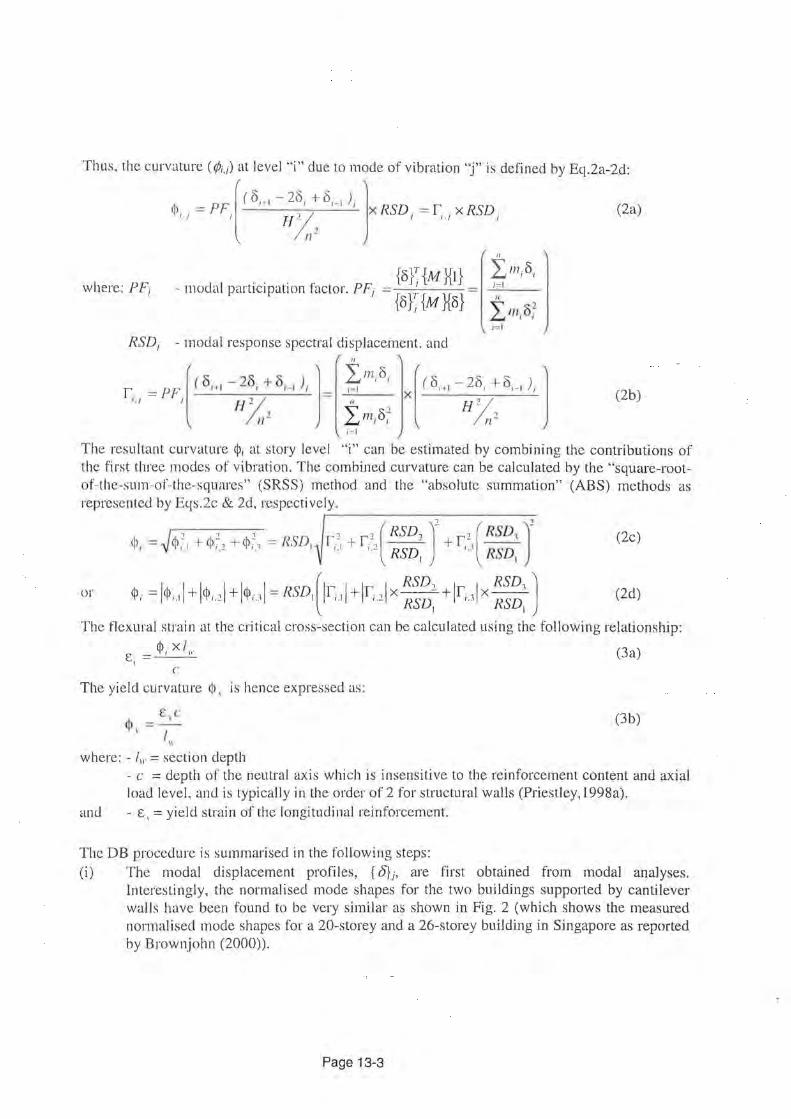
Thus, the curvature ((/J;,i) at level "i" due to mode of vibration "'j" is defined by Eq.2a-2d:
[
( ()i-'1 - 2b; + 81_ 1 ) 1 l ¢,.1 = PF1· X, xRSD. =r . xRSD . (2a) H - I I./ I
1 n-
where: PF1
RSD1 -modal response spectral displacement. and
(2b)
The resultant curvature </>; at story level "'i" can be estimated by combining the contributions of the first three modes of vibration. The combined curvature can be calculated by the "square-rootof-the-sum-of-the-squares" (SRSS) method and the "absolute summation" (ABS) methods as represented by Eqs.2c & 2d, respectively.
r-------------------------
~ o o 1 1 1(RSD, l
2
,( RSD ]2
<I> = rr. ~~ + <~>~~, +<I>~~' = RSDI r-~ + r.-1 --- + r~.-1 --, "''- ·- . '· '· - RSD .. R D I I
(2c)
<I> =i<ll · ~i+J¢ ,J+J¢ , J=RSD~(Jr.~J+Jr. , JxRSD2 +Jr..JxRSD., l I I. I , _ I.. /, 1.- RSD ..., RSD
I I
or (2d)
The flexural strain at the critical cross-section can be calculated using the following relationship:
E = ¢~ xl" (3a) I
c The yield curvature <1>, is hence expressed as:
r.,.c <I>,=-,-
" where: - I" = section depth
(3b)
- c =depth of the neutral axis which is insensitive to the reinforcement content and axial load level , and is typically in the order of 2 for structural walls (Priestley, 1998a).
and - E, =yield strain of the longitudinal reinforcement.
The DB procedure is summarised in the following steps: (i) The modal displacement profiles , { O}J, are first obtained from modal analyses.
Interestingly, the normalised mode shapes for the two buildings supported by cantilever walls have been found to be very similar as shown in Fig. 2 (which shows the measured normalised mode shapes for a 20-storey and a 26-storey building in Singapore as reported by Brownjohn (2000)).
Page 13-3
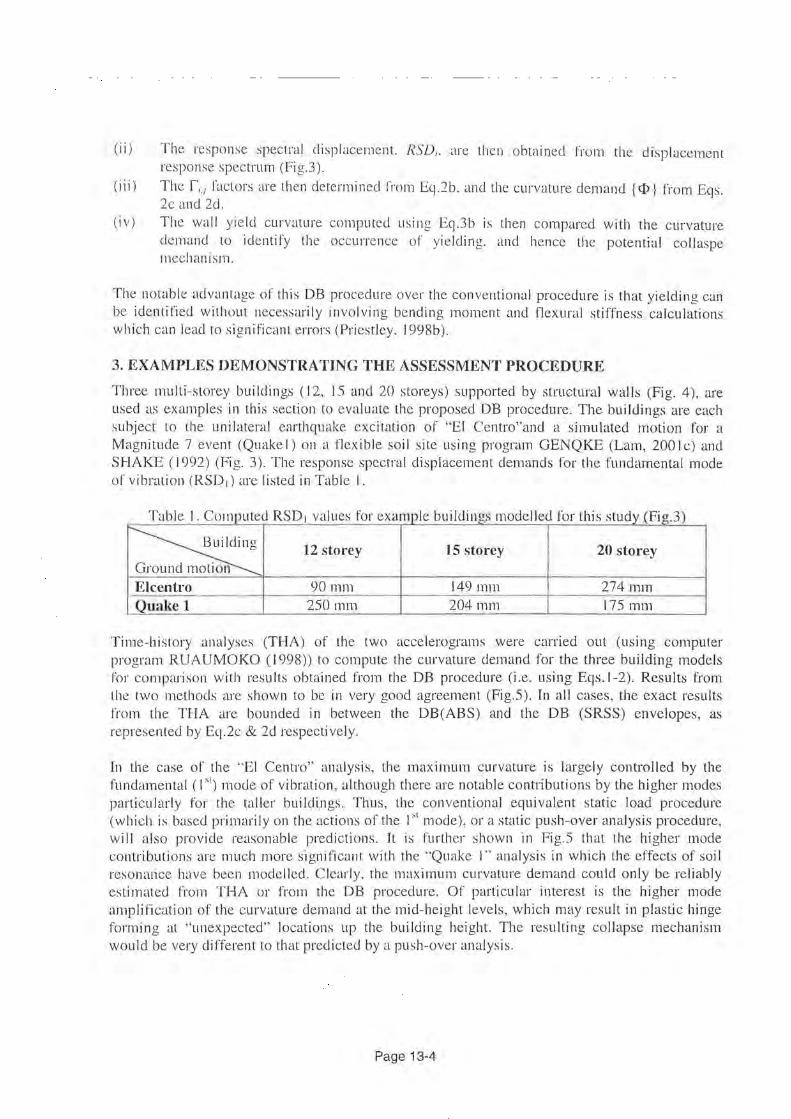
(ii) The response spectral displacement. RSD;. are then obtained from the displacement response spectrum (Fig.3 ).
(iii) The C.1 factors are then determined rrom Eq.1b. and the curvature demand {<D} from Eqs. 2c and 2d.
(iv) The wall yield curvature computed using Eq.3b is then compared with the curvature demand to identify the occurrence of yielding. and hence the potential collaspe mechanism.
The notable advantage of this DB procedure over the conventional procedure is that yielding can be identified without necessarily involving bending moment and flexural stiffness calculations which can lead to significant errors (Priestley. 1998b).
3. EXAMPLES DEMONSTRATING THE ASSESSMENT PROCEDURE
Three multi-storey buildings (12, 15 and 20 storeys) supported by structural walls (Fig. 4), are used as examples in this section to evaluate the proposed DB procedure. The bui !dings are each subject to the unilateral earthquake excitation of "El Centro"and a simulated motion for a Magnitude 7 event (Quake!) on a flexible soil site using program GENQKE (Lam, 2001c) and SHAKE ( 1992) (Fig. 3 ). The response spectral displacement demands for the fundamental mode of vibration (RSD 1) are listed in Table I.
T bl I C a e ompute d RSD 1 va ues f I b .Jd" or examp e Ui mgs mo d II d f h. d (F 3) e e or t JS stu ty I g.
~ 12 storey 15 storey 20 st01·ey 1
Elcentro 90 mm 149 111111 274mm
Quake 1 250mm 204mm 175 mm
Time-history analyses (THA) of the two acceterograms were carried out (using computer program RUAUMOKO ( 1998)) to compute the curvature demand for the three building models for comparison with results obtained from the DB procedure (i.e. using Eqs.l-2). Results from the two methods are shown to be in very good agreement (Fig.5). In all cases, the exact results from the THA are bounded in between the DB(ABS) and the DB (SRSS) envelopes, as represented by Eq.2c & 2d respectively.
In the case of the '"Et Centro" analysis, the maximum curvature is largely controlled by the fundamental ( t st) mode of vibration, although there are notable contributions by the higher modes particularly for the taller buildings. Thus, the conventional equivalent static load procedure (which is based primarily on the actions of the I st mode), or a static push-over analysis procedure, witt also provide reasonable predictions. It is further shown in Fig.5 that the higher mode contributions are much more significant with the '"Quake I"' analysis in which the effects of soil resonance have been modelled. Clearly, the maximum curvature demand could only be reliably estimated from THA or from the DB procedure. Of particular interest is the higher mode amplification of the curvature demand at the mid-height levels, which may result in plastic hinge forming at "unexpected" locations up the building height. The resulting collapse mechanism would be very different to that predicted by a push-over analysis.
Page 13-4

Strictly speaking. the FB would also be capable of predicting the correct curvature and strain demand provided that the flexural stiffness of the building has been accurately represented. The potential advantage of the DB procedure lies in its simplicity and its capability to relate seismic hazard to strain demand much more directly.
4. CONCLUSIONS
A simple DB procedure is presented in this paper to predict the curvature demand in multi storey buildings in order that occurrence of yielding and the potential failure mechanism can be identified. The notable advantage of this DB procedure over the conventional procedure is that yielding can be identified without necessarily involving bending moment and flexural stiffness calculations. There is good agreement between the curvature demand estimated from the procedure and from time-history analyses which account for the higher-mode effects. Further investigation is being undertaken to further develop the procedure for practical applications.
5. REFERENCES
AS 1170.4 ( 1993 ). Standard Association of Australia: ''Minimum design loads on struc tures . Part 4: Earthquake Loads- AS 1170.4 and Commentary"'.
ATC-40 ( 1996). Seis111ic ei'Ctfuation and retrofit of' concrete lmildings. Volumes I &2. Applied Techn ology Council , Redwood C ity. California. USA.
Carr. A.J. ( 199R ). RUAUMOKO. Computer Program Library. Department o f C ivil Engineering, University of C<mtcrbury. New Zealand .
Koo. R .. Brown. A .. Lam . N.T.K .. Wilwn. J.L. Gibson. G. (2000). "A full range response spectrum modal for rock sites in the Melbourne Metmpolitan Area". Proceeding of rh e AEES Se111inur, Tas mania. Paper no. 16.
Lam, N.T.K .. Wilson.J.L.. Edward . M. Cheng. M . and Hutchinson. G . (2000). "Di spl acement Assessment in the Melbourne M e tropolitan Area accounting for Soil Resonance· ·. Proceeding r~(th e AEES Seminar, Tasmania, Paper no. 17.
Lam. N .T.K .. Wilson. J .L. and Chandler, A .M. (200 I a). "Seismic Displacement Response Spectrum Estimated from the Fmme Analogy Soi I Amplification Model '" , Engineering Structures , 23 (200 I), pp 1437-1452.
Lam. N.T.K . and Wi I sun .. J .L (200 1 b). "Earthquake Response Spectrum Model s for Australia". Proceedings of the annual seminar for th e Australian Ea rthquake Engineering Society , Canberra. This Volume.
Lam. N.T.K (2001c ). GENQKE. User' s Manual, Department of Civil & Environmental Engineering, University of Melbourne. Edition 200 I.
Pri es tley. M.J .N. ll) lJ5). " Displm:cmcnl bm;cd Seismic 1\sscs. mem of Exis ting Rc in l"orccd Concre te Buildings", Proceediug t~( the• F(f'/1 Pacific onjerenn: tl( Carthquake C!Igineering, Mel bourn~.: Nov. 1995, pp . 225-244.
P riest ley , M.J .N .. Kowalsky. M.J . ( ll)9l:!a). " AS]1CCI or <lrifl and ductility capaci ty or rectangular cantilever s truc tural walls ,.. /Julellill of the New Zealand Nwimwl ocietyfor Earthquake Engineerin,~. 3 1 (2), pp. 7 -85.
Priestley. M.J .N. ( llJ9iib ). "B rief comments on e lastic flexibility o f reinforced concrete rramcs .nd s ignifi cance to seis mic des ign". Bulettin (if' th e Ne 11· Zealand Ncttional Societrfor Earthquake Engin eering, 31(4, pp . 246-259.
SHAKE ( 1992). A Computer Program for Conducting Equival ent Linear Se ismic Response Analyses o f Horizontally Layered So il Deposits. Department of Civil & Environmental Engineering. University o f California, Davis.
Page 13-5
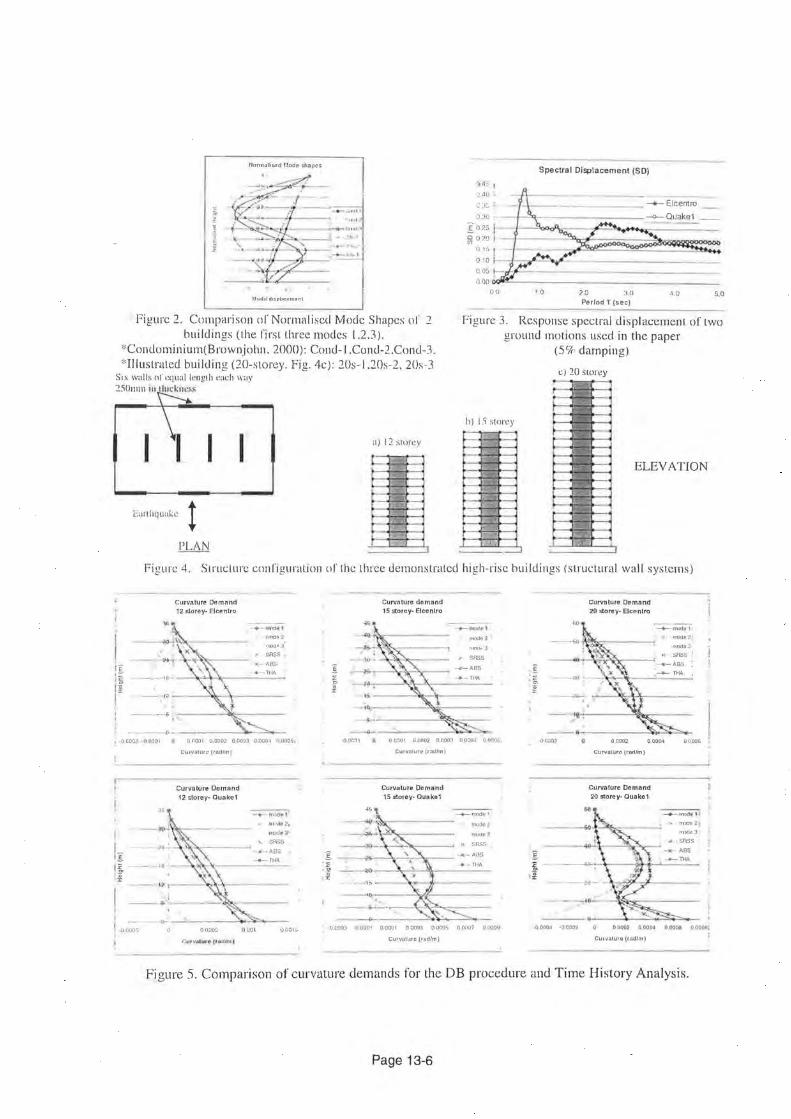
tlormaliSC'd Made shape s
·) 30 :
:§:u2s 1 ~ o2a I
0151
o :a i
Spectral Displacement (SD)
C05 ~-~f-~----------------------------------000 ~~-----------------------------------------
00 20 30 40 5,0 Period T (sec)
Figure 2. Comparison or Normalised Mode Shapes or ' buildings (the first three modes 1.2.3 ).
*Condominium(Brownjohn. 2000): Cond-l.Cond-2.Concl-3 . *Illustrated building (20-storey. Fig . 4e J: 20s-l.20s-2, 20s-3
Figure 3. Response spectral displacemenl of two ground motions used in the paper
(59r· damping)
c) 20 storey
J~··
~ h) I 'i storey
r-- r--,.__._. ...._ a) 12 storey
._. r - ELEVATION
Eatlhquakc ! r- i-" -
,.. -;.:"' -:-, ...
Figure 4 . Structure configuration of the three demons trated high-rise buildings (structural wall systems)
I'E lE' ii I
l •0 C002 ·0 0001
i
II
------~ - ·
Curvature Demand 12 s.lorey- Elcenlra
O(lQOl 0 .0002 0 0003 0 000.\ OOOOS1
Curvalurc (ttu1/m)
Curvature Demand 12 storey- Ouake1
__....._Nndfo t ... ){"'2· n00•3'
._ SR5S
A---ABS
- • - THA
__ ___,__, ____ _,,.._,., __ _ a ooos a o ooo~ n uot 000\:0
-OOC')l
Curvature demand 15 storey- Eleenlro
0 COOl 0 0002 0 0003 0 000-l 0 000!;,
Curvolurc {rod/m)
Curvature Demand 15 storey- Oua ke1
11udt!2
rnxle2
-0 C{)03 ·0 0001 0 OO'Jl 0 0003 0 0005 0 0007 0 DJ09
curvatur~ (rpdfm)
-0(XJ02
0 000-l -00002
Curvature Demand 20 storey- Elce nlro
00002 0 OOC4
curvnlurl:! (rDdfm)
Curvature Demand 20 storey- auake1
OOC()6
0 .0002 0 0004 O_OOQG 0 00081
Curvature (rodfm)
Figure 5. Comparison of curvature demands for the DB procedure and Time History Analysis.
Page 13-6
EARTHQUAKE RISK IN THE NEWCASTLE REGION
JOHN STEHLE, JOHN F. SCHNEIDER, DAVID STEWART, TREVOR JONES AND NEIL CORBY AGSO GEOSCIENCE AUSTRALIA
AUTHORS:
John Stehle is a structural engineer at Hyder Consulting. Formerly employed at AGSO- Geoscience Australia, he developed and implemented vulnerability models for earthquakes and other hazards, and post-disaster reconnaissance strategies. His research interests include concrete structures, earthquake engineering and natural hazard risk assessment.
John Schneider is the Research Group Leader for Geohazards and Risk at AGSO - Geoscience Australia. John's primary research interests are in the development of natural hazards risk assessment methods for application to urban centres, with a particular emphasis on earthquake hazards.
David Stewart is a Civil Engineer at AGSO - Geoscience Australia. His background is in planning, design and construction of urban infrastructure in Australia and Asia. He was design manager for a motorway in the Tangshan area of China designed for extreme earthquake loadings and leader for the earthquake risk assessment for the Cities of Newcastle & Lake Macquarie.
Trevor Jones is a specialist in natural hazard risk assessment in the Urban Geoscience Division of AGSO - Geoscience Australia. He is currently active in developing simulation models for earthquake risk assessment and in assessing natural hazard risk in Australian cities including Perth and Newcastle.
Neil Corby is a GIS specialist at AGSO- Geoscience Australia, having an extensive background in Cartography and Geological thematic mapping and drafting. International Mapping Award in the prestigious IGUG (lntergraph Graphic Users Group) Mapping Sciences category for "Bathurst Geology 1:250 000 series".
ABSTRACT:
A comprehensive investigation of earthquake risk has been undertaken by the AGSO Risk Modelling Project for the cities of Newcastle and Lake Macquarie. Results presented in this paper include the risk in terms of probabilistic ground shaking, building damage, economic losses and casualties. Lifelines and key facilities have also been considered. The results have been determined using sophisticated modelling techniques, including multiple scenario analyses and the consideration of uncertainty. The results indicate that even though the earthquake risk, as represented by AS 1170.4 appears to be underestimated, by international standards, the risks appear to be quite low.
Paper No.14
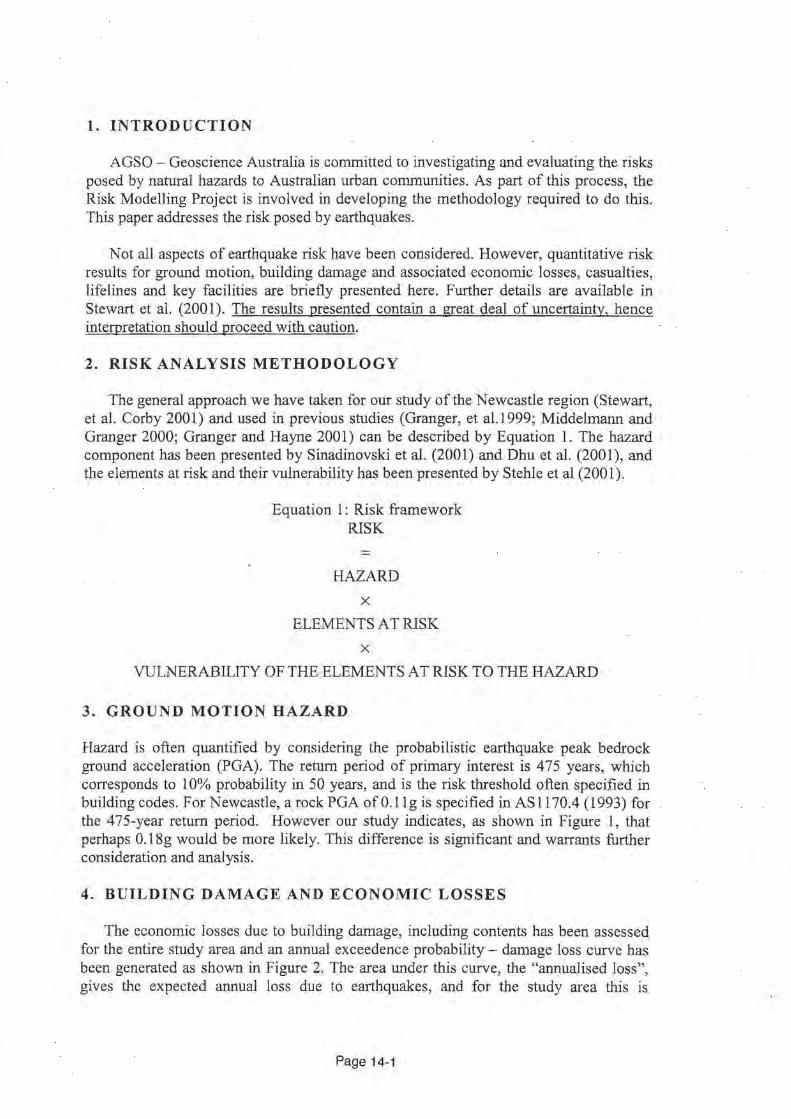
1. INTRODUCTION
AGSO - Geoscience Australia is committed to investigating and evaluating the risks posed by natural hazards to Australian urban communities. As part of this process, the Risk Modelling Project is involved in developing the methodology required to do this. This paper addresses the risk posed by earthquakes.
Not all aspects of earthquake risk have been considered. However, quantitative risk results for ground motion, building damage and associated economic losses, casualties, lifelines and key facilities are briefly presented here. Further details are available in Stewart et al. (2001). The results presented contain a great deal of uncertainty, hence interpretation should proceed with caution.
2. RISK ANALYSIS METHODOLOGY
The general approach we have taken for our study of the Newcastle region (Stewart, et al. Corby 2001) and used in previous studies (Granger, et al.l999; Middelmann and Granger 2000; Granger and Hayne 2001) can be described by Equation 1. The hazard component has been presented by Sinadinovski et al. (2001) and Dhu et al. (2001), and the elements at risk and their vulnerability has been presented by Stehle et al (2001).
Equation 1 : Risk framework RISK
=
HAZARD
X
ELEMENTS AT RISK
X
VULNERABILITY OF THE ELEMENTS AT RISK TO THE HAZARD
3. GROUND MOTION HAZARD
Hazard is often quantified by considering the probabilistic earthquake peak bedrock ground acceleration (PGA). The return period of primary interest is 475 years, which corresponds to 10% probability in 50 years, and is the risk threshold often specified in building codes. For Newcastle, a rock PGA of 0.11 g is specified in AS 1170.4 ( 1993) for the 475-year return period. However our study indicates, as shown in Figure 1, that perhaps 0.18g would be more likely. This difference is significant and warrants further consideration and analysis.
4. BUILDING DAMAGE AND ECONOMIC LOSSES
The economic losses due to building damage, including contents has been assessed for the entire study area and an annual exceedence probability - damage loss curve has been generated as shown in Figure 2. The area under this curve, the "annualised loss", gives the expected annual loss due to earthquakes, and for the study area this is
Page 14-1
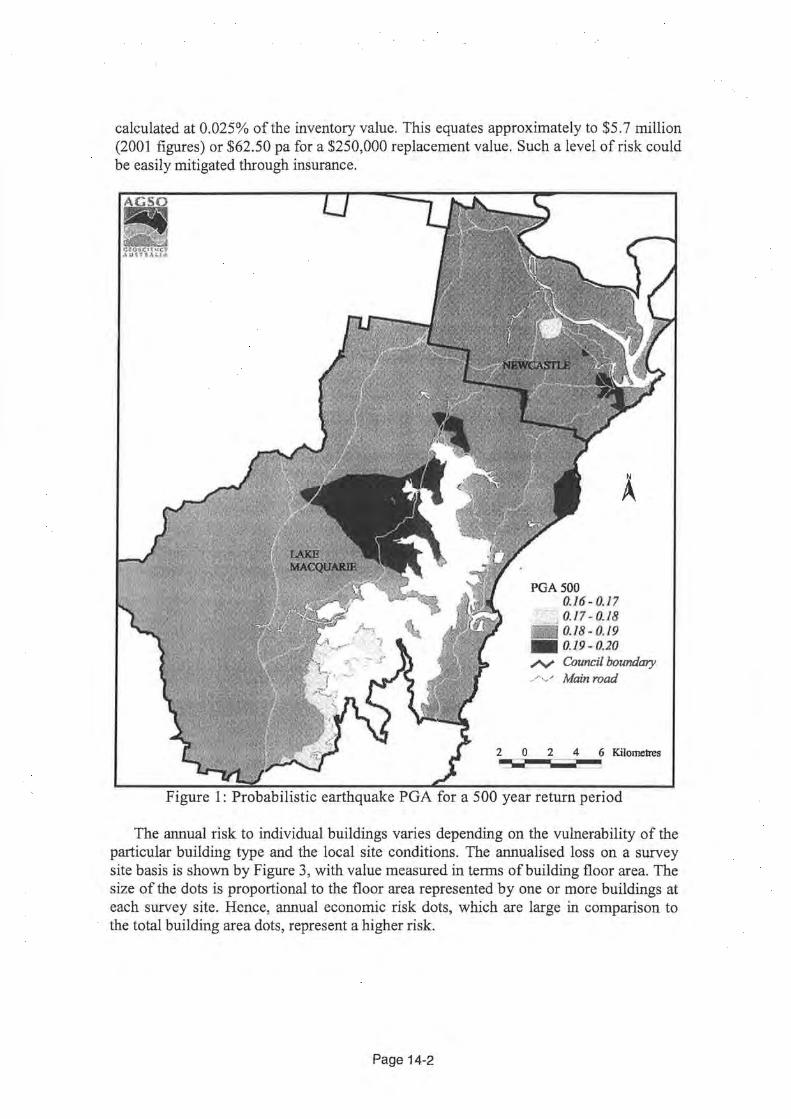
calculated at 0.025% of the inventory value. This equates approximately to $5.7 million (2001 figures) or $62.50 pa for a $250,000 replacement value. Such a level of risk could be easily mitigated through insurance.
PGA500 0.16 ~ 0.17 0.17 ~ 0.18 0.18 - 0.19
-0.19-0.20 /'V Council boundary /'·/ Main road
Figure 1: Probabilistic earthquake PGA for a 500 year return period
The annual risk to individual buildings varies depending on the vulnerability of the particular building type and the local site conditions. The annualised loss on a survey site basis is shown by Figure 3, with value measured in terms ofbuilding floor area. The size of the dots is proportional to the floor area represented by one or more buildings at each survey site. Hence, annual economic risk dots, which are large in comparison to the total building area dots, represent a higher risk.
Page 14-2

Cl c: ~ :I
Cll-(J
!/) c: Cll ·--Qj !/) :I !1)-0 Cll ->-Qj Cl .l!l CIC:C: Cll ·- Qj E;g-c Cll :I 0 ~.C<J C)'l-c: 0 :a Qj ::Cl :I Cll ca-c
Qj
~ Ql c.
0.001% I
0.010%
0.100% \
1.000%
10.000%
f---- ·
100.000% 0.1 0.01 0.001 0.0001 0.00001 0.000001
Probability of exceedence
Figure 2: Annual probability of exceedence- percent economic damage loss, for the whole study area
500
£.;~1 Annual EC011omtc Risk (m2)
• OloiJJ
~ : . ~~=:~ .. . ~-~ ~~~;
(
.: • • '• • 2JtoJ
t ~·: :· .. ... • !IJ)]J
• •· • . :• • • • IJwJO
\ .:-.:;·\ · / ...
' ' \
-v
Total lluilding t\r<a (m') Oto lj ]Jto 70 70JaJJO 110 lo i50 750to 1750
ll!fJto-1000 4000to 9000
91XJ0w 20000
10000 ru 4JDOO
ol!fXXJta /(){)()()()
500 1000 1500 Mt:tn:s
Figure 3: Predicted annualised economic loss in terms of an equivalent value of floor area expected to be lost annually, for the Newcastle area
5. CASUALTIES
The risk of death and less serious mJuries has been calculated, with the results presented in Table 1. The annual risk of death, for example, is equal to 0.14 chances per million. In NSW, the chances of a fatality occurring from smoking 20 cigarettes a day has been calculated as being 5000 chances per million people per year and for travel by motor vehicle as 145 chances per million people per year. 'Involuntary' risks, such as
Page 14-3
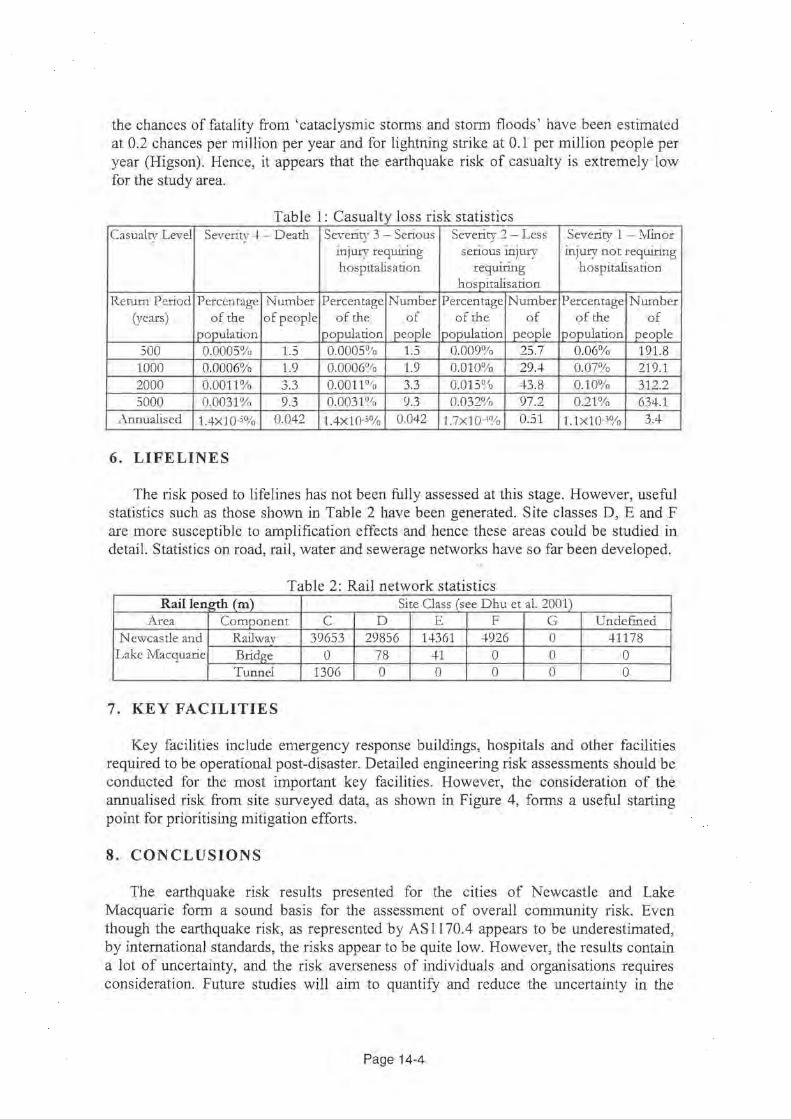
the chances of fatality from 'cataclysmic storms and storm floods' have been estimated at 0.2 chances per million per year and for lightning strike at 0.1 per million people per year (Higson). Hence, it appears that the earthquake risk of casualty is extremely low for the study area.
Table 1: Casualty loss risk statistics Casualtv Level Severit\' ..J. - Death Severity 3 - Serious Severity 2 - Less Severity 1 - I'vlinor . .
serious injury injury not requiring illjury requmng hospitalisation requmng hospitalisation
hospitalisation Return Period Percentage Number Percentage Number Percentage Number Percentage Number
(years) of the of people of the of of the of of the of population I population people population people population people
500 0.0005% 1.5 0.0005% 1.5 0.009% 25.7 0.06% 191.8 1000 0.0006% 1.9 0.0006% 1.9 o.o1o~~0 29.-J. 0.07% 219.1 2000 0.0011% 3.3 0.0011 °1o 3.3 0.015% 43.8 0.10% 312.2 5000 0.0031% 9.3 0.0031% 9.3 0.032% 97.2 0.21% 634.1
~-\nnualised 1.4X10-S% 0.042 1.4Xl0-5% 0.042 1.7x10⁻⁴% 0.51 1.1x10⁻³% 3.4
6. LIFELINES
The risk posed to lifelines has not been fully assessed at this stage. However, useful statistics such as those shown in Table 2 have been generated. Site classes D, E and F are more susceptible to amplification effects and hence these areas could be studied in detail. Statistics on road, rail, water and sewerage networks have so far been developed.
Table 2: Rail network statistics Rail length (m) Site Class (see Dhu et al. 2001)
Area Component c D E F G l.Jndefmed Newcastle and Railwav 39653 29856 14361 -l-926 0 41178
Lake Macquarie Bridge 0 78 41 0 0 0 Tunnel 1306 0 0 0 0 0
7. KEY FACILITIES
Key facilities include emergency response buildings, hospitals and other facilities required to be operational post-disaster. Detailed engineering risk assessments should be conducted for the most important key facilities. However, the consideration of the annualised risk from site surveyed data, as shown in Figure 4, forms a useful starting point for prioritising mitigation efforts.
8. CONCLUSIONS
The earthquake risk results presented for the c1tles of Newcastle and Lake Macquarie form a sound basis for the assessment of overall community risk. Even though the earthquake risk, as represented by AS 1170.4 appears to be underestimated, by international standards, the risks appear to be quite low. However, the results contain a lot of uncertainty, and the risk averseness of individuals and organisations requires consideration. Future studies will aim to quantify and reduce the uncertainty in the
Page 14-4
results, and a comparison of the risk to those posed by other hazards would place the risk in perspective.
Key Focilities • Educmlo'l & .'.fedica/
lim"'1:""CY
AlDlual Economic ltisJc(m'l OtoO.I 0.1 TD0..2 0.2ro0.5
• IH 1ol ';) I to25 0 ].JJoJ 0 51lJIJ
Q HroJO
Total Building Area (m') Oto 15 /Jto 70 10to3!0 J51J fO 750 750to 1750
17JOro4000 4000to9000
'Xlf}()to2011J(J
10000to45000
500 0 500 1000 1500 Me...,
~--Figure 4: Predicted annualised economic loss in terms of an equivalent value of
floor area expected to be lost annually, for key facilities (a) in the Newcastle area
9. REFERENCES
AS1170.4, 1993, 1vlinimum Design Loads on Structures, part 4, Earthquake Loads, AS1170.4: Sydney Australia, Standards Association of Australia.
Dhu, T.,Jones, T.,Jones, A. and Corby, N., 2001, Earthquake hazard in the Newcasde region - site amplification, AEES conference - Earthquake Codes in the Real World, Canberra.
Granger, K. and Hayne, M., 2001, Natural hazards & the risks they pose to South-East Queensland: Canberra, .AGSO - Geoscience .Australia.
Granger, K., Jones, T., Leiba, M. and Scott, G., 1999, Community Risk in Cairns: Canberra, .ACT, Department of Industry Science and Resources, Commonwealth of .Australia.
Higson, D. J., Risk to individuals in NSW and Australia as a whole, Australian Nuclear Science and Technology Organisation.
Middelmann, M. and Granger, K., 2000, Community Risk in Mackay: Canberra, Australian Geological Survey Organisation.
Sinadinovski, C., Jones, T., Stewart, D._ and Schneider, J., 2001, Estimation of earthquake hazard in the N ewcasde region, AEES conference - Earthquake Codes in the Real World, Canberra.
Stehle, J., Jones, T., Stewart D. and Corby, N., 2001, Earthquake vulnerability in the N ewcasde region, .AEES conference - Earthquake Codes in the Real World, Canberra.
Stewart, D., Stehle, J. and Corby, N., 2001, Earthquake risk assessment of the cities of Newcasde and Lake Macquarie in the Hunter region of NSW- Interim Report, .AGSO - Geoscience Australia.
Page 14-5