east coast main line route study technical appendices · demand and capacity autumn 2017 network...
TRANSCRIPT

East Coast Main Line Route Study:Technical Appendix
East Coast Main Line Route Study

Network Rail – East Coast Main Line Route Study 02Autumn 2017Demand and Capacity
The sections shows how standard class passenger demand is assumed to develop over the East Coast Route Study area over the next 2 to 3 decades, and identifies where this presents a challenge to provide additional capacity:
• a definition of the key sectors (groups of services) on the route
• a summary of the baseline capacities assumed for the route.
• the growth forecasts assumed. These were based on the high growth scenarios from the Market Studies and have been applied to current demand based on counts data from train operators.
• an explanation of how HS2 Phase 2b is expected to impact on demand for classic long distance services on the route.
• a summary of the forecast demand position in 2023 and 2043 as compared to baseline capacity, highlighting where there are challenges to accommodate that capacity.
Key Sectors /Groups of services
The East Coast Route Study predominantly consists of the East Coast Main Line (ECML) route sections from London Kings Cross to Berwick and Leeds, but also includes a number of other route sections. These include Nottingham to Lincoln, Stevenage to Cambridge, the Hertford Loop and the GN/GE route between Peterborough and Doncaster via Lincoln.
The East Coast Route Study area accommodates a number of different types of train services (sectors), which meet a particular market need:
• Long Distance High Speed (LDHS) services. These services cater for longer distance business and leisure journeys between major cities such as London Leeds, Newcastle and Edinburgh as well as flows between some smaller destinations. These journeys are more evenly spread over the day than demand for suburban services. They also carry some commuter demand in the peak hours.
• Suburban commuter services into London and Leeds. A large proportion of journeys on these services are commuter journeys which occur predominantly during peak hours. These services also serve other markets such as leisure and business trips.
• Local and rural services such as those into Newcastle from Saltburn and Morpeth, from Doncaster to Peterborough via Lincoln and from Newark to Lincoln. These services do carry a proportion of commuters, and are most heavily loaded in the peak hours into and out of Newcastle, Lincoln and Newark.
Baseline
Throughout this section forecast demand is compared with “baseline capacity”. The baseline capacities are based on what is proposed to operate once the following CP5 Enhancement Delivery Plan projects have been implemented:
• East Coast Connectivity Fund projects including Huntingdon to Woodwalton 4 tracking and Werrington Grade Separation. This facilitates a service predominantly worked by new Class 800 and 801 units ordered through the Intercity Express Programme (IEP), with up to 8 LDHS services per hour into London Kings Cross. This also includes the proposed freight loops between Northallerton and Newcastle which are assumed to facilitate six LDHS paths each hour between York and Newcastle Central.
• Thameslink K02 output. This facilitates a higher frequency operation into London, high-capacity Class 700 rolling stock, and new connectivity provided by services linking Peterborough and Cambridge to destinations south of London via Farringdon and City Thameslink. The peak inner suburban frequency between Finsbury Park and Moorgate is also increased; the frequency from the Hertford loop in the high peak is assumed to increase to 10 trains per hour (tph) which also assumes Stevenage Turnback to be implemented.1
New Class 717 trains for the Moorgate services ordered by the Thameslink Southern & Great Northern franchise, currently operated by Govia Thameslink Railway, was also assumed.
1 Stevenage Turnback was originally in the CP5 Enhancements Delivery Plan, however this was deferred to CP6 following a review of the Enhancements Delivery Plan in November 2015
Network Rail – East Coast Main Line Route Study 03Autumn 2017Demand and Capacity
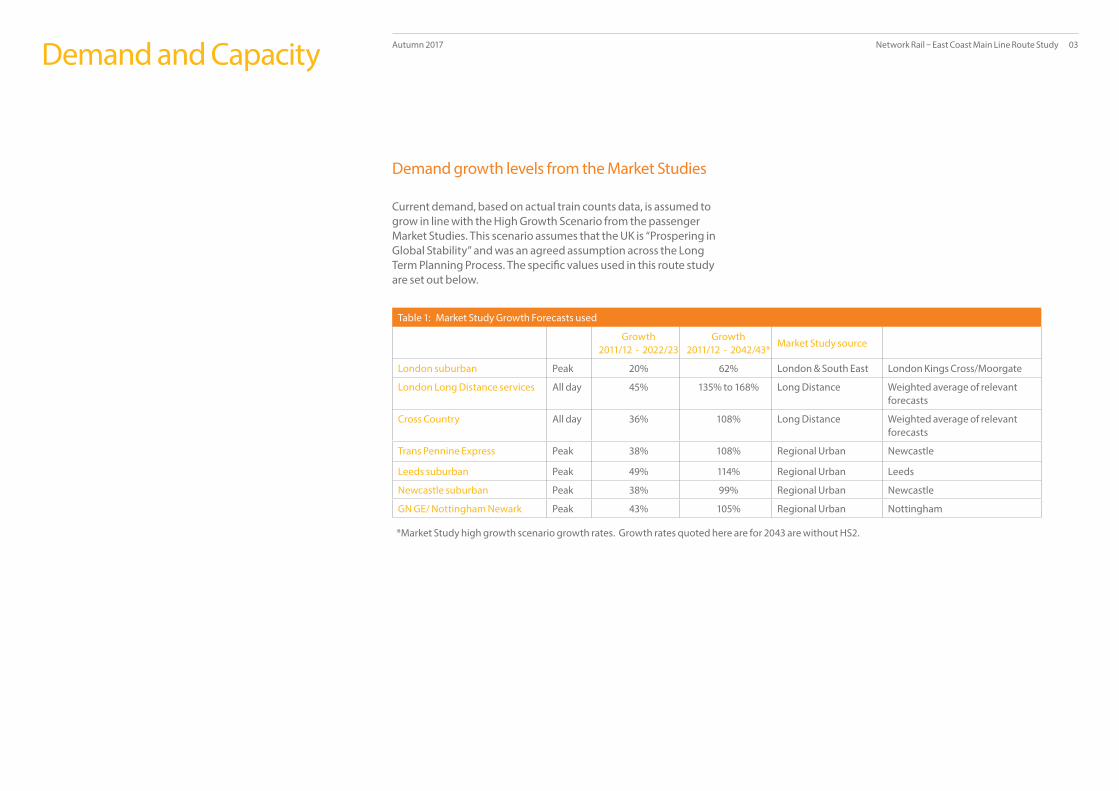
Demand growth levels from the Market Studies
Current demand, based on actual train counts data, is assumed to grow in line with the High Growth Scenario from the passenger Market Studies. This scenario assumes that the UK is “Prospering in Global Stability” and was an agreed assumption across the Long Term Planning Process. The specific values used in this route study are set out below.
Table 1: Market Study Growth Forecasts used
Growth 2011/12 - 2022/23
Growth 2011/12 - 2042/43*
Market Study source
London suburban Peak 20% 62% London & South East London Kings Cross/Moorgate
London Long Distance services All day 45% 135% to 168% Long Distance Weighted average of relevant forecasts
Cross Country All day 36% 108% Long Distance Weighted average of relevant forecasts
Trans Pennine Express Peak 38% 108% Regional Urban Newcastle
Leeds suburban Peak 49% 114% Regional Urban Leeds
Newcastle suburban Peak 38% 99% Regional Urban Newcastle
GN GE/ Nottingham Newark Peak 43% 105% Regional Urban Nottingham
*Market Study high growth scenario growth rates. Growth rates quoted here are for 2043 are without HS2.

Network Rail – East Coast Main Line Route Study 04Autumn 2017Demand and Capacity
Figure 1: HS2 abstraction from “classic” ECML services to/from London Kings Cross
Impact of abstraction to HS2 services on “classic” LDHS passenger loads in 2043
The long distance demand on the route will be significantly impacted by the proposed opening of HS2 Phase 2b circa 2033. HS2 services are assumed to carry the majority of passengers on key ECML flows between London and Leeds, London and Newcastle and London and Edinburgh. Figure 1 shows the estimated reduction in demand for ECML “classic” LDHS services to and from London Kings Cross as a result of abstraction to HS2 after Phase 2b opens.2
Figure 2 (next page) shows how LDHS demand is expected to develop on the ECML over a 28 year period, taking into account both the Market Study growth and the abstraction to HS2. Demand grows strongly up to the opening of HS2 Phase 2b.
2 The abstraction rates are based on an analysis of data taken from the October 2013 consulted scheme for HS2
London Kings Cross
Stevenage
Peterborough
Grantham
Newark North Gate
Retford
Doncaster
Leeds
WakefieldYork
Darlington
Northallerton
Durham
Edinburgh
Newcastle
MPT/ALN/BWK
Example of average on-train released capacity
Reduction in passenger journeys (on train departure) on Leeds / Edinburgh to London Kings Cross services post-HS2 phase 2
-67%
-52%
-57%
-77%
-80%
-71%
-77%
-54%
-54%
-72%
-71%
-73%
-73%-81%
-74%

Network Rail – East Coast Main Line Route Study 05Autumn 2017Demand and Capacity
Figure 2: Demand along the ECML, pre-HS2 and post-HS2
After the opening of HS2 Phase 2b, demand falls steeply south of York as many long distance passengers are assumed to use HS2 for journeys to London Kings Cross from Leeds, York and stations further north.
The impact on the ECML between York and Newcastle is less marked. This is because, while substantial passenger demand is expected to switch to HS2 services, these services are assumed to continue to use the ECML between York and Newcastle Central. A substantial proportion of demand from London to Scotland is still abstracted to HS2 as the Anglo-Scottish HS2 services will use the western arm of the HS2 network via the West Coast Main Line.
2 The abstraction rates are based on an analysis of data taken from the October 2013 consulted scheme for HS2
0
10000
20000
30000
40000
50000
60000
70000Da
ily d
eman
d
2043 figures between York and Newcastle include HS2 demand
Comparing current and forecast loads on long distance services on the East Coast
2015 demand
2023 demand
2032 demand
2043 demand

Network Rail – East Coast Main Line Route Study 06Autumn 2017Demand and Capacity
Forecast demand in 2023 and 2043 compared with baseline
The demand forecasts are presented and discussed for the following sectors and locations:
• Long Distance services into London
• Suburban services in London
• Long Distance and Suburban services into Leeds
• Long Distance and local services into Newcastle
• Other Local services
Demand for different types of services (sectors) cannot be considered entirely independently, as a particular market may be served by more than one sector. For example commuters into London, Leeds and Newcastle use LDHS services as well as suburban and local services.
The focus of the analysis in this section is on the morning peak into key urban centres, as this is where the biggest capacity challenge usually is. However this is only part of loadings analysis undertaken within the ECRS. Other locations and times of day have been investigated, but presented no additional capacity issues.
Demand into London on LDHS services 2023 and 2043
The heaviest loads on the route are into London. However this is also where there will be most capacity with up to 8 trains per hour, the majority of which will be Class 800 and 801 trains; 9-car sets are assumed to have 510 standard class seats. Figure 3 shows baseline standard class seating capacity in the morning peak into London with forecast loads on LDHS services in 2023 and 2043. The height of the line on top of each solid bar represents additional capacity which would need to be available to allow for variability in loads between trains.
Figure 3: Forecast LDHS demand into London Kings Cross, morning peak
Network Rail – East Coast Main Line Route Study 07Autumn 2017Demand and Capacity
The busiest hour is 09:00 to 10:00, as the peak for long distance passenger arrivals into London Kings Cross is later than the suburban peak between 08:00 and 09:00. The graph suggests that the baseline capacity will be sufficient to accommodate the forecast demand in 2023.
The evening peak for long distance services is forecast to have similar levels of demand as are shown in the busiest morning peak hour (09:00 – 10:00) and will also have sufficient capacity.
The loads are forecast to fall by 2043 due to abstraction to HS2 once Phase 2b is opened.
The above, may be interpreted as meaning that there is too much capacity provided. However it should be pointed out that:
a) The above reflects the picture on an average weekday. There is significant seasonal variability in long distance loads, so at the busiest times of year trains will be significantly more heavily loaded.
b) If the Market Study forecasts are realised then growth will continue beyond 2023, peaking shortly before the opening of HS2 Phase 2b.
Demand into London on suburban services 2023 and 2043
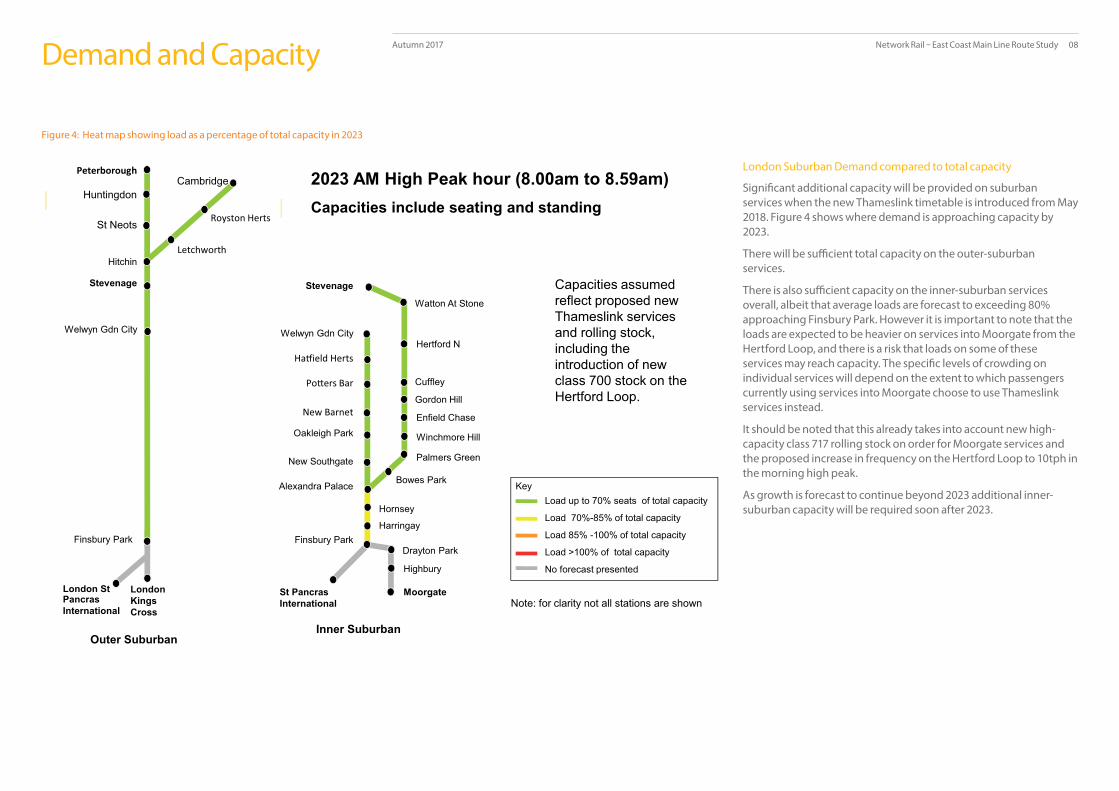
This section considers the morning high peak hour between 08:00 and 08:59 where there is the biggest challenge to capacity. The forecast loadings in 2023 and 2043 are illustrated by means of heat maps in figures 4 to 7. These show load factors (i.e. loads as a percentage of capacity) across the high peak hour. Figures 4 and 5 show loads as a percentage of total capacity (seating plus standing). Figures 6 and 7 show loads as a percentage of seating capacity only.
When total demand across the high peak hour exceeds capacity in a section, this is shown in red. It should be noted that if capacity exactly matches demand across the hour, demand will exceed capacity on some individual services due to the inevitable variation in loads between trains. As a rule of thumb, once the average capacity has reached circa 85% there is a significant risk that demand for some services will exceed capacity. Sections where demand exceeds this threshold are shown as brown (or red) in the heat maps.
The heat maps do not show the loads south of Finsbury Park. This is because the modelling approach used is not sufficiently refined to accurately model the numbers of passengers using different interchanges with London Underground at Finsbury Park, Highbury and Islington, Old Street and other locations. However suburban services are generally at their most heavily loaded north of Finsbury Park, so forecast loadings presented are appropriate to highlight capacity constraints.
Network Rail – East Coast Main Line Route Study 08Autumn 2017Demand and Capacity
Outer SuburbanInner Suburban
2023 AM High Peak hour (8.00am to 8.59am)Capacities include seating and standing
KeyLoad up to 70% seats of total capacity
Load 70%-85% of total capacity
Load 85% -100% of total capacity
Load >100% of total capacity
No forecast presented
Capacities assumed reflect proposed new Thameslink services and rolling stock, including the introduction of new class 700 stock on the Hertford Loop.
London St Pancras International
Finsbury Park
London Kings Cross
Cambridge
Welwyn Gdn City
Stevenage
Peterborough
St Neots
Huntingdon
Hitchin
Royston Herts
Letchworth
Bowes Park
Harringay
St Pancras International
Winchmore Hill
Palmers Green
Hornsey
Finsbury ParkDrayton Park
Highbury
Alexandra Palace
Moorgate
Enfield Chase
Gordon Hill
Cuffley
Hertford N
Watton At Stone
New Southgate
Welwyn Gdn City
Stevenage
Oakleigh Park
Ha�ield Herts
Po�ers Bar
New Barnet
Note: for clarity not all stations are shown
London Suburban Demand compared to total capacity
Significant additional capacity will be provided on suburban services when the new Thameslink timetable is introduced from May 2018. Figure 4 shows where demand is approaching capacity by 2023.
There will be sufficient total capacity on the outer-suburban services.
There is also sufficient capacity on the inner-suburban services overall, albeit that average loads are forecast to exceeding 80% approaching Finsbury Park. However it is important to note that the loads are expected to be heavier on services into Moorgate from the Hertford Loop, and there is a risk that loads on some of these services may reach capacity. The specific levels of crowding on individual services will depend on the extent to which passengers currently using services into Moorgate choose to use Thameslink services instead.
It should be noted that this already takes into account new high-capacity class 717 rolling stock on order for Moorgate services and the proposed increase in frequency on the Hertford Loop to 10tph in the morning high peak.
As growth is forecast to continue beyond 2023 additional inner-suburban capacity will be required soon after 2023.
Figure 4: Heat map showing load as a percentage of total capacity in 2023

Network Rail – East Coast Main Line Route Study 09Autumn 2017Demand and Capacity
Outer Suburban Inner Suburban
2043 AM High Peak hour (8.00am to 8.59am)Capacities include seating and standing
KeyLoad up to 70% seats of total capacity
Load 70%-85% of total capacity
Load 85% -100% of total capacity
Load >100% of total capacity
No forecast presented
Capacities assumed reflect proposed new Thameslink services and rolling stock, including the introduction of new class 700 stock on the Hertford Loop.
London St Pancras International
Finsbury Park
London Kings Cross
Cambridge
Welwyn Gdn City
Stevenage
Peterborough
St Neots
Huntingdon
Hitchin
Royston Herts
Letchworth
Bowes Park
Harringay
St Pancras International
Winchmore Hill
Palmers Green
Hornsey
Finsbury ParkDrayton Park
Highbury
Alexandra Palace
Moorgate
Enfield Chase
Gordon Hill
Cuffley
Hertford N
Watton At Stone
New Southgate
Welwyn Gdn City
Stevenage
Oakleigh Park
Ha�ield Herts
Po�ers Bar
New Barnet
Note: for clarity not all stations are shown
Arlesey
By 2043 the crowding issue on the inner suburban services would worsen substantially, (see Figure 5), with a risk of some Hertford loop services into London being at total capacity from as far out Bowes Park.
Inner-suburban services from Welwyn Garden are also forecast to face crowding issues by 2043, with a risk that some services being at capacity from New Southgate to London. Transport for London have publically consulted a proposal for a future new railway (Crossrail 2) linking central London with a potential branch to New Southgate although this is not a committed project and therefore not assumed by the East Coast Route Study.
The outer-suburban services are approaching total capacity by 2043 between Welwyn Garden City and Finsbury Park. However, with the baseline capacities, the LDHS services are forecast to have some spare capacity available in the morning high peak in 2043. So there is an option to make use of this capacity by stopping LDHS services at appropriate outer-suburban locations in this hour, if this is operationally feasible.
* LDHS capacity is seating only
** Required capacity is higher than forecast loads to allow for variability in loads between trains
Figure 5: Heat map showing load as a percentage of total capacity in 2043
Table 2: Forecast total loads and total baseline capacity in 2043
Baseline capacity
Forecast loadRequired
Capacity**
Inner (Thameslink)Inner (Moorgate)Outer SuburbanLDHS
2,20013,20014,6004,100*
1,50015,40013,000
11,4002,300
Total 34,100 11,600 13,700

Network Rail – East Coast Main Line Route Study 10Autumn 2017Demand and Capacity
Outer Suburban Inner Suburban
2023 AM High Peak hour (8.00am to 8.59am)Capacities include seating only
KeyLoad up to 70% seats of total capacity
Load 70%-85% of total capacity
Load 85% -100% of total capacity
Load >100% of total capacity
No forecast presented
Capacities assumed reflect proposed new Thameslink services and rolling stock, including the introduction of new class 700 stock on the Hertford Loop.
London St Pancras International
Finsbury Park
London Kings Cross
Cambridge
Welwyn Gdn City
Stevenage
Peterborough
St NeotsHuntingdon
Hitchin
Royston Herts
Letchworth
Bowes Park
Harringay
St Pancras International
Winchmore Hill
Palmers Green
Hornsey
Finsbury ParkDrayton Park
Highbury
Alexandra Palace
Moorgate
Enfield Chase
Gordon Hill
Cuffley
Hertford N
Watton At Stone
New Southgate
Welwyn Gdn City
Stevenage
Oakleigh Park
Ha�ield Herts
Po�ers Bar
New Barnet
Note: for clarity not all stations are shown
Sandy
Arlesey
Demand compared to seating capacity
While there is enough total capacity on outer-suburban services to 2023, some passengers would need to stand for significantly over 20 minutes 3. By 2023 some outer-suburban passengers may have to stand for over 30 minutes on some services if the forecasts are realised. Forecasts suggest a bigger problem on services from Peterborough arriving into London in the high-peak hour, with a risk of standing from as far out as Sandy (Figure 6).
**Required capacity is higher than forecast loads to allow for variability in loads between trains
Table 3 shows that there may be an opportunity to prevent some commuters from having to stand for more than 20 minutes, by utilising Long Distance capacities during the high peak hour. This would require appropriate adjustments to stopping patterns and may present some practical and operational challenges. However this option will still not prevent all passengers from having to stand for more than 20 minutes.
Figure 6: Heat map showing load as a percentage of seating capacity in 2023
3 A threshold of twenty minutes, above which passengers should not be expected to stand, is a planning assumption based on relevant DfT and franchising guidance
Table 3: Outer Suburban and LDHS passengers with journeys over 20 minutes 2023 and baseline seating capacity – morning high peak hour
Baseline capacity
Forecast load Required Capacity**
Outer SuburbanLDHS
2,20013,200
1,50015,400
11,4002,300
Total 34,100 11,600 13,700

Network Rail – East Coast Main Line Route Study 11Autumn 2017Demand and Capacity
Outer Suburban Inner Suburban
2043 AM High Peak hour (8.00am to 8.59am)Capacities include seating only
KeyLoad up to 70% seats of total capacity
Load 70%-85% of total capacity
Load 85% -100% of total capacity
Load >100% of total capacity
No forecast presented
Capacities assumed reflect proposed new Thameslink services and rolling stock, including the introduction of new class 700 stock on the Hertford Loop.
London St Pancras International
Finsbury Park
London Kings Cross
Cambridge
Welwyn Gdn City
Stevenage
Peterborough
St NeotsHuntingdon
Hitchin
Royston Herts
Letchworth
Bowes Park
Harringay
St Pancras International
Winchmore Hill
Palmers Green
Hornsey
Finsbury ParkDrayton Park
Highbury
Alexandra Palace
Moorgate
Enfield Chase
Gordon Hill
Cuffley
Hertford N
Watton At Stone
New Southgate
Welwyn Gdn City
Stevenage
Oakleigh Park
Ha�ield Herts
Po�ers Bar
New Barnet
Note: for clarity not all stations are shown
Sandy
ArleseyBaldock
By 2043 outer suburban passengers would have a risk of standing from even further out from London (e.g. around St Neots and Letchworth). The problem could be partially alleviated by making use of available LDHS capacity which is forecast to be further released as a result of abstraction of passengers to HS2. As can be seen from Table 4 there is insufficient capacity to avoid all standing for over 20 minutes.
Figure 7: Heat map showing load as a percentage of seating capacity in 2043
Table 4: Outer Suburban and LDHS passengers with journeys to London of over 20 minutes 2043 and baseline seating capacity – morning high peak hour
Seats Forecast load Required Capacity**
Outer SuburbanLDHS
6,7004,100
13,0001,800
15,3002,100
Total 10,800 14,800 17,400

Network Rail – East Coast Main Line Route Study 12Autumn 2017Demand and Capacity
LDHS and suburban demand into Leeds
Passenger arrivals into Leeds from the Wakefield Westgate corridor on both Suburban and Long Distance services in the morning peak are dominated by commuters. A large proportion of this demand is concentrated in the high peak hour between 08:00 and 09:00.
By considering the total suburban and LDHS baseline capacities there is forecast to be just enough capacity in 2023. Total demand into Leeds on this corridor is forecast to be higher in the morning peak in 2043 as commuting demand on the corridor will be relatively unaffected by abstraction to HS2. Additional suburban capacity would be required in the high peak before 2043, if growth forecasts are realised.
0
500
1000
1500
2000
2500
3000
7-8am 8-9am 9-10am 7-8am 8-9am 9-10am
Forecast demand and capacity to Leeds from Wakefield Westgate 2023 & 2043
Baseline capacity
2023 Forecast demand
2043 Forecast demand
Capacity = total capacity for suburban = seating capacity for long distance
------------- Long Distance -------------- ----------------- Suburban --------------------
Figure 8: Forecast demand and capacity into Leeds from Wakefield Westgate 2023&2043

Network Rail – East Coast Main Line Route Study 13Autumn 2017Demand and Capacity
LDHS and local demand into Newcastle
Durham Corridor
The services into Newcastle Central in the morning peak from the south are generally busier than from the north.
There is easily sufficient baseline capacity to accommodate demand in both 2023 and 2043 in the third morning peak hour between 09:00 and 10:00. The baseline service in this hour assumes 6 LDHS services per hour making use of the 6th LDHS path assumed to be provided by EC Connectivity Fund freight loops project between Northallerton and Newcastle.
Between 07:00 and 09:00, forecast demand into Newcastle Central on LDHS services from the south is shown to be nearing capacity in 2023. This is because the capacity is lower in these hours with far fewer LDHS services operating.
Currently, only two services arrive into Newcastle Central 07:00 – 09:00 from Durham operated by the Intercity East Coast franchise (Virgin Trains East Coast); the other arrivals are CrossCountry or TransPennine services. As the baseline infrastructure is capable of accommodating more train services than operate in these hours, the solution is likely to be a train service/franchising one rather than an infrastructure one.
By 2043 it is expected that the baseline capacities will be exceeded, however by this time HS2 Phase 2b is planned to be operating into Newcastle so the capacity situation will have changed significantly.
The local services, from Saltburn via Darlington and Durham, are shown to be in excess of capacity by 2023 assuming current service levels. The North of England Rail Network Study (NERNS) has already recommended that these services need to be lengthened from 2 to 4 car Sprinters.
0
500
1000
1500
2000
2500
7-8am 8-9am 9-10am 7-8am 8-9am 9-10am
Forecast demand and capacity into Newcastle from Durham AM peak hours 2023 and 2043
Baseline capacity
2023 Forecast demand
2043 Forecast demand
----------------- Long Distance ---------------------- ---------------------- Local ------------------------ Capacity = total capacity for suburban = seating capacity for long distance
Figure 9: Forecast LDHS demand into Newcastle from Durham Corridor morning Peak

Network Rail – East Coast Main Line Route Study 14Autumn 2017Demand and Capacity
Morpeth Corridor
There is expected to be spare LDHS capacity available on the Morpeth corridor in the morning peak into Newcastle in 2023. While these local services are expected to be nearing capacity by 2023 no additional capacity is recommended for CP6. Given the spare capacity on LDHS services there is expected to be sufficient total capacity on the corridor.
Other local services
Sleaford to Lincoln
The forecast loads for 2023 suggest that an additional vehicle would be required to accommodate morning peak demand into Lincoln from Sleaford and evening peak demand from Lincoln to Sleaford, with one service required to be lengthened from 2-car to 3-car trains.
Options to lengthen these services were appraised, but no options were found which showed a medium or high value for money case. The appraisals assumed selective door opening, as lengthening to 3 cars would exceed platform lengths at some intermediate stations.
By 2043 one further vehicle would be required, bringing the maximum train length in the peak to 4 cars.
Newark to Lincoln
This route was previously considered within the East Midlands Route Study, and has been revisited here with the same conclusions.
An additional 1 vehicle would be required into Lincoln from the Newark Castle corridor in the peak in 2023 giving a maximum length of 3 cars. Lengthening these services was considered within the East Midlands Route Study, but no medium/high value for money business case was found.
By 2043 the number of additional vehicles required increases to 3 with a maximum train length of 4 carriages.
0
200
400
600
800
1000
1200
1400
1600
7-8am 8-9am 9-10am 7-8am 8-9am 9-10am
Forecast demand and capacity into Newcastle from Morpeth AM peak hours 2023 and 2043
Baseline
2023 Forecast demand
2043 Forecast demand
----------------- Long Distance ---------------------- ---------------------- Local ------------------------ Capacity = total capacity for local = seating capacity for long distance
Figure 10: Forecast LDHS demand into Newcastle from Morpeth Corridor morning Peak

Network Rail – East Coast Main Line Route Study 15Autumn 2017Freight on the ECML
Today, the railway carries hundreds of millions of passengers and tens of millions of tonnes of freight a year. Rail freight volumes have increased by over 70% in the last twenty years1 , and the value of goods carried today is estimated to be in the region of £30 billion annually2 .
Introduction
Demand for rail freight is expected to continue to grow, as it is increasingly recognised as an economically attractive and environmentally efficient form of transport. Growth is expected to be particularly strong from ports such as Felixstowe, London Gateway and Southampton. We are also anticipating and supporting growth at Northern ports, including Liverpool and ports in the North East.
The dominant issue is the need to create the capacity and capability to serve the future needs of the rail freight market, enabling the sector to remain competitive and to expand. In addition to the recent growth, the nature and the geography of freight carried by rail is changing. Catering for this requires careful assessments of the possible options to ensure that the extra demand is met in a sustainable way, whilst recognising the need to improve resilience of the railway in order to maintain connectivity.
Network Rail has established a route for freight and national passenger operators to successfully meet the challenges ahead 3. This will stand alongside the geographical routes and better enable us to protect and enhance the interests of our freight customers as Network Rail further devolves as a business.
Network Rail published a Freight Network Study in April 2017 which considers the future development of rail freight nationally across the rail network in Great Britain and is intended to support the ECML Route Study which was under development at the time
Forecasted demand for freightTotal volumes increased by over 65% from 13 billion net tonne kilometres in 1995/96 to over 22 billion in 2014/15. In 2015/16 volumes fell by about 20%, primarily due to a decline in coal traffic to power stations, but 2015/16 total volumes are still over 30% above 1995/96 levels 4
It has been estimated that in 2013/14 rail freight delivered productivity, congestion and environmental benefits totalling over £1.6 billion per year to the British economy5.
As a component of the rail industry’s Long Term Planning Process (LTPP) a Freight Market Study (FMS), which was established by the Office of Rail and Road (ORR) in early 2014 through an industry-recognised regulated process. The FMS was published by Network Rail in October 2013 and its forecasts were developed in collaboration with stakeholders. The forecasts in the FMS have contributed to this ECML Route Study.
The FMS projected annual growth in total rail freight volumes of about 3% per annum to 2043. Intermodal volumes were forecast to increase by over 5% per annum, construction volumes were forecast to grow by 1% per annum, while coal volumes were forecast to fall.
The ECML Route Study area forms an important part of the national freight network, carrying 9.3% of current national tonne kilometres in 2011/12; this figure is forecast to rise to 11% by 20436.
The increase in the proportion of freight traffic on the ECML is principally due to a large forecast growth in the intermodal sector.
The forecast growth by commodity across the East Coast Route Study area is shown in Figure 1 on the next page
For a national market context, refer to Part 3 of the Freight Network Study.
Intermodal
Currently intermodal traffic comprises around 41% of tonne kilometres nationally. This is forecast to grow to an 80% share of total tonne kilometres by 2043 as a result of strong forecast growth in intermodal traffic. Forecasts for Great Britain show average annual growth in intermodal to 2043 of approximately 6%, in terms of tonne kilometres.
1 Growth for the 20 years to the end of 2014/5 (volumes declined in 2015/16 due to the sharp fall in coal
volumes). Data are from the Office of Rail and Road (ORR) and refer to tonne kms moved.2 Rail Delivery Group (2015) Freight Britain 3 A virtual route is based on Network Rail’s geographic routes which have responsibilities for different
parts of the network.4 Data is from ORR and refers to financial years. Data excludes Network Rail engineering trains. 5 Rail Delivery Group (2015) Freight Britain.6 2011/12 baseline, Freight Market Study

Network Rail – East Coast Main Line Route Study 16Autumn 2017
Within the ECML Route Study area, intermodal comprised around 4.3% of total tonne kilometres in 2011/12; this is forecast to rise to around 83% by 2043. Across the North of England, intermodal is forecast to rise from 2% in 2011/12 to 39% in 2043.
This is notable in two sub-sectors:
• Ports intermodal: container traffic to and from ports
• Domestic intermodal: other container traffic, including traffic between inland terminals
Contributory factors to the strong forecast growth in intermodal traffic in the East Coast Route Study area are:
• the forecast growth in traffic on the Felixstowe to the North route (F2N) which brings freight from the fast-developing port of Felixstowe towards terminals in Yorkshire
• the expansion of ports in the North East and the desire to link these with ports in the North West
• the expansion of rail-connected warehousing sites
Based on central case economic assumptions used by the Freight Market Study7, deep sea containerised is forecast to increase nationally by 2.7% per annum to 2023, by 2% between 2023 and 2033, and 1.7% per annum between 2033 and 2043.
Rail-connected warehousing sites are forecast to expand from 1.6 million square metres in 2013 to approximately 5.9 million by 2023, 9.6 million by 2033, and 13.3 million by 2043. The assumed overall annual growth in capacity is similar to rate observed at the time of the Freight Market Study.
7For more detail, see FMS Parts 4.2 and 4.3
Figure 1
0
500
1000
1500
2000
2500
3000
Sum of 2011-12 Net Tonne Km(millions)
Sum of 2023-24 Net Tonne Km(millions)
Sum of 2033-34 Net Tonne Km(millions)
Sum of 2043-44 Net Tonne Km(millions)
Milio
ns of
net t
onne
s km
of fr
eight
per a
nnum
ECML Route Study Freight Conditional Output Net Tonne Km
Biomass
Chemicals
Coal Other
Construction materials
Channel Tunnel Intermodal
Domestic Intermodal
Domestic Waste
Engineering
ESI Coal
General Merchandise
Industrial Minerals
Iron Ore
Metals
Nuclear
Petroleum
Ports Intermodal

Network Rail – East Coast Main Line Route Study 17Autumn 2017Freight on the ECML
Construction
Construction volumes have increased by about 3.5% per annum since 2011, well in excess of the FMS’s central case forecasts. The planning assumptions taken in the Freight Market Study are now considered to be somewhat conservative for construction materials.
To address this concern, a higher growth scenario has been developed by the Working Group for the Freight Network Study. This was not included in the FMS, but was developed following discussions within the group and with the Mineral Products Association (MPA).
The higher scenario for this sector reflects forecast growth in UK infrastructure expenditure and a projected increase in rail’s market share. Projected growth in UK infrastructure includes growth due to HS2, Highways England’s investment programme, and increased house building.
Electricity Supply Industry (ESI) biomass and coal
The biomass sector has only emerged as being potentially significant for rail over the last few years. Biomass has enormous potential to grow as a rail market and major investment is already taking place in rail based supply chains. It should be noted that biomass has a lower calorific value than coal and, therefore, requires a greater volume of rail freight per unit of electricity generated. However, there is considerable uncertainty around the volume of biomass likely to move on rail to fuel power stations and a number of generators are still developing their strategy for this sector.
The ESI Coal sector has declined as forecast, although the average annual rate of decline has been much quicker than that anticipated by the forecasts. Decline in coal is expected to accelerate, with an announcement by Government that coal fired power stations will be closed by 2025.
The main destination for ESI Coal using the ECML is Drax power station, although coal does also cross the East Coast Route Study area route destined for power stations in the UK. The main destinations for biomass trains using the ECML are Drax and Lynemouth power stations.
Metals
The metals sector is forecast to grow to 191 Net tonnes per kilometre (millions) by 2023, rising to 243 Net tonnes per kilometre (millions) by 2043.
The overall demand for metals is market driven and the volume of movements on rail is affected by the decisions of the manufacturers. Production decisions are made on a global basis to determine not just the site but the country of production. This consequentially makes volumes and patterns of flows difficult to predict.
Examples of metals traffic currently using or interfacing with the ECML include onward journeys to and from manufacturing plants in Teesside and at Scunthorpe.
Other sectors
The waste and automotive sectors have also seen strong growth since 2011.
The FMS also suggested that the automotive sector, for finished vehicles, is expected to show modest growth over the next 30 years. The FMS central case forecast for this sector shows growth of 0.8% per annum on average to 2033, however the Working Group for the Freight Network Study suggest that the FMS central case forecasts understate the growth prospects for this sector (although a higher growth scenario was not tested).
Industry sources indicate that automotive volumes have increased over recent years (since 2009), well in excess of the modest growth forecast by the FMS. This has been driven by an upturn in global demand for UK manufactured vehicles that satisfy demand for luxury brand vehicles in emerging economies. This growth has been matched by domestic demand for imported vehicles. Rail currently holds around a 10% market share of export and import finished vehicle movements, with certain rail connected automotive plants dispatching up to 40% of their finished vehicle volume by rail.
6 2011/12 baseline, Freight Market Study

Network Rail – East Coast Main Line Route Study 18Autumn 2017Freight on the ECML
Nissan have a large road vehicle assembly plant in Sunderland, producing cars for domestic use and for export. This assembly plant is in proximity to former rail formation but is without a rail connection.
Nationally there are a number of other factors that limit the automotive sector’s growth potential, including:
• Capacity
• Lack of storage space at both manufacturing locations and ports
• The availability and physical limits of rail wagons can limit aspirational demand
• Road haulage remains competitive in cost terms, although rail benefits from a higher yield of vehicles moved
• There is a lack of incentive for Freight Operating Companies or third-parties to invest in wagons, locomotives and terminals because of the fixed timescale of standard logistics contracts
• Capability and connectivity of the rail network. For example, further opportunities for rail growth within automotive sector opportunities will be frustrated without the development of either rail connections directly into, or facilities adjacent to, principle manufacturing plants in the UK
• The risk of damage through vandalism in transit remains, despite ongoing mitigation work.
The future outlook for freight using the ECML
Infrastructure baseline
The baseline network adopted for the ECML Route Study includes the schemes that comprise Network Rail’s Control Period 5 (CP5) Enhancements Delivery Plan, including:
• Kings Cross remodelling
• Stevenage inner-suburban turnback
• Huntingdon to Woodwalton 4-tracking
• Werrington Grade Separation
• Doncaster Area East Side Enhancements
• York North Throat
• Northallerton to Newcastle freight loops
Following the realignment of delivery plans as a result of the Hendy Review this investment programme now extends beyond CP5 with the development and completion of some schemes now planned for early-CP6. The Inner Suburban turnback at Stevenage has been deferred until CP6.
This East Coast Main Line W12 Gauge Clearance scheme, and Yorkshire Terminals Gauge Clearance scheme, both funded through the Strategic Freight Network (SFN)8 fund are also assumed.
8The SFN was built upon industry discussions and the Freight Route Utilisation Strategy (Network Rail,
2007) to ‘optimise the freight performance of our intensively utilised mixed-traffic rail network,
allowing the efficient operation of more, longer and selectively larger freight trains’.
Network Rail – East Coast Main Line Route Study 19Autumn 2017Freight on the ECML
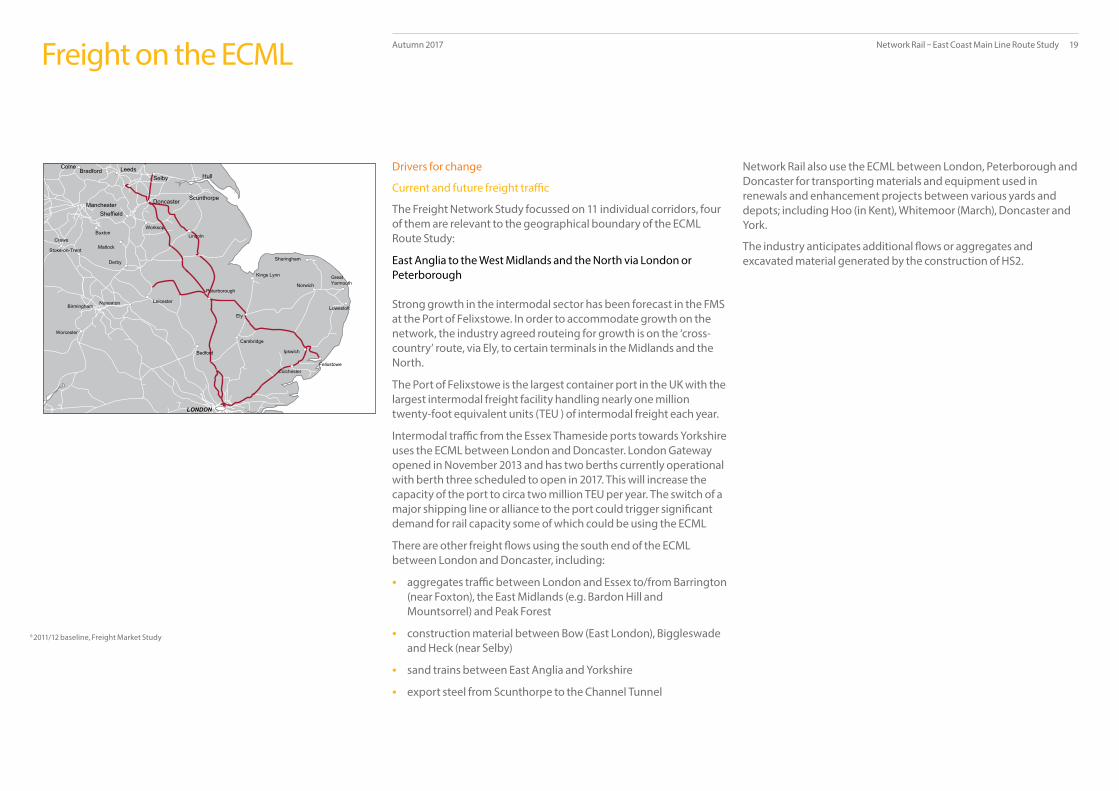
Drivers for change
Current and future freight traffic
The Freight Network Study focussed on 11 individual corridors, four of them are relevant to the geographical boundary of the ECML Route Study:
East Anglia to the West Midlands and the North via London or Peterborough
Strong growth in the intermodal sector has been forecast in the FMS at the Port of Felixstowe. In order to accommodate growth on the network, the industry agreed routeing for growth is on the ‘cross-country’ route, via Ely, to certain terminals in the Midlands and the North.
The Port of Felixstowe is the largest container port in the UK with the largest intermodal freight facility handling nearly one million twenty-foot equivalent units (TEU ) of intermodal freight each year.
Intermodal traffic from the Essex Thameside ports towards Yorkshire uses the ECML between London and Doncaster. London Gateway opened in November 2013 and has two berths currently operational with berth three scheduled to open in 2017. This will increase the capacity of the port to circa two million TEU per year. The switch of a major shipping line or alliance to the port could trigger significant demand for rail capacity some of which could be using the ECML
There are other freight flows using the south end of the ECML between London and Doncaster, including:
• aggregates traffic between London and Essex to/from Barrington (near Foxton), the East Midlands (e.g. Bardon Hill and Mountsorrel) and Peak Forest
• construction material between Bow (East London), Biggleswade and Heck (near Selby)
• sand trains between East Anglia and Yorkshire
• export steel from Scunthorpe to the Channel Tunnel
Network Rail also use the ECML between London, Peterborough and Doncaster for transporting materials and equipment used in renewals and enhancement projects between various yards and depots; including Hoo (in Kent), Whitemoor (March), Doncaster and York.
The industry anticipates additional flows or aggregates and excavated material generated by the construction of HS2.
6 2011/12 baseline, Freight Market Study
York
Bradford LeedsHull
Doncaster ManchesterSheffield
Crewe
Derby
Norwich
Leicester
Peterborough
Birmingham
Cambridge
Worcester
Felixstowe
Ipswich
LONDON
Bedford
Kings Lynn
Sheringham
Matlock
Lowestoft
Lincoln
WorksopBuxton
Colne
Scunthorpe
Selby
GreatYarmouth
Stoke-on-Trent
Colchester
Nuneaton
Ely

Network Rail – East Coast Main Line Route Study 20Autumn 2017Freight on the ECML
East Midlands and Yorkshire
The commodity types prevalent on the East Midlands and Yorkshire routes and affecting the ECML are coal and biomass for transportation from ports at Immingham, the North East and Scotland to Ratcliffe and West Burton power stations. Coal traffic declined dramatically in 2015/16. The increase in volume of biomass traffic has offset the decline in coal to a degree, however whilst coal can be stockpiled outside, biomass has to be stored under cover and cannot be stockpiled. Therefore “just-in-time” and resilient delivery of biomass to power stations is essential.
Drax Power Station in North Yorkshire produces around 7 – 8% of UK electricity generation. Some of its six units have been converted to run on high density wood pellets (biomass). Drax is heavily committed to rail and had previously underwritten some £300 million of investment in port and rail infrastructure, commissioned the design and build of 225 new railway wagons and invested in a major overhaul of its on-site rail infrastructure.
To support the challenge facing the rail freight industry of replacing coal traffic, gaps have been identified to enable new commodities markets, primarily intermodal, to develop.
Network Rail also use the network for transporting materials and equipment used in renewals and enhancement projects between various yards and depots; including Doncaster, York and Tyne Yard (south of Newcastle).
Norwich
Birmingham
Liverpool
York
HullSelby
Immingham
Crewe
Newcastle
Manchester
Carlisle
Darlington
Doncaster
Northallerton

Network Rail – East Coast Main Line Route Study 21Autumn 2017Freight on the ECML
Northern Ports and Trans PennineThe North of England’s four main ports at Liverpool, Hull, Teesport and Tyne agreed a new partnership in 2016 to create jobs, boost exports and prosperity across the whole of the North of England.
The association’s creation is a recommendation in Institute for Public Policy Research (IPPR) North’s Northern Ports report9 , which highlighted the domination of southern ports and the problems this creates in transporting imports and exports across the UK. For instance, at present, 60% of freight destined for the North is delivered to southern ports. Greater use of coastal shipping routes could relieve pressure on land-based transport links by moving cargo on by sea for distribution, and allowing the North East’s ports to act as regional hubs for goods.
The North East’s ports are the gateways to the region’s industrial economy, and the enabler of automotive, advanced manufacturing, oil and gas and chemical sectors. From Teesport in the south, with its 40 million tonnes of cargo a year, to Port of Tyne which adds £710m to the regional economy, to Port of Blyth in the north, which is a base for the offshore oil and gas industry10.
PD Ports, owner and operator of Teesport, the UK’s third largest port by volume completed a reconstruction project in 2016 to support further growth at the port. The expansion offers some 550m of deep water quay. The next phase of investment will take capacity to at least 1.1m TEU and the ability to handle vessels up to 10,000 TEU capacity. It has a longer term ambition of handling circa 2m TEU each year across a platform which integrates rail, road, warehousing and handling facilities.
A V Dawson operates a rail-connected deep-water terminal on the River Tees cargo where it handles steel, dry bulks, containers and general cargo; the Tees Riverside Intermodal Park, the adjacent Ayrton International Railhead (which includes rail-connected warehousing) and Middlesbrough Goods Yard.
Teesside also boasts two more deep-water facilities at Redcar Bulk Terminal and ICL UK Bulk Terminal, both capable of imports and exports.
The route between the port of Immingham and Doncaster is currently being gauge cleared to W12 to support future growth aspirations for intermodal traffic, both deep-sea and domestic, from the port.
Other freight flows from the North East using the ECML include:
• petroleum from Jarrow (Tyneside) and Port Clarence (Teesside) towards the Midlands and South Wales
• metals from Teesside plants at Skinningrove, Lackenby and Hartlepool towards South Wales
• potash from Boulby
• waste from Manchester to Teesside
• coal from West Cumbria to Redcar for export11
Hitachi Rail Europe opened a train assembly plant at Newton Aycliffe, which is connected to the Darlington to Bishop Auckland branch line.
Freight capacity across the Pennines between ports in the North East and North West has been identified as a constraint to growth. The combination of increasing passenger service requirements coupled with the current growth in bulk and forecast growth in intermodal flows between Liverpool and Teesside has resulted in a key capacity gap.
Doncaster
Hull
Immingham
Huddersfield
Manchester
Leeds
York
She�eld
Middlesbrough
Newcastle
Hartlepool
Sunderland
Darlington
Northallerton
Blackpool
Liverpool
BlackburnSelby
9 http://www.ippr.org/news-and-media/press-releases/post-brexit-northern-gateway-to-europe-
more-important-than-ever-1 IPPR North is the dedicated think-tank for the North of England 10 Investing in our region’s transport infrastructure (North East England Chamber of Commerce,
December 2016)11 This is potential new flow via the Tyne Valley anticipated to commence in 2019

Network Rail – East Coast Main Line Route Study 22Autumn 2017Freight on the ECML
ManchesterLiverpool
YorkHull
Immingham
Newcastle
Carlisle
Glasgow
Berwick-upon-Tweed
Northallerton
Ayr
Leeds
Edinburgh
MiddlesbroughDarlington
Core route
All other routes
Anglo-Scottish and Northern regional trafficFor linking routes from northern England to Scottish Terminals via the ECML, the choices for funders on the Anglo Scottish route are linked to the outputs on other corridors including Trans Pennine and Northern Ports, East Midlands and Yorkshire freight flows. Gaps have been identified over the next ten years and beyond, taking account of forecast growth in intermodal freight volumes.
Network Rail also uses the ECML between Newcastle and Scotland for transporting materials and equipment used in renewals and enhancement projects between various yards and depots in the North East England and Scotland.
Freight terminals
In September 2016 Transport for the North (TfN) published a Northern Freight & Logistics Report. The recommendations within this report demonstrate how public sector investment coupled with private sector investment can achieve User and Non-User Benefits to the UK economy, plus Wider Economic Benefits net additional to the Northern Economy.
Devolution of central Government powers to the regions
In August 2014 the Chancellor set out a vision to better connect Northern England and for it to become ‘one Northern Powerhouse’, acting together to drive economic outcomes greater than the sum of its parts. The Chancellor’s announcement was followed by HM Treasury’s ‘Fixing the Foundations’ report in 2015, which committed to devolve further powers to the North (and elsewhere) 12.
In September 2016 Transport for the North (TfN) published a Northern Freight & Logistics Report. The recommendations within this report demonstrate how public sector investment coupled with private sector investment can achieve User and Non-User Benefits to the UK economy, plus Wider Economic Benefits net additional to the Northern Economy.
TfN have key recommend measures for capacity (including north-south, and across the Pennines) to deliver a step-change in capacity to secure a modal shift with economic and environment benefits, and opportunities for rail-based access to new and existing markets not previously accessible by rail.
Nottingham
Peterborough
Northallerton
Darlington
Middlesbrough
Carlisle
Newcastle
Inverness
Dundee
Edinburgh
LONDONKINGS CROSS
Moorgate
Cambridge
Stevenage
FortWilliam
Glasgow
Aberdeen
Perth
Ely
Grimsby
LeedsHullBradford
SkiptonIlkley York
Harrogate
Lincoln Retford
Doncaster
B
A
H
A
B
C
D
E
F
G
H
I
J
K
L
M
N
ID
E F
G
C
N
M
KJ
L8
6
7
3
1
12345678
2
4
5
FelixstoweLondon GatewayWhitemoorStourton FLTWakefield Europort (near Leeds)SelbyGooleImminghamDrax power stationMerchant Park (Newton Ayclie)TeessideTyne DockSunderlandLynemouth
Freight terminals beyond ECML:
ECML freight terminals:BiggleswadeBarrington (near Foxton)PeterboroughDoncasterHeckYorkFerryhillTyne Yard
12 Northern Powerhouse Independent Economic Review (Executive Summary) (TfN, 2016)

Network Rail – East Coast Main Line Route Study 23Autumn 2017Freight on the ECML
A strategy for freight using the ECML towards 2043
To understand demand, a range of economic scenarios for 2023 and 2043 were tested. The scenarios ranged from a UK economy that was ‘struggling in isolation’, to one where it was ‘prospering in global stability’. The ‘prospering in global stability’ scenario represents the high end of the demand spectrum which was favoured as a credible best case that could define the railway development of the future.
To understand freight demand on the ECML, national freight flows have been aligned with freight corridors that cross the East CoastCML Route Study area. This allows an understanding of the service levels, based on unconstrained forecasts, required of each corridor for 2023 and 2043. More detail on how this process was developed can be found in the Freight Market Study.
The Route Study working group has included an Indicative Train Service Specification (ITSS) – see Figure 2 – that identifies the type and number of train services needed to deliver the Market Study conditional outputs, including the required capacity for Class 4 and Class 6 freight services 13
From this ITSS the working group decided on some strategic outcomes, based on capacity and capability themes, for freight on the ECML (shown on the next page).
The Midlands
Selby
NEWCASTLE
Stevenage
Welwyn Garden City Her ord North
Finsbury Park
Camden Road Canonbury
Copenhagen Jn.
PETERBOROUGH
Peterborough Yards
March
NewarkThe Midlands Immingham
Immingham
Lincoln
Gainsborough Trent Jn.GN/GE
GN/GE
Sheffield
South Kirkby Jn.Hare Park Jn.
Yorkshire / West Mids
Cro�on West Jn.
YORK
Northallerton
East Anglia
Scunthorpe
Ferryhill South Jn.
King Edward Bridge South Jn.Carlisle
Pelaw Jn.
Seaham Harbour
Teesside
Port of Sunderland
Port of TyneLynemouth
Scotland
Yarm
TYNE VALLEY
Anglia Route Study area
Berwick-upon-Tweed
1 tphless than 1 tph
Class 4 freightClass 6 freightClass 4 or Class 6 freight
Sta�on or junc�onFreight terminal / freight node
beyond ECML study scope
All lines represent 1 train each way unless with or
13 Class 4 freight services have a maximum operating speed of 75 mph, Class 6 freight
trains have a maximum operating speed of 60 mph.
Figure 2

Network Rail – East Coast Main Line Route Study 24Autumn 2017Freight on the ECML
14 These 9 passenger services are agnostic of Network Rail’s Market Study conditional outputs, HS2
Ltd. Indicative Service Specification, and the Northern Powerhouse Rail conditional outputs of
Transport for the North.
Table 2: Indicative Train Service Specification for freight
Theme Strategic outcome summary
Capacity Segregation between Long Distance High Speed (LDHS) passenger trains against freight and frequent-stopping passenger services:
London to Peterborough• Two freight paths per hour between London and Peterborough, supporting a Class 6 path every two hours • Capability for all freight to run via the Hertford Loop
Peterborough to Doncaster• Two Class 4 freight paths per hour• A third path per hour that could be either Class 4 or Class 6• Reduction in crossing movements in Doncaster station area
The GN/GE Upgrade completed in 2015, coupled with the Werrington Grade Separation to be completed in 2020, allows daytime freight between Peterborough and Doncaster to run via the ‘GN/GE’ route, thus providing additional LDHS passenger paths on the ECML via Grantham
Doncaster to York• Two Class 4 per hour, and one Class 6 per hour• Improving gauge, capability and journey time for all freight between Doncaster and York to run via Askern, Knottingley, Milford and Church Fenton. This would achieve segregation of freight and LDHS services• Configuration of ECML south of York to enable segregation between LDHS, HS2 and Northern Powerhouse Rail passenger trains against freight and frequent-stopping passenger services
York to Newcastle• The ECML will be at capacity by 2021 between Northallerton and Newcastle.• Capacity is required between Northallerton and Newcastle for at least two freight trains per hour, and nine passenger services per hour 14
Newcastle to EdinburghCapacity for one freight path per hour and four passenger services per hour linking Newcastle and Edinburgh
Average speed Reduce end-to-end journey times and increase network capacity:• Removal of restrictive line speeds in specific locations• Length of loops, coupled with optimised entry and exit speeds• Additional infrastructure to reduce conflicting movements• Additional infrastructure to further segregate freight from LDHS services
Gauge • Flexibility for freight to run via Welwyn Garden City in event of disruption or planned engineering work because this route is not W12• Development of W10 diversionary routes to enable new intermodal freight routes• Extension of the W12 capability beyond the ECML; notably for the Northern Ports & Trans Pennine corridors
Train length 775m capability baseline
Digital Railway Seek opportunities to integrate and maximise the benefits of the Digital Railway programme to improve freight capability and regulation

Network Rail – East Coast Main Line Route Study 25Autumn 2017Freight on the ECML
Capability
Reduced end-to-end journey time is a crucial factor in enabling rail freight to offer a viable alternative to road haulage and in encouraging modal shift to rail. At present, end-to-end journey time of freight flows on some key corridors can be very long and average speed very low, restricting rail freight’s ability to offer a competitive service and price to its customers. Key drivers of reduced end-to-end journey time are the capability of the infrastructure in terms of maximum line speed, the number of sections of low line speed, and having to recess freight trains for a faster passenger service to overtake it. The latter is particularly critical, since if a heavy freight train is required to stop or slow to a low line speed, accelerating back up to full speed takes considerable time.
Another key driver of rail freight’s advantage relative to road is its ability to carry a greater volume of goods per journey. Where the length of trains is restricted by infrastructure limitations, this competitive advantage is diminished. Relatively light goods, primarily intermodal and automotive, are the main beneficiaries of longer trains as the necessary traction power to haul longer trains is more readily available. By contrast, for heavier commodities such as construction, the tractive capability of locomotives and coupling strength are more of a constraint on train length.
The industry has also established an aim to make 775m the minimum baseline for intermodal train length across the network, exploring opportunities for greater lengths beyond this benchmark where feasible.
There are aspirations to increase the gauge of the core intermodal network to W10 and W12 standard 15 . This will enhance the operational and economic advantages for rail freight, enabling it to carry taller shipping containers, accommodating a wider range of wagon and load unit combinations and increase network routeing options.
Low-platform intermodal wagons are an alternative to gauge clearance however they have disadvantages in terms of productivity because it means fewer containers per train compared with standard intermodal wagons. Low-platform intermodal wagons typically incur higher maintenance costs because of greater wear-and-tear towards the wheels and brakes.
Furthermore such wagons tend to be less ‘friendly’ to the track thus increasing track maintenance costs, which is passed on to FOCs by Network Rail via Track Access charges.
15 The physical dimensions of a railway vehicle are governed by a series of height and width
profiles, known as loading gauges. W10 allows 9’6” high containers (2500mm wide) to be carried
on a standard container wagon. W12 allows a 9’6 high container to be carried on a standard
container wagon, including refrigerated containers up to 2600mm wide.

Network Rail – East Coast Main Line Route Study 26Autumn 2017Demand and Capacity
Digital Railway
The Digital Railway is a rail industry-wide programme designed to benefit the economy by accelerating the digital enablement of the railway. The Digital Railway programme is setting out to build the industry business case in a number of areas, including infrastructure, train operation and capacity allocation.
Key benefits for the freight industry that the Digital Railway could provide centre around the following areas:
• Additional capacity through enhanced signalling system capability and sophistication including enhanced freight consistent speed and reductions to headways 16. For example: on notable pinch-points of the ECML, such as between Huntingdon and Peterborough.
• Improved quality of freight paths and enhanced traffic management capability. Improved network traffic management, adapting to the live situation for cross route flows from joined up regional control centres, has the potential to improve the quality of paths, interaction with passenger service and overall network management for freight services.
• Train control and operation could be optimised to time with passenger services if the system were to dynamically model the capability of freight rolling stock.
• Safety through the ability to control trains in a safer manner and reduce lineside equipment and its associated maintenance.
The freight industry has identified two key elements that need to be considered and specified within the Digital Railway development process. Firstly, due to the FOCs deploying their fleets nationally, freight locomotives will have to be prioritised for initial European Train Control System (ETCS) fitment if line side signals are to be removed.
Secondly, in order to realise the maximum benefits of the Digital Railway, the ETCS technical and operating parameters must be optimised to reflect the latest freight braking performance data to ensure that freight performance and capacity are not restricted.
Electrification
The ECML is electrified between London Kings Cross and Edinburgh, on the Hertford Loop and between Doncaster and Leeds.
Further electrification of the network to enable freight services to switch from diesel to electric traction is anticipated to have the following benefits:
• Increased network capacity through enhanced performance and average speed, enabling freight market growth
• Reduction in whole industry costs
• Improvements to capacity utilisation and network efficiency
• Environmental benefits when compared to diesel traction
• Improvement in the rail freight product to end users, for example through shortened journey times
• Industry confidence in the electrification programme to invest in electric locomotives.
For further details, please refer to Part 5.4.1 of the Freight Network Study.
16 The minimum safe interval between successive trains on a particular section of track

Network Rail – East Coast Main Line Route Study 27Autumn 2017Freight on the ECML
Choices for Funders
Non-infrastructure solutions
The rail industry recognises the need to make best use of existing network capacity before considering infrastructure investment-based strategies to accommodate increasing demand 17.
Recognising this, and the constraints of the current economic situation, Network Rail and the freight industry are working together to actively identifying methods to make best use of existing capacity on the network. Non-infrastructure enhancement methods include:
• Adjusting and optimising timetables: alterations to timetables can often create extra capacity through path optimisation and improved integration between freight and passenger services.
• Furthermore, development and protection of strategic freight capacity can optimise freight paths within the timetable.
• Maximising utilisation rates: A ‘Capacity Management’ work stream was established in May 2014 with the aim of reviewing unused freight schedules. This collaborative work stream between Network Rail and all freight operators intended to generate additional freight capacity without the need for infrastructure enhancements. This was achieved by relinquishing paths that are unused back to the timetable planning process.
• Optimising operational resources to maximise paths: achieved by maximising train lengthening, within current parameters, and optimising rolling stock and wagon combinations, to convey as great a volume of goods as possible per path.
Additionally, enhancements to the capability of the network can increase capacity for freight. For example, gauge clearance can enable new freight services to run in existing unused paths or increasing permitted train lengths on routes can enable additional volumes of goods per service.
Capability Studies specifically carried out by Freight Network Study
The Freight Network Study commissioned assessments into a number of specific cases where a need has been identified for enhanced freight capability. These were two fold:
• To understand the practicality and benefit of increasing speed and/or axle weights for a range of commodities on key flows across the network
• To understand the technical feasibility of increasing speed and/ or axle weight.
One of these studies assessed increasing speed for biomass on the ECML between York and Newcastle. Raising the maximum speed of Biomass freight trains from 60mph to 75mph offers improvements in journey time between 2½ and 5 minutes, dependent on weight and the extent to which regulation is required. The majority of this benefit was achieved between King Edward Bridge Junction (Gateshead) and Northallerton. The limited nature of the improvement is a result of low line speeds at adjoining sections of the route, limited capabilities of the traction (assumed to be Class 66) along gradients and the time it takes to accelerate above 60mph.
This study has shown that even these relatively small improvements could provide substantial benefits in conjunction with the additional loops being proposed on the ECML between Northallerton and Newcastle and are worth investigating further. Journey times between these loops constrain the entire timetable and any improvement would increase flexibility whilst easing congestion.
The journey times could be improved further with the implementation of line speed improvements over the constraining sections of track.
Please refer to Part 5.5 of the Freight Network Study for further details.
17 Rail Value for Money Study (‘Realising the Potential of GB Rail’, Sir Roy McNulty, May 2011)

Network Rail – East Coast Main Line Route Study 28Autumn 2017Freight on the ECML
Axle load capability
Enhancing structures to remove restrictions on Route Availability offers greater flexibility for routing trains, or removes speed restrictions thus improving the journey time for heavy freight trains.
Weight restrictions on the Hertford Loop are barrier towards routing more Class 6 trains along this route.
W10 and W12 gauge capability
The freight industry has highlighted the future requirement to develop further the current W10 network to increase operational flexibility and resilience, primarily required for deep sea intermodal services. The key priorities centre on creating an increased number of diversionary routes during times of core route closure. Additional diversionary routes can also create increased regular capacity through new pathing options.
The Freight Network Study highlighted the south end of the ECML as the highest priority which would increase the routeing flexibility and resilience for the Port of Felixstowe, London Gateway and Tilbury.
In addition to continuing the implementation of the W10 network, the freight industry has prioritised the requirement to create a more extensive W12 network. Development of W12 gauge cleared routes would enable new capability, primarily for short sea intermodal services. The industry aspiration for the gauging of new routes is to, where feasible, deliver W12 capability as the standard gauge requirement. By delivering to W12 in the first instance, this removes the need to upgrade routes at a later date.
The ECML is already cleared for W12 between London and Peterborough, the ‘GN/GE’ route, and Doncaster to Edinburgh. The Freight Network Study has ranked such routes branching off the ECML as ‘tier 1’ to build upon current W12 cleared sections and give key line of route clearance to enable the development of new markets and traffic flows:
• Felixstowe to Peterborough via Ely
• Peterborough to Leicester
• Doncaster to North Lincolnshire (e.g. Immingham) via Scunthorpe
• Shaftholme Junction (north of Doncaster) to Wakefield and Leeds via Knottingley
• Northallerton to Eaglescliffe, and Middlesbrough to Teesport
• Middlesbrough to the ECML via Stockton and Stillington
Gauge clearance in the north would act as an enabler for economic growth as part of the Northern Powerhouse.
For further details, refer to Part 7 of the Freight Network Study.
17 Rail Value for Money Study (‘Realising the Potential of GB Rail’, Sir Roy McNulty, May 2011)
Port of
Leeds WakefieldSelby
Doncaster
Ely
Teesport
Castle Donington
Felixstowe
London Gateway
Barking
Daventry
Birch Coppice
Trafford Park
Lawley Street
Tyne
Tees Riverside Intermodal Park
Harwich
Selby
March
Hertford
Watford
Hitchin Colchester
Stowmarket
Newark
Chesterfield
AlfretonKidsgrove
Macclesfield
Gainsborough
Tamworth
Leamington Spa
Burton-on-Trent
Melton Mowbray
Worcester
Stockport
Wakefield
Darlington
Will
esde
n Jn
Stratfo
rd
Ely
York
Hull
Rugby
LEEDS
Derby
Oxford
Settle
Ipswich
Norwich
Bedford
Swindon
Coventry
Nuneaton
SHEFFIELD
Bletchley
Doncaster
Cambridge
NEWCASTLE
Gloucester
Kings Lynn
Felixstowe
Sunderland
Northampton
Peterborough
Grimsby
Middlesbrough
Wolverhampton
Stoke-on-Trent
Didcot
Bury St Edmunds
Berwick-upon-Tweed
Warrington
Stafford
Bradford
Leicester
Sleaford
LONDON
Lincoln
Banbury
MANCHESTER
BIRMINGHAM
Hexham
Spalding
NOTTINGHAM Grantham
Reading S. Acton
Wilton
Hams Hall
Immingham
Baseline W10 gaugeFuture W10 gauge aspiration
Network Rail
ECML: W10 Gauge
Felixstowe
Barking
Selected Locations with Station
Sea Port & Intermodal Rail Freight Terminal
Intermodal Rail Freight Terminal
Preston
NOTTINGHAM
(other)
(main city)

Network Rail – East Coast Main Line Route Study 29Autumn 2017Freight on the ECML
More freight hauled by electric traction
The ECML is electrified between London Kings Cross and Edinburgh, on the Hertford Loop and between Doncaster and Leeds.
However freight hauled by electric traction is at a disadvantage of having other routes beyond the ECML not electrified, such as towards ports on the East Coast.
Some routes that are strong candidates for gauge clearance to W12 could be specified additionally with electrification, or at least passive provision for follow-on electrification.
Although bi-mode (electric and diesel) capable locomotives are used by some FOCs on mainland Europe, Direct Rail Services is the only FOC in the UK that has currently invested in bi-mode locomotives and the capability of this traction is to be proven at the time of writing.
Other FOCs such as DB Cargo (UK), Freightliner and GB Railfreight have a fleet of electric locomotives, but overall the industry needs confidence in an electrification strategy before deciding to invest in new locomotives (electric or bi-mode); the costs per locomotive typically in excess of £4m per locomotive.
Port of
Leeds WakefieldSelby
Doncaster
Hams Hall
Ely
Teesport
Castle Donington
Felixstowe
London Gateway
Barking
Daventry
Trafford Park
Lawley Street
Tyne
Tees Riverside Intermodal Park
Wilton
Harwich
Selby
March
Hertford
Watford
Hitchin Colchester
Stowmarket
Newark
Chesterfield
AlfretonKidsgrove
Macclesfield
Gainsborough
Tamworth
Leamington Spa
Burton-on-Trent
Melton Mowbray
Worcester
Stockport
Wakefield
Darlington
Staines
Wille
sden
Jn
Stratfo
rd
Ely
York
Hull
Rugby
LEEDS
Derby
Oxford
Settle
Ipswich
Norwich
Bedford
Swindon
Coventry
Nuneaton
SHEFFIELD
Bletchley
Doncaster
Cambridge
NEWCASTLE
Gloucester
Kings Lynn
Felixstowe
Sunderland
Northampton
Peterborough
Grimsby
Middlesbrough
Wolverhampton
Stoke-on-Trent
Didcot
Bury St Edmunds
Berwick-upon-Tweed
Warrington
Stafford
BRISTOL
Bradford
Leicester
Sleaford
LONDON
Lincoln
Banbury
MANCHESTER
BIRMINGHAM
Hexham
Spalding
NOTTINGHAM Grantham
Reading S. Acton
Immingham
Network RailFuture W12 gauge aspiration (Tier 1)Future W12 gauge aspiration (Tier 2)Baseline W12 gauge
ECML: W12 Gauge
Felixstowe
Barking
Selected Locations with Station
Sea Port & Intermodal Rail Freight Terminal
Intermodal Rail Freight Terminal
Preston
NOTTINGHAM
(other)
(main city)

Network Rail Limited and
Network Rail Infrastructure Limited
1 Eversholt Street
London NW1 2DN
Tel 020 7557 8000
networkrail.co.uk
Company number: 4402220
Registered in England and Wales