east lansing, michigan · socio economic profile source: 2000 us census mode of transportation to...
TRANSCRIPT

Hagadorn Corridor StudyEast Lansing, Michigan
Urban & Regional Planning Program
UP 894/494 Planning Practicum
Michigan State University
Spring 2005
Kevin Newman Robin Palmer Jennifer Rigterink Rachael Tupica Tom Veldman

Client Information
City of East Lansing
Department of Planning & Community Development
Lori Mullins, Senior Project Manager

Presentation Overview
• Project Background & Goals
• Study Area Boundaries
• A Sense of the Hagadorn Corridor
• Strengths, Weaknesses, Opportunities, Threats
• Socio-Economic Profile
• Methods
• Recommendations

Project Background & Goals
Working with the City of East Lansing to:
• Conduct a corridor study of North Hagadorn Road
to identify, inventory, and assess current land use,
pedestrian friendliness, traffic flow and roadway
design
• Make recommendations for future development in
terms of pedestrian safety, sense of place, zoning
and capital improvements

Study Area Boundaries
Grand River Avenue to
Haslett RoadHagadorn Road

A Sense of the Hagadorn Corridor

MSU

Strengths, Weaknesses, Opportunities, Threats
Strengths• Proximity to Michigan State University
• Proximity to elementary & middle
schools
Weaknesses• Lack of mixed-use
• Lack of pedestrian amenities such as
sidewalk buffers, lighting, and an adequate
number of crosswalks
Opportunities• Width of the roadway provides for the
possibility to be redesigned
Threats• Roadway design does not allow for
proper traffic control measures to slow
speeds

Socio Economic ProfileSource: 2000 US Census

Socio Economic ProfileSource: 2000 US Census
Race:
• Block Group 1: 84.3% White / 5.0% Black
• Block Group 2: 93.9% White / 5.0% Asian
• Block Group 3 89.0% White / 4.2% Asian
• Block Group 4: 94.2% White / 2.4% Asian
City of East Lansing: 81% White / 8% Asian
Total Population: 6,331
• Block Group 1: 2,160
• Block Group 2: 862
• Block Group 3: 1,673
• Block Group 4: 1,636
City of East Lansing Population: 46,687

Socio Economic ProfileSource: 2000 US Census
Median Income
• Block Group 1: $32,461
• Block Group 2: $38,828
• Block Group 3: $23,750
• Block Group 4: $31,433
City of East Lansing Median Income: $28,217
Age
• Block Group1: 75+ yrs (20.0%)
• Block Group.2: 19-24 yrs (25.0%)
• Block Group 3: 19-24 yrs (70.1%)
• Block Group 4: 19-24 yrs (57.9%)
City of East Lansing: 19-24 yrs (51.2%)

Socio Economic ProfileSource: 2000 US Census
Mode of Transportation to Work:
• Car-Drove Alone: 2,630
• Car-Pooled: 313
• Public Transportation: 99
• Walked: 254
• Biked: 90
• Worked at Home: 94
Mean Travel Time to Work:
• Block Group 1: 15 minutes
• Block Group 2: 7 minutes
• Block Group 3: 17 minutes
• Block Group 4: 16 minutes

Methods
• Residential & Commercial Evaluation
• Walkability Evaluation
• Sidewalk Quality Evaluation
• School Zone Evaluation
• Traffic Analysis and Comparables

Land Use
•98 Residential Properties
•51% Owner Occupied
•49% Renter Occupied
•7 Commercial Use Areas
•3 Community Uses
•2 Schools
•2 Churches
123 Parcels Total

Land Use EvaluationCriterion Used
Excellent Good Fair Poor
Exterior Undamaged,
no sign of
weathering
Some
weathering
Over ¼
observed
damaged
Over ½ observed
damaged
Windows/
Doors
Intact, no sign
of weathering
Minor damage Over ¼
broken/
damaged
Over ½ broken/
damaged
Roof Fully intact, no
visible sign of
damage
Minor damage
and weathering
Over ¼
damaged/
weathered
Over ½
damaged/
weathered
Yard Clean and free
of debris
Clean, small
amount of
debris
Some debris
and some
overgrowth
Significant debris
and overgrowth
Source: Adapted from “Neighborhood Commercial Corridor Revitalization Study: For the South West Area Neighbors West Fulton Street Corridor Study,
Grand Rapids, Michigan, 2003

Land Use EvaluationResidential
Residential Property
Overall Condition Rating
Good
83%
Fair
7%
Excellent
10%
Example of a house rated “Good”
Example of house rated “Excellent”

Commerical Stock and Other Use
Properties Overall Condition Rating
Good
36%
Excellent
16%
Fair
48%
Land Use EvaluationCommercial & Other Uses
Example of a property rated
“Good”
Example of a property rated “Excellent”

Walkability EvaluationHow Walkable Is Your Community? Survey
• Crosswalks located only at major intersections (Haslett Road,
Burcham Drive, Grand River Avenue)
• Inadequate benches, public art, trash facilities, lighting, and buffers
• Timing of crosswalks not adequate, especially for persons with
disabilities
• Sidewalks are adequate width
Source: Pedestrian and Bicycle Information Center

Sidewalk Quality Evaluation
Excellent Free of
cracks, debris,
or unevenness
Good Mostly clear
of cracks,
debris, or
unevenness
Fair Over ¼ has
cracks, debris,
or unevenness
Poor Over ½ has
cracks, debris,
or unevenness
Good
Poor

School Zone EvaluationSafe Routes to School Audit
• A crosswalk was observed to be needed on Burcham Drive at John R Street
• Sidewalk ends on Burcham Drive, east of school
• Pedestrian signals at Hagadorn Road and Burcham Drive do not provide
adequate time to cross
• School zone signage is inconsistent
• Crosswalks need to be repainted at Hagadorn Road and Burcham Drive

Traffic EvaluationSnapshot of the Hagadorn Corridor
• 4-lane undivided 2-way road,
with no center turn lane
• Lane width is 12 feet
• Posted speed is 30 mph (except
during specific times in school
zones where it is 25 mph)
• No areas of permitted parking
• 2 prohibited turns, at Burcham
Drive and Grand River Avenue
• No bike lanes

Traffic EvaluationAccident Data 1994-2003Source: City of East Lansing
536 Accidents Total:
• Approximately 96% Vehicular
• 4% Bicycle
• 0.4% Pedestrian
High percentage of accidents at:
• Grand River Avenue
Northern Half Southern Half

Traffic EvaluationCurrent Counts and Future Projections
Hagadorn Traffic Counts Haslett Road to Grand River Avenue
23,486
17,615
26,70324,916 21,991 21,493
18,936
0
5,000
10,000
15,000
20,000
25,000
30,000
1977 1979 1982 1990 1991 1994 1996
Car
s P
er D
ay
Capacity of a 4-Lane Road: 63,600 vpd
2025 Estimate: 18,400 vpd
2002 Estimate: 19,000 vpd
Source: Tri-County Regional Planning Commission and City of East Lansing
2025 Projections
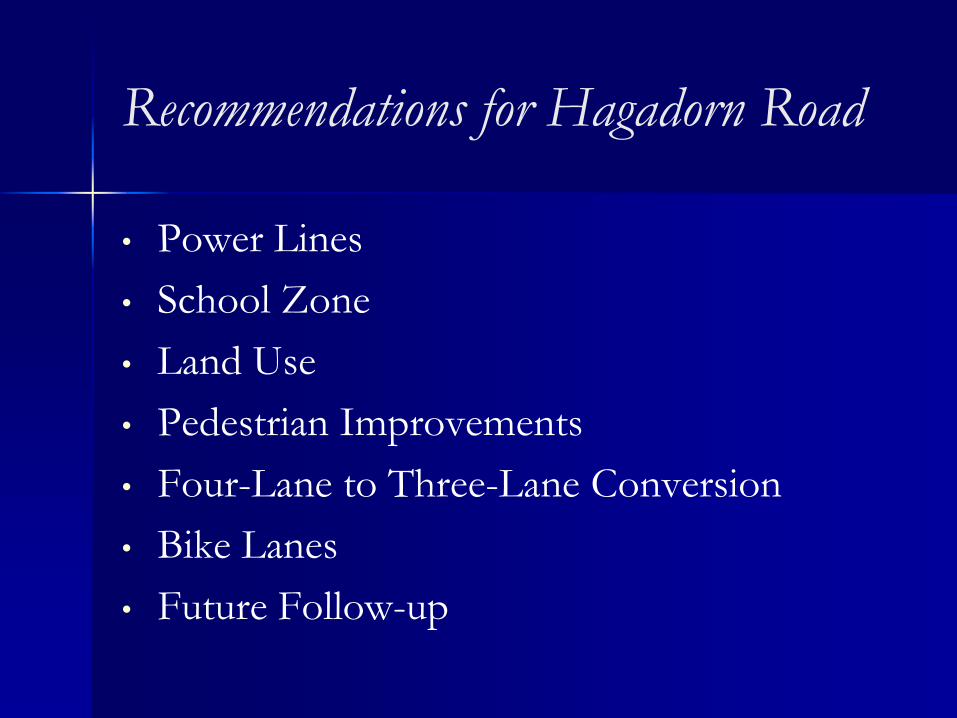
Recommendations for Hagadorn Road
• Power Lines
• School Zone
• Land Use
• Pedestrian Improvements
• Four-Lane to Three-Lane Conversion
• Bike Lanes
• Future Follow-up

RecommendationFacilities Improvements
• Determine feasibility of burying power lines to improve
aesthetics of corridor

RecommendationSchool Zone
• Consistent distances from schools
• Uniform design
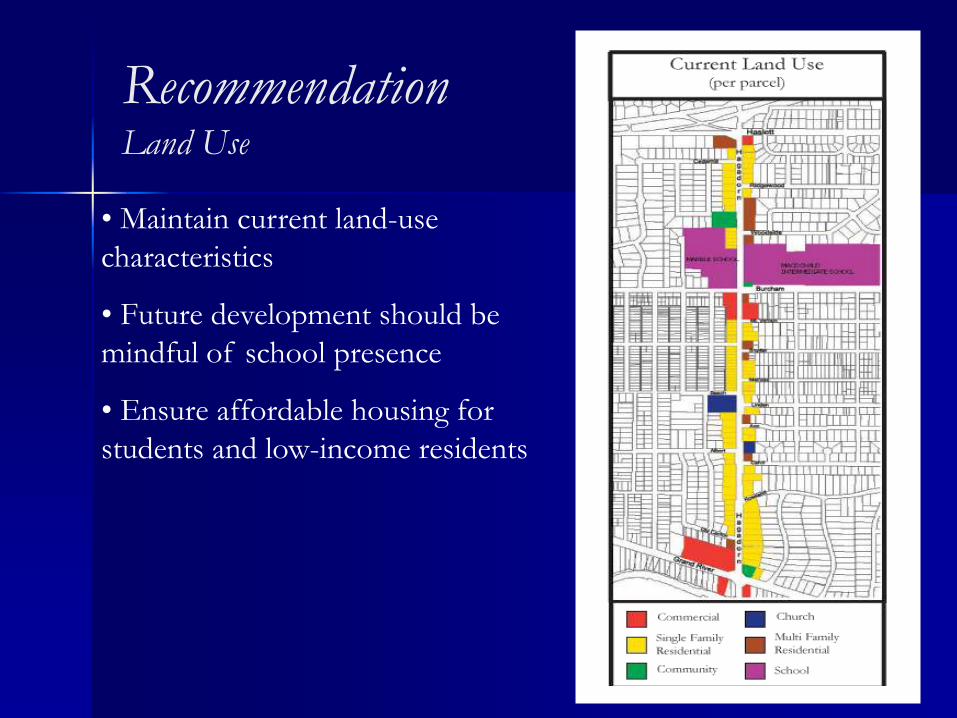
RecommendationLand Use
• Maintain current land-use
characteristics
• Future development should be
mindful of school presence
• Ensure affordable housing for
students and low-income residents

RecommendationPedestrian Improvements
• Stripe new, and restripe existing, pedestrian crosswalks at
intersections
• Add appropriate signage at new crosswalks
• Increase timing of crosswalks
• Add pedestrian oriented lighting
• Add benches and trash facilities along corridor

RecommendationFour-Lane to Three-Lane Conversion
Source: Southside Traffic Reduction Initiative for Determining our Environment and Tri-County Regional Planning Commission
Feasibility
Vehicles Per
Hour (vph)
Feasibility Hagadorn vph
(TCRPC 2025
projections)
Feasible on
Hagadorn?
≤ 1,500 vph Probable 750-800 vph Yes
• Capacity of Two-Lane Road with TWCTL: 35,604 vpd
• Current 2002 Estimate: 19,000 vpd
• Future 2025 Estimate: 18,400 vpd
RecommendationFour-Lane to Three-Lane Conversion
Benefits
• Improves vehicular, pedestrian, and bicycle safety
• Traffic calming
• Aesthetically pleasing
• Relatively inexpensive
• Improved emergency vehicle response time
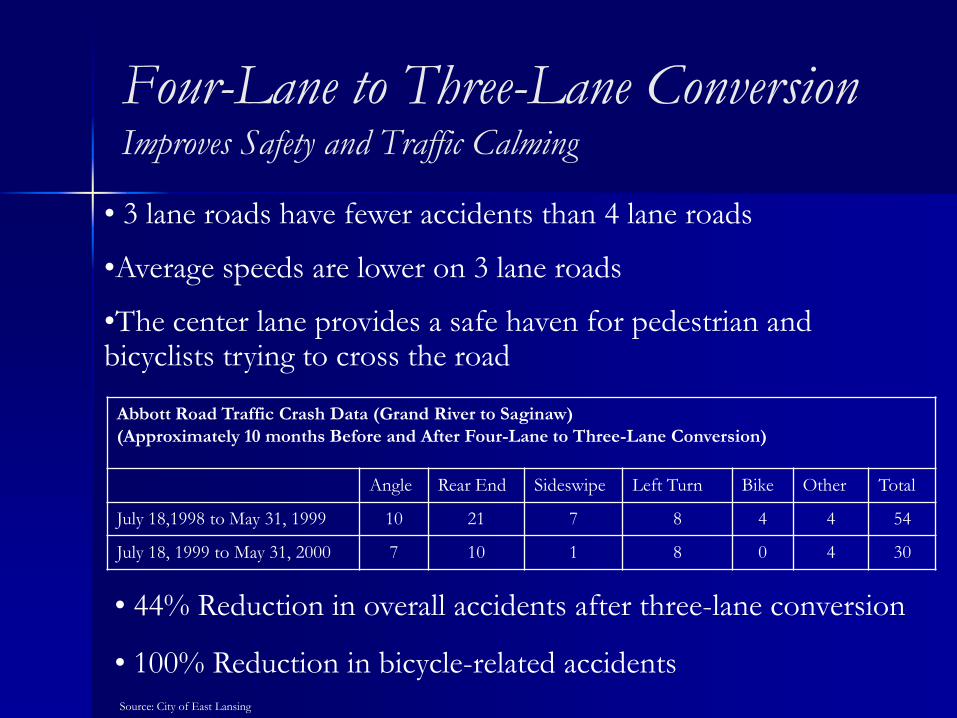
Four-Lane to Three-Lane ConversionImproves Safety and Traffic Calming
Abbott Road Traffic Crash Data (Grand River to Saginaw)
(Approximately 10 months Before and After Four-Lane to Three-Lane Conversion)
Angle Rear End Sideswipe Left Turn Bike Other Total
July 18,1998 to May 31, 1999 10 21 7 8 4 4 54
July 18, 1999 to May 31, 2000 7 10 1 8 0 4 30
Source: City of East Lansing
• 3 lane roads have fewer accidents than 4 lane roads
•Average speeds are lower on 3 lane roads
•The center lane provides a safe haven for pedestrian and bicyclists trying to cross the road
• 44% Reduction in overall accidents after three-lane conversion
• 100% Reduction in bicycle-related accidents

Four-Lane to Three-Lane ConversionAesthetically Pleasing & Relatively Inexpensive
• Change in roadway character
Pictures from the City of East Lansing
• No reconstruction needed-
just restriping of lanes
• Determine feasibility of
adding bus pull-outs

RecommendationBike Lanes
• Add one bike lane for each travel direction
• Consult the Tri-County Bicycle Association for proper design,
signage, and maintenance
• Provides buffer between pedestrians and motorists
• Provides an alternative form of transportation to automobiles
Source: Tri-County Bicycle Association
RecommendationRecommended follow-up for the City of East Lansing
• Take traffic counts every one to two years
• Continue to monitor traffic accidents
• Periodically examine the timing configuration of traffic signals
• Determine feasibility of adding bus pull-outs
• Determine feasibility of burying power lines

Conclusion
Through our recommendations we hope to
improve pedestrian friendliness, sense of place,
and implement the correct traffic control
measures to improve the quality of life for those
living along the Hagadorn corridor.

Thank You!