eastspring investments my focus fundconsumer products & services 10.16 14.91 - energy 2.63 1.62...
TRANSCRIPT
FOR THE FINANCIAL YEAR ENDED 31 DECEMBER 2019
ANNUAL REPORT
EASTSPRING INVESTMENTSMY FOCUS FUND
Eastspring Investments Berhad 200001028634 (531241-U)
Level 22, Menara Prudential, Persiaran TRX Barat55188 Tun Razak Exchange, Kuala LumpurT: (603) 2778 3888 F: (603) 2789 7220eastspring.com/my
Client ServicesT: (603) 2778 1000 [email protected]
Dear Valued Investor,
Greetings from Eastspring Investments Berhad!
First and foremost, we would like to take this opportunity to thank you for choosing to invest with Eastspring Investments Berhad.
We are pleased to enclose a copy of the Annual/Interim/Quarterly Fund Reports of Eastspring Investments Berhad’s fund(s) for the reporting period ended 31 December 2019.
You may also download these reports from our website at www.eastspring.com/my
Should you require any assistance, please do not hesitate to contact our Client Services at 03-2778 1000.
Yours sincerely,
Raymond Tang Chee Kin Non-Independent, Executive Director and Chief Executive Officer
TABLE OF CONTENTS
Fund Information 1
Key Performance Data 3
Manager’s Report 6
Market Review 9
Rebates and Soft Commissions 10
Statement by the Manager 12
Trustee’s Report to the Unit Holders of
Eastspring Investments MY Focus Fund 13
Independent Auditors’ Report to the Unit Holders of
Eastspring Investments My Focus Fund 14
Statement of Comprehensive Income 18
Statement of Financial Position 19
Statement of Changes in Equity 20
Statement of Cash Flows 21
Summary of Significant Accounting Policies 22
Notes to the Financial Statements 30
Corporate Directory 55
FUND INFORMATION
Name of Fund Eastspring Investments MY Focus Fund (the “Fund“)
Fund Category/ Type
Equity/growth
Fund Objective The Fund seeks to provide investors with capital appreciation in the medium to long-term with an opportunity for income*if any.
Note: The Fund’s focus is on growth.
ANY MATERIAL CHANGES TO THE FUND’S OBJECTIVE WOULD REQUIRE UNIT HOLDERS’ APPROVAL.
* Income distributed to a Unit Holder will be reinvested into additional Units unless Unit Holder opts for the distribution to be paid out.
Performance Benchmark
The performance benchmark of the Fund is FTSE Bursa Malaysia KLCI Index (“FBMKLCI”).
Source: www.bursamalaysia.com
Note: The risk profile of the Fund is different from the risk profile of the performance benchmark.
Fund Income Distribution Policy
Incidental
1Client Services : 03-2778 1000
Annual Report
FUND INFORMATION (CONTINUED)
Breakdown of Unit Holdings by Size
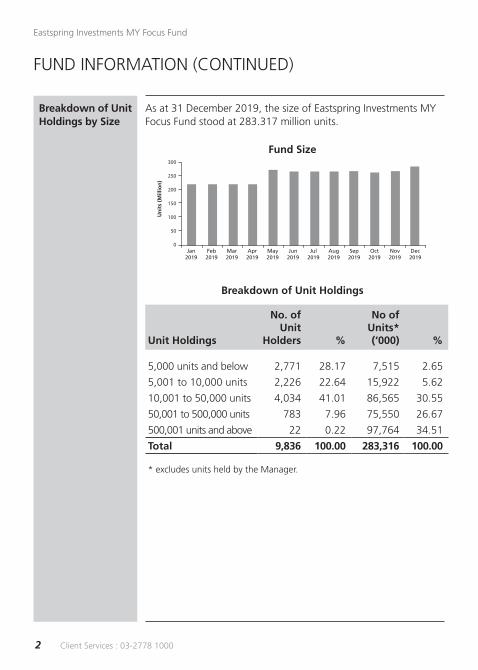
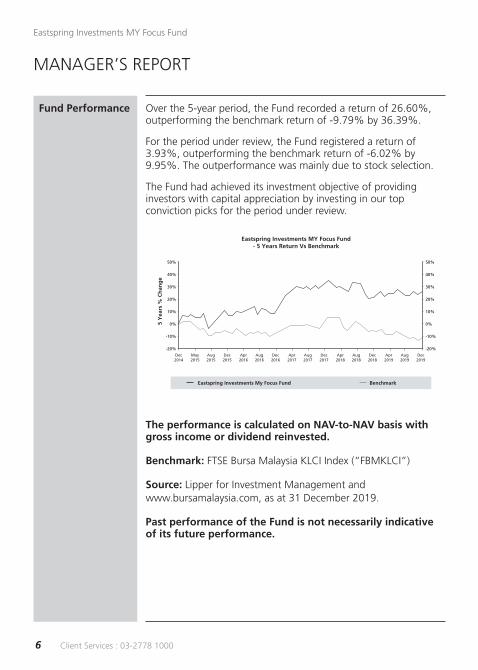
As at 31 December 2019, the size of Eastspring Investments MY Focus Fund stood at 283.317 million units.
Fund Size
Breakdown of Unit Holdings
Unit Holdings
No. of Unit
Holders %
No of Units* (‘000) %
5,000 units and below 2,771 28.17 7,515 2.65
5,001 to 10,000 units 2,226 22.64 15,922 5.62
10,001 to 50,000 units 4,034 41.01 86,565 30.55
50,001 to 500,000 units 783 7.96 75,550 26.67
500,001 units and above 22 0.22 97,764 34.51
Total 9,836 100.00 283,316 100.00
* excludes units held by the Manager.
Un
its
(Mill
ion
)
Jan2019
Feb2019
Mar2019
Apr2019
May2019
Jun2019
Jul2019
Aug2019
Sep2019
Oct2019
Nov2019
Dec2019
200
250
300
150
100
50
0
Client Services : 03-2778 10002
Eastspring Investments MY Focus Fund
Category 2019 2018 2017
(%) (%) (%)
Quoted securities
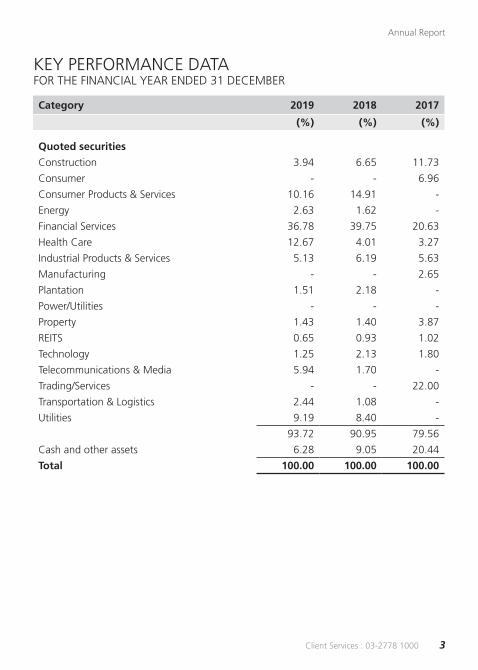
Construction 3.94 6.65 11.73
Consumer - - 6.96
Consumer Products & Services 10.16 14.91 -
Energy 2.63 1.62 -
Financial Services 36.78 39.75 20.63
Health Care 12.67 4.01 3.27
Industrial Products & Services 5.13 6.19 5.63
Manufacturing - - 2.65
Plantation 1.51 2.18 -
Power/Utilities - - -
Property 1.43 1.40 3.87
REITS 0.65 0.93 1.02
Technology 1.25 2.13 1.80
Telecommunications & Media 5.94 1.70 -
Trading/Services - - 22.00
Transportation & Logistics 2.44 1.08 -
Utilities 9.19 8.40 -
93.72 90.95 79.56
Cash and other assets 6.28 9.05 20.44
Total 100.00 100.00 100.00
KEY PERFORMANCE DATAFOR THE FINANCIAL YEAR ENDED 31 DECEMBER
3Client Services : 03-2778 1000
Annual Report
KEY PERFORMANCE DATA (CONTINUED)
Category 2019 2018 2017
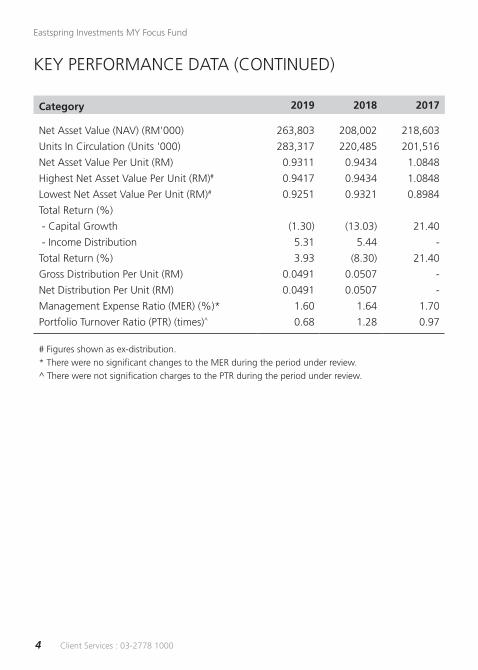
Net Asset Value (NAV) (RM'000) 263,803 208,002 218,603
Units In Circulation (Units '000) 283,317 220,485 201,516
Net Asset Value Per Unit (RM) 0.9311 0.9434 1.0848
Highest Net Asset Value Per Unit (RM)# 0.9417 0.9434 1.0848
Lowest Net Asset Value Per Unit (RM)# 0.9251 0.9321 0.8984
Total Return (%)
- Capital Growth (1.30) (13.03) 21.40
- Income Distribution 5.31 5.44 -
Total Return (%) 3.93 (8.30) 21.40
Gross Distribution Per Unit (RM) 0.0491 0.0507 -
Net Distribution Per Unit (RM) 0.0491 0.0507 -
Management Expense Ratio (MER) (%)* 1.60 1.64 1.70
Portfolio Turnover Ratio (PTR) (times)^ 0.68 1.28 0.97
# Figures shown as ex-distribution.
* There were no significant changes to the MER during the period under review.
^ There were not signification charges to the PTR during the period under review.
Client Services : 03-2778 10004
Eastspring Investments MY Focus Fund
KEY PERFORMANCE DATA (CONTINUED)
1 year1.1.2019 to31.12.2019
3 years1.1.2017 to31.12.2019
5 years1.1.2015 to31.12.2019
(%) (%) (%)
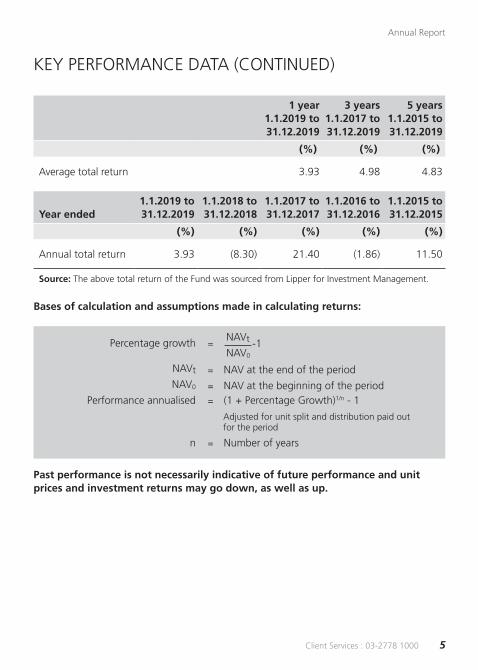
Average total return 3.93 4.98 4.83
Year ended1.1.2019 to31.12.2019
1.1.2018 to31.12.2018
1.1.2017 to31.12.2017
1.1.2016 to 31.12.2016
1.1.2015 to 31.12.2015
(%) (%) (%) (%) (%)
Annual total return 3.93 (8.30) 21.40 (1.86) 11.50
Source: The above total return of the Fund was sourced from Lipper for Investment Management.
Bases of calculation and assumptions made in calculating returns:
Percentage growth =
NAVt = NAV at the end of the period
NAV0 = NAV at the beginning of the period Performance annualised = (1 + Percentage Growth)1/n - 1
Adjusted for unit split and distribution paid out for the period
n = Number of years
Past performance is not necessarily indicative of future performance and unit prices and investment returns may go down, as well as up.
NAVt -1NAV0
5Client Services : 03-2778 1000
Annual Report
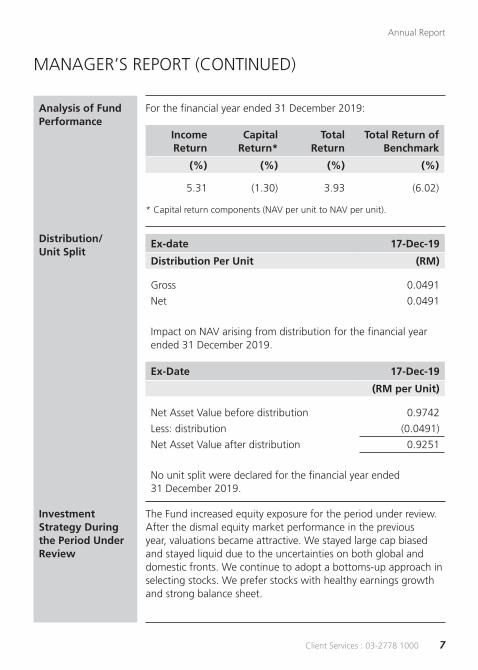
Fund Performance Over the 5-year period, the Fund recorded a return of 26.60%, outperforming the benchmark return of -9.79% by 36.39%.
For the period under review, the Fund registered a return of 3.93%, outperforming the benchmark return of -6.02% by 9.95%. The outperformance was mainly due to stock selection.
The Fund had achieved its investment objective of providing investors with capital appreciation by investing in our top conviction picks for the period under review.
The performance is calculated on NAV-to-NAV basis withgross income or dividend reinvested.
Benchmark: FTSE Bursa Malaysia KLCI Index (“FBMKLCI”)
Source: Lipper for Investment Management andwww.bursamalaysia.com, as at 31 December 2019.
Past performance of the Fund is not necessarily indicativeof its future performance.
MANAGER’S REPORT
Eastspring Investments My Focus Fund Benchmark
Eastspring Investments MY Focus Fund- 5 Years Return Vs Benchmark
5 Y
ears
% C
han
ge
50%
40%
30%
20%
10%
0%
-10%
-20%
50%
40%
30%
20%
10%
0%
-10%
-20%
Dec2014
May2015
Aug2015
Dec2015
Apr2016
Aug2016
Dec2016
Apr2017
Aug2017
Dec2017
Apr2018
Aug2018
Dec2018
Apr2019
Aug2019
Dec2019
Client Services : 03-2778 10006
Eastspring Investments MY Focus Fund
MANAGER’S REPORT (CONTINUED)
Analysis of Fund Performance
For the financial year ended 31 December 2019:
Income Return
Capital Return*
Total Return
Total Return of Benchmark
(%) (%) (%) (%)
5.31 (1.30) 3.93 (6.02)
* Capital return components (NAV per unit to NAV per unit).
Distribution/ Unit Split
Investment Strategy During the Period Under Review
The Fund increased equity exposure for the period under review. After the dismal equity market performance in the previous year, valuations became attractive. We stayed large cap biased and stayed liquid due to the uncertainties on both global and domestic fronts. We continue to adopt a bottoms-up approach in selecting stocks. We prefer stocks with healthy earnings growth and strong balance sheet.
Ex-date 17-Dec-19
Distribution Per Unit (RM)
Gross 0.0491
Net 0.0491
Impact on NAV arising from distribution for the financial year ended 31 December 2019.
Ex-Date 17-Dec-19
(RM per Unit)
Net Asset Value before distribution 0.9742
Less: distribution (0.0491)
Net Asset Value after distribution 0.9251
No unit split were declared for the financial year ended 31 December 2019.
7Client Services : 03-2778 1000
Annual Report
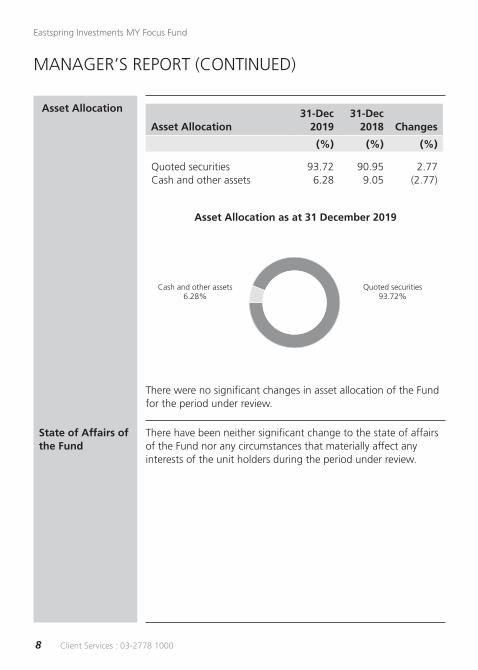
Asset Allocation
Asset Allocation31-Dec
201931-Dec
2018 Changes
(%) (%) (%)
Quoted securities 93.72 90.95 2.77 Cash and other assets 6.28 9.05 (2.77)
Asset Allocation as at 31 December 2019
There were no significant changes in asset allocation of the Fund for the period under review.
State of Affairs ofthe Fund
There have been neither significant change to the state of affairs of the Fund nor any circumstances that materially affect any interests of the unit holders during the period under review.
MANAGER’S REPORT (CONTINUED)
Quoted securities 93.72%
Cash and other assets 6.28%
Client Services : 03-2778 10008
Eastspring Investments MY Focus Fund
MARKET REVIEW
For the 1Q2019, the FBM KLCI bucked the regional up-trend and was one of the worst performing indices in emerging market. The regional uplift in sentiment was due to the dramatic shift in US Federal Reserve policy to a more dovish stance and improving rhetoric from the US-China trade talks. In addition, China’s fresh stimulus measures helped sustain the positive sentiment. On the local front, investors were disappointed with Malaysian corporates as reported results were once again disappointing. 2018 was the fourth year of sub-par earnings growth. Towards the end of the 1Q2019, big cap stocks corrected post the Invest Malaysia event held on 19-20 March, amidst the risk to earnings for banks due to a possible rate cut, slower corporate earnings growth prospects and policy uncertainty.
The start of 2Q2019 saw regional markets rally on the back of positive US-China trade talks prospects and improved global outlook. However, this quickly turned sour by the month of May following the abrupt end of negotiations to the US-China trade deal with the US raising tariffs on imports from China to 25% on USD200bn of goods effective 10th May 2019. This was followed by steps to stifle China’s technology sector with what was effectively a ban on American firms from supplying parts to Chinese telecommunications giant Huawei Technologies. China retaliated with higher tariffs of up to 25% on US60bn of US goods effective 1 June 2019, with the Chinese leadership hinting at further retaliatory measures against the US. Regional markets rebounded in the month of June, with news of US and China restarting their trade talks post the G20 meeting held in Japan at the end of the month. Contrary to regional markets, the Malaysian equity market struggled to perform early 2Q2019, dampened by news of the potential exclusion of Malaysia from the FTSE Russel’s World Government Bond Index (“WBGI”) after their review come September, weaker Malaysian Ringgit, cut in the OPR of 25bps, and corporate results reporting that was not very inspiring.
The first two months of 3Q2019 saw regional markets correct largely due to an escalation in the trade war and fear of increasing recession risks sparked by the further collapse in global bond yields. President Trump announced an additional 10% tariff on a further USD300bn in Chinese imports starting 1 September 2019, followed by the US designating China as a “currency manipulator”. By the end of 3Q2019, global and regional equity markets reversed some of the losses amid renewed optimism as US and China return to the negotiation tables again. However, markets lost some momentum later in the month following a drone attack on Saudi’s oil facilities and an impeachment inquiry launched against the US President Trump. The Malaysian equity market remained weak in light of the external headwinds faced. Domestically, the Malaysian ringgit depreciated by about 1.34% for the 3Q2019, given its correlation with the China’s CNY which depreciated 4.1% against the USD. Brent crude oil prices declined by 8.67% for the 3Q2019 on concerns of slowing global growth and demand. The June 2019 results season reported was uninspiring yet again with more downgrades in earnings by consensus. Investor
9Client Services : 03-2778 1000
Annual Report
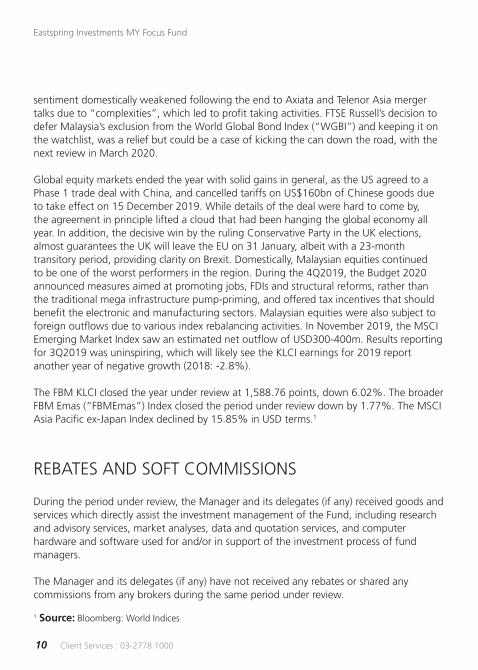
sentiment domestically weakened following the end to Axiata and Telenor Asia merger talks due to “complexities”, which led to profit taking activities. FTSE Russell’s decision to defer Malaysia’s exclusion from the World Global Bond Index (“WGBI”) and keeping it on the watchlist, was a relief but could be a case of kicking the can down the road, with the next review in March 2020.
Global equity markets ended the year with solid gains in general, as the US agreed to a Phase 1 trade deal with China, and cancelled tariffs on US$160bn of Chinese goods due to take effect on 15 December 2019. While details of the deal were hard to come by, the agreement in principle lifted a cloud that had been hanging the global economy all year. In addition, the decisive win by the ruling Conservative Party in the UK elections, almost guarantees the UK will leave the EU on 31 January, albeit with a 23-month transitory period, providing clarity on Brexit. Domestically, Malaysian equities continued to be one of the worst performers in the region. During the 4Q2019, the Budget 2020 announced measures aimed at promoting jobs, FDIs and structural reforms, rather than the traditional mega infrastructure pump-priming, and offered tax incentives that should benefit the electronic and manufacturing sectors. Malaysian equities were also subject to foreign outflows due to various index rebalancing activities. In November 2019, the MSCI Emerging Market Index saw an estimated net outflow of USD300-400m. Results reporting for 3Q2019 was uninspiring, which will likely see the KLCI earnings for 2019 report another year of negative growth (2018: -2.8%).
The FBM KLCI closed the year under review at 1,588.76 points, down 6.02%. The broader FBM Emas (“FBMEmas”) Index closed the period under review down by 1.77%. The MSCI Asia Pacific ex-Japan Index declined by 15.85% in USD terms.1
REBATES AND SOFT COMMISSIONS
During the period under review, the Manager and its delegates (if any) received goods and services which directly assist the investment management of the Fund, including research and advisory services, market analyses, data and quotation services, and computer hardware and software used for and/or in support of the investment process of fund managers. The Manager and its delegates (if any) have not received any rebates or shared any commissions from any brokers during the same period under review.
1 Source: Bloomberg: World Indices
Client Services : 03-2778 100010
Eastspring Investments MY Focus Fund
EASTSPRING INVESTMENTS MY FOCUS FUNDFINANCIAL STATEMENTSFOR THE FINANCIAL YEAR ENDED 31 DECEMBER 2019
11Client Services : 03-2778 1000
Annual Report
STATEMENT BY THE MANAGER
We, Tang Chee Kin and Iskander Bin Ismail Mohamed Ali, being two of the Directors of Eastspring Investments Berhad, do hereby state that, in the opinion of the Manager, the accompanying financial statements set out on pages 18 to 54 are drawn up in accordance with the provisions of the Deed and give a true and fair view of the financial position of the Fund as at 31 December 2019 and of its financial performance, changes in equity and cash flows for the financial year ended on that date in accordance with the Malaysian Financial Reporting Standards and International Financial Reporting Standards.
For and on behalf of the Manager,EASTSPRING INVESTMENTS BERHAD
TANG CHEE KINExecutive Director/Chief Executive Officer
ISKANDER BIN ISMAIL MOHAMED ALI Independent, Non-Executive Director
Kuala LumpurDate: 17 February 2020
Client Services : 03-2778 100012
Eastspring Investments MY Focus Fund
TRUSTEE’S REPORT TO THE UNIT HOLDERS OF EASTSPRING INVESTMENTS MY FOCUS FUND
We have acted as Trustee for Eastspring Investments MY Focus Fund (the “Fund”) for financial year ended 31 December 2019. To the best of our knowledge, for the financial year under review, Eastspring Investments Berhad (the “Manager”) has operated and managed the Fund in accordance with the followings:-
a. limitations imposed on the investment powers of the Manager under the Deed(s), the Securities Commission’s Guidelines on Unit Trust Funds, the Capital Markets and Services Act 2007 and other applicable laws;
b. valuation and pricing for the Fund is carried out in accordance with the Deed(s) of the Fund and any regulatory requirements; and
c. creation and cancellation of units for the Fund are carried out in accordance with the Deed(s) of the Fund and any regulatory requirements.
We are of the view that the distribution made during this financial year ended 31 December 2019 by the Manager is not inconsistent with the objectives of the Fund.
For Deutsche Trustees Malaysia Berhad
Ng Hon Leong Richard Lim Hock SengHead, Trustee Operations Chief Executive Officer
Kuala LumpurDate: 17 February 2020
13Client Services : 03-2778 1000
Annual Report
INDEPENDENT AUDITORS’ REPORT TO THE UNIT HOLDERS OF EASTSPRING INVESTMENTS MY FOCUS FUND
REPORT ON THE AUDIT OF THE FINANCIAL STATEMENTS
Our opinion
In our opinion, the financial statements of Eastspring Investments MY Focus Fund (“the Fund”) give a true and fair view of the financial position of the Fund as at 31 December 2019, and of its financial performance and its cash flows for the financial year then ended in accordance with Malaysian Financial Reporting Standards and International Financial Reporting Standards.
What we have audited
We have audited the financial statements of the Fund, which comprise the statement of financial position as at 31 December 2019, and the statement of comprehensive income, statement of changes in equity and statement of cash flows for the financial year then ended, and notes to the financial statements, including a summary of significant accounting policies, as set out on pages 18 to 54.
Basis for opinion
We conducted our audit in accordance with approved standards on auditing in Malaysia and International Standards on Auditing. Our responsibilities under those standards are further described in the “Auditors’ responsibilities for the audit of the financial statements” section of our report.
We believe that the audit evidence we have obtained is sufficient and appropriate to provide a basis for our opinion.
Client Services : 03-2778 100014
Eastspring Investments MY Focus Fund
Independence and other ethical responsibilities
We are independent of the Fund in accordance with the By-Laws (on Professional Ethics, Conduct and Practice) of the Malaysian Institute of Accountants (“By-Laws”) and the International Ethics Standards Board for Accountants’ Code of Ethics for Professional Accountants (“IESBA Code”), and we have fulfilled our other ethical responsibilities in accordance with the By-Laws and the IESBA Code.
Information other than the financial statements and auditors’ report thereon
The Manager of the Fund is responsible for the other information. The other information comprises Manager’s Report but does not include the financial statements of the Fund and our auditors’ report thereon.
Our opinion on the financial statements of the Fund does not cover the other information and we do not express any form of assurance conclusion thereon.
In connection with our audit of the financial statements of the Fund, our responsibility is to read the other information and, in doing so, consider whether the other information is materially inconsistent with the financial statements of the Fund or our knowledge obtained in the audit or otherwise appears to be materially misstated.
If, based on the work we have performed, we conclude that there is a material misstatement of this other information, we are required to report that fact. We have nothing to report in this regard.
Responsibilities of the Manager for the financial statements
The Manager of the Fund is responsible for the preparation of the financial statements of the Fund that give a true and fair view in accordance with Malaysian Financial Reporting Standards and International Financial Reporting Standards. The Manager is also responsible for such internal control as the Manager determine is necessary to enable the preparation of financial statements of the Fund that are free from material misstatement, whether due to fraud or error.
15Client Services : 03-2778 1000
Annual Report
In preparing the financial statements of the Fund, the Manager is responsible for assessing the Fund’s ability to continue as a going concern, disclosing, as applicable, matters related to going concern and using the going concern basis of accounting unless the Manager either intend to liquidate the Fund or have no realistic alternative but to do so. Auditors’ responsibilities for the audit of the financial statements
Our objectives are to obtain reasonable assurance about whether the financial statements of the Fund as a whole are free from material misstatement, whether due to fraud or error, and to issue an auditors’ report that includes our opinion. Reasonable assurance is a high level of assurance, but is not a guarantee that an audit conducted in accordance with approved standards on auditing in Malaysia and International Standards on Auditing will always detect a material misstatement when it exists. Misstatements can arise from fraud or error and are considered material if, individually or in the aggregate, they could reasonably be expected to influence the economic decisions of users taken on the basis of these financial statements.
As part of an audit in accordance with approved standards on auditing in Malaysia and International Standards on Auditing, we exercise professional judgement and maintain professional scepticism throughout the audit. We also:
a. Identify and assess the risks of material misstatement of the financial statements of the Fund, whether due to fraud or error, design and perform audit procedures responsive to those risks, and obtain audit evidence that is sufficient and appropriate to provide a basis for our opinion. The risk of not detecting a material misstatement resulting from fraud is higher than for one resulting from error, as fraud may involve collusion, forgery, intentional omissions, misrepresentations, or the override of internal control.
b. Obtain an understanding of internal control relevant to the audit in order to design audit procedures that are appropriate in the circumstances, but not for the purpose of expressing an opinion on the effectiveness of the Fund’s internal control.
c. Evaluate the appropriateness of accounting policies used and the reasonableness of accounting estimates and related disclosures made by the Manager.
Client Services : 03-2778 100016
Eastspring Investments MY Focus Fund
d. Conclude on the appropriateness of the Manager’s use of the going concern basis of accounting and, based on the audit evidence obtained, whether a material uncertainty exists related to events or conditions that may cast significant doubt on the Fund’s ability to continue as a going concern. If we conclude that a material uncertainty exists, we are required to draw attention in our auditors’ report to the related disclosures in the financial statements of the Fund or, if such disclosures are inadequate, to modify our opinion. Our conclusions are based on the audit evidence obtained up to the date of our auditors’ report. However, future events or conditions may cause the Fund to cease to continue as a going concern.
e. Evaluate the overall presentation, structure and content of the financial statements of the Fund, including the disclosures, and whether the financial statements represent the underlying transactions and events in a manner that achieves fair presentation.
We communicate with the Manager regarding, among other matters, the planned scope and timing of the audit and significant audit findings, including any significant deficiencies in internal control that we identify during our audit.
OTHER MATTERS
This report is made solely to the unit holders of the Fund and for no other purpose. We do not assume responsibility to any other person for the content of this report.
PRICEWATERHOUSECOOPERS PLT LLP0014401-LCA & AF 1146 Chartered Accountants
Kuala LumpurDate: 17 February 2020
17Client Services : 03-2778 1000
Annual Report
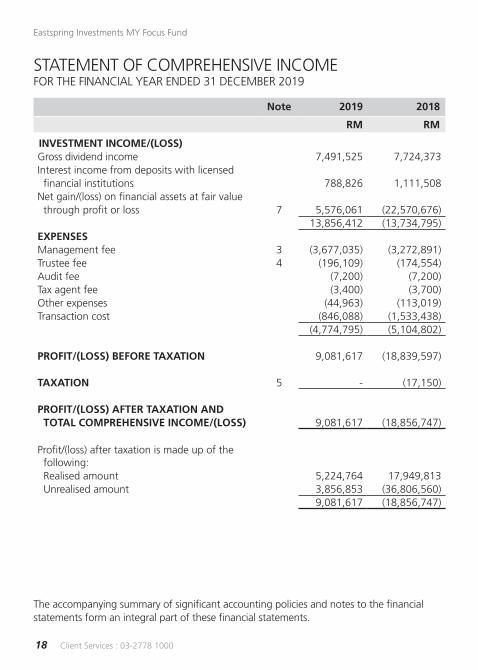
STATEMENT OF COMPREHENSIVE INCOME FOR THE FINANCIAL YEAR ENDED 31 DECEMBER 2019
Note 2019 2018
RM RM
INVESTMENT INCOME/(LOSS)Gross dividend income 7,491,525 7,724,373Interest income from deposits with licensed financial institutions 788,826 1,111,508Net gain/(loss) on financial assets at fair value through profit or loss 7 5,576,061 (22,570,676)
13,856,412 (13,734,795)EXPENSESManagement fee 3 (3,677,035) (3,272,891)Trustee fee 4 (196,109) (174,554)Audit fee (7,200) (7,200)Tax agent fee (3,400) (3,700)Other expenses (44,963) (113,019)Transaction cost (846,088) (1,533,438)
(4,774,795) (5,104,802)
PROFIT/(LOSS) BEFORE TAXATION 9,081,617 (18,839,597)
TAXATION 5 - (17,150)
PROFIT/(LOSS) AFTER TAXATION AND TOTAL COMPREHENSIVE INCOME/(LOSS) 9,081,617 (18,856,747)
Profit/(loss) after taxation is made up of the following: Realised amount 5,224,764 17,949,813 Unrealised amount 3,856,853 (36,806,560)
9,081,617 (18,856,747)
The accompanying summary of significant accounting policies and notes to the financial statements form an integral part of these financial statements.
Client Services : 03-2778 100018
Eastspring Investments MY Focus Fund
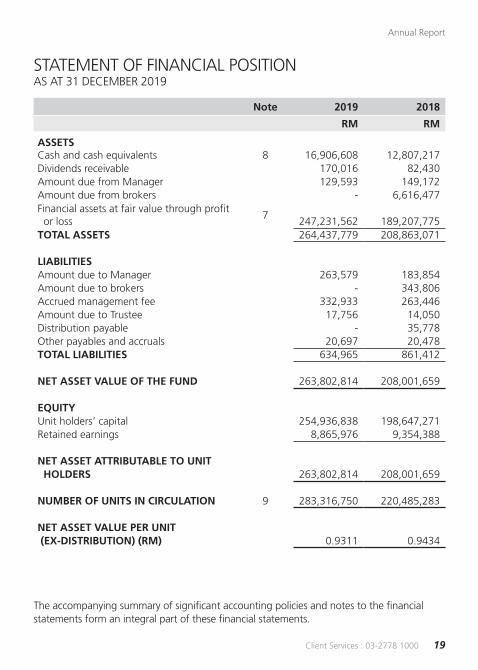
STATEMENT OF FINANCIAL POSITION AS AT 31 DECEMBER 2019
Note 2019 2018
RM RM
ASSETSCash and cash equivalents 8 16,906,608 12,807,217Dividends receivable 170,016 82,430Amount due from Manager 129,593 149,172Amount due from brokers - 6,616,477Financial assets at fair value through profit or loss
7247,231,562 189,207,775
TOTAL ASSETS 264,437,779 208,863,071
LIABILITIESAmount due to Manager 263,579 183,854Amount due to brokers - 343,806Accrued management fee 332,933 263,446Amount due to Trustee 17,756 14,050Distribution payable - 35,778Other payables and accruals 20,697 20,478TOTAL LIABILITIES 634,965 861,412
NET ASSET VALUE OF THE FUND 263,802,814 208,001,659
EQUITYUnit holders’ capital 254,936,838 198,647,271Retained earnings 8,865,976 9,354,388
NET ASSET ATTRIBUTABLE TO UNIT HOLDERS 263,802,814 208,001,659
NUMBER OF UNITS IN CIRCULATION 9 283,316,750 220,485,283
NET ASSET VALUE PER UNIT (EX-DISTRIBUTION) (RM) 0.9311 0.9434
The accompanying summary of significant accounting policies and notes to the financial statements form an integral part of these financial statements.
19Client Services : 03-2778 1000
Annual Report
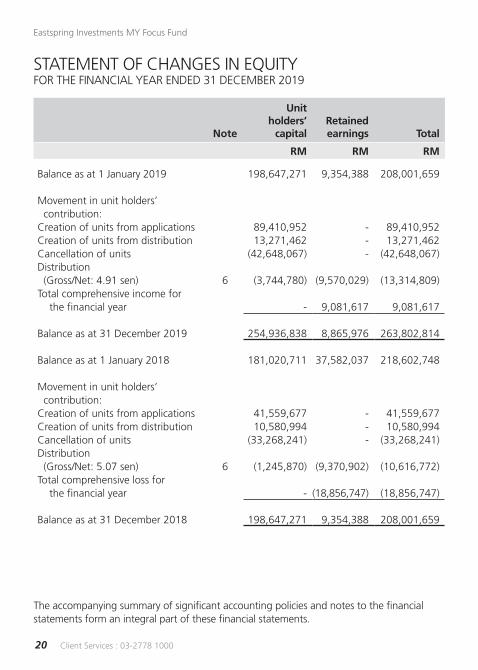
STATEMENT OF CHANGES IN EQUITYFOR THE FINANCIAL YEAR ENDED 31 DECEMBER 2019
Note
Unitholders’
capitalRetained earnings
Total
RM RM RM
Balance as at 1 January 2019 198,647,271 9,354,388 208,001,659
Movement in unit holders’ contribution:Creation of units from applications 89,410,952 - 89,410,952Creation of units from distribution 13,271,462 - 13,271,462Cancellation of units (42,648,067) - (42,648,067)Distribution (Gross/Net: 4.91 sen) 6 (3,744,780) (9,570,029) (13,314,809)Total comprehensive income for the financial year - 9,081,617 9,081,617
Balance as at 31 December 2019 254,936,838 8,865,976 263,802,814
Balance as at 1 January 2018 181,020,711 37,582,037 218,602,748
Movement in unit holders’ contribution:Creation of units from applications 41,559,677 - 41,559,677Creation of units from distribution 10,580,994 - 10,580,994Cancellation of units (33,268,241) - (33,268,241)Distribution (Gross/Net: 5.07 sen) 6 (1,245,870) (9,370,902) (10,616,772)Total comprehensive loss for the financial year - (18,856,747) (18,856,747)
Balance as at 31 December 2018 198,647,271 9,354,388 208,001,659
The accompanying summary of significant accounting policies and notes to the financial statements form an integral part of these financial statements.
Client Services : 03-2778 100020
Eastspring Investments MY Focus Fund
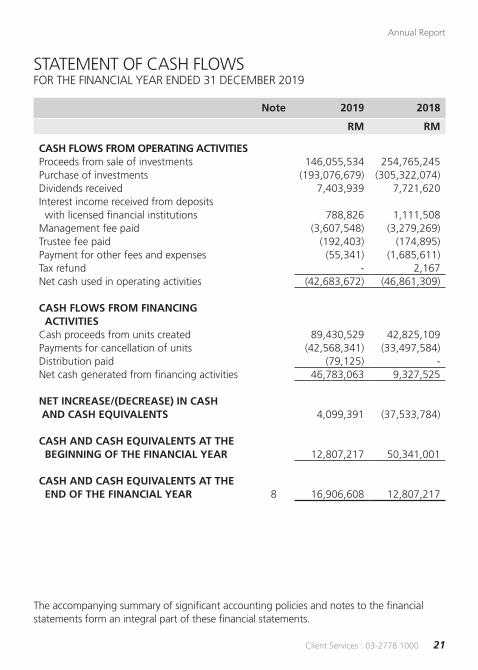
STATEMENT OF CASH FLOWSFOR THE FINANCIAL YEAR ENDED 31 DECEMBER 2019
Note 2019 2018
RM RM
CASH FLOWS FROM OPERATING ACTIVITIESProceeds from sale of investments 146,055,534 254,765,245Purchase of investments (193,076,679) (305,322,074)Dividends received 7,403,939 7,721,620Interest income received from deposits with licensed financial institutions 788,826 1,111,508Management fee paid (3,607,548) (3,279,269)Trustee fee paid (192,403) (174,895)Payment for other fees and expenses (55,341) (1,685,611)Tax refund - 2,167Net cash used in operating activities (42,683,672) (46,861,309)
CASH FLOWS FROM FINANCING ACTIVITIESCash proceeds from units created 89,430,529 42,825,109Payments for cancellation of units (42,568,341) (33,497,584)Distribution paid (79,125) -Net cash generated from financing activities 46,783,063 9,327,525
NET INCREASE/(DECREASE) IN CASH AND CASH EQUIVALENTS 4,099,391 (37,533,784)
CASH AND CASH EQUIVALENTS AT THE BEGINNING OF THE FINANCIAL YEAR 12,807,217 50,341,001
CASH AND CASH EQUIVALENTS AT THE END OF THE FINANCIAL YEAR 8 16,906,608 12,807,217
The accompanying summary of significant accounting policies and notes to the financial statements form an integral part of these financial statements.
21Client Services : 03-2778 1000
Annual Report
Client Services : 03-2778 100022
Eastspring Investments MY Focus Fund
The following accounting policies have been used in dealing with items which are considered material in relation to the financial statements.
A. BASIS OF PREPARATION OF THE FINANCIAL STATEMENTS
The financial statements have been prepared in accordance with the Malaysian Financial Reporting Standards (“MFRS”) and International Financial Reporting Standards (“IFRS”), under the historical cost convention, as modified by financial assets at fair value through profit or loss.
The preparation of financial statements in conformity with the MFRS and IFRS require the use of certain critical accounting estimates and assumptions that affect the reported amounts of assets and liabilities and disclosure of contingent assets and liabilities at the date of the financial statements, and the reported amounts of revenues and expenses during the reported financial year. It also requires the Manager to exercise their judgment in the process of applying the Fund’s accounting policies. Although these estimates and judgment are based on the Manager’s best knowledge of current events and actions, actual results may differ.
The areas involving a higher degree of judgment or complexity, or areas where assumptions and estimates are significant to the financial statements are disclosed in Note K.
a. Standards, amendments to published standards and interpretations that are effective:
The Fund has applied the following amendments for the first time for the financial year beginning on 1 January 2019:
• Amendments to MFRS 112 ‘Income Taxes’ (effective from 1 January 2019) clarify that where income tax consequences of dividends on financial instruments classified as equity is recognised (either in profit or loss, other comprehensive income or equity) depends on where the past transactions that generated distributable profits were recognised.
Accordingly, the tax consequences are recognised in profit or loss when an entity determines payments on such instruments are distribution of profits (that is, dividends). Tax on dividend should not be recognised in equity merely on the basis that it is related to a distribution to owners.
This standard is not expected to have a significant impact on the Fund’s financial statements.
SUMMARY OF SIGNIFICANT ACCOUNTING POLICIESFOR THE FINANCIAL YEAR ENDED 31 DECEMBER 2019
23Client Services : 03-2778 1000
Annual Report
b. Standards, amendments that have been issued but not yet effective:
Amendments to the definition of material (Amendments to MFRS 101 and MFRS 108) effective 1 January 2020
The amendments clarify the definition of materiality and use a consistent definition throughout MFRSs and the Conceptual Framework for Financial Reporting.
The definition of ‘material’ has been revised as “Information is material if omitting, misstating or obscuring it could reasonably be expected to influence decisions that the primary users of general purpose financial statements make on the basis of those financial statements, which provide financial information about a specific reporting entity.”
The amendments also:
• clarify that an entity assess materiality in the context of the financial statements as a whole.
• explain the concept of obscuring information in the new definition. Information is obscured if it have the effect similar as omitting or misstating of that information. For example, material transaction is scattered throughout the financial statements, dissimilar items are inappropriately aggregated, or material information is hidden by immaterial information.
• clarify the meaning of ‘primary users of general purpose financial statements’ to whom those financial statements are directed, by defining them as ‘existing and potential investors, lenders and other creditors’ that must rely on general purpose financial statements for much of the financial information they need.
The amendments shall be applied prospectively.
Client Services : 03-2778 100024
Eastspring Investments MY Focus Fund
B. INCOME RECOGNITION
Interest income earned from short-term deposits with licensed financial institutions is recognised on an accrual basis using the effective interest rate method.
Dividend income is recognised on the ex-dividend date, when the right to receive the dividend has been established.
Realised gain or loss on sale of investments is accounted for as the difference between the net disposal proceeds and the carrying amount of the investments, determined on a weighted average cost basis.
C. TAXATION
Current tax expense is determined according to the Malaysian tax laws at the current rate based upon the taxable income earned during the financial year.
D. FUNCTIONAL AND PRESENTATION CURRENCY
Items included in the financial statements of the Fund are measured using the currency of the primary economic environment in which the Fund operates (the “functional currency”). The financial statements are presented in Ringgit Malaysia (“RM”), which is the Fund’s functional and presentation currency.
E. FINANCIAL ASSETS AND FINANCIAL LIABILITIES
i. Classification
The Fund classify its financial assets in the following measurement categories:
• those to be measured subsequently at fair value (either through other comprehensive income (“OCI”) or through profit or loss), and
• those to be measured at amortised cost
The Fund classifies its investments based on both the Fund’s business model for managing those financial assets and the contractual cash flow characteristics of the financial assets. The portfolio of financial assets is managed and performance is evaluated on a fair value basis. The Fund is primarily focused on fair value
25Client Services : 03-2778 1000
Annual Report
information and uses that information to assess the assets’ performance and to make decisions. The Fund has not taken the option to irrevocably designate any equity securities as fair value through other comprehensive income. Consequently, all investments are measured at fair value through profit or loss.
The Fund classifies cash and cash equivalents, dividends receivable and amount due from Manager as financial assets at amortised cost as these financial assets are held to collect contractual cash flows consisting of the amount outstanding.
The Fund classifies accrued management fee, amount due to Manager, amount due to Trustee and other payables and accruals as financial liabilities measured at amortised cost.
ii. Recognition and measurement
Regular purchases and sales of financial assets are recognised on the trade date, the date on which the Fund commits to purchase or sell the asset. Investments are initially recognised at fair value and transaction costs are expensed in the statement of comprehensive income.
Financial assets are derecognised when the rights to receive cash flows from the investments have expired or have been transferred and the Fund has transferred substantially all risks and rewards of ownership.
Financial liabilities, are recognised in the statement of financial position when, and only when, the Fund becomes a party to the contractual provisions of the financial instrument.
Financial liabilities are derecognised when it is extinguished, i.e. when the obligation specified in the contract is discharged or cancelled or expired.
Gains or losses arising from changes in the fair value of the “financial assets at fair value through profit or loss” category are presented in the statement of comprehensive income within “net gain/(loss) on financial assets at fair value through profit or loss” in the financial year in which they arise. Any unrealised gains however are not distributable.
Dividend income from financial assets at fair value through profit or loss is recognised in the statement of comprehensive income as part of gross dividend income when the Fund’s right to receive payments is established.
Client Services : 03-2778 100026
Eastspring Investments MY Focus Fund
Quoted securities in Malaysia are valued at the last done market price quoted on the Bursa Malaysia Securities Berhad (“Bursa Securities”) at the date of the statement of financial position.
If a valuation based on the market price does not represent the fair value of the securities, for example during abnormal market conditions or no market price is available, including in the event of a suspension in the quotation of the securities for a period exceeding 14 days, or such shorter period as agreed by the Trustee, then the securities are valued as determined in good faith by the Manager, based on the methods or basis approved by the Trustee after appropriate technical consultation.
Deposits with licensed financial institutions are stated at cost plus accrued interest calculated on the effective interest method over the period from the date of placement to the date of maturity of the respective deposits.
Loans and receivables and other financial liabilities are subsequently carried at amortised cost using the effective interest method.
iii. Impairment for assets carried at amortised costs
The Fund measures credit risk and expected credit losses using probability of default, exposure at default and loss given default. Management considers both historical analysis and forward-looking information in determining any expected credit loss. Management consider the probability of default to be close to zero as these instruments have a low risk of default and the counterparties have a strong capacity to meet their contractual obligations in the near term. As a result, no loss allowance has been recognised based on 12 months expected credit losses as any such impairment would be wholly insignificant to the Fund.
Significant increase in credit risk
A significant increase in credit risk is defined by management as any contractual payment which is more than 30 days past due.
Definition of default and credit-impaired financial assets
Any contractual payment which is more than 90 days past due is considered credit impaired.
27Client Services : 03-2778 1000
Annual Report
Write-off
The Fund writes off financial assets, in whole or in part, when it has exhausted all practical recovery efforts and has concluded there is no reasonable expectation of recovery. The assessment of no reasonable expectation of recovery is based on unavailability of debtor’s sources of income or assets to generate sufficient future cash flows to repay the amount. The Fund may write-off financial assets that are still subject to enforcement activity. Subsequent recoveries of amounts previously written off will result in impairment gains. There are no write-offs/recoveries during the financial year.
F. AMOUNT DUE FROM/(TO) BROKERS
Amounts due from and to brokers represent receivables for securities sold and payables for securities purchased that have been contracted for but not yet settled or delivered on the statement of financial position date respectively. The amount due from brokers balance is held for collection.
These amounts are recognised initially at fair value and subsequently measured at amortised cost. At each reporting date, the Fund shall measure the loss allowance on amounts due from broker at an amount equal to the lifetime expected credit losses if the credit risk has increased significantly since initial recognition. If, at the reporting date, the credit risk has not increased significantly since initial recognition, the Fund shall measure the loss allowance at an amount equal to 12 months expected credit losses. Significant financial difficulties of the broker, probability that the broker will enter bankruptcy or financial reorganisation, and default in payments are all considered indicators that a loss allowance may be required.
If the credit risk increases to the point that it is considered to be credit impaired, interest income will be calculated based on the gross carrying amount adjusted for the loss allowance. A significant increase in credit risk is defined by management as any contractual payment which is more than 30 days past due.
Any contractual payment which is more than 90 days past due is considered credit impaired.
Client Services : 03-2778 100028
Eastspring Investments MY Focus Fund
G. CASH AND CASH EQUIVALENTS
For the purpose of the statement of cash flows, cash and cash equivalents comprise bank balance and deposits with licensed financial institutions that are readily convertible to known amounts of cash and which are subject to an insignificant risk of changes in value.
H. UNIT HOLDERS’ CAPITAL
The unit holders’ contributions to the Fund meet the criteria to be classified as equity instruments under MFRS 132 “Financial Instruments: Presentation”. Those criteria include:
• the units entitle the holder to a proportionate share of the Fund’s net assets value; • the units are the most subordinated class and class features are identical; • there is no contractual obligations to deliver cash or another financial asset other
than the obligation on the Fund to repurchase; and • the total expected cash flows from the units over its life are based substantially on
the profit or loss of the Fund.
The outstanding units are carried at the redemption amount that is payable at each financial year if unit holder exercises the right to put the unit back to the Fund.
Units are created and cancelled at prices based on the Fund’s net asset value per unit at the time of creation or cancellation. The Fund’s net asset value per unit is calculated by dividing the net assets attributable to unit holders with the total number of outstanding units.
I. TRANSACTION COSTS
Transaction costs are costs incurred to acquire financial assets or liabilities at fair value through profit or loss. They include the bid-ask spread, fees and commissions paid to agents, advisors, brokers and dealers. Transaction costs, when incurred, are immediately recognised in the statement of comprehensive income as expenses.
29Client Services : 03-2778 1000
Annual Report
J. DISTRIBUTION
A distribution to the Fund’s unit holders is accounted for as a deduction from realised reserves. A proposed distribution is recognised as a liability in the financial year in which it is approved by the Trustee.
K. CRITICAL ACCOUNTING ESTIMATES AND JUDGMENTS IN APPLYING ACCOUNTING POLICIES
The Fund makes estimates and assumptions concerning the future. The resulting accounting estimates will, by definition, rarely equal the related actual results. To enhance the information contents on the estimates, certain key variables that are anticipated to have material impact to the Fund’s results and financial position are tested for sensitivity to changes in the underlying parameters.
Estimates and judgments are continually evaluated by the Manager and the Trustee are based on historical experience and other factors, including expectations of future events that are believed to be reasonable under the circumstances.
In undertaking any of the Fund’s investment, the Manager will ensure that all assets of the Fund under management will be valued appropriately, that is at fair value and in compliance with the SC’s Guidelines on Unit Trust Funds.
Client Services : 03-2778 100030
Eastspring Investments MY Focus Fund
1. INFORMATION ON THE FUND
Eastspring Investments MY Focus Fund (the “Fund”) was constituted pursuant to the execution of a Deed dated 25 November 2008 (the “Deed”), as amended by Supplemental Deed dated 11 May 2009 entered into between Eastspring Investments Berhad (the “Manager”) and OSK Trustees Berhad (the “Trustee”). The Fund replaced OSK Trustees with Deutsche Trustees Malaysia Berhad (the “Trustee”) effective 1 October 2010. A Supplemental Master Deed was entered into between Eastspring Investments Berhad (the “Manager”) and Deutsche Trustees Malaysia Berhad (the “Trustee”) on 30 July 2010 to effect the change of trustee from OSK Trustees to the Trustee, followed by Second Supplemental Master Deed dated 28 January 2011, Third Supplemental Master Deed dated 9 March 2011, Fourth Supplemental Master Deed dated 20 January 2012, Fifth Supplemental Master Deed dated 26 March 2014, Sixth Supplemental Master Deed dated 2 January 2015, Seventh Supplemental Master Deed dated 11 July 2016, Eighth Supplemental Master Deed dated 25 January 2017, Ninth Supplemental Master Deed dated 11 December 2017 and Tenth Supplemental Master Deed dated 4 June 2018 (collectively referred to as the “Deed”).
The Fund was launched on 1 March 2011 and will continue its operations until terminated as provided under Part 12 of the Deed.
The Fund seeks to provide investors with capital appreciation in the medium to long term with an opportunity for income, if any. The Fund targets to invest up to but not limited to 30 Malaysian securities that are expected to provide medium to long-term capital appreciation and income potential.
All investments will be subjected to the the Securities Commission (the “SC”) Guidelines on Unit Trust Funds, the SC requirements, the Deed, except where exemptions or variations have been approved by the SC, internal policies and procedures and the Fund’s objective.
The Manager is a company incorporated in Malaysia and is related to Prudential Plc., a public listed company in the United Kingdom. The principal activity of the Manager is the establishment and management of unit trust funds and asset management.
NOTES TO THE FINANCIAL STATEMENTS FOR THE FINANCIAL YEAR ENDED 31 DECEMBER 2019
31Client Services : 03-2778 1000
Annual Report
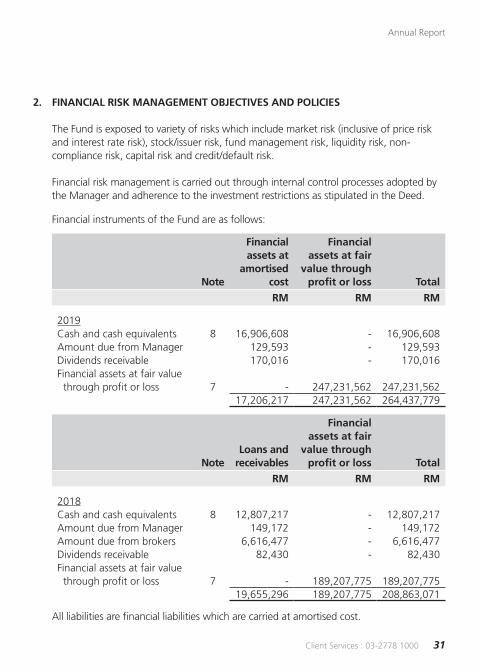
2. FINANCIAL RISK MANAGEMENT OBJECTIVES AND POLICIES
The Fund is exposed to variety of risks which include market risk (inclusive of price risk and interest rate risk), stock/issuer risk, fund management risk, liquidity risk, non-compliance risk, capital risk and credit/default risk.
Financial risk management is carried out through internal control processes adopted by the Manager and adherence to the investment restrictions as stipulated in the Deed.
Financial instruments of the Fund are as follows:
Note
Financial assets at
amortised cost
Financial assets at fair
value through profit or loss Total
RM RM RM
2019Cash and cash equivalents 8 16,906,608 - 16,906,608Amount due from Manager 129,593 - 129,593Dividends receivable 170,016 - 170,016Financial assets at fair value through profit or loss 7 - 247,231,562 247,231,562
17,206,217 247,231,562 264,437,779
NoteLoans and
receivables
Financial assets at fair
value through profit or loss Total
RM RM RM
2018Cash and cash equivalents 8 12,807,217 - 12,807,217Amount due from Manager 149,172 - 149,172Amount due from brokers 6,616,477 - 6,616,477Dividends receivable 82,430 - 82,430Financial assets at fair value through profit or loss 7 - 189,207,775 189,207,775
19,655,296 189,207,775 208,863,071
All liabilities are financial liabilities which are carried at amortised cost.
Client Services : 03-2778 100032
Eastspring Investments MY Focus Fund
Market risk
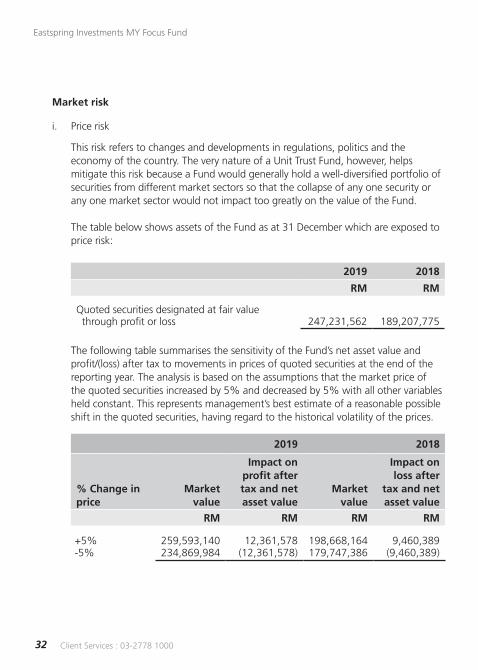
i. Price risk
This risk refers to changes and developments in regulations, politics and the economy of the country. The very nature of a Unit Trust Fund, however, helps mitigate this risk because a Fund would generally hold a well-diversified portfolio of securities from different market sectors so that the collapse of any one security or any one market sector would not impact too greatly on the value of the Fund.
The table below shows assets of the Fund as at 31 December which are exposed to price risk:
2019 2018
RM RM
Quoted securities designated at fair value through profit or loss 247,231,562 189,207,775
The following table summarises the sensitivity of the Fund’s net asset value and profit/(loss) after tax to movements in prices of quoted securities at the end of the reporting year. The analysis is based on the assumptions that the market price of the quoted securities increased by 5% and decreased by 5% with all other variables held constant. This represents management’s best estimate of a reasonable possible shift in the quoted securities, having regard to the historical volatility of the prices.
2019 2018
% Change in price
Market value
Impact on profit after tax and net asset value
Market value
Impact on loss after
tax and net asset value
RM RM RM RM
+5% 259,593,140 12,361,578 198,668,164 9,460,389-5% 234,869,984 (12,361,578) 179,747,386 (9,460,389)
33Client Services : 03-2778 1000
Annual Report
ii. Interest rate risk
Cash flow interest rate risk is the risk that the future cash flows of a financial instrument will fluctuate because of changes in market interest rates.
Fair value interest rate risk is the risk that the value of a financial instrument will fluctuate due to changes in market interest rates.
Interest rate risk is a general economic indicator that will have an impact on the management of the Fund regardless of whether it is a Shariah-based Fund or otherwise. The reason for this is because a high level of interest rates will inevitably affect corporate profits and this will have an impact on the value of investments.
The Fund’s investments in deposit with a licensed financial institution are short-term in nature. Therefore, exposure to interest rate fluctuations is minimal.
As at the end of the financial year, the Fund does not hold any other financial instruments that expose it to interest rate risk.
Stock/Issuer risk
This risk refers to the individual risk of the respective companies issuing the securities. Specific risk includes but is not limited to changes in consumer tastes and demand, legal suits, competitive operating environments, changing industry conditions and management omissions and errors. However, this risk is minimised through investing in a wide range of companies in difference sectors and thus function independently from one another.
Fund management risk
There is the risk that the management company may not adhere to the investment mandate of the respective Fund. With close monitoring by the investment committee, back office system being incorporated with limits and controls, and regular reporting to the senior management team, the management company is able to manage such risk. The Trustee has an oversight function over management of the Fund by the management company to safeguard the interest of unit holders.
Client Services : 03-2778 100034
Eastspring Investments MY Focus Fund
Liquidity risk
Liquidity risk is the risk that the Fund will encounter difficulty in meeting its financial obligations. Generally, all investments are subject to a certain degree of liquidity risk depending on the nature of the investment instruments, market, sector and other factors. For the purpose of the Fund, the Fund Manager will attempt to balance the entire portfolio by investing in a mix of assets with satisfactory trading volume and those that occasionally could encounter poor liquidity. This is expected to reduce the risks for the entire portfolio without limiting the Fund’s growth potentials.
The Fund maintains sufficient level of liquid assets, after consultation with the Trustee, to meet anticipated payments and cancellations of units by unit holders. Liquid assets comprise bank balances, deposits with licensed financial institutions and other instruments which are capable of being converted into cash within 7 days.
35Client Services : 03-2778 1000
Annual Report
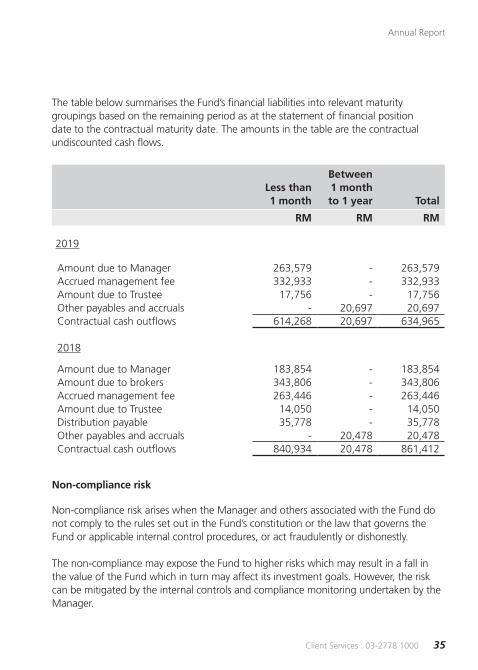
The table below summarises the Fund’s financial liabilities into relevant maturity groupings based on the remaining period as at the statement of financial position date to the contractual maturity date. The amounts in the table are the contractual undiscounted cash flows.
Less than 1 month
Between 1 month to 1 year Total
RM RM RM
2019
Amount due to Manager 263,579 - 263,579Accrued management fee 332,933 - 332,933Amount due to Trustee 17,756 - 17,756Other payables and accruals - 20,697 20,697Contractual cash outflows 614,268 20,697 634,965
2018
Amount due to Manager 183,854 - 183,854Amount due to brokers 343,806 - 343,806Accrued management fee 263,446 - 263,446Amount due to Trustee 14,050 - 14,050Distribution payable 35,778 - 35,778Other payables and accruals - 20,478 20,478Contractual cash outflows 840,934 20,478 861,412
Non-compliance risk
Non-compliance risk arises when the Manager and others associated with the Fund do not comply to the rules set out in the Fund’s constitution or the law that governs the Fund or applicable internal control procedures, or act fraudulently or dishonestly.
The non-compliance may expose the Fund to higher risks which may result in a fall in the value of the Fund which in turn may affect its investment goals. However, the risk can be mitigated by the internal controls and compliance monitoring undertaken by the Manager.
Client Services : 03-2778 100036
Eastspring Investments MY Focus Fund
Capital risk
The capital of the Fund is represented by equity consisting of unit holders’ capital of RM254,936,838 (2018: RM198,647,271) and retained earnings of RM8,865,976 (2018: RM9,354,388). The amount of equity can change significantly on a daily basis as the Fund is subject to daily subscriptions and redemptions at the discretion of unit holders. The Fund’s objective when managing capital is to safeguard the Fund’s ability to continue as a going concern in order to provide returns for unit holders and benefits for other stakeholders and to maintain a strong capital base to support the development of the investment activities of the Fund.
Credit/Default risk
Credit risk refers to the ability of an issuer or a counterparty to make timely payments of interest, principals and proceeds from realisation of investments.
The credit risk arising from placements of deposits in licensed financial institutions is managed by ensuring that the Fund will only place deposits in reputable licensed financial institutions. For amount due from brokers, the settlement terms are governed by the relevant rules and regulations as prescribed by Bursa Malaysia Securities Berhad (“Bursa Malaysia”). The settlement terms of the proceeds from the creation of units receivable from the Manager are governed by the SC’s Guidelines on Unit Trust Funds.
The credit/default risk is minimal as all transactions in quoted securities are settled/paid upon delivery using approved brokers.
37Client Services : 03-2778 1000
Annual Report
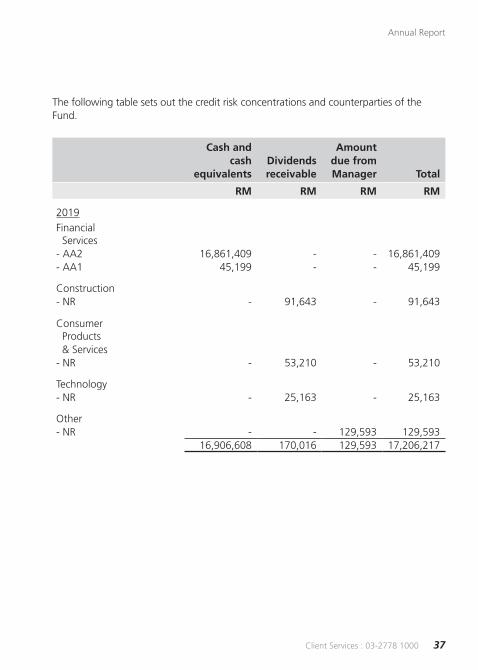
The following table sets out the credit risk concentrations and counterparties of the Fund.
Cash and cash
equivalentsDividends receivable
Amount due from Manager Total
RM RM RM RM
2019
Financial Services- AA2 16,861,409 - - 16,861,409- AA1 45,199 - - 45,199
Construction - NR - 91,643 - 91,643
Consumer Products & Services - NR - 53,210 - 53,210
Technology - NR - 25,163 - 25,163
Other - NR - - 129,593 129,593
16,906,608 170,016 129,593 17,206,217
Client Services : 03-2778 100038
Eastspring Investments MY Focus Fund
Cash and cash
equivalentsDividends receivable
Amount due from Manager
Amount due from
brokers Total
RM RM RM RM RM
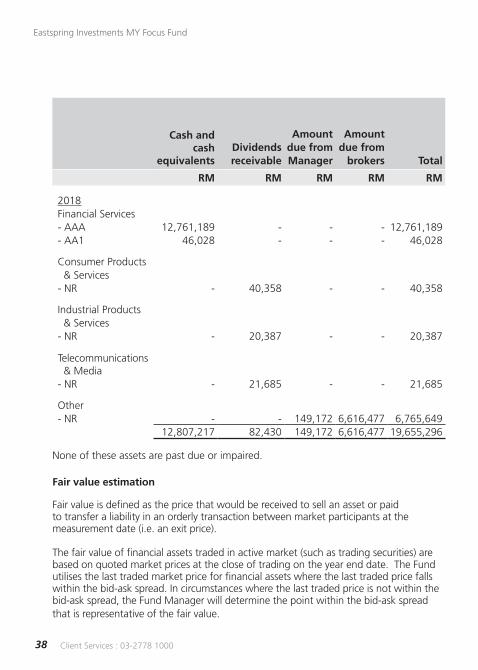
2018Financial Services- AAA 12,761,189 - - - 12,761,189- AA1 46,028 - - - 46,028
Consumer Products & Services - NR - 40,358 - - 40,358
Industrial Products & Services - NR - 20,387 - - 20,387
Telecommunications & Media - NR - 21,685 - - 21,685
Other - NR - - 149,172 6,616,477 6,765,649
12,807,217 82,430 149,172 6,616,477 19,655,296
None of these assets are past due or impaired.
Fair value estimation
Fair value is defined as the price that would be received to sell an asset or paid to transfer a liability in an orderly transaction between market participants at the measurement date (i.e. an exit price).
The fair value of financial assets traded in active market (such as trading securities) are based on quoted market prices at the close of trading on the year end date. The Fund utilises the last traded market price for financial assets where the last traded price falls within the bid-ask spread. In circumstances where the last traded price is not within the bid-ask spread, the Fund Manager will determine the point within the bid-ask spread that is representative of the fair value.
39Client Services : 03-2778 1000
Annual Report
An active market is a market in which transactions for the asset or liability take place with sufficient frequency and volume to provide pricing information on an ongoing basis.
The fair value of financial assets that are not traded in an active market is determined by using valuation techniques.
Fair value hierarchy
i. The table below analyses financial instruments carried at fair value by valuation method.
• Level 1: Quoted prices (unadjusted) in active market for identical assets or
liabilities.• Level 2: Inputs other than quoted prices included within Level 1 that are
observable for the asset or liability, either directly (that is, as prices) or indirectly (that is, derived from prices).
• Level 3: Inputs for the asset and liability that are not based on observable market data (that is, unobservable inputs).
The level in the fair value hierarchy within which the fair value measurement is categorised in its entirety is determined on the basis of the lowest level input that is significant to the fair value measurement in its entirety. For this purpose, the significance of an input is assessed against the fair value measurement in its entirety. If a fair value measurement uses observable inputs that require significant adjustment based on unobservable inputs, that measurement is a Level 3 measurement.
Assessing the significance of a particular input to the fair value measurement in its entirety requires judgement, considering factors specific to the asset or liability.
The determination of what constitutes ‘observable’ requires significant judgement by the Fund. The Fund considers observable data to be that market data that is readily available, regularly distributed or updated, reliable and verifiable, not proprietary, and provided by independent sources that are actively involved in the relevant market.
Client Services : 03-2778 100040
Eastspring Investments MY Focus Fund
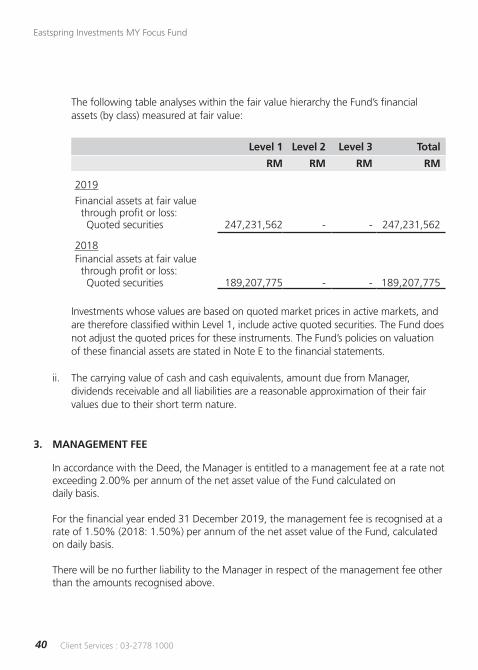
The following table analyses within the fair value hierarchy the Fund’s financial assets (by class) measured at fair value:
Level 1 Level 2 Level 3 Total
RM RM RM RM
2019
Financial assets at fair value through profit or loss: Quoted securities 247,231,562 - - 247,231,562
2018Financial assets at fair value through profit or loss: Quoted securities 189,207,775 - - 189,207,775
Investments whose values are based on quoted market prices in active markets, and are therefore classified within Level 1, include active quoted securities. The Fund does not adjust the quoted prices for these instruments. The Fund’s policies on valuation of these financial assets are stated in Note E to the financial statements.
ii. The carrying value of cash and cash equivalents, amount due from Manager, dividends receivable and all liabilities are a reasonable approximation of their fair values due to their short term nature.
3. MANAGEMENT FEE
In accordance with the Deed, the Manager is entitled to a management fee at a rate not exceeding 2.00% per annum of the net asset value of the Fund calculated on daily basis.
For the financial year ended 31 December 2019, the management fee is recognised at a rate of 1.50% (2018: 1.50%) per annum of the net asset value of the Fund, calculated on daily basis.
There will be no further liability to the Manager in respect of the management fee other than the amounts recognised above.
41Client Services : 03-2778 1000
Annual Report
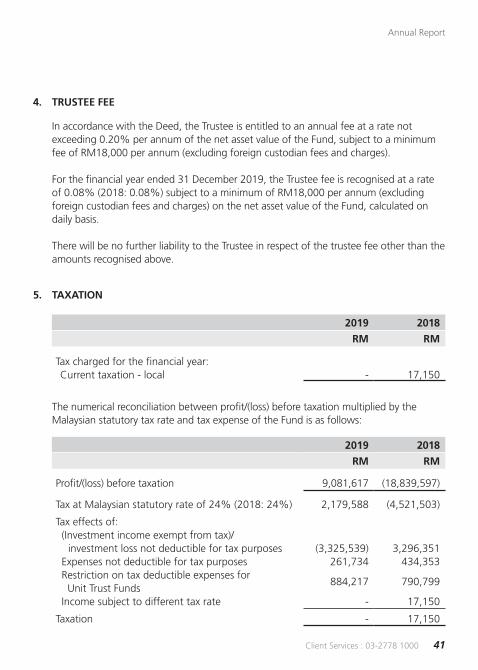
4. TRUSTEE FEE
In accordance with the Deed, the Trustee is entitled to an annual fee at a rate not exceeding 0.20% per annum of the net asset value of the Fund, subject to a minimum fee of RM18,000 per annum (excluding foreign custodian fees and charges).
For the financial year ended 31 December 2019, the Trustee fee is recognised at a rate of 0.08% (2018: 0.08%) subject to a minimum of RM18,000 per annum (excluding foreign custodian fees and charges) on the net asset value of the Fund, calculated on daily basis.
There will be no further liability to the Trustee in respect of the trustee fee other than the amounts recognised above.
5. TAXATION
2019 2018
RM RM
Tax charged for the financial year: Current taxation - local - 17,150
The numerical reconciliation between profit/(loss) before taxation multiplied by the Malaysian statutory tax rate and tax expense of the Fund is as follows:
2019 2018
RM RM
Profit/(loss) before taxation 9,081,617 (18,839,597)
Tax at Malaysian statutory rate of 24% (2018: 24%) 2,179,588 (4,521,503)
Tax effects of: (Investment income exempt from tax)/ investment loss not deductible for tax purposes (3,325,539) 3,296,351 Expenses not deductible for tax purposes 261,734 434,353 Restriction on tax deductible expenses for Unit Trust Funds
884,217 790,799
Income subject to different tax rate - 17,150
Taxation - 17,150
Client Services : 03-2778 100042
Eastspring Investments MY Focus Fund
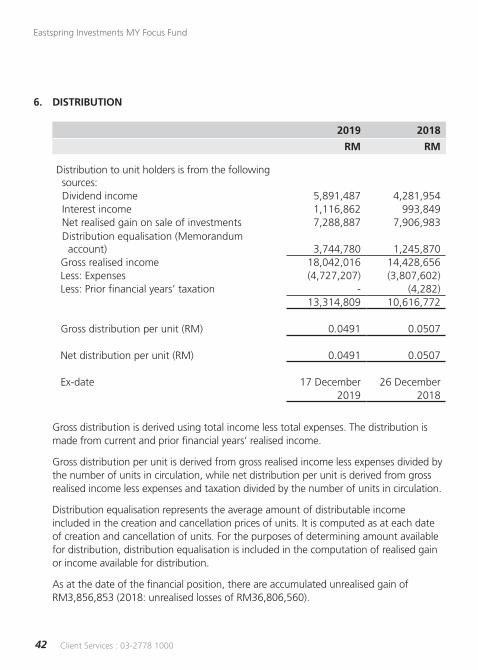
6. DISTRIBUTION
2019 2018
RM RM
Distribution to unit holders is from the following sources: Dividend income 5,891,487 4,281,954 Interest income 1,116,862 993,849 Net realised gain on sale of investments 7,288,887 7,906,983 Distribution equalisation (Memorandum account) 3,744,780 1,245,870 Gross realised income 18,042,016 14,428,656 Less: Expenses (4,727,207) (3,807,602) Less: Prior financial years’ taxation - (4,282)
13,314,809 10,616,772
Gross distribution per unit (RM) 0.0491 0.0507
Net distribution per unit (RM) 0.0491 0.0507
Ex-date 17 December 26 December2019 2018
Gross distribution is derived using total income less total expenses. The distribution is made from current and prior financial years’ realised income.
Gross distribution per unit is derived from gross realised income less expenses divided by the number of units in circulation, while net distribution per unit is derived from gross realised income less expenses and taxation divided by the number of units in circulation.
Distribution equalisation represents the average amount of distributable income included in the creation and cancellation prices of units. It is computed as at each date of creation and cancellation of units. For the purposes of determining amount available for distribution, distribution equalisation is included in the computation of realised gain or income available for distribution.
As at the date of the financial position, there are accumulated unrealised gain of RM3,856,853 (2018: unrealised losses of RM36,806,560).
43Client Services : 03-2778 1000
Annual Report
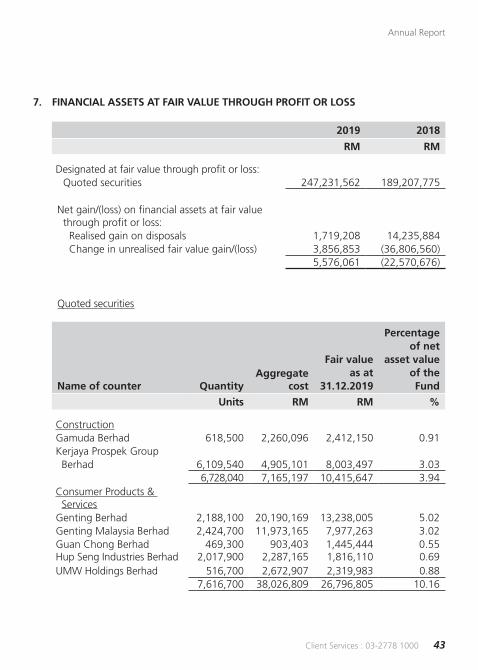
7. FINANCIAL ASSETS AT FAIR VALUE THROUGH PROFIT OR LOSS
2019 2018
RM RM
Designated at fair value through profit or loss: Quoted securities 247,231,562 189,207,775
Net gain/(loss) on financial assets at fair value through profit or loss: Realised gain on disposals 1,719,208 14,235,884 Change in unrealised fair value gain/(loss) 3,856,853 (36,806,560)
5,576,061 (22,570,676)
Quoted securities
Name of counter QuantityAggregate
cost
Fair value as at
31.12.2019
Percentage of net
asset value of the Fund
Units RM RM %
ConstructionGamuda Berhad 618,500 2,260,096 2,412,150 0.91Kerjaya Prospek Group Berhad 6,109,540 4,905,101 8,003,497 3.03
6,728,040 7,165,197 10,415,647 3.94Consumer Products & ServicesGenting Berhad 2,188,100 20,190,169 13,238,005 5.02Genting Malaysia Berhad 2,424,700 11,973,165 7,977,263 3.02Guan Chong Berhad 469,300 903,403 1,445,444 0.55Hup Seng Industries Berhad 2,017,900 2,287,165 1,816,110 0.69UMW Holdings Berhad 516,700 2,672,907 2,319,983 0.88
7,616,700 38,026,809 26,796,805 10.16
Client Services : 03-2778 100044
Eastspring Investments MY Focus Fund
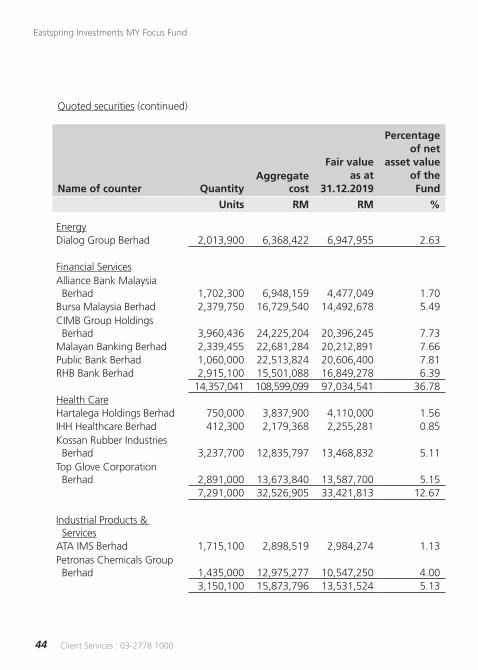
Quoted securities (continued)
Name of counter QuantityAggregate
cost
Fair value as at
31.12.2019
Percentage of net
asset value of the Fund
Units RM RM %
EnergyDialog Group Berhad 2,013,900 6,368,422 6,947,955 2.63
Financial ServicesAlliance Bank Malaysia Berhad 1,702,300 6,948,159 4,477,049 1.70Bursa Malaysia Berhad 2,379,750 16,729,540 14,492,678 5.49CIMB Group Holdings Berhad 3,960,436 24,225,204 20,396,245 7.73Malayan Banking Berhad 2,339,455 22,681,284 20,212,891 7.66Public Bank Berhad 1,060,000 22,513,824 20,606,400 7.81RHB Bank Berhad 2,915,100 15,501,088 16,849,278 6.39
14,357,041 108,599,099 97,034,541 36.78Health CareHartalega Holdings Berhad 750,000 3,837,900 4,110,000 1.56IHH Healthcare Berhad 412,300 2,179,368 2,255,281 0.85Kossan Rubber Industries Berhad 3,237,700
12,835,797
13,468,832 5.11
Top Glove Corporation Berhad 2,891,000
13,673,840
13,587,700 5.15
7,291,000 32,526,905 33,421,813 12.67
Industrial Products & ServicesATA IMS Berhad 1,715,100 2,898,519 2,984,274 1.13Petronas Chemicals Group Berhad 1,435,000
12,975,277
10,547,250 4.00
3,150,100 15,873,796 13,531,524 5.13
45Client Services : 03-2778 1000
Annual Report
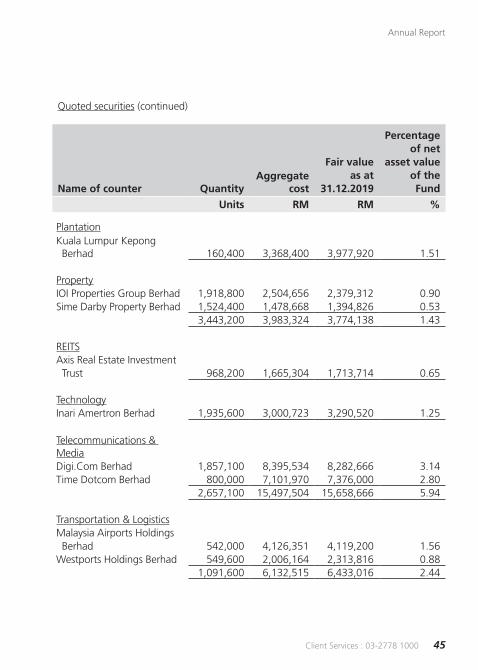
Quoted securities (continued)
Name of counter QuantityAggregate
cost
Fair value as at
31.12.2019
Percentage of net
asset value of the Fund
Units RM RM %
PlantationKuala Lumpur Kepong Berhad 160,400 3,368,400 3,977,920 1.51
PropertyIOI Properties Group Berhad 1,918,800 2,504,656 2,379,312 0.90Sime Darby Property Berhad 1,524,400 1,478,668 1,394,826 0.53
3,443,200 3,983,324 3,774,138 1.43
REITSAxis Real Estate Investment Trust 968,200 1,665,304 1,713,714 0.65
TechnologyInari Amertron Berhad 1,935,600 3,000,723 3,290,520 1.25
Telecommunications & MediaDigi.Com Berhad 1,857,100 8,395,534 8,282,666 3.14Time Dotcom Berhad 800,000 7,101,970 7,376,000 2.80
2,657,100 15,497,504 15,658,666 5.94
Transportation & LogisticsMalaysia Airports Holdings Berhad 542,000 4,126,351 4,119,200 1.56Westports Holdings Berhad 549,600 2,006,164 2,313,816 0.88
1,091,600 6,132,515 6,433,016 2.44
Client Services : 03-2778 100046
Eastspring Investments MY Focus Fund
Quoted securities (continued)
Name of counter QuantityAggregate
cost
Fair value as at
31.12.2019
Percentage of net
asset value of the Fund
Units RM RM %
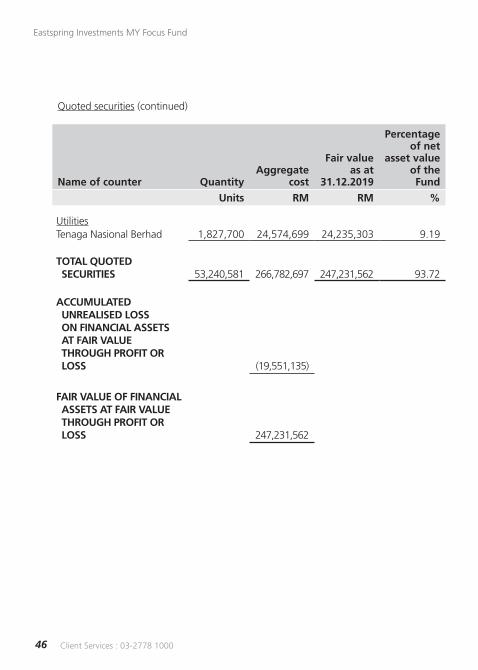
UtilitiesTenaga Nasional Berhad 1,827,700 24,574,699 24,235,303 9.19
TOTAL QUOTED SECURITIES 53,240,581
266,782,697
247,231,562 93.72
ACCUMULATED UNREALISED LOSS ON FINANCIAL ASSETS AT FAIR VALUE THROUGH PROFIT OR LOSS (19,551,135)
FAIR VALUE OF FINANCIAL ASSETS AT FAIR VALUE THROUGH PROFIT OR LOSS 247,231,562
47Client Services : 03-2778 1000
Annual Report
Quoted securities
Name of counter QuantityAggregate
cost
Fair value as at
31.12.2018
Percentage of net
asset value of the Fund
Units RM RM %
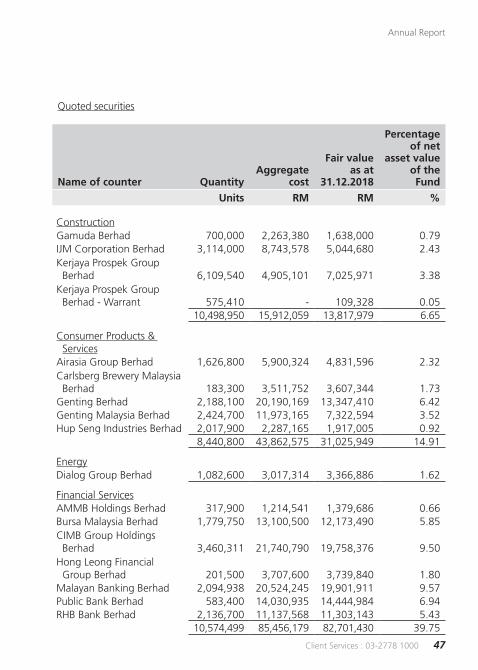
ConstructionGamuda Berhad 700,000 2,263,380 1,638,000 0.79IJM Corporation Berhad 3,114,000 8,743,578 5,044,680 2.43Kerjaya Prospek Group Berhad 6,109,540 4,905,101 7,025,971 3.38Kerjaya Prospek Group Berhad - Warrant 575,410 - 109,328 0.05
10,498,950 15,912,059 13,817,979 6.65
Consumer Products & ServicesAirasia Group Berhad 1,626,800 5,900,324 4,831,596 2.32Carlsberg Brewery Malaysia Berhad 183,300 3,511,752 3,607,344 1.73Genting Berhad 2,188,100 20,190,169 13,347,410 6.42Genting Malaysia Berhad 2,424,700 11,973,165 7,322,594 3.52Hup Seng Industries Berhad 2,017,900 2,287,165 1,917,005 0.92
8,440,800 43,862,575 31,025,949 14.91
EnergyDialog Group Berhad 1,082,600 3,017,314 3,366,886 1.62
Financial ServicesAMMB Holdings Berhad 317,900 1,214,541 1,379,686 0.66Bursa Malaysia Berhad 1,779,750 13,100,500 12,173,490 5.85CIMB Group Holdings Berhad 3,460,311
21,740,790
19,758,376 9.50
Hong Leong Financial Group Berhad 201,500 3,707,600 3,739,840 1.80Malayan Banking Berhad 2,094,938 20,524,245 19,901,911 9.57Public Bank Berhad 583,400 14,030,935 14,444,984 6.94RHB Bank Berhad 2,136,700 11,137,568 11,303,143 5.43
10,574,499 85,456,179 82,701,430 39.75
Client Services : 03-2778 100048
Eastspring Investments MY Focus Fund
Quoted securities (continued)
Name of counter QuantityAggregate
cost
Fair value as at
31.12.2018
Percentage of net
asset value of the Fund
Units RM RM %
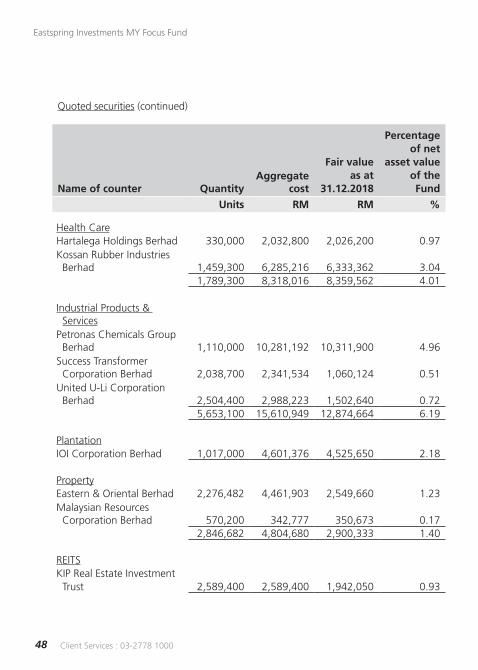
Health CareHartalega Holdings Berhad 330,000 2,032,800 2,026,200 0.97Kossan Rubber Industries Berhad 1,459,300 6,285,216 6,333,362 3.04
1,789,300 8,318,016 8,359,562 4.01
Industrial Products & ServicesPetronas Chemicals Group Berhad 1,110,000
10,281,192
10,311,900 4.96
Success Transformer Corporation Berhad 2,038,700 2,341,534 1,060,124 0.51United U-Li Corporation Berhad 2,504,400 2,988,223 1,502,640 0.72
5,653,100 15,610,949 12,874,664 6.19
PlantationIOI Corporation Berhad 1,017,000 4,601,376 4,525,650 2.18
PropertyEastern & Oriental Berhad 2,276,482 4,461,903 2,549,660 1.23 Malaysian Resources Corporation Berhad 570,200 342,777 350,673 0.17
2,846,682 4,804,680 2,900,333 1.40
REITSKIP Real Estate Investment Trust 2,589,400 2,589,400 1,942,050 0.93
49Client Services : 03-2778 1000
Annual Report
Quoted securities (continued)
Name of counter QuantityAggregate
cost
Fair value as at
31.12.2018
Percentage of net
asset value of the Fund
Units RM RM %
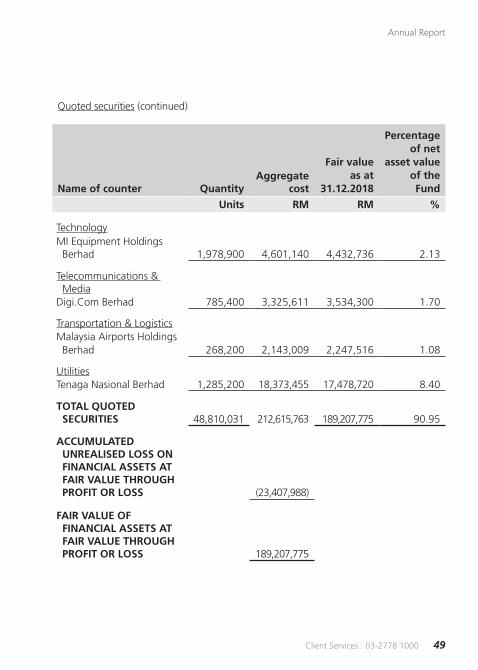
TechnologyMI Equipment Holdings Berhad 1,978,900 4,601,140 4,432,736 2.13
Telecommunications & MediaDigi.Com Berhad 785,400 3,325,611 3,534,300 1.70
Transportation & LogisticsMalaysia Airports Holdings Berhad 268,200 2,143,009 2,247,516 1.08
UtilitiesTenaga Nasional Berhad 1,285,200 18,373,455 17,478,720 8.40
TOTAL QUOTED SECURITIES 48,810,031 212,615,763 189,207,775 90.95
ACCUMULATED UNREALISED LOSS ON FINANCIAL ASSETS AT FAIR VALUE THROUGH PROFIT OR LOSS (23,407,988)
FAIR VALUE OF FINANCIAL ASSETS AT FAIR VALUE THROUGH PROFIT OR LOSS 189,207,775
Client Services : 03-2778 100050
Eastspring Investments MY Focus Fund
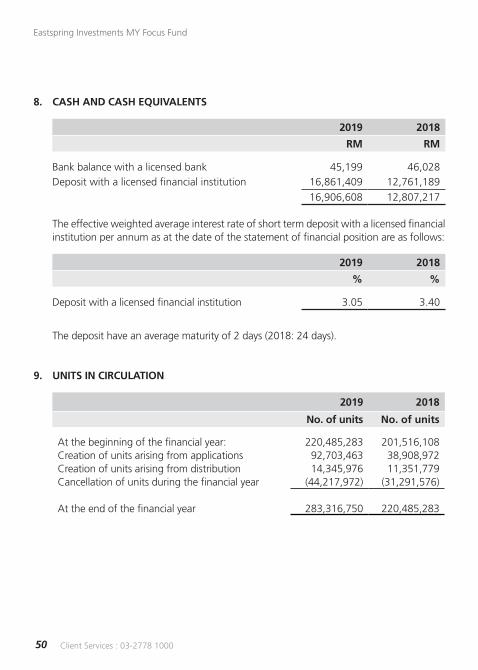
8. CASH AND CASH EQUIVALENTS
2019 2018
RM RM
Bank balance with a licensed bank 45,199 46,028Deposit with a licensed financial institution 16,861,409 12,761,189
16,906,608 12,807,217
The effective weighted average interest rate of short term deposit with a licensed financial institution per annum as at the date of the statement of financial position are as follows:
2019 2018
% %
Deposit with a licensed financial institution 3.05 3.40
The deposit have an average maturity of 2 days (2018: 24 days).
9. UNITS IN CIRCULATION
2019 2018
No. of units No. of units
At the beginning of the financial year: 220,485,283 201,516,108Creation of units arising from applications 92,703,463 38,908,972Creation of units arising from distribution 14,345,976 11,351,779Cancellation of units during the financial year (44,217,972) (31,291,576)
At the end of the financial year 283,316,750 220,485,283
51Client Services : 03-2778 1000
Annual Report
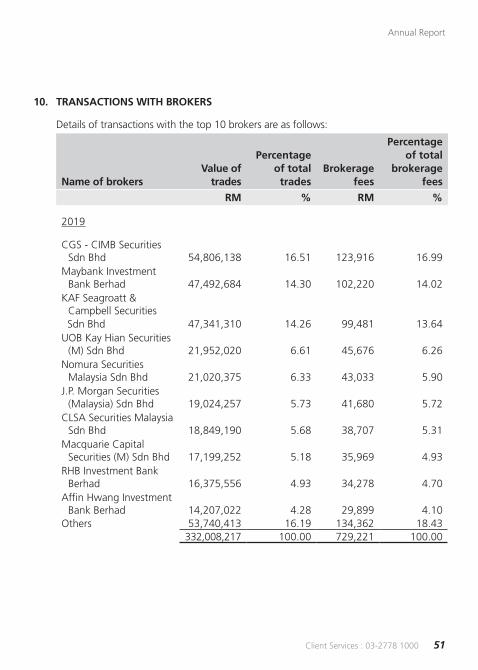
10. TRANSACTIONS WITH BROKERS Details of transactions with the top 10 brokers are as follows:
Name of brokersValue of
trades
Percentage of total
tradesBrokerage
fees
Percentage of total
brokerage fees
RM % RM %
2019
CGS - CIMB Securities Sdn Bhd 54,806,138 16.51 123,916 16.99
Maybank Investment Bank Berhad 47,492,684 14.30 102,220 14.02
KAF Seagroatt & Campbell Securities
Sdn Bhd 47,341,310 14.26 99,481 13.64UOB Kay Hian Securities
(M) Sdn Bhd 21,952,020 6.61 45,676 6.26Nomura Securities
Malaysia Sdn Bhd 21,020,375 6.33 43,033 5.90J.P. Morgan Securities
(Malaysia) Sdn Bhd 19,024,257 5.73 41,680 5.72 CLSA Securities Malaysia
Sdn Bhd 18,849,190 5.68 38,707 5.31Macquarie Capital
Securities (M) Sdn Bhd 17,199,252 5.18 35,969 4.93RHB Investment Bank
Berhad 16,375,556 4.93 34,278 4.70Affin Hwang Investment
Bank Berhad 14,207,022 4.28 29,899 4.10Others 53,740,413 16.19 134,362 18.43
332,008,217 100.00 729,221 100.00
Client Services : 03-2778 100052
Eastspring Investments MY Focus Fund
Name of brokersValue of
trades
Percentage of total
tradesBrokerage
fees
Percentage of total
brokerage fees
RM % RM %
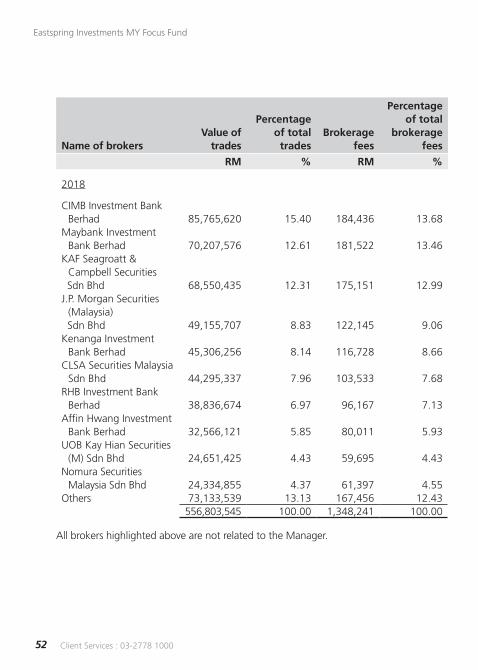
2018
CIMB Investment Bank Berhad 85,765,620 15.40 184,436 13.68
Maybank Investment Bank Berhad 70,207,576 12.61 181,522 13.46
KAF Seagroatt & Campbell Securities
Sdn Bhd 68,550,435 12.31 175,151 12.99J.P. Morgan Securities
(Malaysia) Sdn Bhd 49,155,707 8.83 122,145 9.06Kenanga Investment
Bank Berhad 45,306,256 8.14 116,728 8.66CLSA Securities Malaysia
Sdn Bhd 44,295,337 7.96 103,533 7.68RHB Investment Bank
Berhad 38,836,674 6.97 96,167 7.13Affin Hwang Investment
Bank Berhad 32,566,121 5.85 80,011 5.93UOB Kay Hian Securities
(M) Sdn Bhd 24,651,425 4.43 59,695 4.43Nomura Securities
Malaysia Sdn Bhd 24,334,855 4.37 61,397 4.55Others 73,133,539 13.13 167,456 12.43
556,803,545 100.00 1,348,241 100.00
All brokers highlighted above are not related to the Manager.
53Client Services : 03-2778 1000
Annual Report
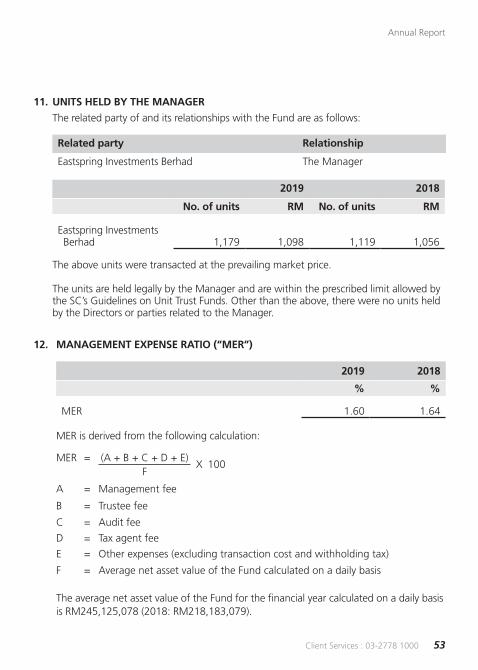
11. UNITS HELD BY THE MANAGER The related party of and its relationships with the Fund are as follows:
Related party Relationship
Eastspring Investments Berhad The Manager
2019 2018
No. of units RM No. of units RM
Eastspring Investments Berhad 1,179 1,098 1,119 1,056
The above units were transacted at the prevailing market price.
The units are held legally by the Manager and are within the prescribed limit allowed by the SC’s Guidelines on Unit Trust Funds. Other than the above, there were no units held by the Directors or parties related to the Manager.
12. MANAGEMENT EXPENSE RATIO (“MER”)
2019 2018
% %
MER 1.60 1.64
MER is derived from the following calculation:
MER = (A + B + C + D + E)X 100
F
A = Management fee
B = Trustee fee
C = Audit fee
D = Tax agent fee
E = Other expenses (excluding transaction cost and withholding tax)
F = Average net asset value of the Fund calculated on a daily basis
The average net asset value of the Fund for the financial year calculated on a daily basis is RM245,125,078 (2018: RM218,183,079).
Client Services : 03-2778 100054
Eastspring Investments MY Focus Fund
13. PORTFOLIO TURNOVER RATIO (“PTR”)
2019 2018
PTR (times) 0.68 1.28
PTR is derived from the following calculation:
(Total acquisitions for the financial year + total disposals for the financial year) ÷ 2
Average net asset value of the Fund for the financial year calculated on a daily basis
where:total acquisitions for the financial year = RM192,227,972 (2018: RM297,330,192)total disposals for the financial year = RM139,780,245 (2018: RM259,473,353)
14. APPROVAL OF FINANCIAL STATEMENTS
The financial statements have been approved for issue by the Manager on 17 February 2020.
55Client Services : 03-2778 1000
Annual Report
THE MANAGERNAME
EASTSPRING INVESTMENTS BERHAD
COMPANY NO.
200001028634 (531241-U)
REGISTERED OFFICE
Level 25, Menara Hong Leong
No. 6, Jalan Damanlela
Bukit Damansara
50490 Kuala Lumpur
BUSINESS OFFICE
Level 22, Menara Prudential
Persiaran TRX Barat
55188 Tun Razak Exchange
Kuala Lumpur
TELEPHONE NO.
603-2778 3888
FAX NO.
603-2789 7220
WEBSITE
www.eastspring.com/my
TRUSTEENAME
DEUTSCHE TRUSTEES MALAYSIA BERHAD
COMPANY NO.
763590-H
REGISTERED OFFICE & BUSINESS OFFICE
Level 20, Menara IMC
No. 8, Jalan Sultan Ismail
50250 Kuala Lumpur
TELEPHONE NO.
603-2053 7522
FAX NO.
603-2053 7526
SALE & PURCHASE OF UNITSEastspring Investments BerhadLevel 22, Menara Prudential
Persiaran TRX Barat
55188 Tun Razak Exchange
Kuala Lumpur
TELEPHONE NO.
603-2778 1000
CORPORATE DIRECTORY
Client Services : 03-2778 100056
Eastspring Investments MY Focus Fund
BRANCHESPetaling JayaEastspring Investments Berhad
A-17-P1 & M
Block A, Jaya One
72A, Jalan Universiti
46200 Petaling Jaya, Selangor
TELEPHONE NO.
603-7948 1288
Kota KinabaluEastspring Investments Berhad
Suite E3, 9th Floor
CPS Tower, Centre Point Sabah
No. 1, Jalan Centre Point
88000 Kota Kinabalu, Sabah
TELEPHONE NO.
6088-238 613
ENQUIRIESCLIENT SERVICES
603-2778 1000

FOR THE FINANCIAL YEAR ENDED 31 DECEMBER 2019
ANNUAL REPORT
EASTSPRING INVESTMENTSMY FOCUS FUND
Eastspring Investments Berhad 200001028634 (531241-U)
Level 22, Menara Prudential, Persiaran TRX Barat55188 Tun Razak Exchange, Kuala LumpurT: (603) 2778 3888 F: (603) 2789 7220eastspring.com/my
Client ServicesT: (603) 2778 1000 [email protected]