easyjet’s strategy continues to deliver returns and
TRANSCRIPT

Page 1
15 May 2013
easyJet plc
Results for the six months ended 31 March 2013
easyJet’s strategy continues to deliver returns and profitable growth
A. HIGHLIGHTS
2013
2012 Change
Total revenue (£ million) 1,601 1,465 9.3 %
Loss before tax (£ million) (61) (112) 45.5 %
Pre-tax margin (%) (3.8) (7.6) +3.8 ppt
Loss per share - basic (pence) (12.0) (21.2) 43.4 %
Return on capital employed (%) (1)
(0.9) (2.8) +1.9 ppt
Revenue initiatives and the focus on maintaining easyJet’s cost advantage, combined with competitor capacity reductions and the
timing of Easter have enabled easyJet to reduce its first half pre-tax loss year on year by £51 million to £61 million.
easyJet ended the first half of the financial year with £1,194 million of cash, a decrease of £17 million against last year. Net cash as
at 31 March 2013 was £433 million compared to £42 million at 31 March 2012.
On 1 May 2013, John Barton succeeded Sir Mike Rake as easyJet Chairman. The whole team at easyJet wishes to note its thanks
for Sir Mike Rake’s strong leadership of the Board for three years during which easyJet’s total shareholder return was 233%.
Progress against strategic objectives:
Drive demand, conversion and yields across Europe
Total revenue per seat increased by 8.6% year on year on a constant currency basis, and by 5.8% per seat on a reported basis, to £53.39 as the half year benefited from an early Easter, competitor capacity retrenchment, returns focused changes to easyJet’s network and improvements to its revenue management system.
Average load factors increased by 1.7 percentage points to 88.6% whilst capacity grew by 3.3% to 30 million seats.
Maintain cost advantage
Cost per seat excluding fuel grew by 3.4% on a constant currency basis and by 3.1% on a reported basis to £38.89. Year on year cost increases were largely driven by increased charges at regulated airports and from higher weather related disruption and de-icing costs.
easyJet lean delivered an incremental £25 million of savings in the period.
Build strong number 1 and 2 network positions
Successful deployment of capacity from Madrid base which was exited in December 2012 to strengthen easyJet’s position in Edinburgh, Manchester, Gatwick, Geneva, Lisbon and Lyon.
Disciplined use of capital
In the six months to 31 March 2013, easyJet has returned £85 million or 21.5 pence per share to shareholders through the
increased payment of ordinary dividend, at three times earnings cover.
Further to the January 2013 IMS, easyJet has signed sale and operating leaseback agreements for 12 new A320 and 12
of the oldest A319 aircraft.
Significant improvements have been made in underperforming routes increasing overall network returns.
easyJet is in the final stages of the commercial evaluation of the next generation of short-haul engine technology. The
process has been subject to high standards of governance. In the event that the Board of easyJet concludes that an order

Page 2
will be in the interest of all shareholders, easyJet will bring a proposal to shareholders that will cover both the next
generation of deliveries, which are likely to be after 2017, and a plan for the bridging period from 2015 to 2017.
Commenting on the results, Carolyn McCall, easyJet Chief Executive said:
“easyJet delivered a strong first half performance, demonstrating the Company’s structural advantage in the European short-haul
market against both legacy and low cost competition, and a continuing resilience against a challenging European macro-economic
environment.
Our performance reflects measurable progress against easyJet’s four key strategic objectives that have been amply demonstrated
by a significant reduction in the loss for the first half and significant improvement in ROCE over the same period.
Whilst there is always the potential for unexpected events to impact short term financial performance, the outlook for the second
half of the financial year combined with the strong reduction in first half losses means that easyJet expects to deliver improved
returns and profitability for the year ending 30 September 2013.”
For further details please contact easyJet plc:
Institutional investors and sell side analysts:
Rachel Kentleton Investor Relations +44 (0)7961 754 468
Tom Oliver Investor Relations +44 (0)7950 996 262
Will MacLaren Investor Relations +44 (0)7961 763 879
Media:
Paul Moore Corporate Communications +44 (0)7860 794 444
Edward Simpkins Finsbury +44 (0)207 251 3801
+44 (0)7947 740 551
There will be an analyst presentation at 9:30 am BST on 15 May 2013 at Nomura, One Angel Lane, London, EC4R 3AB
A live webcast of the presentation will be available at www.easyJet.com
Live conference call (Listen only):
UK Access Number: + 44 (0) 20 3426 2887
UK Toll Free Number: 0808 237 0031
US Access Number: + 1 718 873 9077
US Toll Free Number: +1 866 928 7517
Replay facility (available for 7 days):
UK Toll Access Number: +44 (0)20 3426 2807
UK Toll Free Number: 0808 237 0026
US Toll Free Number: +1 866 535 8030
Conference Reference: 638845#

Page 3
B. INTRODUCTION
easyJet is structurally well positioned due to its cost advantage, leading market positions at convenient airports and a superior customer proposition of low fares with friendly and efficient service. This is supported by a strong balance sheet. easyJet’s strategy is focused on delivering sustainable growth and returns in the European short-haul aviation market.
European short-haul airlines typically generate the majority of their returns in the busy summer period and look to minimise their
losses over winter. During the first six months of the financial year, easyJet reduced its winter losses by 45.5% to £61 million, driven
by its focus on network returns through early and decisive action taken on scheduling. This was coupled with a 2.8% decline in
competitor capacity on its routes (2)
.
Year on year cost increases were driven by the anticipated rises in charges at regulated airports as well as increases in disruption
and de-icing costs due to the prolonged adverse winter weather. This was partly offset by savings delivered through the ‘easyJet
lean’ programme.
In the six months to 31 March 2013, easyJet returned £85 million or 21.5 pence per share to shareholders through the increased
payment of ordinary dividend, at three times earnings cover.
easyJet’s balance sheet remains strong with gearing of 11%, net cash of £433 million and cash and money market deposits of
£1,194 million at the end of the period.
C. MARKET OVERVIEW
Competitive landscape
The competitive environment over the winter period has been characterised by capacity retrenchment across the European short-
haul market. As a consequence of the sustained high price of aviation fuel combined with restricted European economic growth and
consumer spending, rising aviation taxes and scarcity of financing, airlines have understandably been cautious about deploying
capacity. easyJet’s competitors reduced capacity by 2.8% on easyJet’s routes and by 4.6% within the whole short-haul European
market in the six months to 31 March 2013 (2)
. In the same period, easyJet increased capacity by 3.3%.
Competitor capacity retrenchment continues to present opportunities for easyJet to leverage its low cost base in order to
moderately add capacity to improve returns. Lower levels of competitor capacity have helped to drive yields and load factors on its
existing routes.
Overall demand in the European aviation market in the medium term is expected to grow slightly ahead of GDP growth
(3). This
growth, combined with expected continued competitor capacity restraint and withdrawals by weaker carriers, means that there are structural opportunities for carriers such as easyJet, with robust business models and strong competitive positions, to grow profitably.
Regulatory environment
The regulatory environment continues to have a significant impact on easyJet. In the first six months of the financial year there have
been further unnecessary regulatory increases in charges impacting all airlines. However, there are some signs of an improvement
in the EU regulatory framework.
The proposed changes to the ground handling framework have now reached the EU Parliament and proposed changes to the slot
framework are likely to be considered soon by the EU Parliament. easyJet supports these proposals, as they would increase
competition across Europe and allow better access to congested airports. easyJet has worked with the EU Parliament to help them
understand the importance of the pro-competition elements. In particular, easyJet supports the legalisation of secondary slot trading
at airports across Europe and an increase in competition within the ground handling market, which would lead to lower costs and an
improved service. This is particularly important in Germany and Portugal, where anti-competitive restrictions on the number of
ground handlers at an airport have led to excessive costs.
easyJet supports the work to make airspace more efficient through the Single European Sky initiative, and the European
Commission’s efforts to drive lower costs into airspace. Europe now has a real opportunity to address the inefficiencies in airspace
through the next airspace charges target setting process (‘RP2’), which will for the first time involve formal EU regulation of en-route
airspace charges across the EU. easyJet will play a full role in the RP2 process.

Page 4
In March the European Commission set out proposed amendments to the EU 261 regulations, which govern passenger rights.
Whilst easyJet has concerns about some aspects of the proposals, it supports significant elements, in particular the proposal to cap
the cost risk airlines face with extreme events such as 2010’s volcanic ash cloud. easyJet will continue to work with the EU, and
believes in the importance of providing passengers with the right level of protection that they value.
easyJet was disappointed that in the March budget, the UK government chose to ignore independent economic evidence that
Airline Passenger Duty is damaging to growth and instead retained the passenger tax at current levels.
easyJet’s network focuses on primary airports where people want to fly to and this provides easyJet with access to important
catchment areas and drives up unit revenues. Primary airports tend to have pricing power and could engage in monopolistic
behaviour if they are not regulated. Where airports are monopolies, regulation is the only effective answer to protect passengers
from excessive airport charges and poor service. easyJet has focused on ensuring that there is effective regulation where it is
needed, but also that regulators understand the needs of point-to-point airlines and their passengers.
There is cost pressure from regulated airports across Europe from a combination of lower passenger volumes, restricted access to
finance and increasing regulatory charges. Over winter there were unjustified increases at Rome, and easyJet is actively engaged
in discussions surrounding the upcoming reviews of charges at Gatwick, Geneva and Stansted.
D. STRATEGIC PROGRESS
Returns and growth
easyJet is making good progress against its strategy to drive sustainable returns and growth for its shareholders and uses a return
on capital employed (ROCE) metric to enable transparent and consistent communication of progress to shareholders.
As a consequence of the reduced winter losses, there was an improvement in ROCE over the first six months of the financial year
in comparison to the same period last year.
H1 2013 H1 2012 Change
Return on capital employed (1)
(0.9)% (2.8)% +1.9 ppt
Progress against strategic objectives
easyJet improved its first half financial performance by continuing to focus on its four key strategic objectives and has made
significant progress over the winter period:
1. Drive demand, conversion and yields across Europe
2. Maintain cost advantage
3. Build strong number 1 and 2 network positions
4. Disciplined use of capital
Progress against each of these objectives is summarised below.
1. Drive demand, conversion and yields across Europe
A key part of easyJet’s strategy is to drive revenues by optimising its network, improving brand awareness, develop ing its
competitive advantage through its bespoke revenue management system, improving its customer relationship management
capabilities, driving conversion through easyJet.com and implementing its wider digital strategy.
Successful execution of this strategy drove the significant unit revenue improvement in the six months to 31 March 2013.
First half revenue performance
easyJet’s total revenue grew by 9.3% on a reported basis to £1,601 million; a 12.2% improvement at constant currency. Revenue
per seat grew by 5.8% on a reported basis to £53.39 and by 8.6% on a constant currency basis. There was a 3.3% growth in
capacity to 30 million seats and a 1.7 percentage point improvement in load factor to 88.6%. Passenger numbers increased by
5.3% to 26.6 million.
The strong performance, which was marginally ahead of the guidance issued in January 2013, was driven by the following:

Page 5
Changes made to the network with early decisions taken on winter thinning and the reallocation of aircraft from the Madrid base, which was closed in the period, to higher performing routes.
Changes to the revenue management system which have enabled more granular yield management for a larger range of flights.
The timing of Easter which fell on 31 March, a week earlier than in 2012. The early Easter moved circa £25 million of revenue from April into March and increased first half revenue per seat by around 1.5%. It is anticipated that this will reduce second half revenue per seat growth by around 1%.
Competitor capacity retrenchment resulting in a 2.8%, or 2 million seat, decline in competitor capacity on easyJet routes during the six months period to 31
March 2013
(2). As competitors withdrew, easyJet made changes to its network,
reallocating capacity to the routes which would drive the highest returns.
Uplift from the introduction of allocated seating which has delivered higher revenues than the speedy boarding product it replaced. In the first half of the financial year, 0.5% of the 8.6% revenue per seat growth at constant currency was driven through the introduction of allocated seating. Allocated seating has been well received by customers and there has been a 2.6 percentage point increase in customer satisfaction with the boarding experience to 70.5%
(4).
Non-seat revenue per seat declined by 8.9% on a constant currency basis (10.9% on a reported basis) to £0.83 per seat, driven in part by the continuing structural decline in the travel insurance market coupled with the transition to new partners which diluted first half results. easyJet expects new partners and products to offset the decline in the first half non-seat revenue during the second half of the year.
Average sector lengths continued to decline as a result of the introduction of shorter French domestic routes and increased levels of
continental European based aircraft.
Passengers travelling on Business
easyJet continues to make progress with its business travel initiative. easyJet’s offer to business travellers, with its competitive
fares, leading network and frequencies connecting primary airports, now combined with allocated seating and leading punctuality
continues to attract an increasing share of the business travel market. Business travellers are attractive to easyJet as they book
closer to departure driving higher yields. They also fly all year-round helping to reduce seasonality.
To access the business travel market, easyJet has secured deals with the leading Global Distribution System (GDS) suppliers, the
major Travel Management Companies (TMCs) who manage a significant proportion of business travel bookings on behalf of large
organisations and many of the large scale public sector and private organisations directly, including the Scottish public sector and
several large banks. The leading GDS providers have invested in technology to standardise the way in which easyJet seats are
presented within their systems to allow users to more easily access the easyJet fares. Amadeus and Galileo solutions will be in
place in the third quarter of the financial year.
easyJet continues to introduce innovative products to the business travel market including allowing fast track security for its Flexi-
Fare passengers at selected airports. New business friendly routes introduced include Milan Linate to Rome Fiumicino; London
Gatwick to Luxembourg; London Gatwick to Moscow and Manchester to Moscow.
In the last two years, easyJet has seen continued improvements in GDS penetration, take up of Flexi-Fare and TMC contracts which have led to a growth in business passenger volumes. Business passenger volumes in the first half grew by 4.1% year on year. On average, business travellers deliver higher yields than leisure passengers.
2. Maintain cost advantage
easyJet has a cost advantage in the airports it operates from allowing it to offer competitive and affordable fares. Maintaining
easyJet’s cost advantage is a core part of the easyJet strategy. easyJet’s key competitors are the legacy carriers and package
operators who operate out of primary airports. These tend to have older, less efficient aircraft, lower asset utilisation, lower seat
densities with lower load factors and higher levels of fixed costs.
First half cost performance
easyJet’s cost per seat excluding fuel of £38.89 was 3.4% or £1.26 higher year on year on a constant currency basis, 3.1% on a
reported basis.
Unit cost increases were driven by the anticipated increases in airport charges, especially those in Spain and Italy, which were
highlighted in the November 2012 preliminary results statement. Underlying airport charges were £39 million or £1.29 per seat
higher year on year.
The increased costs of disruption and de-icing from adverse weather in the second quarter were partially offset by savings from
benign weather in the first quarter. easyJet cancelled 436 flights in the first half of the year against 384 flights in the more benign

Page 6
2012. Disruption costs were £1.4 million higher driven by increased EU261 passenger compensation payments, whilst de-icing
costs driven by the cold weather were £6.3 million higher.
Cost per seat pressures were offset by the increased proportion of larger A320 aircraft, which has approximately 7-8% lower cost
per seat than an A319 aircraft; shorter average sector lengths and the easyJet lean programme.
Operational performance
A strong operational performance is critical to easyJet maintaining its cost performance. Ensuring aircraft depart on time minimises the costs of disruption and is also a key driver of customer satisfaction and encourages repeat purchases. easyJet’s on-time performance in the first half of the financial year was impacted by the return to more typical winter weather in the
second quarter, with increased incidents of frost and snowfalls against the same period last year. Cancellations in the second
quarter rose from 148 in 2012 to 372 in the three months to 31 March 2013. However, easyJet’s on-time performance remains
industry leading (5)
.
The impact of the roll-out of allocated seating on our on-time performance has been less than anticipated so far and easyJet
continues to implement changes to its turnaround and boarding procedures as part of the easyJet turn initiative to maintain its
market-leading punctuality.
OTP % arrivals within
15 minutes (6)
October November December January February March H1
F’13 88% 89% 81% 86% 85% 87% 86%
F’12 88% 91% 86% 91% 86% 94% 89%
easyJet lean
easyJet is committed to maintaining its structural cost advantage against the legacy and charter operators who are its major
competitors in the airports it operates from. Under the sponsorship of the Chief Financial Officer, easyJet lean is a programme
designed to ensure unit cost growth excluding fuel is kept below inflation. The focus is on reducing both existing costs and initiatives
designed to keep cost out, with targets set through to 2015 and beyond.
easyJet lean had delivered £99 million of sustainable savings by the end of September 2012 and a further £25 million savings in the
first half of the current financial year. Savings to date have focused on ground handling and from non-regulated airports with further
significant savings extracted from engineering and fuel burn initiatives.
Fleet
In the six months to 31 March 2013, easyJet took delivery of two A320 aircraft under the terms of the Airbus easyJet agreement whilst 6 aircraft were returned to lessors. The total fleet at 31 March 2013 comprised 210 aircraft. In the six months to 30 September 2013, one A319 aircraft will exit with a further 8 A320 deliveries planned. As at 30 September 2013, the fleet will consist of 217 aircraft, with 153 A319’s and 64 A320’s. A further 9 A320 easyJet specification aircraft deliveries are currently planned for delivery by 30 September 2014. This number includes the 3 A320 options easyJet has recently decided to exercise in order to fly the summer 2014 programme. A further 39 Airbus A320 family aircraft options remain providing additional flexibility to easyJet. Committed fleet plan as at 31 March 2013:
Owned Operating
leases Finance Leases Total
Changes since Sep ’12
Future committed
deliveries (7)
Unexercised purchase
rights and options
(8)
easyJet A319
99 49 6 154 (12) - -
easyJet A320
37 14 5 56 18 17 70
GB Airways A320 family
- - - - - 2 -
136 63 11 210 6 19 70

Page 7
easyJet
A320 family
At 31 March 2013 210
At 30 September 2013
217
At 30 September 2014 226
The larger A320 aircraft have been introduced over the last few years with minimal reduction in yields. These aircraft deliver a per
seat cost saving of approximately 7-8% over the A319 aircraft through improved economies of scale, efficiencies in crew,
ownership, fuel and maintenance.
easyJet is in the final stages of the commercial evaluation of the next generation of short-haul engine technology; the process has
been subject to high standards of governance. In the event that the Board of easyJet concludes that an order will be in the interest
of all shareholders, easyJet will bring a proposal to shareholders that will cover both the next generation of deliveries, which are
likely to be after 2017, and a plan for the bridging period from 2015 to 2017.
3. Build strong number 1 and 2 network positions
A significant source of easyJet’s competitive advantage is its pan-European network, which connects more of the top 100 city to city
market pairs than any other airline in Europe (2)
. Additionally, easyJet has built number 1 and number 2 market share positions at its
bases and at key slot-constrained airports such as Gatwick, Paris Orly, Milan Malpensa, Amsterdam and Geneva.
easyJet’s strategy is to continue to build positions of strength in its key markets to take advantage of competitor retrenchment and
to reallocate aircraft to the routes and bases which will deliver the highest return on capital employed.
easyJet regularly reviews its route portfolio and re-orientates its network to optimise returns. Significant changes to the network
include the closure of the Madrid base and the reduction of the number of aircraft based in Liverpool. easyJet dropped 30, or 6%,
of the routes flown over winter 2012 and allocated aircraft to routes with higher potential returns including flights to Moscow from
Manchester and Gatwick and on the important Italian business route from Milan Linate to Rome Fiumicino.
An overview of the developments in each of easyJet’s key markets is shown below.
Country overview
UK (2)
easyJet is the UK’s largest short-haul airline and grew capacity by 2.8% over the winter period. easyJet increased its presence in
Edinburgh, Gatwick, Manchester and Southend with the allocation of additional aircraft and reduced the number of aircraft in
Liverpool and Luton.
In March, easyJet introduced routes to Moscow from Manchester and from Gatwick having won the right to fly from London as part
of a bilateral agreement with Russia. Other significant new routes from the UK include Luxembourg from London Gatwick and Tel
Aviv from Manchester.
easyJet continues to make steady progress in the Business to Business arena in the UK, with 50 deals now signed across UK
corporate clients and leading Travel Management Companies (TMCs).
Switzerland (2)
easyJet is Switzerland’s second largest airline and has the largest share of the short-haul market from Geneva and Basel airports. easyJet operated 21 aircraft out of Switzerland over the winter with two additional aircraft joining the fleet. easyJet increased its capacity in Geneva by 11% in the first half of the financial year and grew by 17% in Basel whilst reducing traffic into Zurich. New routes introduced over the winter season include Basel to Budapest and Brussels and Geneva to Seville and Lille. This summer, easyJet will commence flights from Basel to Antalya and Catania.

Page 8
easyJet is currently working with the Geneva airport authorities as part of the regulatory review process which is expected to continue over the summer period.
France (2)
easyJet continues to grow capacity and market share in France increasing capacity by around 7% this winter with additional aircraft
positioned in its French regional bases in Nice, Toulouse and Lyon. easyJet is the second largest carrier in France with a 13%
market share over winter.
New routes flown this winter include regional France connections including Bordeaux to Lille. This summer will see the introduction
of Paris Charles de Gaulle to Bari and to Corfu, Toulouse to Bastia and increasing frequency on Paris Orly to Rome, an important
business route which now operates 5 times a day.
Contracts have been signed with all the main French corporate travel agents and with a significant proportion of large French blue
chip corporations.
Italy (2)
easyJet is Italy’s third largest carrier with a 12% market share with 24 aircraft based across Milan Malpensa and Rome Fiumicino.
easyJet grew by around 6% in Italy over the winter.
In March, easyJet flew its inaugural flight on the key Italian business route connecting Milan Linate to Rome Fiumicino, having
challenged the Alitalia monopoly with the Italian regulator. Other new routes flown include Turin to London Gatwick and Milan
Malpensa to Sharm El Sheikh. This summer will see inaugural flights on new routes such as Rome Fiumicino to Hamburg and from
Milan Malpensa to Larnaca and to Belgrade.
easyJet has been steadily increasing its brand perception scores in Italy and has increased the brand perception score by 11
percentage points with business travellers.
Germany (2)
easyJet’s presence in Germany is concentrated in Berlin with eight aircraft based in Berlin Schoenfeld this winter. easyJet has a
50% share of Schoenfeld and has a 15% share of the Berlin market.
This winter saw the introduction of routes from Berlin to Marrakech and Edinburgh and from Hamburg to Edinburgh and Rome. Other significant network points to be opened this summer include Berlin to Sofia and London Southend.
easyJet was disappointed with the delay in opening the new Berlin Brandenburg airport and is working with the appropriate
authorities to understand the new timelines and charging structure.
Portugal (2)
easyJet is the second largest carrier in Portugal with a market share of around 14% and is also the second carrier in Lisbon Portela
airport, following the base opening in April 2012. The base launched with two aircraft with a third aircraft added in November 2012
and a fourth aircraft added in March 2013 ahead of the summer season.
This summer, easyJet will start flights from Lisbon into Bilbao and Valencia.
Spain (2)
In December, easyJet closed its Madrid base and now serves Madrid as an inbound carrier from other points on the easyJet
network. Capacity to Spain declined by 6% in the six months ended 31 March 2013, but easyJet still has an 8% share of the
Spanish market.
Routes dropped from Madrid include Naples, Amsterdam, Copenhagen and Venice.
Page 9
4. Disciplined use of capital
easyJet allocates its aircraft and capacity to optimise the returns across its network. In 2012, 56 routes were delivering less than
40% of the average return, by the end of the first half of the financial year there were only 20 routes as 18 routes had improved and
18 routes had been dropped. Routes no longer flown include Liverpool to Brussels, Amsterdam to Barcelona and Brest to Paris
Charles de Gaulle. The Madrid closure was implemented efficiently and the withdrawn capacity was allocated to routes which will
drive higher returns.
easyJet has maintained a strong balance sheet and low gearing and derives a competitive advantage through access to funding at
a lower cost. Over the cycle, easyJet is committed to earning returns in excess of its cost of capital, and intends to fund both
aircraft purchases and dividends from the cash generated from the business.
easyJet has the following targets to ensure its capital structure remains both robust and efficient:
a maximum gearing of 50% giving investors and finance providers assurance that easyJet will not over-leverage;
a limit of £10 million net debt per aircraft; and
a minimum £4 million liquidity per aircraft.
These measures allow easyJet to withstand external shocks such as an extended closure of airspace, significant fuel price
increases or a sustained period of low yields whilst being in a position to drive growth and returns for shareholders.
Further to the January 2013 IMS, easyJet has signed sale and leaseback agreements for 12 new A320 and 12 of the oldest A319
aircraft, using a structure which conserves the operational benefits of leasing while minimising financing costs. At 31 March 2013,
payments had been received for eight of the A320 and six of the A319 transactions, with the remaining transactions to be
completed in the second half of the year.
At 31 March 2013, easyJet had cash and money market deposits (excluding restricted cash) of £1,194 million and net cash of £433
million. Adjusted net debt, including leases at seven times at 31 March 2013 was £211 million against £672 million at 31 March
2012.
E. LOOKING FORWARD
Hedging positions
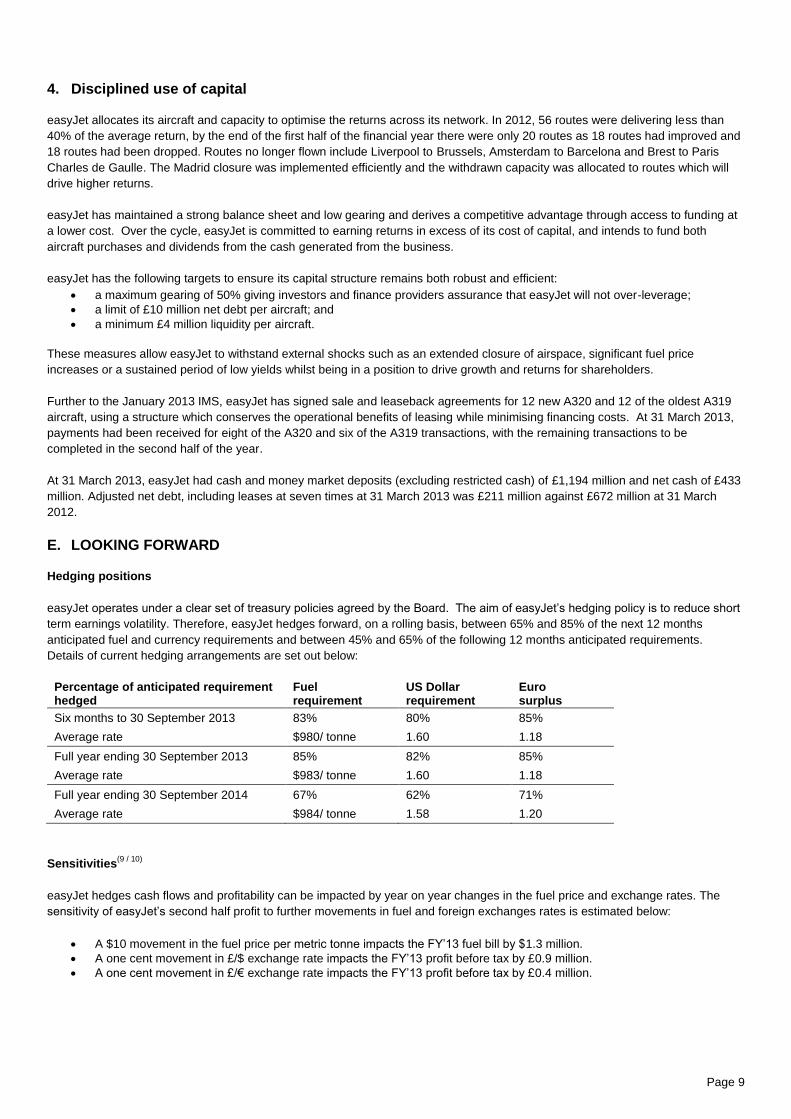
easyJet operates under a clear set of treasury policies agreed by the Board. The aim of easyJet’s hedging policy is to reduce short
term earnings volatility. Therefore, easyJet hedges forward, on a rolling basis, between 65% and 85% of the next 12 months
anticipated fuel and currency requirements and between 45% and 65% of the following 12 months anticipated requirements.
Details of current hedging arrangements are set out below:
Percentage of anticipated requirement hedged
Fuel requirement
US Dollar requirement
Euro surplus
Six months to 30 September 2013 83% 80% 85%
Average rate $980/ tonne 1.60 1.18
Full year ending 30 September 2013 85% 82% 85%
Average rate $983/ tonne 1.60 1.18
Full year ending 30 September 2014 67% 62% 71%
Average rate $984/ tonne 1.58 1.20
Sensitivities
(9 / 10)
easyJet hedges cash flows and profitability can be impacted by year on year changes in the fuel price and exchange rates. The
sensitivity of easyJet’s second half profit to further movements in fuel and foreign exchanges rates is estimated below:
A $10 movement in the fuel price per metric tonne impacts the FY’13 fuel bill by $1.3 million.
A one cent movement in £/$ exchange rate impacts the FY’13 profit before tax by £0.9 million.
A one cent movement in £/€ exchange rate impacts the FY’13 profit before tax by £0.4 million.

Page 10
Outlook
With around 50% of second half seats now booked, trading in the second half of the year continues to be in line with management’s
expectations. The movement of Easter in 2013 into the first half of the financial year is expected to reduce revenue per seat growth
in the second half of the year by one percentage point. Consequently, revenue per seat growth at constant currency for the six
month period to 30 September 2013 is expected to be around 4%.
The impact of increased airport charges particularly in Spain and Italy means that easyJet expects cost per seat (excluding fuel and
currency movements) to increase by around 4% in the second half of the financial year assuming normal levels of disruption and
load factors similar to prior year.
It is estimated that at current exchange rates(9)
and with fuel remaining within its $900 m/t to $1,000 m/t trading range, easyJet’s
unit fuel bill for the second half of the financial year will be up to £10 million favourable year on year. Using current rates(9)
, it is
estimated that year on year exchange rate movements (including those related to fuel) will have an adverse impact of up to £5-10
million in the second half of the financial year.
Whilst there is always the potential for unexpected events to impact short term financial performance, the outlook for the second
half of the financial year combined with the strong reduction in first half losses means that easyJet expects to deliver improved
returns and profitability for the year ending 30 September 2013.
(1) ROCE shown on a lease adjusted basis with aircraft operating leases capitalised at seven times the annual lease rental. (2) Source: market share data from OAG. Size of European market and easyJet routes based on internal easyJet definition. Historic data
based on April download for the six months to 31 March 2013. (3) Source: EUROCONTROL Seven-Year Forecast (published February 2013). (4) Source: Millward Brown research commissioned by easyJet. (5) Source: independently published on-time performance statistics from flightstats.com. (6) Source: easyJet generated on-time performance figures using internal systems. (7) The 17 future easyJet deliveries and 2 ex-GB Airways deliveries are anticipated to be delivered over the next three financial years; 8 in
FY13 (including one added in April 2013), 9 in FY14. The two aircraft to be delivered as part of a GB Airways commitment are scheduled to arrive in FY15.
(8) Purchase options and rights may be taken on any A320 family aircraft and are valid until 2015. (9) Rates as at 11.00hrs 13 May 2013: Euro to sterling 1.18; US$ to sterling 1.54; Jet fuel cif US$912 per metric tonne. (10) FX sensitivities shown relate to the impact of changes in the fx rate on the unhedged element of currency over and away from the outlook
statement and the rates shown in footnote (9)

Page 11
F. FINANCIAL RESULTS FOR SIX MONTHS ENDED 31 MARCH 2013
Key performance indicators easyJet has delivered a strong financial performance for the six months to 31 March 2013, with loss before tax reducing by 45.5% from £112 million (£3.87 per seat) to £61 million (£2.04 per seat). Despite the continued economic downturn in Europe, easyJet has achieved revenue growth of 9.3% driven by an increase in load factor and improved ticket prices. This was partly reduced by the negative impact of foreign exchange rate movements in the period. Loss after tax was £47 million, an improvement of 47.8% compared to £90 million in the prior half year.
Return on capital employed and capital structure
2013 2012 Change
ROCE (0.9%) (2.8%) +1.9ppt
Gearing 11% 31% (20.0ppt)
Return on capital employed for the period was (0.9%), an improvement of 1.9 percentage points as a result of the reduced losses in the period. Average adjusted capital employed remained in line with the last half year. Gearing has decreased significantly to 11% (2012: 31%) driven by improved cash flow performance, proceeds from sale and leaseback transactions and the release of restricted cash. Total shareholder return
The market based measure of total shareholder return for the period 1 October 2012 to 22 March 2013, showed TSR performance
of 70.4%. The Company’s performance is measured against a comparator group consisting of UK listed companies ranked, as at 1
October 2012, in the positions FTSE 51 to 150 on the basis that they are broadly of a similar size. Based on the performance to 22
March 2013, easyJet’s ranking is in the upper quartile of the group.
Financial performance per seat
2013 2012
£ million £ per seat Pence per ASK
£ million £ per seat Pence per ASK
Total revenue 1,601 53.39 5.12 1,465 50.47 4.76
Operating costs excluding fuel 1,042 34.75 3.33 982 33.82 3.19
Fuel 496 16.54 1.59 483 16.64 1.57
Ownership costs 124 4.14 0.40 112 3.88 0.36
Loss before tax (61) (2.04) (0.20) (112) (3.87) (0.36)
Total revenue grew by 9.3% to £1,601 million resulting in growth of 5.8% in revenue per seat to £53.39. At constant currency, revenue per seat grew by 8.6% to £54.80. The revenue increase was driven partly by the increase in both capacity and load factor, however, the primary driver of the revenue growth has been improved yields. This is the result of easyJet’s efficient management of its network, reflected in the slight reduction in the rate of owned aircraft utilisation, combined with the competitor capacity reductions. easyJet has also benefitted from the timing shift of the Easter break in 2013 (from April into March), which has provided the opportunity to further increase yields and load factors. Excluding fuel, operating costs per seat increased by 2.7% to £34.75, and by 4.6% at constant currency. This was mainly driven by a significant increase in charges at regulated airports (primarily in Spain and Italy), with the higher load factor also impacting on the increase. In addition, cost per seat was affected by higher de-icing costs, following one of the longest periods of adverse weather experienced across the network in the last few years. Fuel costs have increased by £13 million as easyJet’s average fuel price increased to $988 per tonne compared with $972 per tonne last half year. However, fuel cost per seat decreased slightly from £16.64 to £16.54 as a result of the increased proportion of A320 aircraft in the fleet and shorter average sector lengths. Ownership costs increased from £3.88 to £4.14 per seat due to the increase in net exchange losses, as sharp movements in the exchange rates were experienced in the current period. However, ownership costs fell by 7.1% at constant currency due to a fall in aircraft leasing costs and other financing costs. Overall, the loss before tax was reduced by £51 million (£1.83 per seat) to £61 million (£2.04 per seat).

Page 12
Using rates enacted at 31 March 2013, the effective tax rate for the period is 23% (compared to 20% in 2012). This is slightly below the standard UK rate of 24% due to deferred tax being provided at 23%. The resultant tax credit in the period was therefore £14 million.
Loss per share and dividends per share
2013 2012 Change
Loss per share 12.0p 21.2p 43.4%
The loss per share reduced by 43.4% to 12.0 pence as a consequence of the improved first half results from the prior period, with a small impact of the share consolidation which took place on 5 March 2012. If the share consolidation had taken place at the beginning of the last half year, the loss per share for the six months to 31 March 2012, on a proforma basis, would be 22.8 pence. In March 2013, easyJet paid an ordinary dividend of 21.5 pence per share (£85 million), an increase of 104.8% from the 2011 ordinary dividend of 10.5 pence per share (£46 million), paid in March 2012. easyJet has increased its dividend policy from one-fifth to one-third of profit after tax.
Exchange rates
The weakening of the Euro against Sterling has resulted in a slight change in the currency profile of the business from prior half year, with a marginally higher percentage of revenue in Sterling than Euro.
Revenue Costs
2013 2012 2013 2012
Sterling 45% 44% 25% 25%
Euro 44% 46% 37% 34%
US dollar 1% - 31% 35%
Other (principally Swiss Franc) 10% 10% 7% 6%
Average effective exchange rates after hedging 2013 2012 Change
Euro – revenue €1.22 €1.16 (5.0%)
Euro – costs €1.22 €1.18 (2.9%)
US Dollar $1.62 $1.60 (1.2%)
Swiss Franc CHF 1.48 CHF 1.44 (2.8%)
Compared with the last half year, the effective Euro rate for revenue weakened by 5.0% and by 2.9% for costs. Accordingly, as the business generates a Euro surplus (Euro revenue exceeds Euro costs), the result of these movements was a net loss of £30 million. During the last half year, the Euro weakened against the Sterling from €1.16/£1 at 1 October 2011 to €1.20/£1 at 31 March 2012, whereas the Euro has strengthened against the Sterling from €1.25/£1 to €1.19/£1 for the period 1 October 2012 to 31 March 2013. Although the business generates Euro surplus and therefore, overall, benefits from Euro strengthening, the recognition of this benefit in the income statement is deferred. This is because bookings are received in advance of travel and therefore the impact of the exchange rate movement is realised over time as revenue is recognised. The total negative impact on loss for the period of changes in exchange rates was £34 million as shown below:
Favourable / (adverse) Euro Swiss franc US dollar Other Total
£ million £ million £ million £ million £ million
Revenue (36) (6) - (1) (43)
Fuel 3 - 4 - 7
Costs excluding fuel 3 1 (1) (1) 2
Total (30) (5) 3 (2) (34)

Page 13
Revenue
2013 2012
£ million £ per seat Pence per ASK
£ million £ per seat Pence per ASK
Seat revenue 1,576 52.56 5.04 1,438 49.53 4.67
Non-seat revenue 25 0.83 0.08 27 0.94 0.09
Total revenue 1,601 53.39 5.12 1,465 50.47 4.76
Revenue per seat improved by 5.8% compared with the prior period to £53.39 reflecting strong performances across the network, with average load factor improving by 1.7 percentage points to 88.6%. Seats flown grew by 3.3% to 30 million, principally in France, Switzerland and the UK. Passengers increased by 5.3% to 26.6 million. Seat revenue contributed 6.1% of the increase in total revenue per seat. Non seat revenue contracted by 10.9% to £0.83 per seat. This was driven in part by the structural decline in the travel insurance market coupled with the transition to new partners for other revenue streams including hotels, which has diluted first half results.
Operating costs excluding fuel
2013 2012 £ million £ per seat Pence per
ASK £ million £ per seat Pence per
ASK
Ground operations 464 15.47 1.49 414 14.23 1.34
Crew 215 7.17 0.69 206 7.11 0.67
Navigation 122 4.07 0.39 123 4.23 0.40
Maintenance 90 2.99 0.29 95 3.29 0.31
Selling and marketing 50 1.68 0.15 55 1.90 0.18
Other costs 101 3.37 0.32 89 3.06 0.29
1,042 34.75 3.33 982 33.82 3.19
Operating costs per seat excluding fuel increased by 2.7% to £34.75 and by 4.6% to £35.36 per seat at constant currency. Ground operations cost per seat increased by 8.7% and by 10.9% excluding the effect of changes in exchange rates. This is largely attributed to the substantial increase in charges at airports operated in Spain by AENA and the implementation of the ’contratto di programma’ programme in Italy, with the higher load factor also contributing to the higher airport charges. The increases in AENA charges were a factor in our decision to close the Madrid base in December 2012. In addition, the prolonged adverse weather experienced this winter had a significant impact on the current period, resulting in an increase in de-icing costs. Crew cost per seat increased by 0.9%, and by 2.1% at constant currency, predominantly driven by the increase in salaries. Navigation costs per seat fell by 3.8% to £4.07 per seat and were down 0.9% at constant currency due to the slightly shorter average sector lengths and the higher proportion of A320 aircraft in the fleet. Maintenance costs have decreased by 9.1% to £2.99 per seat. This decrease reflects the one-off adjustment to the leased engine maintenance provision in the prior half year. Excluding one-off costs, maintenance costs were broadly flat. The cost benefits from reducing the proportion of leased aircraft in the fleet have come to an end and the average age of the fleet is gradually increasing. However, the increased proportion of the larger A320 aircraft, with lower maintenance cost per seat, has partially offset the impact of the ageing fleet. Other costs increased by 10.3% at £3.37 per seat. This is due to higher performance-related employee costs, investment in IT development resources and the increase in disruption costs.
Fuel
2013 2012
£ million £ per seat Pence per ASK
£ million £ per seat Pence per ASK
Fuel 496 16.54 1.59 483 16.64 1.57

Page 14
The average price paid by easyJet increased by $16 from $972 per tonne to $988 per tonne. Total fuel costs have increased by £13 million to £496 million. Fuel cost per seat has decreased by £0.10 as easyJet has benefited from the increased number of A320 aircraft in the fleet and shorter average sector lengths.
Ownership costs
2013 2012
£ million £ per seat Pence per ASK
£ million £ per seat Pence per ASK
Aircraft dry leasing 47 1.56 0.15 50 1.75 0.16
Depreciation 51 1.70 0.16 45 1.57 0.15
Amortisation 5 0.16 0.02 4 0.13 0.01
Interest receivable (3) (0.08) (0.01) (5) (0.18) (0.02)
Interest payable and other financing charges 8 0.27 0.03 12 0.42 0.04
Net exchange losses 16 0.53 0.05 6 0.19 0.02
124 4.14 0.40 112 3.88 0.36
Ownership costs increased from £3.88 to £4.14 per seat, driven mainly by the movement in exchange losses, which has increased from £0.19 per seat to £0.53 per seat. Due to the size of assets and liabilities denominated in currencies other than Sterling, the movements in exchange rates, in particular the sharp movements in the second quarter have resulted in a significant increase in exchange losses. We now operate a standardised fleet with two gauges of Airbus aircraft. Depreciation cost per seat increased by £0.13 to £1.70 driven by the increased proportion of owned aircraft in the fleet during the period in comparison to the same period last year. The leased proportion of the fleet at 31 March 2013 is 30%, which is comparable to the same period last year however, there was a slightly higher average proportion of owned aircraft during the current six month period. Interest payable and other financing charges have decreased by £0.15 per seat to £0.27 per seat as easyJet repaid a number of relatively high-coupon mortgage loans early as part of its liquidity management strategy.
Summary consolidated statement of cash flows
2013 2012 Change
£ million £ million £ million
Net cash generated from operating activities (excluding dividends) 377 288 89
Ordinary dividend paid (85) (46) (39)
Special dividend paid - (150) 150
Net capital expenditure (97) (111) 14
Net loan and lease finance repayment (46) (109) 63
Net decrease in money market deposits 23 63 (40)
Decrease / (increase) in restricted cash 131 (40) 171
Other including the effect of exchange rates (11) (16) 5
Net increase / (decrease) in cash and cash equivalents 292 (121) 413
Cash and cash equivalents at beginning of period 645 1,100 (455)
Cash and cash equivalents at end of period 937 979 (42)
Money market deposits at end of period 257 232 25
Cash and money market deposits at end of period 1,194 1,211 (17)
In line with prior periods, easyJet generated strong operating cash flow in the period driven principally by the growth in forward bookings and revenue per seat. Net capital expenditure primarily comprises the acquisition of two A320 aircraft (compared to three acquired in the same period last year) and the advance purchase of life-limited parts used in engine restoration. Net loan and lease finance repayment comprises £193 million proceeds received in respect of 14 aircraft sale and leaseback transactions entered into in the period, offset by £239 million of debt repayment. This includes mortgage loans on 27 aircraft which

Page 15
were fully repaid, one of which had reached its contractual end, but the remaining 26 of high-coupon mortgage debt, totalling £180 million, were repaid early as part of easyJet’s liquidity management strategy. Restricted cash movement of £131 million relates to previously held restricted cash being recalled to free cash in the period as easyJet made changes in card acquiring service providers, reducing the requirement to hold cash on deposit.
Summary consolidated statement of financial position
31 March 30 September Change
2013 2012 Change
£ million £ million £ million
Goodwill 365 365 -
Property, plant and equipment 2,192 2,395 (203)
Net working capital (1,210) (792) (418)
Restricted cash 30 159 (129)
Net cash / (debt) 433 (74) 507
Current and deferred taxation (182) (227) 45
Other non-current assets and liabilities 39 (32) 71
1,667 1,794 (127)
Opening shareholders' equity 1,794 1,705
(Loss) / profit for the period (47) 255
Ordinary dividend paid (85) (46)
Special dividend paid - (150)
Change in hedging reserve (4) 28
Other movements 9 2
1,667 1,794
Net assets decreased by £127 million driven by the loss for the period and the payment of ordinary dividends. The net book value of property plant and equipment decreased by £203 million driven principally by the sale and operating leaseback transactions on 14 aircraft entered into in the period. Net working capital improved by £418 million to a negative £1,210 million. Passengers pay for their flights in full when booking, therefore the key component of this balance is unearned revenue, which increased by £444 million from £496 million to £940 million. The seasonal nature of the industry leads to a significantly higher unearned revenue balance at 31 March compared to 30 September each year.
Reconciliation of net cash flow to movement in net cash / (debt)
2013 2012 Change
£ million £ million £ million
Cash and cash equivalents 937 979 (42)
Money market deposits 257 232 25
1,194 1,211 (17)
Bank loans (548) (957) 409
Finance lease obligations (213) (212) (1)
(761) (1,169) 408
Net Cash 433 42 391
easyJet ends the year with £1,194 million in cash and money market deposits; a decrease of £17 million from the last half year. Net borrowings decreased by £408 million as easyJet made a significant number of early repayments on relatively high-coupon mortgage loans as part of its liquidity management strategy.

Page 16
Net cash at 31 March 2013 was £433 million compared with £42 million at the last half year, driven by proceeds on sale and leaseback transactions and the release of restricted cash in the period. Adjusted net debt has decreased by £461 million to £211 million. As a result, gearing has reduced significantly from 31% at the last half year to 11%.

Page 17
G. KEY STATISTICS
Operational measures 2013 2012 Change
Seats flown (millions) 30.0 29.0 3.3%
Passengers (millions) 26.6 25.2 5.3%
Load factor 88.6% 86.9% +1.7ppt
Available seat kilometres (ASK) (millions) 31,241 30,785 1.5%
Revenue passenger kilometres (RPK) (millions) 28,395 27,329 3.9%
Average sector length (kilometres) 1,042 1,061 (1.8%)
Sectors 185,329 181,904 1.9%
Block hours 343,552 342,708 0.2%
Number of aircraft owned/leased at end of period 210 204 2.9%
Average number of aircraft owned/leased during period 212.3 202.8 4.7%
Number of aircraft operated at end of period 201 192 4.7%
Average number of aircraft operated during period 193.9 189.6 2.3%
Operated aircraft utilisation (hours per day) 9.7 9.9 (1.4%)
Owned aircraft utilisation (hours per day) 8.9 9.2 (3.7%)
Number of routes operated at end of period 612 562 8.9%
Number of airports served at end of period 134 130 3.1%
Financial measures
Return on capital employed (0.9%) (2.8%) +1.9ppt
Gearing 11% 31% (20ppt)
Loss before tax per seat (£) (2.04) (3.87) 47.3%
Loss before tax per ASK (pence) (0.20) (0.36) 46.3%
Revenue
Revenue per seat (£) 53.39 50.47 5.8%
Revenue per seat at constant currency (£) 54.80 50.47 8.6%
Revenue per ASK (pence) 5.12 4.76 7.7%
Revenue per ASK at constant currency (pence) 5.26 4.76 10.5%
Costs
Per seat measures
Total cost per seat (£) 55.43 54.34 2.0%
Total cost per seat excluding fuel (£) 38.89 37.70 3.1%
Total cost per seat excluding fuel at constant currency (£) 38.96 37.70 3.4%
Operational cost per seat (£) 51.29 50.46 1.6%
Operational cost per seat excluding fuel (£) 34.75 33.82 2.7%
Operational cost per seat excluding fuel at constant currency (£) 35.36 33.82 4.6%
Ownership cost per seat (£) 4.14 3.88 6.6%
Per ASK measures
Total cost per ASK (pence) 5.32 5.12 3.8%
Total cost per ASK excluding fuel (pence) 3.73 3.55 5.0%
Total cost per ASK excluding fuel at constant currency (pence) 3.74 3.55 5.2%
Operational cost per ASK (pence) 4.92 4.76 3.5%
Operational cost per ASK excluding fuel (pence) 3.33 3.19 4.6%
Operational cost per ASK excluding fuel at constant currency (pence) 3.39 3.19 6.5%
Ownership cost per ASK (pence) 0.40 0.36 8.6%

Page 18
H. PRINCIPAL RISKS AND UNCERTAINTIES The risks and uncertainties described below are considered to have the most significant effect on easyJet’s business, financial results and prospects. This list is not intended to be exhaustive. easyJet carries out a detailed risk management process, to ensure that risks are identified and mitigated where possible, although many remain outside the Company’s full control, for example adverse weather, pandemics, acts of terrorism, changes in government regulation and macroeconomic issues. Inherent risk is assessed prior to the determination of all current mitigation. There have been no changes to the risks and uncertainties since last reported in the Annual report and accounts for the year ended 30 September 2012.
Strategic
impact
Risk description and potential impact Current mitigation
SA
FE
TY
FIR
ST
Major safety incident / accident
Failure to prevent a major safety incident or deal with it effectively.
This could adversely affect easyJet’s reputation, and its operational and financial performance.
easyJet’s number one priority is the safety, including security, of its customers and people. easyJet operate a strong safety management system through having:
- Fatigue Risk Management System. - Incident reporting. - Safety Review Board. - Safety Action Group. - Management and control system for easyJet’s operations including weekly operations meetings and reporting. - Regular review by the Board of Directors.
easyJet have response systems in place and provide training for crisis management; combined with full crisis management exercises performed regularly.
Insurance is held which is believed to be in line with
other airlines.
easyJet constantly ensure that security regulations required by relevant Governments are enforced. Crew are trained within the current guidelines.
Security and terrorist threat or attack
Failure to prevent a major security related threat or
attack from either internal or external sources or deal
with it effectively.
This could adversely affect easyJet’s reputation, and
its operational and financial performance.

Page 19
Strategic
impact
Risk description and potential impact Current mitigation O
PE
RA
TIO
NA
L E
XC
EL
LE
NC
E
Impact of mass disruption in peak seasonal months
A number of factors can lead to wide spread disruption to easyJet’s network, including epidemics/pandemics, forces of nature (extreme weather, volcanic ash, etc), acts of terrorism, union activity and strike action. Any widespread disruption could adversely affect easyJet’s reputation, and its operational and financial performance.
If the widespread disruption occurred during easyJet’s peak summer months then easyJet’s financial results would be significantly impacted.
Processes are in place to adapt to wide-spread disruption. A full crisis management exercise is performed regularly and a business continuity programme is in place.
Significant analysis and senior management focus has resulted in crewing solutions being put into place to further recognise the external factors and volatility that impact the airline industry.
easyJet has a strong financial balance sheet allowing us to be in a strong position to withstand potential events that result in periods of reduced revenues.
Single fleet risk
easyJet is currently dependent on Airbus as its sole supplier for aircraft, with two aircraft types (A319 and A320).
There are significant cost and efficiency advantages of a single fleet, however there are two main associated risks:
Technical or mechanical issues that could ground the full fleet or part of the fleet which could cause negative perception by the flying public.
Valuation risks which crystallise on the ownership exit of the aircraft. The main exposure at this time is with the ageing A319 fleet, where easyJet is reliant on the future demand for second-hand aircraft.
The efficiencies achieved by operating a single fleet type are believed to outweigh the risks associated with the company’s single fleet strategy.
Rigorous established maintenance programme is followed.
easyJet constantly reviews the second-hand market and has a number of different options when looking at fleet exit strategies, e.g. easyJet’s targeted fleet mix is a 70:30 split between owned and leased. This facilitates the exit strategy of older A319s, protects residual values as well as increasing flexibility in managing the fleet size.
IT system failure
easyJet is dependent on a number of key IT systems and processes operated at London Luton airport and other key facilities.
A loss of systems and access to facilities including the website, could lead to significant disruption and have an operational, reputational and financial impact.
Key systems are hosted in multiple datacentres in two distinct locations with failover arrangements between them.
A business continuity programme including disaster recovery arrangements is in place. This is being refined to ensure continued alignment to operational requirements.
Alternative sites are available should there be a need to relocate critical staff at short notice due to a loss of facilities.
Dependence on third party service providers
easyJet has entered into agreements with third party service providers for services covering a significant proportion of its operation and cost base.
Failure to adequately manage third party performance would affect easyJet’s reputation and its operational and financial performance. Loss of these contracts, inability to renew or negotiate favourable replacement contracts could have a material adverse effect on future operating costs.
Processes are in place to manage third party service provider performance.
Centralised procurement department that negotiates key contracts.
Most developed markets have suitable alternative service providers.
Industrial action
Large parts of the easyJet workforce are unionised. Similar issues exist at its key third party service providers. If any action was taken this could impact on easyJet’s ability to maintain its flight schedule.
This could adversely affect easyJet’s reputation, and its operational and financial performance.
Employee and union engagement takes place on a regular basis.
Significant analysis and senior management focus has resulted in crewing solutions being put into place to further recognise the external factors and volatility that impact the airline industry.
Page 20
Strategic
impact
Risk description and potential impact Current mitigation E
FF
ICIE
NT
AS
SE
T U
TIL
ISA
TIO
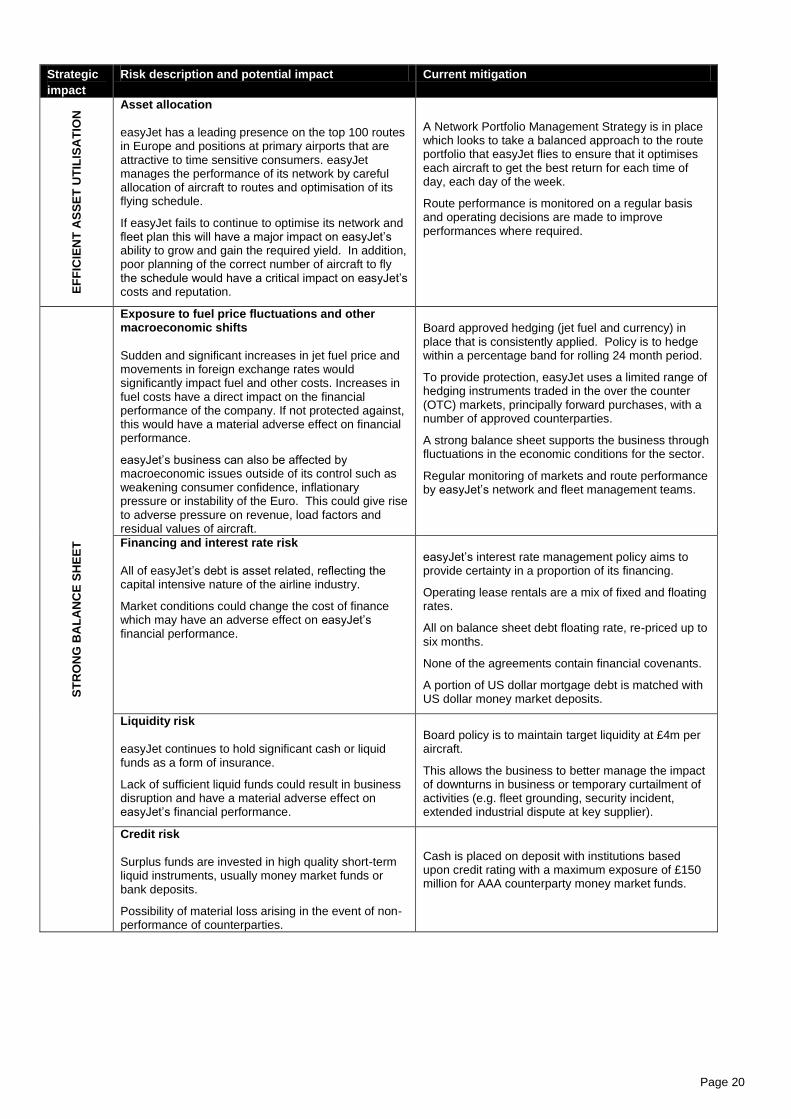
N Asset allocation
easyJet has a leading presence on the top 100 routes in Europe and positions at primary airports that are attractive to time sensitive consumers. easyJet manages the performance of its network by careful allocation of aircraft to routes and optimisation of its flying schedule.
If easyJet fails to continue to optimise its network and fleet plan this will have a major impact on easyJet’s ability to grow and gain the required yield. In addition, poor planning of the correct number of aircraft to fly the schedule would have a critical impact on easyJet’s costs and reputation.
A Network Portfolio Management Strategy is in place which looks to take a balanced approach to the route portfolio that easyJet flies to ensure that it optimises each aircraft to get the best return for each time of day, each day of the week.
Route performance is monitored on a regular basis and operating decisions are made to improve performances where required.
ST
RO
NG
BA
LA
NC
E S
HE
ET
Exposure to fuel price fluctuations and other macroeconomic shifts
Sudden and significant increases in jet fuel price and movements in foreign exchange rates would significantly impact fuel and other costs. Increases in fuel costs have a direct impact on the financial performance of the company. If not protected against, this would have a material adverse effect on financial performance.
easyJet’s business can also be affected by macroeconomic issues outside of its control such as weakening consumer confidence, inflationary pressure or instability of the Euro. This could give rise to adverse pressure on revenue, load factors and residual values of aircraft.
Board approved hedging (jet fuel and currency) in place that is consistently applied. Policy is to hedge within a percentage band for rolling 24 month period.
To provide protection, easyJet uses a limited range of hedging instruments traded in the over the counter (OTC) markets, principally forward purchases, with a number of approved counterparties.
A strong balance sheet supports the business through fluctuations in the economic conditions for the sector.
Regular monitoring of markets and route performance by easyJet’s network and fleet management teams.
Financing and interest rate risk
All of easyJet’s debt is asset related, reflecting the capital intensive nature of the airline industry.
Market conditions could change the cost of finance which may have an adverse effect on easyJet’s financial performance.
easyJet’s interest rate management policy aims to provide certainty in a proportion of its financing.
Operating lease rentals are a mix of fixed and floating rates.
All on balance sheet debt floating rate, re-priced up to six months.
None of the agreements contain financial covenants.
A portion of US dollar mortgage debt is matched with US dollar money market deposits.
Liquidity risk
easyJet continues to hold significant cash or liquid funds as a form of insurance.
Lack of sufficient liquid funds could result in business disruption and have a material adverse effect on easyJet’s financial performance.
Board policy is to maintain target liquidity at £4m per aircraft.
This allows the business to better manage the impact of downturns in business or temporary curtailment of activities (e.g. fleet grounding, security incident, extended industrial dispute at key supplier).
Credit risk
Surplus funds are invested in high quality short-term liquid instruments, usually money market funds or bank deposits.
Possibility of material loss arising in the event of non-performance of counterparties.
Cash is placed on deposit with institutions based upon credit rating with a maximum exposure of £150 million for AAA counterparty money market funds.

Page 21
Strategic
impact
Risk description and potential impact Current mitigation R
EP
UT
AT
ION
AL
RIS
KS
Major shareholder / investor relationship issues
easyJet has a major shareholder (easyGroup Holdings Limited) controlling over 25% of ordinary shares. Shareholder activism could adversely impact the reputation of the Company and cause a distraction to management.
easyJet does not own its company name or branding which is licensed from easyGroup IP Licensing. As for all brand licensees, the easyJet brand could be impacted through actions of the easyGroup or other easyGroup licensees.
easyJet has a very active shareholder engagement programme led by its Investor Relations team. easyJet seeks to engage with easyGroup Holdings Limited on a regular basis alongside all its other major shareholders as part of that programme with a view to ensuring the Board and management team are kept aware of the views of all shareholders.
A team of individuals from the Board and senior management take responsibility for addressing issues arising from the activist approach adopted by the major shareholder. The objective is to address issues when they arise as effectively as possible in order to minimise the disruptive effect on day to day management of the Company’s operation and to anticipate and plan for potential future activism.
Ineffective or non-delivery of the business strategy
A number of key projects have been set up to deliver key elements of the strategy. If these projects do not deliver the benefits and cost savings planned easyJet could fall short of its planned financial results.
Programme management office and experienced project teams have been set up to oversee delivery and track the budget and benefits realisation of all projects.
Steering Group set up with key senior management on it to ensure monitoring, challenge and key decisions are being made at the appropriate level.
Information security
easyJet faces external and internal information security risks. The Company receives most of its revenue through credit card transactions and operates as an e-commerce business.
A security breach could result in a material adverse impact for the business and reputational damage.
Systems are secured and monitored against unauthorised access. This will receive continued focus.
Information security controls are being further enhanced in key areas including third parties, Governance, HR, Physical Security and IT/Technical.
The security of internal systems and easyJet.com are reviewed quarterly through penetration testing.
Employee security sessions are run periodically to maintain staff awareness.
Scanning software for fraudulent customer activity is monitored and controlled by the Revenue Protection team.

Page 22
Strategic
impact
Risk description and potential impact Current mitigation R
EP
UT
AT
ION
AL
RIS
KS
Bribery Act
The Bribery Act came into force in July 2011. To date there are no precedents set in respect of how this will be enforced with respect to corporations. As with all companies, if easyJet were found to be in breach of the Act this could adversely affect us financially and reputationally.
easyJet has a strong ethical tone from the top.
The adoption of appropriate anti-bribery controls has been a key point of focus for the legal compliance programme at easyJet. These have included:
completion of risks assessments to determine specific compliance needs
Introduction of new policies, including an anti-bribery and corruption policy
Development of an online training module and mandatory training for all managers and administrative employees in the UK and across the easyJet network
Targeted face-to-face training for employee groups perceived as higher risk
The adoption of standard anti-bribery clauses for inclusion in supplier contracts
In addition, as part of easyJet’s evaluation of the next generation of short-haul engine technology, additional controls and monitoring have been implemented including a more restrictive gifts and hospitality policy, enhanced recording of contact with potential suppliers, assurance visits to assess standards of anti-bribery controls of potential suppliers and close monitoring of the completion of mandatory compliance training. These extra controls have been the subject of monitoring by an independent third party auditor.
New offerings add complexity to customer experience
easyJet has the ability to deliver value to the customer by ensuring the end to end customer proposition continues to make travel easy.
There is a risk that as easyJet continues to grow it could add additional complexity into its business model.
Rigorous change governance process in place. The customer experience is at the heart of all changes or new offerings considered by easyJet.
Page 23
E
XT
ER
NA
L R
ISK
S
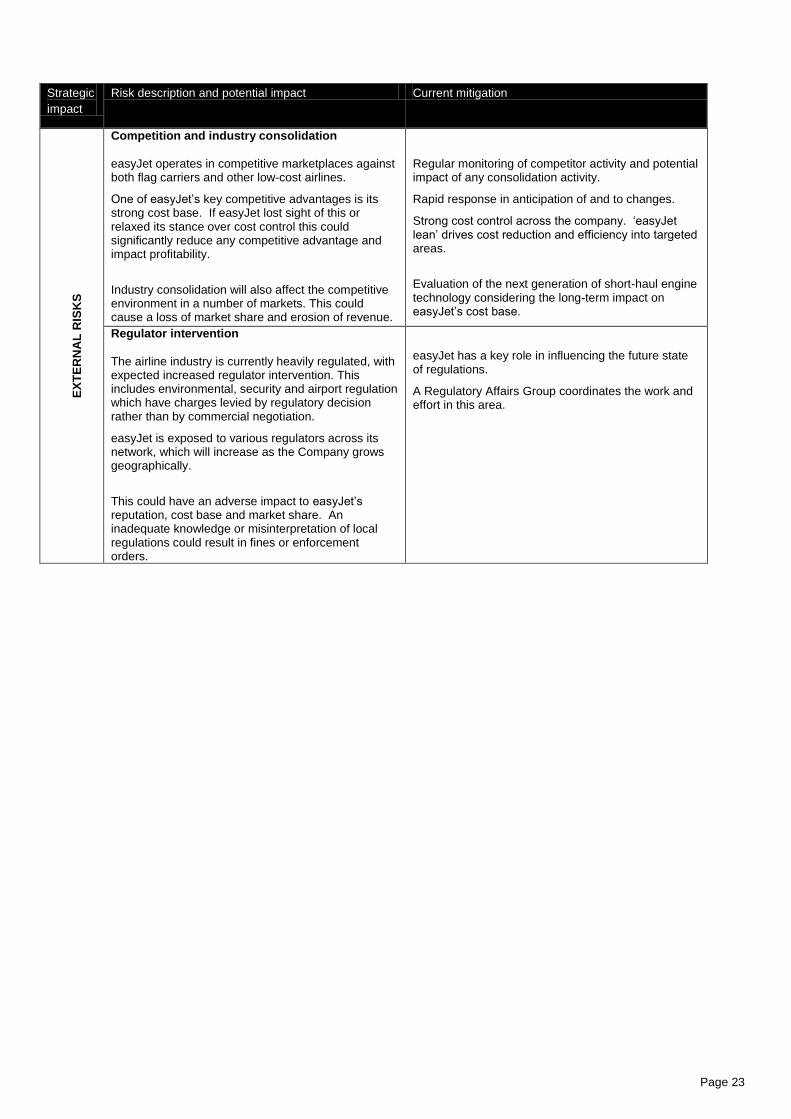
Competition and industry consolidation
easyJet operates in competitive marketplaces against both flag carriers and other low-cost airlines.
One of easyJet’s key competitive advantages is its strong cost base. If easyJet lost sight of this or relaxed its stance over cost control this could significantly reduce any competitive advantage and impact profitability.
Industry consolidation will also affect the competitive environment in a number of markets. This could cause a loss of market share and erosion of revenue.
Regular monitoring of competitor activity and potential impact of any consolidation activity.
Rapid response in anticipation of and to changes.
Strong cost control across the company. ‘easyJet lean’ drives cost reduction and efficiency into targeted areas.
Evaluation of the next generation of short-haul engine technology considering the long-term impact on easyJet’s cost base.
Regulator intervention
The airline industry is currently heavily regulated, with expected increased regulator intervention. This includes environmental, security and airport regulation which have charges levied by regulatory decision rather than by commercial negotiation.
easyJet is exposed to various regulators across its network, which will increase as the Company grows geographically.
This could have an adverse impact to easyJet’s reputation, cost base and market share. An inadequate knowledge or misinterpretation of local regulations could result in fines or enforcement orders.
easyJet has a key role in influencing the future state of regulations.
A Regulatory Affairs Group coordinates the work and effort in this area.
Strategic
impact
Risk description and potential impact Current mitigation

Page 24
I. CONDENSED FINANCIAL INFORMATION
Consolidated income statement (unaudited)
Six months ended 31
March 2013
Six months ended 31
March 2012 Notes £ million £ million
Seat revenue 1,576 1,438
Non-seat revenue 25 27
Total revenue 11 1,601 1,465
Fuel (496) (483)
Ground operations (464) (414)
Crew (215) (206)
Navigation (122) (123)
Maintenance (90) (95)
Selling and marketing (50) (55)
Other costs (101) (89)
EBITDAR 63 -
Aircraft dry leasing (47) (50)
Depreciation 6 (51) (45)
Amortisation of intangible assets (5) (4)
Operating loss (40) (99)
Interest receivable and other financing income 3 5
Interest payable and other financing charges (24) (18)
Net finance charges (21) (13)
Loss before tax (61) (112)
Tax credit 3 14 22
Loss for the period (47) (90)
Loss per share, pence
Basic 4 12.0 21.2

Page 25
Consolidated statement of comprehensive income (unaudited)
Six months ended 31
March 2013
Six months ended 31
March 2012
Notes £million £million
Loss for the period (47) (90)
Other comprehensive (loss) / income
Cash flow hedges
Fair value gains in the period 32 154
Gains transferred to income statement (37) (40)
Related tax 3 1 (28)
(4) 86
Total comprehensive loss for the period (51) (4)
All items in the consolidated statement of comprehensive income go through the income statement
Page 26
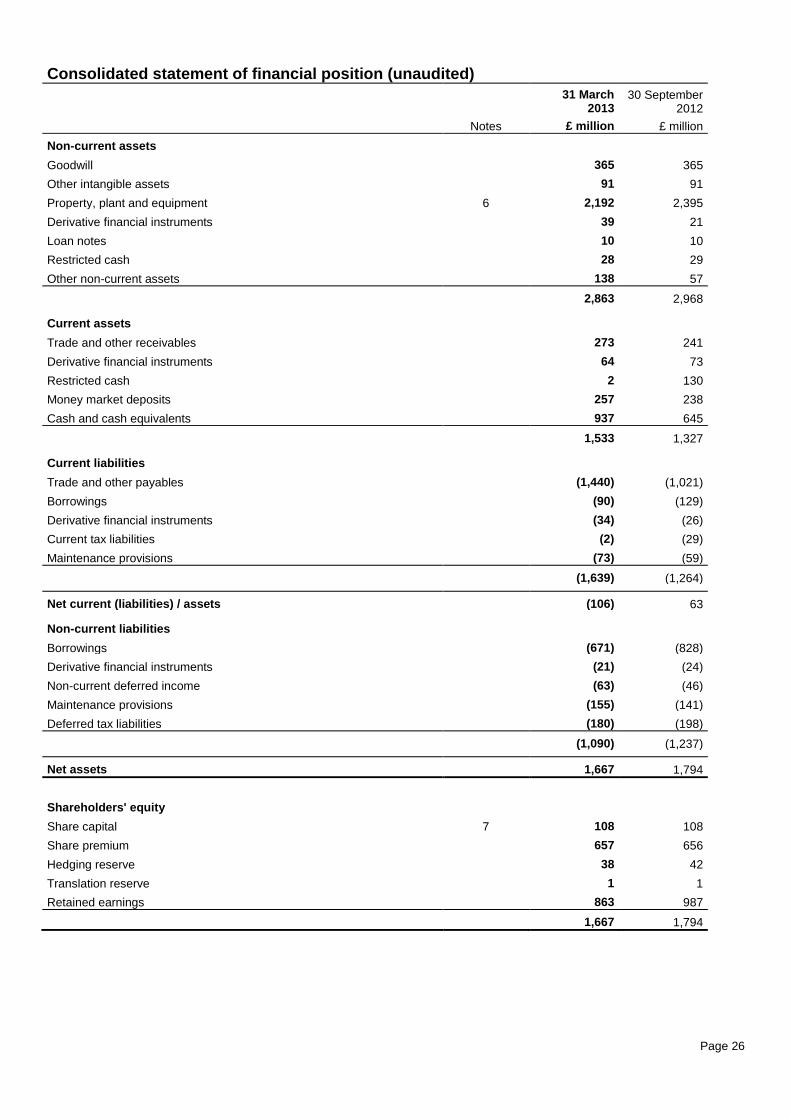
Consolidated statement of financial position (unaudited)
31 March 2013
30 September 2012
Notes £ million £ million
Non-current assets
Goodwill 365 365
Other intangible assets 91 91
Property, plant and equipment 6 2,192 2,395
Derivative financial instruments 39 21
Loan notes 10 10
Restricted cash 28 29
Other non-current assets 138 57
2,863 2,968 Current assets
Trade and other receivables 273 241
Derivative financial instruments 64 73
Restricted cash 2 130
Money market deposits 257 238
Cash and cash equivalents 937 645
1,533 1,327 Current liabilities
Trade and other payables (1,440) (1,021)
Borrowings (90) (129)
Derivative financial instruments (34) (26)
Current tax liabilities (2) (29)
Maintenance provisions (73) (59)
(1,639) (1,264) Net current (liabilities) / assets (106) 63 Non-current liabilities
Borrowings (671) (828)
Derivative financial instruments (21) (24)
Non-current deferred income (63) (46)
Maintenance provisions (155) (141)
Deferred tax liabilities (180) (198)
(1,090) (1,237) Net assets 1,667 1,794
Shareholders' equity
Share capital 7 108 108
Share premium 657 656
Hedging reserve 38 42
Translation reserve 1 1
Retained earnings 863 987
1,667 1,794
Page 27
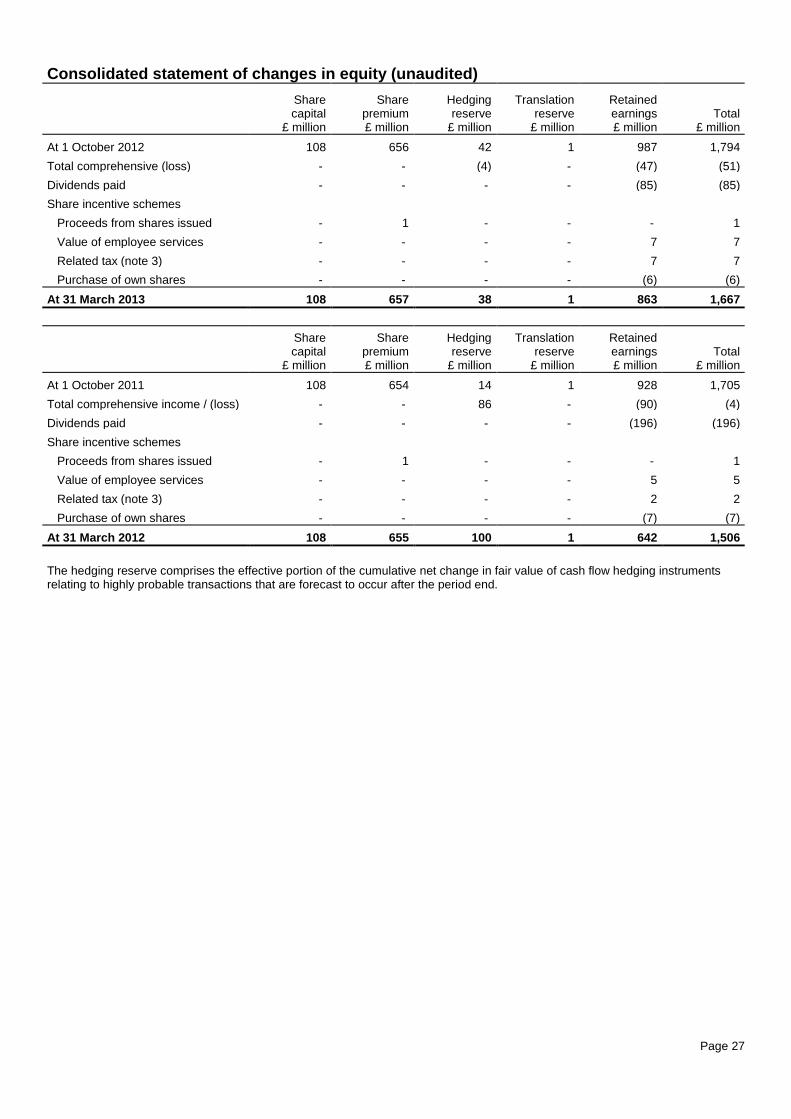
Consolidated statement of changes in equity (unaudited)
Share capital
Share premium
Hedging reserve
Translation reserve
Retained earnings Total
£ million £ million £ million £ million £ million £ million
At 1 October 2012 108 656 42 1 987 1,794
Total comprehensive (loss) - - (4) - (47) (51)
Dividends paid - - - - (85) (85)
Share incentive schemes
Proceeds from shares issued - 1 - - - 1
Value of employee services - - - - 7 7
Related tax (note 3) - - - - 7 7
Purchase of own shares - - - - (6) (6)
At 31 March 2013 108 657 38 1 863 1,667
Share capital
Share premium
Hedging reserve
Translation reserve
Retained earnings Total
£ million £ million £ million £ million £ million £ million
At 1 October 2011 108 654 14 1 928 1,705
Total comprehensive income / (loss) - - 86 - (90) (4)
Dividends paid - - - - (196) (196)
Share incentive schemes
Proceeds from shares issued - 1 - - - 1
Value of employee services - - - - 5 5
Related tax (note 3) - - - - 2 2
Purchase of own shares - - - - (7) (7)
At 31 March 2012 108 655 100 1 642 1,506
The hedging reserve comprises the effective portion of the cumulative net change in fair value of cash flow hedging instruments relating to highly probable transactions that are forecast to occur after the period end.
Page 28
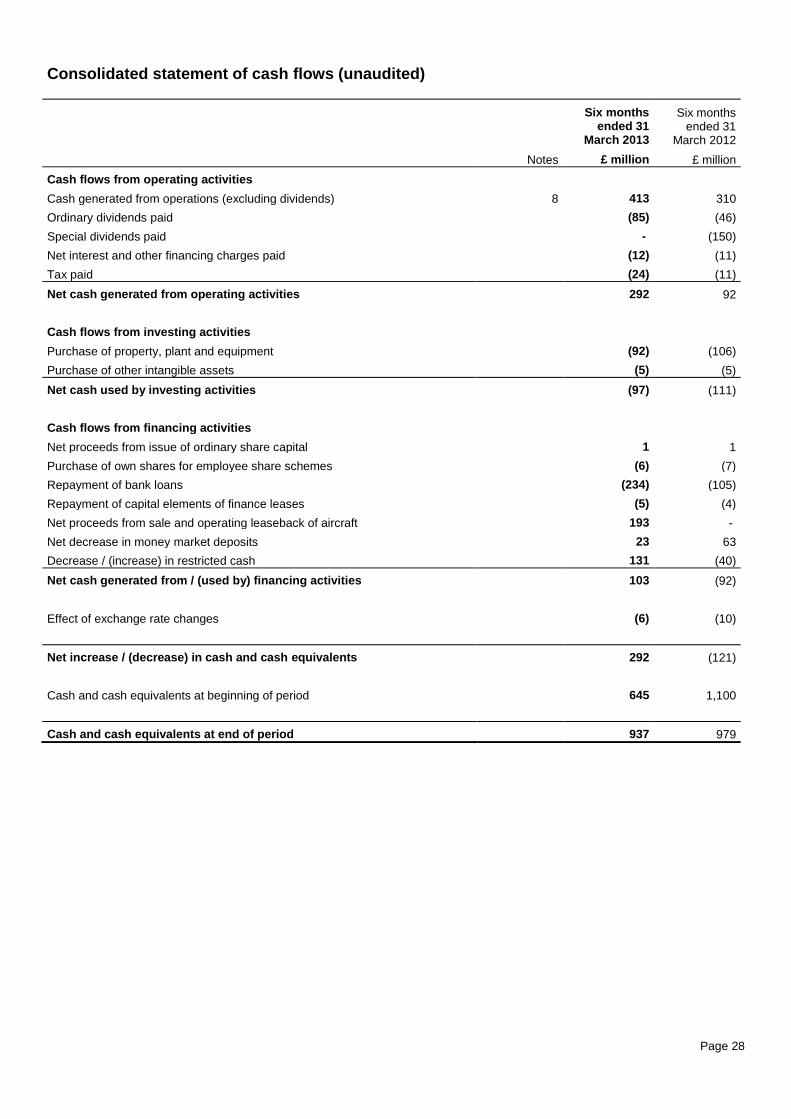
Consolidated statement of cash flows (unaudited)
Six months ended 31
March 2013
Six months ended 31
March 2012
Notes £ million £ million
Cash flows from operating activities
Cash generated from operations (excluding dividends) 8 413 310
Ordinary dividends paid (85) (46)
Special dividends paid - (150)
Net interest and other financing charges paid (12) (11)
Tax paid (24) (11)
Net cash generated from operating activities 292 92
Cash flows from investing activities
Purchase of property, plant and equipment (92) (106)
Purchase of other intangible assets (5) (5)
Net cash used by investing activities (97) (111)
Cash flows from financing activities
Net proceeds from issue of ordinary share capital 1 1
Purchase of own shares for employee share schemes (6) (7)
Repayment of bank loans (234) (105)
Repayment of capital elements of finance leases (5) (4)
Net proceeds from sale and operating leaseback of aircraft 193 -
Net decrease in money market deposits 23 63
Decrease / (increase) in restricted cash 131 (40)
Net cash generated from / (used by) financing activities 103 (92)
Effect of exchange rate changes (6) (10)
Net increase / (decrease) in cash and cash equivalents 292 (121)
Cash and cash equivalents at beginning of period 645 1,100
Cash and cash equivalents at end of period 937 979

Page 29
Notes to the condensed financial information (unaudited) 1. Basis of preparation The condensed financial information has been prepared in accordance with the Disclosure and Transparency Rules of the Financial Conduct Authority and with IAS 34 "Interim Financial Reporting" as adopted by the European Union. It should be read in conjunction with the Annual report and accounts for the year ended 30 September 2012, which were prepared in accordance with International Financial Reporting Standards as adopted by the European Union. The condensed financial information does not constitute statutory accounts within the meaning of sections 434 and 435 of the Companies Act 2006. Statutory accounts for the year ended 30 September 2012 were approved by the Board of Directors on 19 November 2012, and have been delivered to the Registrar of Companies. The report of the auditors was unqualified, and did not contain either an emphasis of matter paragraph or any statement made under section 498 of the Companies Act 2006. In adopting the going concern basis for preparing this condensed financial information, the Directors have considered the business activities, factors likely to affect its future development and performance, as well as easyJet’s principal risks and uncertainties. Based on easyJet’s cash flow forecasts and projections, the Board is satisfied that easyJet will be able to operate within the level of its available facilities and cash for the foreseeable future. For this reason easyJet continues to adopt the going concern basis. The accounting policies adopted are consistent with those described in the Annual report and accounts for the year ended 30 September 2012. There are two amended standards effective for the current financial year, but neither of them has had any material impact on the condensed financial information. 2. Seasonality The airline industry is highly seasonal and demand and yields are significantly higher during the summer. Accordingly revenue and profitability are higher in the second half of the financial year. Historically, easyJet has reported a loss for the first half of the financial year and a profit in the second half. 3. Tax credit
Tax on loss on ordinary activities 2013 2012 £ million £ million
Current tax (credit) / charge (3) 2
Deferred tax (11) (24)
(14) (22)
Effective tax rate 23% 20%
The effective tax rate is lower than the standard rate of corporation tax in the United Kingdom (24%) principally due to deferred tax being provided at lower than the standard rate.
Tax on items recognised directly in other comprehensive income or shareholders' equity
2013 2012
£ million £ million
Credit / (charge) to other comprehensive income
Deferred tax on fair value movements of cash flow hedges 1 (28)
Credit to shareholders' equity
Current tax on share-based payments 1 -
Deferred tax on share-based payments 6 2
7 2

Page 30
4 Loss per share
2013 2012
£ million £ million
Loss for the period (47) (90)
2013 2012
million million
Weighted average number of ordinary shares in issue 393 425
2013 2012 pence pence
Loss per share - basic 12.0 21.2
On 5 March 2012, the shares of easyJet plc were consolidated on an 11 for 12 basis. Diluted loss per share for the six months ended 31 March 2013 and 2012 is not presented as the impact of potential ordinary shares is anti-dilutive.
5. Dividends
The company paid an ordinary dividend of 21.5 pence per share (2012: 10.5 pence per share). The total dividend paid was £85 million (2012: £46 million ordinary dividend and £150 million special dividend).
6. Property, plant and equipment
2013 2012
£ million £ million
At 1 October 2,395 2,149
Additions 97 110
Transfers to intangible assets (5) (4)
Disposals (19) (17)
Aircraft sold and leased back (225) -
Depreciation (51) (45)
At 31 March 2,192 2,193
At 31 March 2013 easyJet is contractually committed to the acquisition of 16 Airbus A320 family aircraft, with a total list price of US$0.9 billion before escalations and discounts for delivery in the period to April 2015. Deposits paid against these aircraft at 31 March 2013 totalled £82 million.
7. Share capital Number Value
2013 2012 2013 2012
million million £ million £ million
At 1 October 396 431 108 108
Share consolidation following special dividend - (36) - -
At 31 March 396 395 108 108
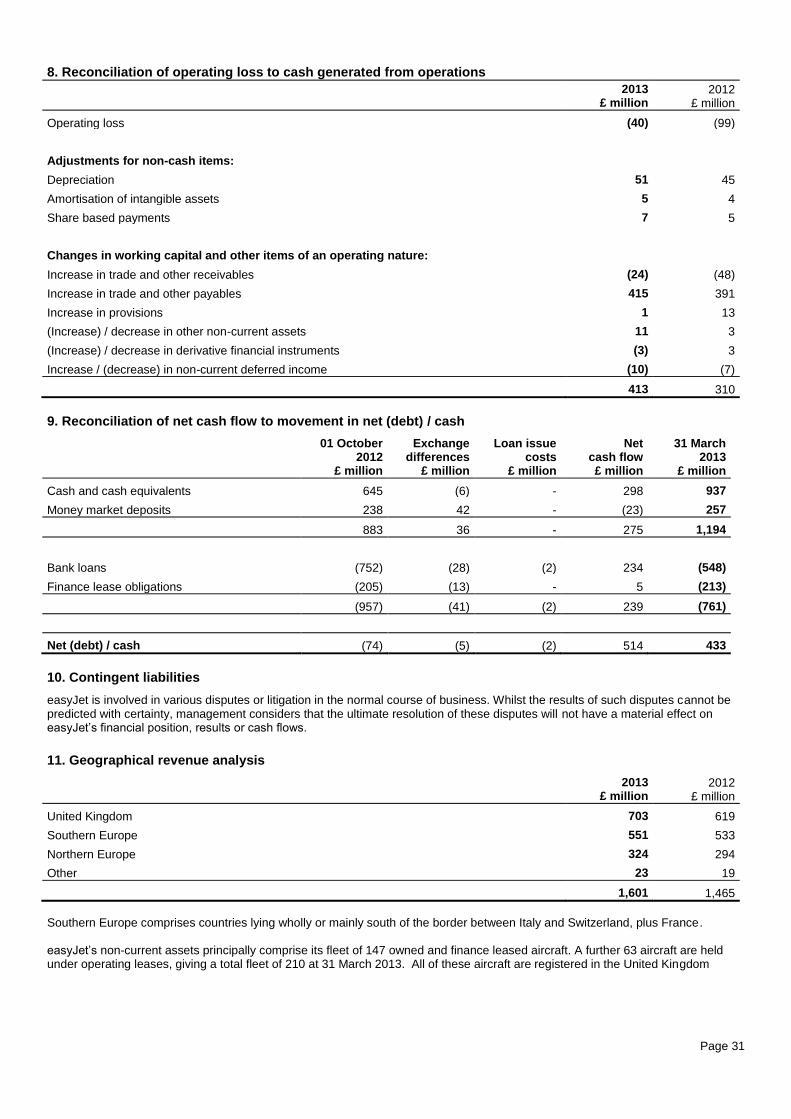
Page 31
8. Reconciliation of operating loss to cash generated from operations
2013 2012 £ million £ million
Operating loss (40) (99)
Adjustments for non-cash items:
Depreciation 51 45
Amortisation of intangible assets 5 4
Share based payments 7 5
Changes in working capital and other items of an operating nature:
Increase in trade and other receivables (24) (48)
Increase in trade and other payables 415 391
Increase in provisions 1 13
(Increase) / decrease in other non-current assets 11 3
(Increase) / decrease in derivative financial instruments (3) 3
Increase / (decrease) in non-current deferred income (10) (7)
413 310
9. Reconciliation of net cash flow to movement in net (debt) / cash
01 October 2012
Exchange differences
Loan issue costs
Net cash flow
31 March 2013
£ million £ million £ million £ million £ million
Cash and cash equivalents 645 (6) - 298 937
Money market deposits 238 42 - (23) 257
883 36 - 275 1,194
Bank loans (752) (28) (2) 234 (548)
Finance lease obligations (205) (13) - 5 (213)
(957) (41) (2) 239 (761)
Net (debt) / cash (74) (5) (2) 514 433
10. Contingent liabilities
easyJet is involved in various disputes or litigation in the normal course of business. Whilst the results of such disputes cannot be predicted with certainty, management considers that the ultimate resolution of these disputes will not have a material effect on easyJet’s financial position, results or cash flows.
11. Geographical revenue analysis
2013 2012 £ million £ million
United Kingdom 703 619
Southern Europe 551 533
Northern Europe 324 294
Other 23 19
1,601 1,465
Southern Europe comprises countries lying wholly or mainly south of the border between Italy and Switzerland, plus France. easyJet’s non-current assets principally comprise its fleet of 147 owned and finance leased aircraft. A further 63 aircraft are held under operating leases, giving a total fleet of 210 at 31 March 2013. All of these aircraft are registered in the United Kingdom
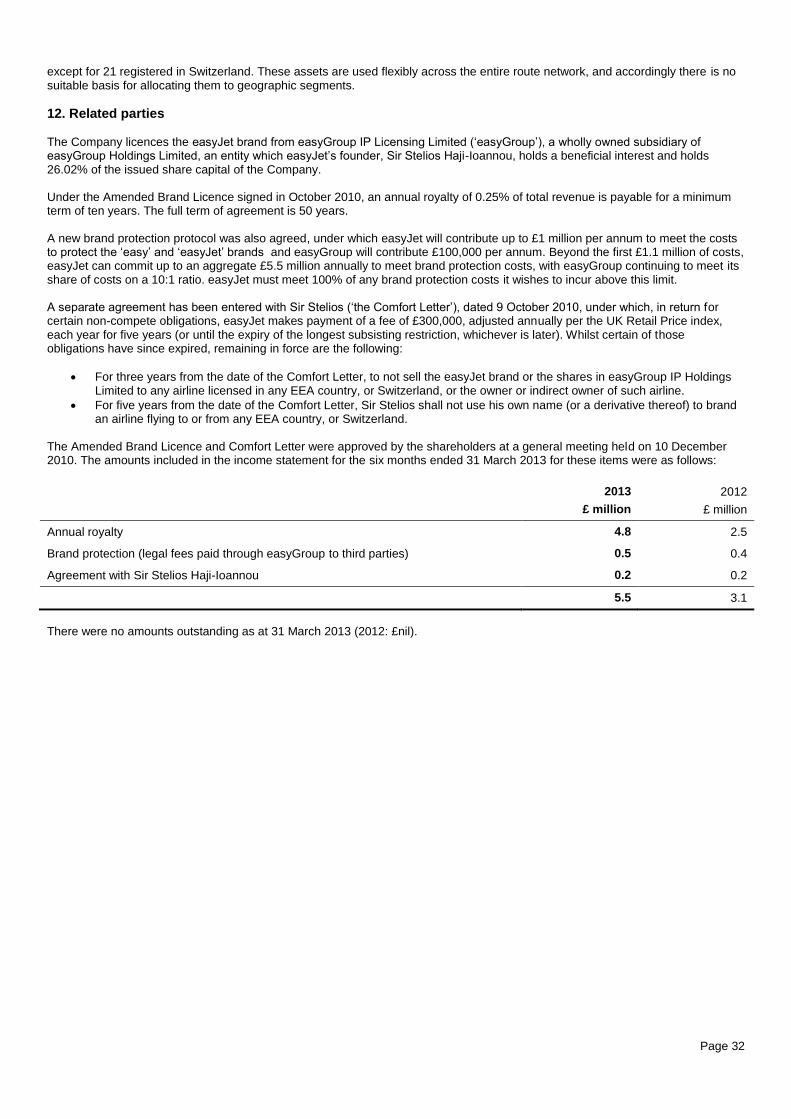
Page 32
except for 21 registered in Switzerland. These assets are used flexibly across the entire route network, and accordingly there is no suitable basis for allocating them to geographic segments.
12. Related parties The Company licences the easyJet brand from easyGroup IP Licensing Limited (‘easyGroup’), a wholly owned subsidiary of easyGroup Holdings Limited, an entity which easyJet’s founder, Sir Stelios Haji-Ioannou, holds a beneficial interest and holds 26.02% of the issued share capital of the Company. Under the Amended Brand Licence signed in October 2010, an annual royalty of 0.25% of total revenue is payable for a minimum term of ten years. The full term of agreement is 50 years. A new brand protection protocol was also agreed, under which easyJet will contribute up to £1 million per annum to meet the costs to protect the ‘easy’ and ‘easyJet’ brands and easyGroup will contribute £100,000 per annum. Beyond the first £1.1 million of costs, easyJet can commit up to an aggregate £5.5 million annually to meet brand protection costs, with easyGroup continuing to meet its share of costs on a 10:1 ratio. easyJet must meet 100% of any brand protection costs it wishes to incur above this limit. A separate agreement has been entered with Sir Stelios (‘the Comfort Letter’), dated 9 October 2010, under which, in return for certain non-compete obligations, easyJet makes payment of a fee of £300,000, adjusted annually per the UK Retail Price index, each year for five years (or until the expiry of the longest subsisting restriction, whichever is later). Whilst certain of those obligations have since expired, remaining in force are the following:
For three years from the date of the Comfort Letter, to not sell the easyJet brand or the shares in easyGroup IP Holdings Limited to any airline licensed in any EEA country, or Switzerland, or the owner or indirect owner of such airline.
For five years from the date of the Comfort Letter, Sir Stelios shall not use his own name (or a derivative thereof) to brand an airline flying to or from any EEA country, or Switzerland.
The Amended Brand Licence and Comfort Letter were approved by the shareholders at a general meeting held on 10 December 2010. The amounts included in the income statement for the six months ended 31 March 2013 for these items were as follows:
2013
£ million
2012
£ million
Annual royalty 4.8 2.5
Brand protection (legal fees paid through easyGroup to third parties) 0.5 0.4
Agreement with Sir Stelios Haji-Ioannou 0.2 0.2
5.5 3.1
There were no amounts outstanding as at 31 March 2013 (2012: £nil).

Page 33
Statement of Directors’ responsibilities
The Directors are responsible for preparing the interim report in accordance with applicable law and regulations.
The Directors confirm that the condensed consolidated interim financial information has been prepared in accordance with International Accounting Standard 34 as adopted by the European Union. The interim management report includes a fair review of the information required by the Disclosure and Transparency Rules paragraphs 4.2.7 and 4.2.8, namely:
an indication of important events that have occurred during the six months ended 31 March 2013 and their impact on the condensed set of financial information, and a description of the principal risks and uncertainties for the remaining six months of the financial year; and
material related-party transactions during the six months ended 31 March 2013 and any material changes in the related-party transactions described in the last Annual report and accounts.
The Directors of easyJet plc are listed in the Annual report and accounts 2012. Since that date, Sir Michael Rake resigned as a Director and John Barton has been appointed as a Director. A list of current Directors is maintained on the easyJet plc website: www.easyjet.com.
The Directors are responsible for the maintenance and integrity of the Company’s website. Legislation in the United Kingdom governing the preparation and dissemination of financial information may differ from legislation in other jurisdictions.
The interim report was approved by the Board of Directors and authorised for issue on 14 May 2013 and signed on behalf of the Board by:
Carolyn McCall OBE Chris Kennedy
Chief Executive Chief Financial Officer

Page 34
Glossary Aircraft dry / wet leasing Payments to lessors under dry leasing arrangements relate solely to the
provision of an aircraft. Payments to lessors under wet leasing arrangements relate to the provision of aircraft, crew, maintenance and insurance.
Aircraft owned / leased at end of year Number of aircraft owned or on lease arrangements of over one month’s duration at the end of the period.
Available seat kilometres (ASK) Seats flown multiplied by the number of kilometres flown.
Average fare Passenger and ancillary revenue divided by passengers.
Block hours Hours of service for aircraft, measured from the time that the aircraft leaves the terminal at the departure airport to the time that it arrives at the terminal at the destination airport.
Cost per ASK Revenue less profit before tax, divided by available seat kilometres.
Cost per seat Revenue less profit before tax, divided by seats flown.
Cost per seat, excluding fuel Revenue, less profit before tax, plus fuel costs, divided by seats flown.
EBITDAR Earnings before interest, taxes, depreciation, amortisation, aircraft dry leasing costs, and profit or loss on disposal of assets held for sale.
Gearing Net debt (adjusted by adding seven times aircraft dry leasing payments for the year and deducting restricted cash) divided by the sum of shareholders’ equity and adjusted net debt.
Load factor Number of passengers as a percentage of number of seats flown. The load factor is not weighted for the effect of varying sector lengths.
Operated aircraft utilisation Average number of block hours per day per aircraft operated.
Other costs Administrative and operational costs not reported elsewhere, including some employee costs, compensation paid to passengers, exchange gains and losses and the profit or loss on the disposal of property plant and equipment.
Passengers Number of earned seats flown. Earned seats comprises seats sold to passengers (including no-shows), seats provided for promotional purposes and seats provided to staff for business travel.
Profit before tax per seat Profit before tax divided by seats flown.
Return on capital employed (ROCE) excluding operating leases
Normalised profit after tax divided by average net debt plus average shareholders’ equity.
Return on capital employed (ROCE) including operating leases
Normalised profit after tax adjusted for implied interest on operating lease costs, divided by average net debt plus average shareholders’ equity, plus an adjustment to capitalise operating leases at seven times the annual lease rental, in line with market practice.
Return on equity Profit for the year divided by the average of opening and closing shareholders’ equity.
Revenue The sum of passenger revenue and ancillary revenue.
Revenue passenger kilometres (RPK) Number of passengers multiplied by the number of kilometres those passengers were flown.
Revenue per ASK Revenue divided by available seat kilometres.
Revenue per seat Revenue divided by seats flown.
Seats flown Seats available for passengers.
Sector A one-way revenue flight.
Page 35
Independent review report to easyJet plc
Introduction
We have been engaged by the company to review the condensed set of financial information in the half-yearly financial report for the six months ended 31 March 2013, which comprises the Consolidated income statement, Consolidated statement of comprehensive income, Consolidated statement of financial position, Consolidated statement of changes in equity, Consolidated statement of cash flows, and the related notes. We have read the other information contained in the half-yearly financial report and considered whether it contains any apparent misstatements or material inconsistencies with the information in the condensed set of financial information.
Directors’ responsibilities
The half-yearly financial report is the responsibility of, and has been approved by, the Directors. The Directors are responsible for
preparing the half-yearly financial report in accordance with the Disclosure and Transparency Rules of the United Kingdom's
Financial Conduct Authority.
As disclosed in note 1, the annual accounts of the group are prepared in accordance with IFRSs as adopted by the European
Union. The condensed set of financial information included in this half-yearly financial report has been prepared in accordance with
International Accounting Standard 34, "Interim Financial Reporting", as adopted by the European Union.
Our responsibility
Our responsibility is to express to the company a conclusion on the condensed set of financial information in the half-yearly financial
report based on our review. This report, including the conclusion, has been prepared for and only for the company for the purpose
of the Disclosure and Transparency Rules of the Financial Conduct Authority and for no other purpose. We do not, in producing this
report, accept or assume responsibility for any other purpose or to any other person to whom this report is shown or into whose
hands it may come save where expressly agreed by our prior consent in writing.
Scope of review
We conducted our review in accordance with International Standard on Review Engagements (UK and Ireland) 2410, ‘Review of
Interim Financial Information Performed by the Independent Auditor of the Entity’ issued by the Auditing Practices Board for use in
the United Kingdom. A review of interim financial information consists of making enquiries, primarily of persons responsible for
financial and accounting matters, and applying analytical and other review procedures. A review is substantially less in scope than
an audit conducted in accordance with International Standards on Auditing (UK and Ireland) and consequently does not enable us
to obtain assurance that we would become aware of all significant matters that might be identified in an audit. Accordingly, we do
not express an audit opinion.
Conclusion
Based on our review, nothing has come to our attention that causes us to believe that the condensed set of financial information in
the half-yearly financial report for the six months ended 31 March 2013 is not prepared, in all material respects, in accordance with
International Accounting Standard 34 as adopted by the European Union and the Disclosure and Transparency Rules of the United
Kingdom's Financial Conduct Authority.
PricewaterhouseCoopers LLP
Chartered Accountants
St Albans, Hertfordshire
14 May 2013