ebdog - local government association · the project sample used in this report comprises 545...
TRANSCRIPT
National School Delivery Cost Benchmarking Primary, Secondary & SEN Schools
Supported By
A national cost benchmarking study undertaken by Hampshire County Council in conjunction with East Riding of Yorkshire Council and the Education Funding Agency
February 2017
Version 2.0
EBDOG
1 | Hook Infant and Junior School, Hampshire County Council
1

National School Delivery Cost Benchmarking | Primary, Secondary & SEN Schools
INTENTIONALLY BLANK
Page | 2 of 31
February 2017 EBDOG

National School Delivery Cost Benchmarking | Primary, Secondary & SEN Schools
EBDOG Page | 3 of 31
February 2017
Part One | Report Context
Study Background 4
Contributing Authorities 5
Part Two | Primary Schools
Overview 7
Annual Cost Trajectory 8
Alternative Delivery Model Cost Trajectory 9
New Development Summary 10
Re-Build & Extension Summary 12
Refurbishment Summary 14
Part Three | Secondary Schools
Overview 17
Annual Cost Trajectory 18
Re-Build & Extension Summary 19
New Development & Refurbishment Summary 21
Part Four | SEN Schools
Overview 23
Re-Build & Extension Summary 24
New Development & Refurbishment Summary 26
Part Five | Further Information
Future Publications 28
Definitions of Key Terms 29
Publication Contacts 30
Contents
This publication is split into five distinct sections, namely; report context, primary schools, secondary schools, SEN schools and further information. These sections are shown below along with their key outputs.
Part One | Report Context
Rocester School, Staffordshire County Council
545 projects submitted

National School Delivery Cost Benchmarking | Primary, Secondary & SEN Schools
EBDOG Page | 4 of 31
February 2017
This document publishes the results of a national cost benchmarking exercise undertaken by Hampshire County Council in partnership with East Riding of Yorkshire Council on new build, extended and refurbished primary, secondary and SEN schools. This report provides a useful reference point for Local Authorities when establishing their school building costs. As part of the initiative the Local Government Association (LGA) is seeking to encourage greater collaboration between Local Authorities to drive down new and refurbished school costs. As a first step it is planned to run a collaborative workshop to discuss the outputs from this study during 2017. The findings contained within this report have been shared with the Infrastructure and Projects Authority (IPA) which is part of the Cabinet Office, Department for Education (DfE) and Education Funding Agency (EFA). This report is the fifth publication produced for the public sector and is a valuable tool to understand the total costs associated with providing new school places across the country. This study has been undertaken with funding from the LGA and has been conducted in conjunction with the following organisations:
Education Building and Development Officers Group (EBDOG).
National Association of Construction Frameworks (NACF). The project sample used in this report comprises 545 projects from across England, consisting of:
428 primary school projects.
85 secondary school projects.
32 SEN school projects. Common Standard A common standard of cost analysis has been used to capture cost data, ensuring a high level of consistency across the sample, while including detailed cost and background information on each project – allowing the costs to be fully understood on an individual project basis. The data has then been collated at a common price base, in order to compare projects with each other on level terms. The following criteria were used to select projects for this study:
Primary, secondary or SEN school projects.
A permanent new build, extended or refurbished school projects.
Contract formed since 2012.
Full details of how the data has been adjusted can be found on page 29.
Study Background Part One | Report Context
188,000
£3.6 billion
school places
combined project capital value
Industry Summary Recent commentary from the Royal Institution of Chartered Surveyors (RICS) Building Cost Information Service (BCIS) notes that the uncertainty following the outcome of the BREXIT vote and a potential period of uncertainty within the construction sector. The comment goes on to say that the extent of this slowdown will be dependent upon political discussions and outcomes as a result of the exit negotiations.
Whitmore Park Primary, Coventry City Council
National School Delivery Cost Benchmarking | Primary, Secondary & SEN Schools
EBDOG Page | 5 of 31
February 2017
Contributing Authorities Report Context Part One | Report Context
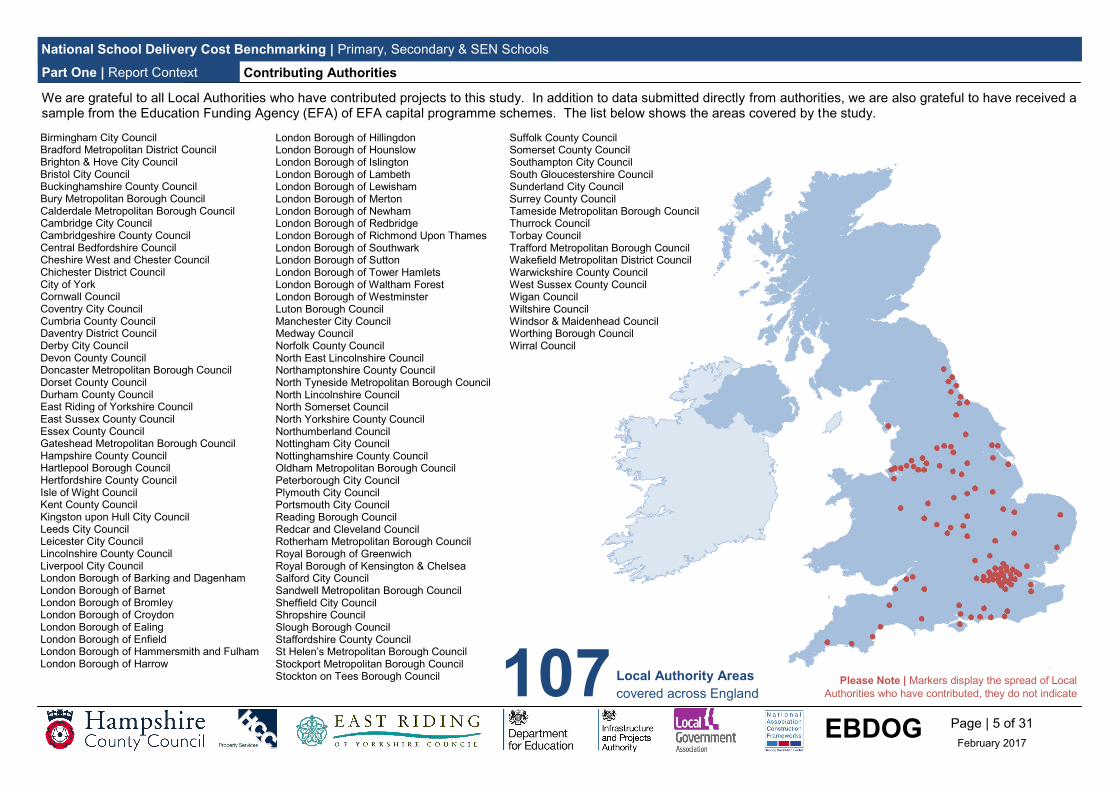
We are grateful to all Local Authorities who have contributed projects to this study. In addition to data submitted directly from authorities, we are also grateful to have received a sample from the Education Funding Agency (EFA) of EFA capital programme schemes. The list below shows the areas covered by the study.
107 Please Note | Markers display the spread of Local
Authorities who have contributed, they do not indicate
Local Authority Areas
covered across England
Birmingham City Council Bradford Metropolitan District Council Brighton & Hove City Council Bristol City Council Buckinghamshire County Council Bury Metropolitan Borough Council Calderdale Metropolitan Borough Council Cambridge City Council Cambridgeshire County Council Central Bedfordshire Council Cheshire West and Chester Council Chichester District Council City of York Cornwall Council Coventry City Council Cumbria County Council Daventry District Council Derby City Council Devon County Council Doncaster Metropolitan Borough Council Dorset County Council Durham County Council East Riding of Yorkshire Council East Sussex County Council Essex County Council Gateshead Metropolitan Borough Council Hampshire County Council Hartlepool Borough Council Hertfordshire County Council Isle of Wight Council Kent County Council Kingston upon Hull City Council Leeds City Council Leicester City Council Lincolnshire County Council Liverpool City Council London Borough of Barking and Dagenham London Borough of Barnet London Borough of Bromley London Borough of Croydon London Borough of Ealing London Borough of Enfield London Borough of Hammersmith and Fulham London Borough of Harrow
London Borough of Hillingdon London Borough of Hounslow London Borough of Islington London Borough of Lambeth London Borough of Lewisham London Borough of Merton London Borough of Newham London Borough of Redbridge London Borough of Richmond Upon Thames London Borough of Southwark London Borough of Sutton London Borough of Tower Hamlets London Borough of Waltham Forest London Borough of Westminster Luton Borough Council Manchester City Council Medway Council Norfolk County Council North East Lincolnshire Council Northamptonshire County Council North Tyneside Metropolitan Borough Council North Lincolnshire Council North Somerset Council North Yorkshire County Council Northumberland Council Nottingham City Council Nottinghamshire County Council Oldham Metropolitan Borough Council Peterborough City Council Plymouth City Council Portsmouth City Council Reading Borough Council Redcar and Cleveland Council Rotherham Metropolitan Borough Council Royal Borough of Greenwich Royal Borough of Kensington & Chelsea Salford City Council Sandwell Metropolitan Borough Council Sheffield City Council Shropshire Council Slough Borough Council Staffordshire County Council St Helen’s Metropolitan Borough Council Stockport Metropolitan Borough Council Stockton on Tees Borough Council
Suffolk County Council Somerset County Council Southampton City Council South Gloucestershire Council Sunderland City Council Surrey County Council Tameside Metropolitan Borough Council Thurrock Council Torbay Council Trafford Metropolitan Borough Council Wakefield Metropolitan District Council Warwickshire County Council West Sussex County Council Wigan Council Wiltshire Council Windsor & Maidenhead Council Worthing Borough Council Wirral Council

National School Delivery Cost Benchmarking | Primary, Secondary & SEN Schools
Page | 6 of 31
February 2017 EBDOG
Part Two Primary Schools
Northern Parade Primary School, Portsmouth City Council

National School Delivery Cost Benchmarking | Primary, Secondary & SEN Schools
EBDOG Page | 7 of 31
February 2017
Overview Part Two | Primary Schools
428primary schools
The primary school sample consists of 428 projects which are split into three school categories as shown in the pie chart (right). This sample features projects from 2012 to 2016 with a total combined capital value of £1.5 billion, comprising:
51 New Development projects.
319 Re-Build & Extension projects.
58 Refurbishment projects. The majority of the primary school sample consists of Re-Build & Extension projects, continuing the trend that Local Authorities are expanding existing school sites to meet the increasing demand for pupil places. However, New Development projects on greenfield sites have seen a 55% increase in number since the last report. This rise tends to reflect the growth in new school places associated with major developments and reduced viability of providing new school places on existing sites. The majority of schemes are procured via a framework arrangement, be that at a national, regional or local level. It has not been possible to draw sufficient trends relating to the cost benefits of these different procurement routes due to the significant variations in the framework arrangements. Over the next pages further commentary is provided for each project category which details cost variations and observations on drivers for costs between projects.
14%
72%
14%
New Development
Re-Build & Extension
Refurbishment
Rushden Primary, Northamptonshire County Council
106,000
£1.5 billion
new primary places
capital value of primary school sample
12%
74%
14%Type of Procurement Route: Primary: Total schools = 250 Single Stage D&B—42 (17%) Single Stage Traditional—77 (31%) Two Stage D&B—75 (30%) Two Stage Traditional—24 (10%) Other—32 (12%)
Pro
cu
rem
en
t R
ou
te
Project Categories

National School Delivery Cost Benchmarking | Primary, Secondary & SEN Schools
EBDOG Page | 8 of 31
February 2017
Annual Cost Trajectory Part Two | Primary Schools
£0
£500
£1,000
£1,500
£2,000
£2,500
£3,000
£3,500
£4,000
2011 2012 2013 2014 2015
Gro
ss C
ost
p
er
m²
Year
New Development Re-Build & Extension
Refurbishment Whole Sample
Primary school gross costs as a whole sample have decreased by 8% since 2012, however over the last two years costs have started to increase. This study has demonstrated a number of reasons for the fluctuations evidenced in the cost trajectory over the last five years (Graph 1, right) which are outlined below. New Development Projects built on greenfield sites with 100% of the works being new build have seen a steady reduction in gross costs over the last five years, equating to a 21% reduction since 2012. Re-Build & Extension Extensions to existing school buildings, new teaching blocks and re-built schools on existing sites have seen an increase in gross costs over the last two years. This study has shown a number of factors influencing this trend:
Smaller projects have been procured over the last 12 months, with the average project GIFA over this period being 900m². This is considerably smaller than the 1,400m² average GIFA seen prior to 2015, which
reduces the cost benefits experienced by larger schemes.
The market has seen 8.9% (RICS, BCIS TPI) inflation and although the figures within this report are indexed for the effect of inflation, we believe a market factor is not yet being reflected in the indices to account for market pressures in terms of labour and material costs.
Refurbishment Due to the varying nature of refurbishment projects it is difficult to draw conclusive results from the cost trajectory. Due to a small sample size in 2016 there is a lower level of confidence in this year banding. Figure 1 (right) displays the average costs per year alongside the number of projects in each year banding.
reduction in gross costs across the whole sample
8%
Graph 1 | Primary School Gross Costs per m²
£0
£500
£1,000
£1,500
£2,000
£2,500
£3,000
£3,500
£4,000
2012 2013 2014 2015 2016
Gro
ss C
ost
p
er
m²
Year
New Development Re-Build & Extension
Refurbishment Whole Sample
Gross
Cost
Sample
Size
Gross
Cost
Sample
Size
Gross
Cost
Sample
Size
Gross
Cost
Sample
Size
2012 £3,784 5 £2,844 27 £2,380 6 £2,883 38
2013 £3,252 10 £2,671 63 £1,643 18 £2,463 91
2014 £2,990 13 £2,554 105 £1,792 13 £2,404 131
2015 £2,882 17 £2,607 84 £2,006 15 £2,453 116
2016 £3,005 6 £3,110 40 £2,075 6 £2,651 52
Whole Sample
Figure 1 | Primary School Gross Costs per m²
Year
New Development Re-Build & Extension Refurbishment

National School Delivery Cost Benchmarking | Primary, Secondary & SEN Schools
EBDOG Page | 9 of 31
February 2017
Alternative Delivery Model Cost Trajectory Part Two | Primary Schools
£2,770£2,561
£2,381
£2,019 £2,047
£0
£500
£1,000
£1,500
£2,000
£2,500
£3,000
2012 2013 2014 2015
Co
st p
er
m2
Year
Annual Gross Costs
Local Authority Gross Costs EFA Gross Costs
Graph 2 | Re-Build & Extension Gross Costs per m²
£2,860
£2,688£2,461
£2,990
£2,601
£2,200 £2,112 £2,091
£2,438
£0
£500
£1,000
£1,500
£2,000
£2,500
£3,000
£3,500
2012 2013 2014 2015 2016
Co
st p
er
m2
Year
2016 trend indicative
Re-Build & Extension projects are formed from a combination of new blocks, extensions to existing schools and re-build projects on the existing site. The sample used for comparing Local Authority with EFA procured schemes has been restricted to projects with a GIFA of over 750m² as none of the EFA projects are less than 1FE within the sample. This cost trajectory includes 77 EFA primary school projects. Graph 2 (right) displays a cost trajectory for these projects alongside those from Local Authorities. Local Authority costs fell steadily between 2012 and 2014, but costs have since seen a rise. This has led to a reduced downward cost trajectory of 9.1% since 2012. EFA average gross costs are lower than Local Authorities but the gap is reducing. EFA projects were 18% lower in 2013 and are currently 6% lower (in 2016). There are a number of factors influencing these costs:
EFA projects are generally larger than Local Authority schemes and therefore benefit from economies of scale.
The EFA has had the benefit of batching projects and a historically keen contractors’ market but has recently experienced a
rising construction market and this study has confirmed that costs have started to increase since 2015. Costs may continue to increase due to a new risk of weaker Sterling(£) leading to material price increases.
Due to the data set collected by this study a large percentage of projects submitted for the 2015 year banding are smaller in size than those in 2014 and 2016. This is evidenced in Graph 2 (right) which shows an increase in Local Authority costs for this year. Due to the small sample size of the 2016 data set it has not been possible to validate the pupil place numbers for these schemes. Figure 2 (right) displays the average costs per year alongside the number of projects in each year banding.
AverageSample
SizeAverage
Sample
SizeAverage
Sample
SizeAverage
Sample
Size
2012 £2,860 18 £2,067 2 £15,341 18 £11,779 2
2013 £2,688 35 £2,200 10 £16,119 35 £11,557 10
2014 £2,461 37 £2,112 30 £14,936 37 £11,237 30
2015 £2,990 30 £2,091 27 £16,956 30 £11,285 27
2016 £2,601 7 £2,438 8 £13,048 7 £14,382 8
Local Authority EFA
Gross Costs per m² Costs Per Pupil Place
Local Authority EFA
Figure 2 | Primary School Costs
Year

National School Delivery Cost Benchmarking | Primary, Secondary & SEN Schools
Key Definitions
Location Factor All costs have been normalised to a common UK average price level using regional location factors published by BCIS to accord with the UK Mean 100. Index taken at November 2016.
Inflation All costs have been updated to the latest Building Cost Information Service (BCIS) ALL-IN Tender Price of Index (TPI) of 1st Quarter 2016 of 273. Index taken at November 2016. This adjusts costs for inflation. VAT is excluded throughout.
Further definitions of key terms and footnotes outlining how the data has been treated can be found on page 29.
Page | 10 of 31
February 2017 EBDOG
average floor area average GIFA per pupil place average contract period average gross cost average nett cost average cost per pupil place
New Development Summary
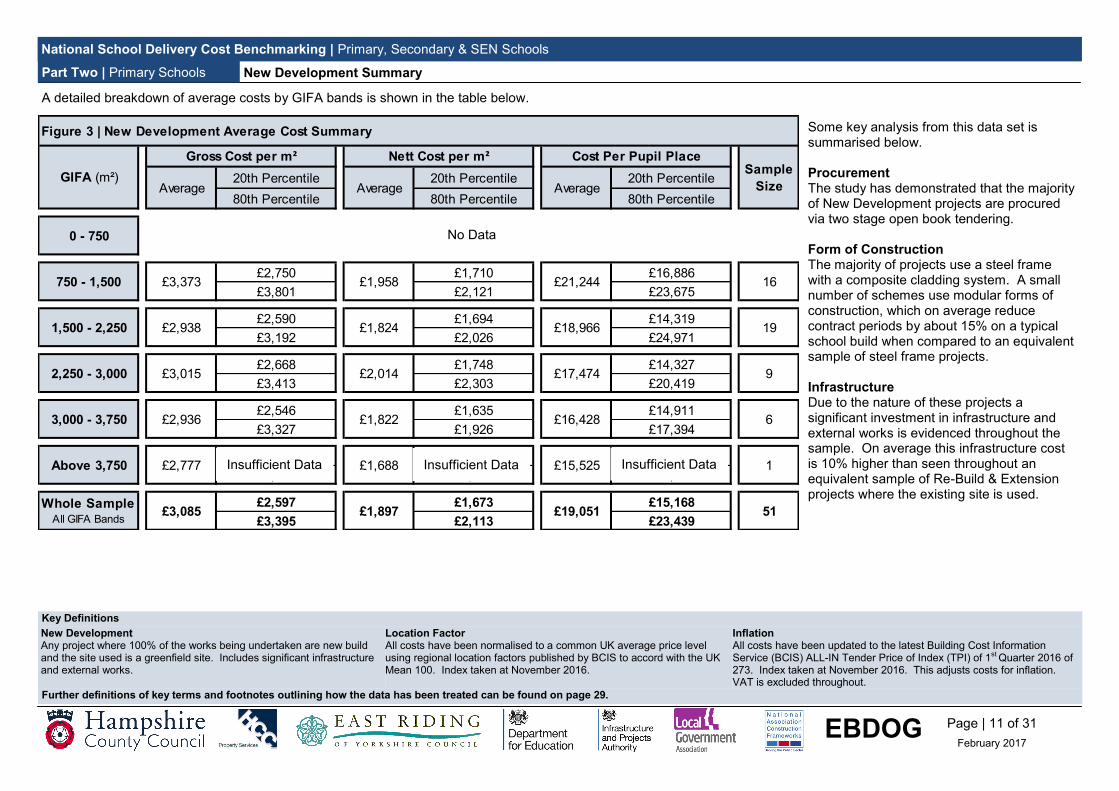
New Development projects are new schools built on greenfield sites, which include significant infrastructure and external work costs. There are 51 such projects in this study. Graph 3 (right) displays the gross and nett costs per m² for these projects. A detailed breakdown is shown on page 11.
Part Two | Primary Schools
New Development Any project where 100% of the works being undertaken are new build and the site used is a greenfield site. Includes significant infrastructure and external works.
2,031m² 5.3m² 48wks £3,085 £1,897 £19,051
Northmoor Academy, Oldham Metropolitan Borough Council
£0
£500
£1,000
£1,500
£2,000
£2,500
£3,000
£3,500
£4,000
£4,500
0 500 1000 1500 2000 2500 3000 3500 4000 4500
Co
st P
er
m²
GIFA (m²)
Nett Cost Per M2 Gross Cost Per M2
Linear (Nett Cost Per M2) Linear (Gross Cost Per M2)
£0
£500
£1,000
£1,500
£2,000
£2,500
£3,000
£3,500
£4,000
£4,500
0 500 1000 1500 2000 2500 3000 3500 4000 4500C
ost
Pe
r m
²
GIFA (m²)
Nett Cost Per M2 Gross Cost Per M2
Linear (Nett Cost Per M2) Linear (Gross Cost Per M2)
Graph 3 | New Development Gross & Nett Costs per m²
£500
£1,500
£2,500
£3,500
£4,500
£5,500
£6,500
500 1000 1500 2000 2500 3000 3500 4000
Co
st P
er
m²
GIFA (m²)
Nett Build Cost Per M2 Gross Cost Per M2
Linear (Nett Build Cost Per M2) Linear (Gross Cost Per M2)
National School Delivery Cost Benchmarking | Primary, Secondary & SEN Schools
Key Definitions
Location Factor All costs have been normalised to a common UK average price level using regional location factors published by BCIS to accord with the UK Mean 100. Index taken at November 2016.
Inflation All costs have been updated to the latest Building Cost Information Service (BCIS) ALL-IN Tender Price of Index (TPI) of 1st Quarter 2016 of 273. Index taken at November 2016. This adjusts costs for inflation. VAT is excluded throughout.
Further definitions of key terms and footnotes outlining how the data has been treated can be found on page 29.
Page | 11 of 31
February 2017 EBDOG
New Development Summary
A detailed breakdown of average costs by GIFA bands is shown in the table below.
Part Two | Primary Schools
New Development Any project where 100% of the works being undertaken are new build and the site used is a greenfield site. Includes significant infrastructure and external works.
Some key analysis from this data set is summarised below. Procurement The study has demonstrated that the majority of New Development projects are procured via two stage open book tendering. Form of Construction The majority of projects use a steel frame with a composite cladding system. A small number of schemes use modular forms of construction, which on average reduce contract periods by about 15% on a typical school build when compared to an equivalent sample of steel frame projects. Infrastructure Due to the nature of these projects a significant investment in infrastructure and external works is evidenced throughout the sample. On average this infrastructure cost is 10% higher than seen throughout an equivalent sample of Re-Build & Extension projects where the existing site is used.
20th Percentile 20th Percentile 20th Percentile
80th Percentile 80th Percentile 80th Percentile
#NUM! #NUM! #NUM!
#NUM! #NUM! #NUM!
£2,750 £1,710 £16,886
£3,801 £2,121 £23,675
£2,590 £1,694 £14,319
£3,192 £2,026 £24,971
£2,668 £1,748 £14,327
£3,413 £2,303 £20,419
£2,546 £1,635 £14,911
£3,327 £1,926 £17,394
£2,777 £1,688 £15,525
£2,777 £1,688 £15,525
£2,597 £1,673 £15,168
£3,395 £2,113 £23,439
Figure 3 | New Development Average Cost Summary
GIFA (m²)
Gross Cost per m² Nett Cost per m² Cost Per Pupil PlaceSample
SizeAverage Average Average
750 - 1,500 £3,373 £1,958 £21,244 16
0 - 750 #REF! #REF! #REF! #REF!
2,250 - 3,000 £3,015 £2,014 £17,474 9
1,500 - 2,250 £2,938 £1,824 £18,966 19
Whole SampleAll GIFA Bands
£3,085 £1,897 £19,051 51
3,000 - 3,750 £2,936 £1,822 £16,428 6
Above 3,750 £2,777 £1,688 £15,525 1
No Data
Insufficient Data Insufficient Data Insufficient Data

National School Delivery Cost Benchmarking | Primary, Secondary & SEN Schools
Key Definitions
Location Factor All costs have been normalised to a common UK average price level using regional location factors published by BCIS to accord with the UK Mean 100. Index taken at November 2016.
Inflation All costs have been updated to the latest Building Cost Information Service (BCIS) ALL-IN Tender Price of Index (TPI) of 1st Quarter 2016 of 273. Index taken at November 2016. This adjusts costs for inflation. VAT is excluded throughout.
Further definitions of key terms and footnotes outlining how the data has been treated can be found on page 29.
Page | 12 of 31
February 2017 EBDOG
average floor area average GIFA per pupil place average contract period average gross cost average nett cost average cost per pupil place
Re-Build & Extension Summary
Re-Build & Extension projects are formed from a combination of new blocks, extensions to existing schools and re-build projects on the existing site. In most cases there are elements of demolition and some projects include refurbishment work to existing buildings. In total, 319 Re-Build & Extension projects were submitted to the study, Graph 4 (right) displays the gross and nett costs per m² for these projects. A detailed breakdown is shown on page 13. The sample includes 81 EFA schemes submitted by the EFA, these projects include local authority contributions where applicable.
Part Two | Primary Schools
Re-Build & Extension Any project where over 50% of the works being undertaken are new build, where the site used is adjacent to or the same as the existing site. Including new build blocks, extensions to existing buildings and rebuilds which include elements of demolition.
1,343m² 5.3m² 42wks £2,685 £1,886 £13,760
£0
£500
£1,000
£1,500
£2,000
£2,500
£3,000
£3,500
£4,000
£4,500
0 500 1000 1500 2000 2500 3000 3500 4000 4500
Co
st P
er
m²
GIFA (m²)
Nett Cost Per M2 Gross Cost Per M2
Linear (Nett Cost Per M2) Linear (Gross Cost Per M2)
£0
£500
£1,000
£1,500
£2,000
£2,500
£3,000
£3,500
£4,000
£4,500
0 500 1000 1500 2000 2500 3000 3500 4000 4500C
ost
Pe
r m
²
GIFA (m²)
Nett Cost Per M2 Gross Cost Per M2
Linear (Nett Cost Per M2) Linear (Gross Cost Per M2)
St Leonards Primary, Devon County Council
£0
£500
£1,000
£1,500
£2,000
£2,500
£3,000
£3,500
£4,000
£4,500
0 500 1000 1500 2000 2500 3000 3500 4000 4500
Co
st P
er
m²
GIFA (m²)
Nett Cost Per M2 Gross Cost Per M2
Linear (Nett Cost Per M2) Linear (Gross Cost Per M2)
Graph 4 | Re-Build & Extension Gross & Nett Costs per m²

National School Delivery Cost Benchmarking | Primary, Secondary & SEN Schools
Key Definitions
Location Factor All costs have been normalised to a common UK average price level using regional location factors published by BCIS to accord with the UK Mean 100. Index taken at November 2016.
Inflation All costs have been updated to the latest Building Cost Information Service (BCIS) ALL-IN Tender Price of Index (TPI) of 1st Quarter 2016 of 273. Index taken at November 2016. This adjusts costs for inflation. VAT is excluded throughout.
Further definitions of key terms and footnotes outlining how the data has been treated can be found on page 29.
Page | 13 of 31
February 2017 EBDOG
Re-Build & Extension Summary
A detailed breakdown of average costs by GIFA bands is shown in the table below.
Part Two | Primary Schools
Re-Build & Extension Any project where over 50% of the works being undertaken are new build, where the site used is adjacent to or the same as the existing site. Including new build blocks, extensions to existing buildings and rebuilds which include elements of demolition.
Some key analysis from this data set is summarised below. Procurement The study demonstrates that the Re-Build & Extension projects are procured via a number of different methods which include single stage and two stage tendering. Form of Construction The majority of projects use a steel frame with a composite cladding system. A small number of schemes use modular forms of construction, which on average reduce contract periods by 11% when compared to an equivalent sample of steel frame projects. Infrastructure Due to the nature of Re-Build & Extension projects, where the existing site is maintained, the costs associated with infrastructure are low, representing 15% of the total project cost on average across the sample.
20th Percentile 20th Percentile 20th Percentile
80th Percentile 80th Percentile 80th Percentile
£2,338 £1,640 £8,826
£3,711 £2,612 £15,827
£2,060 £1,410 £11,209
£3,090 £2,186 £17,526
£1,994 £1,362 £10,666
£2,729 £1,943 £18,321
£1,916 £1,379 £9,200
£2,898 £1,930 £16,834
£1,807 £1,338 £10,176
£3,071 £2,106 £19,622
£2,082 £1,472 £12,760
£2,295 £1,646 £15,561
£2,042 £1,426 £10,092
£3,260 £2,240 £17,544
Figure 4 | Re-Build & Extension Average Cost Summary
GIFA (m²)
Gross Cost per m² Nett Cost per m² Cost Per Pupil PlaceSample
SizeAverage Average Average
0 - 750 £3,015 £2,099 £13,049 115
750 - 1,500 £2,588 £1,853 £14,440 101
1,500 - 2,250 £2,435 £1,686 £14,278 51
2,250 - 3,000 £2,403 £1,681 £13,100 34
3,000 - 3,750 £2,413 £1,679 £14,320 15
Whole SampleAll GIFA Bands
£2,685 £1,886 £13,760 319
Above 3,750 £2,179 £1,561 £14,054 3Insufficient Data Insufficient Data Insufficient Data

National School Delivery Cost Benchmarking | Primary, Secondary & SEN Schools
Key Definitions
Location Factor All costs have been normalised to a common UK average price level using regional location factors published by BCIS to accord with the UK Mean 100. Index taken at November 2016.
Inflation All costs have been updated to the latest Building Cost Information Service (BCIS) ALL-IN Tender Price of Index (TPI) of 1st Quarter 2016 of 273. Index taken at November 2016. This adjusts costs for inflation. VAT is excluded throughout.
Further definitions of key terms and footnotes outlining how the data has been treated can be found on page 29.
Page | 14 of 31
February 2017 EBDOG
average floor area average GIFA per pupil place average contract period average gross cost average cost per pupil place
Refurbishment Summary
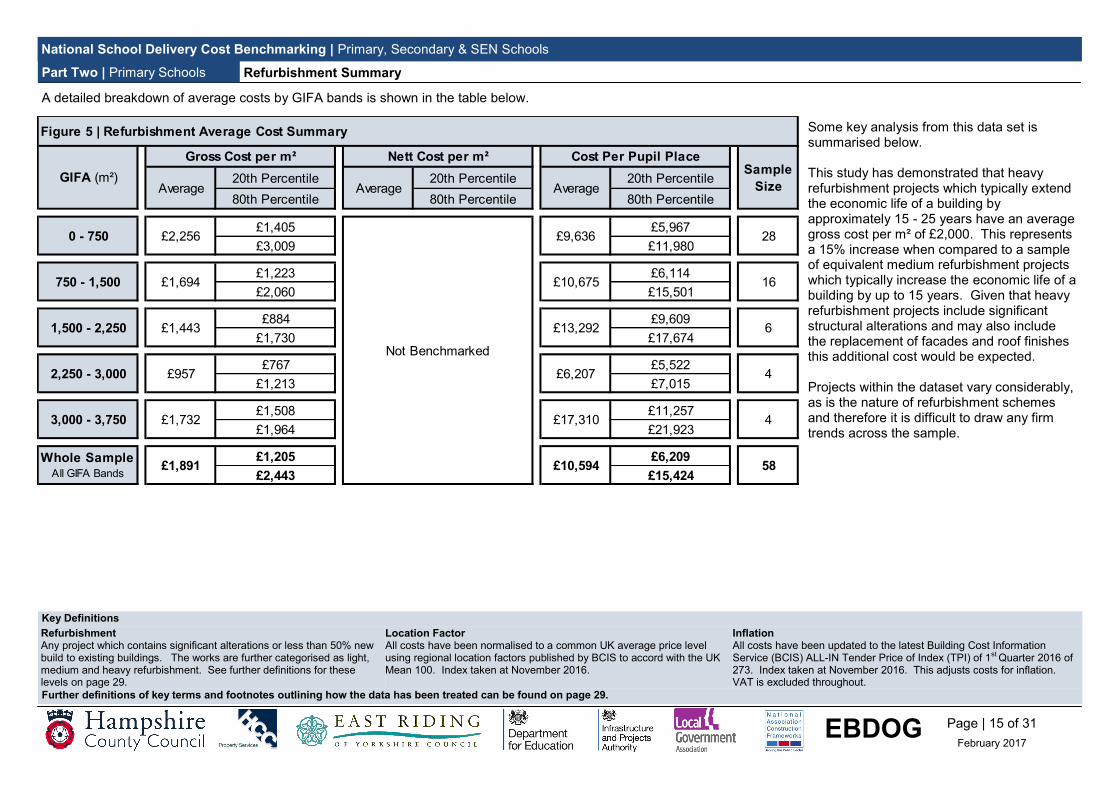
Refurbishment projects vary considerably in nature which makes trends and benchmarking difficult. We have split these schemes into three types of refurbishment project, namely light, medium and heavy to try and limit the variations. In total, 58 refurbishment projects were submitted to the study, Graph 5 (right) displays the gross costs per m² for these projects. A detailed breakdown is shown on page 15. Full definitions of light, medium and heavy refurbishment used for this study can be found on page 29.
Part Two | Primary Schools
Refurbishment Any project which contains significant alterations or less than 50% new build to existing buildings. The works are further categorised as light, medium and heavy refurbishment. See further definitions for these levels on page 29.
1,976m² 3.2m² 39wks £1,891 £10,594
£0
£500
£1,000
£1,500
£2,000
£2,500
£3,000
£3,500
£4,000
£4,500
0 500 1000 1500 2000 2500 3000 3500 4000 4500
Co
st P
er
m²
GIFA (m²)
Nett Cost Per M2 Gross Cost Per M2
Linear (Nett Cost Per M2) Linear (Gross Cost Per M2)
£0
£500
£1,000
£1,500
£2,000
£2,500
£3,000
£3,500
£4,000
£4,500
0 500 1000 1500 2000 2500 3000 3500 4000 4500C
ost
Pe
r m
²
GIFA (m²)
Nett Cost Per M2 Gross Cost Per M2
Linear (Nett Cost Per M2) Linear (Gross Cost Per M2)
Richard Lee Primary, Coventry City Council
£0
£500
£1,000
£1,500
£2,000
£2,500
£3,000
£3,500
£4,000
£4,500
0 500 1000 1500 2000 2500 3000 3500 4000
Co
st P
er
m²
GIFA (m²)
Gross Cost Per M2 Linear (Gross Cost Per M2 )
Graph 5 | Refurbishment Gross Costs per m²
National School Delivery Cost Benchmarking | Primary, Secondary & SEN Schools
Key Definitions
Location Factor All costs have been normalised to a common UK average price level using regional location factors published by BCIS to accord with the UK Mean 100. Index taken at November 2016.
Inflation All costs have been updated to the latest Building Cost Information Service (BCIS) ALL-IN Tender Price of Index (TPI) of 1st Quarter 2016 of 273. Index taken at November 2016. This adjusts costs for inflation. VAT is excluded throughout.
Further definitions of key terms and footnotes outlining how the data has been treated can be found on page 29.
Page | 15 of 31
February 2017 EBDOG
Refurbishment Summary
A detailed breakdown of average costs by GIFA bands is shown in the table below.
Part Two | Primary Schools
Refurbishment Any project which contains significant alterations or less than 50% new build to existing buildings. The works are further categorised as light, medium and heavy refurbishment. See further definitions for these levels on page 29.
20th Percentile 20th Percentile 20th Percentile
80th Percentile 80th Percentile 80th Percentile
£1,405 £5,967
£3,009 £11,980
£1,223 £6,114
£2,060 £15,501
£884 £9,609
£1,730 £17,674
£767 £5,522
£1,213 £7,015
£1,508 £11,257
£1,964 £21,923
£1,205 £6,209
£2,443 £15,424
Figure 5 | Refurbishment Average Cost Summary
GIFA (m²)
Gross Cost per m² Nett Cost per m² Cost Per Pupil PlaceSample
SizeAverage Average Average
750 - 1,500 £1,694 £10,675 16
0 - 750 £2,256 £9,636 28
2,250 - 3,000 £957 £6,207 4
1,500 - 2,250 £1,443 £13,292 6
Whole SampleAll GIFA Bands
£1,891 £10,594 58
3,000 - 3,750 £1,732 £17,310 4
Not Benchmarked
Some key analysis from this data set is summarised below. This study has demonstrated that heavy refurbishment projects which typically extend the economic life of a building by approximately 15 - 25 years have an average gross cost per m² of £2,000. This represents a 15% increase when compared to a sample of equivalent medium refurbishment projects which typically increase the economic life of a building by up to 15 years. Given that heavy refurbishment projects include significant structural alterations and may also include the replacement of facades and roof finishes this additional cost would be expected. Projects within the dataset vary considerably, as is the nature of refurbishment schemes and therefore it is difficult to draw any firm trends across the sample.

National School Delivery Cost Benchmarking | Primary, Secondary & SEN Schools
Page | 16 of 31
February 2017 EBDOG
Part Three Secondary Schools
Starbank School *, Birmingham City Council
* All Through School

National School Delivery Cost Benchmarking | Primary, Secondary & SEN Schools
EBDOG Page | 17 of 31
February 2017
Overview Part Three | Secondary Schools
85secondary schools
The secondary school sample consists of 85 projects which are split into three school categories as shown in the pie chart (right). This sample features projects from 2012 to 2016 with a total combined capital value of £1.2 billion, comprising:
5 New Development projects (1 of which is an All Through school).
78 Re-Build & Extension projects.
2 Refurbishment projects. The majority of the secondary school sample consists of Re-Build & Extension projects, demonstrating that Local Authorities are starting to expand existing school sites to meet the considerable forecast demand for pupil places. The sample has seen a 34% increase in schemes since last year, evidencing the growing demand within the secondary sector. The majority of schemes are procured via a framework arrangement, be that at a national, regional or local level. It has not been possible to draw sufficient trends relating to the cost benefits of these different procurement routes due to the significant variations in the framework arrangements. Over the next pages further commentary is provided for each project category which
details cost variations and observations on drivers for costs between projects. A small sample of New Development and Refurbishment projects has been obtained. It is not possible to draw any conclusions or provide further commentary, but this information is given to show the emergence of the sample.
14%
72%
14%
New Development
Re-Build & Extension
Refurbishment
St Bedes Catholic Voluntary Academy, North Lincolnshire Council
78,000
£1.2 billion
new secondary places
capital value of secondary school sample
Type of Procurement Route: Secondary: Total schools = 37 Single Stage D&B—5 (14%) Single Stage Traditional—5 (14%) Two Stage D&B—14 (38%) Two Stage Traditional—2 (5%) Other—11 (29%)
Pro
cu
rem
en
t R
ou
te
Project Categories
7%
91%
2%
National School Delivery Cost Benchmarking | Primary, Secondary & SEN Schools
EBDOG Page | 18 of 31
February 2017
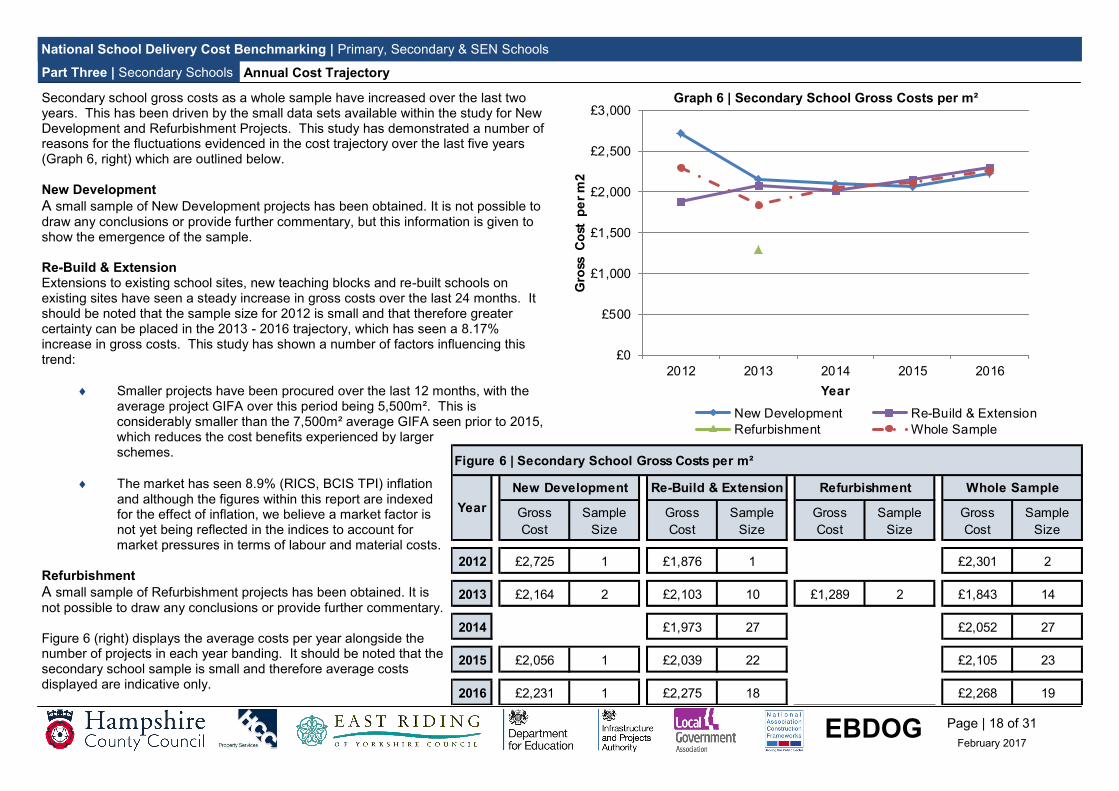
Annual Cost Trajectory Part Three | Secondary Schools
Secondary school gross costs as a whole sample have increased over the last two years. This has been driven by the small data sets available within the study for New Development and Refurbishment Projects. This study has demonstrated a number of reasons for the fluctuations evidenced in the cost trajectory over the last five years (Graph 6, right) which are outlined below. New Development
A small sample of New Development projects has been obtained. It is not possible to draw any conclusions or provide further commentary, but this information is given to show the emergence of the sample. Re-Build & Extension Extensions to existing school sites, new teaching blocks and re-built schools on existing sites have seen a steady increase in gross costs over the last 24 months. It should be noted that the sample size for 2012 is small and that therefore greater certainty can be placed in the 2013 - 2016 trajectory, which has seen a 8.17% increase in gross costs. This study has shown a number of factors influencing this trend:
Smaller projects have been procured over the last 12 months, with the average project GIFA over this period being 5,500m². This is
considerably smaller than the 7,500m² average GIFA seen prior to 2015, which reduces the cost benefits experienced by larger schemes.
The market has seen 8.9% (RICS, BCIS TPI) inflation and although the figures within this report are indexed for the effect of inflation, we believe a market factor is not yet being reflected in the indices to account for
market pressures in terms of labour and material costs. Refurbishment
A small sample of Refurbishment projects has been obtained. It is not possible to draw any conclusions or provide further commentary. Figure 6 (right) displays the average costs per year alongside the number of projects in each year banding. It should be noted that the secondary school sample is small and therefore average costs displayed are indicative only.
£0
£500
£1,000
£1,500
£2,000
£2,500
£3,000
£3,500
£4,000
2011 2012 2013 2014 2015
Gro
ss C
ost
p
er
m²
Year
New Development Re-Build & Extension
Refurbishment Whole Sample
Graph 6 | Secondary School Gross Costs per m²
£0
£500
£1,000
£1,500
£2,000
£2,500
£3,000
2012 2013 2014 2015 2016
Gro
ss C
ost
p
er
m2
Year
Gross
Cost
Sample
Size
Gross
Cost
Sample
Size
Gross
Cost
Sample
Size
Gross
Cost
Sample
Size
2012 £2,725 1 £1,876 1 £0 0 £2,301 2
2013 £2,164 2 £2,103 10 £1,289 2 £1,843 14
2014 £2,098 0 £1,973 27 £0 0 £2,052 27
2015 £2,056 1 £2,039 22 £0 0 £2,105 23
2016 £2,231 1 £2,275 18 £0 0 £2,268 19
Whole Sample
Figure 6 | Secondary School Gross Costs per m²
Year
New Development Re-Build & Extension Refurbishment

National School Delivery Cost Benchmarking | Primary, Secondary & SEN Schools
Key Definitions
Location Factor All costs have been normalised to a common UK average price level using regional location factors published by BCIS to accord with the UK Mean 100. Index taken at November 2016.
Inflation All costs have been updated to the latest Building Cost Information Service (BCIS) ALL-IN Tender Price of Index (TPI) of 1st Quarter 2016 of 273. Index taken at November 2016. This adjusts costs for inflation. VAT is excluded throughout.
Further definitions of key terms and footnotes outlining how the data has been treated can be found on page 29.
Page | 19 of 31
February 2017 EBDOG
average floor area average GIFA per pupil place average contract period average gross cost average nett cost average cost per pupil place
Re-Build & Extension Summary
Re-Build & Extension projects are formed from a combination of new blocks, extensions to existing schools and re-build projects on the existing site. In most cases there are elements of demolition and some projects include refurbishment work to existing buildings. In total, 78 Re-Build & Extension projects were submitted to the study, Graph 7 (right) displays the gross and nett costs per m² for these projects. A detailed breakdown is shown on page 20. The sample includes 51 EFA schemes submitted by the EFA, these projects include local authority contributions where applicable.
Part Three | Secondary Schools
Re-Build & Extension Any project where over 50% of the works being undertaken are new build, where the site used is adjacent to or the same as the existing site. Including new build blocks, extensions to existing buildings and rebuilds which include elements of demolition.
6,528m² 7.5m² 57wks £2,077 £1,529 £15,493
£0
£500
£1,000
£1,500
£2,000
£2,500
£3,000
£3,500
£4,000
£4,500
0 500 1000 1500 2000 2500 3000 3500 4000 4500
Co
st P
er
m²
GIFA (m²)
Nett Cost Per M2 Gross Cost Per M2
Linear (Nett Cost Per M2) Linear (Gross Cost Per M2)
£0
£500
£1,000
£1,500
£2,000
£2,500
£3,000
£3,500
£4,000
£4,500
0 500 1000 1500 2000 2500 3000 3500 4000 4500
Co
st P
er
m²
GIFA (m²)
Nett Cost Per M2 Gross Cost Per M2
Linear (Nett Cost Per M2) Linear (Gross Cost Per M2)Axe Valley Community School, Devon County Council
£0
£500
£1,000
£1,500
£2,000
£2,500
£3,000
£3,500
0 2000 4000 6000 8000 10000 12000 14000C
ost
Pe
r m
²GIFA (m²)
Graph 7 | Re-Build & Extension Gross & Nett Costs per m²

National School Delivery Cost Benchmarking | Primary, Secondary & SEN Schools
Key Definitions
Location Factor All costs have been normalised to a common UK average price level using regional location factors published by BCIS to accord with the UK Mean 100. Index taken at November 2016.
Inflation All costs have been updated to the latest Building Cost Information Service (BCIS) ALL-IN Tender Price of Index (TPI) of 1st Quarter 2016 of 273. Index taken at November 2016. This adjusts costs for inflation. VAT is excluded throughout.
Further definitions of key terms and footnotes outlining how the data has been treated can be found on page 29.
Page | 20 of 31
February 2017 EBDOG
Re-Build & Extension Summary
A detailed breakdown of average costs by GIFA bands is shown in the table below.
Part Three | Secondary Schools
Re-Build & Extension Any project where over 50% of the works being undertaken are new build, where the site used is adjacent to or the same as the existing site. Including new build blocks, extensions to existing buildings and rebuilds which include elements of demolition.
Some key analysis from this data set is summarised below. Procurement The study has demonstrated that the majority of Re-Build & Extension projects are procured via two stage open book tendering. Infrastructure Due to the nature of Re-Build & Extension projects, where the existing site is maintained, the costs associated with infrastructure are low, representing 15% of the total project cost on average across the sample.
20th Percentile 20th Percentile 20th Percentile
80th Percentile 80th Percentile 80th Percentile
£1,790 £1,460 £8,703
£2,768 £2,124 £20,418
£2,053 £1,454 £13,593
£2,630 £2,010 £18,416
£1,795 £1,317 £13,321
£2,148 £1,512 £20,013
£1,717 £1,295 £11,694
£1,993 £1,401 £14,392
£1,877 £1,328 £13,133
£2,194 £1,548 £19,176
£1,908 £1,313 £19,685
£1,908 £1,313 £19,685
#NUM! #NUM! #NUM!
#NUM! #NUM! #NUM!
£1,793 £1,328 £11,880
£2,314 £1,669 £18,760
Whole SampleAll GIFA Bands
£2,077 £1,529 £15,493 78
12,500 - 15,000 £1,908 £1,313 £19,685 1
15,000 - 17,500 #REF! #REF! #REF! #REF!
7,500 - 10,000 £1,839 £1,377 £13,171 14
10,000 - 12,500 £2,028 £1,451 £16,488 15
£2,302 £1,719 £17,138 12
5,000 - 7,500 £2,005 £1,422 £15,940 21
Figure 7 | Re-Build & Extension Average Cost Summary
GIFA (m²)
Gross Cost per m² Nett Cost per m² Cost Per Pupil PlaceSample
SizeAverage Average Average
2,500 - 5,000
0 - 2,500 £2,280 £1,761 £14,446 15
No Data
Insufficient Data Insufficient Data Insufficient Data

National School Delivery Cost Benchmarking | Primary, Secondary & SEN Schools
Key Definitions
Location Factor All costs have been normalised to a common UK average price level using regional location factors published by BCIS to accord with the UK Mean 100. Index taken at November 2016.
Inflation All costs have been updated to the latest Building Cost Information Service (BCIS) ALL-IN Tender Price of Index (TPI) of 1st Quarter 2016 of 273. Index taken at November 2016. This adjusts costs for inflation. VAT is excluded throughout.
Further definitions of key terms and footnotes outlining how the data has been treated can be found on page 29.
Page | 21 of 31
February 2017 EBDOG
New Development & Refurbishment Summary
A small sample of New Development and Refurbishment projects has been obtained. It is not possible to draw any conclusions or provide further commentary, but this information is given to show the emergence of the sample.
Part Three | Secondary Schools
New Development & Refurbishment Category definitions can be found on page 29.
£1,281 £13,376
£1,298 £13,589
Whole SampleAll GIFA Bands
£1,289 £13,483 2
20th Percentile 20th Percentile 20th Percentile
80th Percentile 80th Percentile 80th Percentile
£1,405 £5,967
£3,009 £11,980
£1,223 £6,114
£2,060 £15,501
£884 £9,609
£1,730 £17,674
£767 £5,522
£1,213 £7,015
£1,508 £11,257
£1,964 £21,923
£1,205 £6,209
£2,443 £15,424
Figure 5 | Refurbishment Average Cost Summary
GIFA (m²)
Gross Cost per m² Nett Cost per m² Cost Per Pupil PlaceSample
SizeAverage Average Average
750 - 1,500 £1,694 £10,675 16
0 - 750 £2,256 £9,636 28
2,250 - 3,000 £957 £6,207 4
1,500 - 2,250 £1,443 £13,292 6
Whole SampleAll GIFA Bands
£1,891 £10,594 58
3,000 - 3,750 £1,732 £17,310 4
Not BenchmarkedInsufficient Data Insufficient Data
20th Percentile 20th Percentile 20th Percentile
80th Percentile 80th Percentile 80th Percentile
GIFA (m²)
Gross Cost per m² Nett Cost per m² Cost Per Pupil PlaceSample
SizeAverage Average Average
Figure 8 | New Development Average Cost Summary
20th Percentile 20th Percentile 20th Percentile
80th Percentile 80th Percentile 80th Percentile
Figure 9 | Refurbishment Average Cost Summary
GIFA (m²)
Gross Cost per m² Nett Cost per m² Cost Per Pupil PlaceSample
SizeAverage Average Average
£2,142 £1,544 £17,719
£2,657 £1,850 £22,933
Whole SampleAll GIFA Bands
£2,380 £1,664 £20,235 5

National School Delivery Cost Benchmarking | Primary, Secondary & SEN Schools
Page | 22 of 31
February 2017 EBDOG
Part Four SEN Schools
Hollinwood Academy, Oldham Metropolitan Borough Council

National School Delivery Cost Benchmarking | Primary, Secondary & SEN Schools
EBDOG Page | 23 of 31
February 2017
Overview Part Four | SEN Schools
32SEN schools
The SEN school sample consists of 32 projects which are split into three school categories as shown in the pie chart (right). This sample features projects from 2012 to 2016 with a total combined capital value of £206 million, comprising:
5 New Development projects.
24 Re-Build & Extension projects.
3 Refurbishment projects. While significant demand for primary and secondary school capacity is being seen across the country, this increases the need for specialist teaching facilities and therefore Local Authorities are starting to increase the capacity within SEN school stock. This study evidences that the majority of provision is being made within existing schools, namely Re-Build & Extension projects. The majority of schemes are procured via a framework arrangement, be that at a national, regional or local level. It has not been possible to draw sufficient trends relating to the cost benefits of these different procurement routes due to the significant variations in the framework arrangements. Over the next pages further commentary is provided for each project category which
details cost variations and observations on drivers for costs between projects. A small sample of New Development and Refurbishment projects has been obtained. It is not possible to draw any conclusions or provide further commentary, but this information is given to show the emergence of the sample.
14%
72%
14%
New Development
Re-Build & Extension
Refurbishment
Yewstock Special School, Dorset County Council
3,700
£206 million
new SEN places
capital value of SEN school sample
Type of Procurement Route: SEN: Total schools = 18 Single Stage D&B—3 (17%) Single Stage Traditional—3 (17%) Two Stage D&B—5 (27%) Two Stage Traditional—1 (6%) Other—6 (33%)
Pro
cu
rem
en
t R
ou
te
Project Categories
16%
75%
9%
National School Delivery Cost Benchmarking | Primary, Secondary & SEN Schools
Key Definitions
Location Factor All costs have been normalised to a common UK average price level using regional location factors published by BCIS to accord with the UK Mean 100. Index taken at November 2016.
Inflation All costs have been updated to the latest Building Cost Information Service (BCIS) ALL-IN Tender Price of Index (TPI) of 1st Quarter 2016 of 273. Index taken at November 2016. This adjusts costs for inflation. VAT is excluded throughout.
Further definitions of key terms and footnotes outlining how the data has been treated can be found on page 29.
Page | 24 of 31
February 2017 EBDOG
average floor area average GIFA per pupil place average contract period average gross cost average nett cost average cost per pupil place
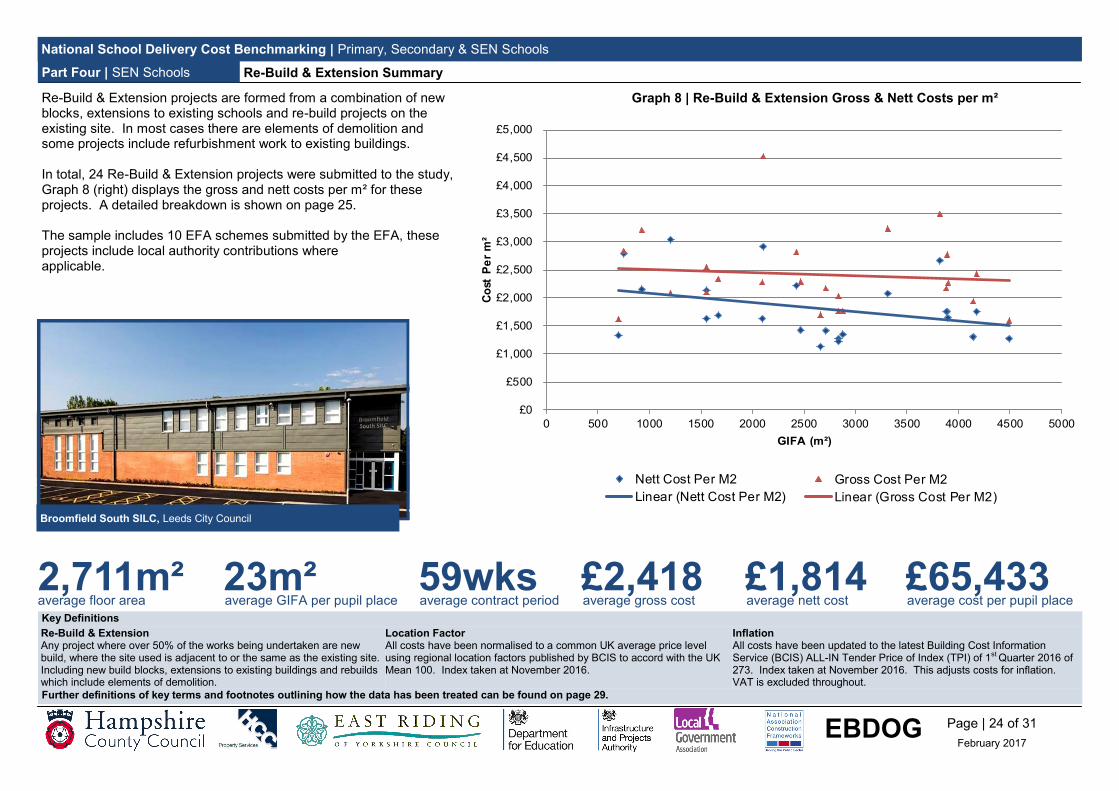
Re-Build & Extension Summary
Re-Build & Extension projects are formed from a combination of new blocks, extensions to existing schools and re-build projects on the existing site. In most cases there are elements of demolition and some projects include refurbishment work to existing buildings. In total, 24 Re-Build & Extension projects were submitted to the study, Graph 8 (right) displays the gross and nett costs per m² for these projects. A detailed breakdown is shown on page 25. The sample includes 10 EFA schemes submitted by the EFA, these projects include local authority contributions where applicable.
Part Four | SEN Schools
Re-Build & Extension Any project where over 50% of the works being undertaken are new build, where the site used is adjacent to or the same as the existing site. Including new build blocks, extensions to existing buildings and rebuilds which include elements of demolition.
2,711m² 23m² 59wks £2,418 £1,814 £65,433
£0
£500
£1,000
£1,500
£2,000
£2,500
£3,000
£3,500
£4,000
£4,500
0 500 1000 1500 2000 2500 3000 3500 4000 4500
Co
st P
er
m²
GIFA (m²)
Nett Cost Per M2 Gross Cost Per M2
Linear (Nett Cost Per M2) Linear (Gross Cost Per M2)
£0
£500
£1,000
£1,500
£2,000
£2,500
£3,000
£3,500
£4,000
£4,500
0 500 1000 1500 2000 2500 3000 3500 4000 4500C
ost
Pe
r m
²
GIFA (m²)
Nett Cost Per M2 Gross Cost Per M2
Linear (Nett Cost Per M2) Linear (Gross Cost Per M2)
Broomfield South SILC, Leeds City Council
Graph 8 | Re-Build & Extension Gross & Nett Costs per m²
£0
£500
£1,000
£1,500
£2,000
£2,500
£3,000
£3,500
£4,000
£4,500
£5,000
0 500 1000 1500 2000 2500 3000 3500 4000 4500 5000
Co
st P
er
m²
GIFA (m²)

National School Delivery Cost Benchmarking | Primary, Secondary & SEN Schools
Key Definitions
Location Factor All costs have been normalised to a common UK average price level using regional location factors published by BCIS to accord with the UK Mean 100. Index taken at November 2016.
Inflation All costs have been updated to the latest Building Cost Information Service (BCIS) ALL-IN Tender Price of Index (TPI) of 1st Quarter 2016 of 273. Index taken at November 2016. This adjusts costs for inflation. VAT is excluded throughout.
Further definitions of key terms and footnotes outlining how the data has been treated can be found on page 29.
Page | 25 of 31
February 2017 EBDOG
Re-Build & Extension Summary
A detailed breakdown of average costs by GIFA bands is shown in the table below.
Re-Build & Extension Any project where over 50% of the works being undertaken are new build, where the site used is adjacent to or the same as the existing site. Including new build blocks, extensions to existing buildings and rebuilds which include elements of demolition.
Part Four | SEN Schools
20th Percentile 20th Percentile 20th Percentile
80th Percentile 80th Percentile 80th Percentile
£1,866 £1,627 £16,018
£2,598 £2,494 £57,419
£2,314 £2,327 £47,070
£2,988 £2,865 £60,920
£2,239 £1,631 £60,531
£2,949 £2,295 £105,751
£1,762 £1,232 £56,967
£2,273 £1,420 £62,123
£3,237 £2,070 £71,403
£3,237 £2,070 £71,403
£1,980 £1,365 £50,149
£2,709 £1,757 £73,397
£1,865 £1,320 £46,978
£2,834 £2,175 £73,178
Figure 10 | Rebuild & Extension Average Cost Summary
GIFA (m²)
Gross Cost per m² Nett Cost per m² Cost Per Pupil PlaceSample
SizeAverage Average Average
750 - 1,500 £2,651 £2,596 £53,995 2
0 - 750 £2,232 £2,060 £36,719 2
2,250 - 3,000 £2,081 £1,434 £57,320 7
1,500 - 2,250 £2,760 £1,999 £85,249 5
Whole SampleAll GIFA Bands
£2,418 £1,814 £64,234 24
3,000 - 3,750 £3,237 £2,070 £71,403 1
Over 3,750 £2,381 £1,734 £65,902 7
Insufficient Data Insufficient Data Insufficient Data
Insufficient Data Insufficient Data Insufficient Data
Insufficient Data Insufficient Data Insufficient Data
National School Delivery Cost Benchmarking | Primary, Secondary & SEN Schools
Key Definitions
Location Factor All costs have been normalised to a common UK average price level using regional location factors published by BCIS to accord with the UK Mean 100. Index taken at November 2016.
Inflation All costs have been updated to the latest Building Cost Information Service (BCIS) ALL-IN Tender Price of Index (TPI) of 1st Quarter 2016 of 273. Index taken at November 2016. This adjusts costs for inflation. VAT is excluded throughout.
Further definitions of key terms and footnotes outlining how the data has been treated can be found on page 29.
Page | 26 of 31
February 2017 EBDOG
New Development & Refurbishment Summary
A small sample of New Development and Refurbishment projects has been obtained. It is not possible to draw any conclusions or provide further commentary, but this information is given to show the emergence of the sample.
Part Four | SEN Schools
New Development & Refurbishment Category definitions can be found on page 29.
£2,191 £1,746 £53,377
£3,486 £2,356 £111,501
Whole SampleAll GIFA Bands
£2,824 £1,984 £94,509 5
20th Percentile 20th Percentile 20th Percentile
80th Percentile 80th Percentile 80th Percentile
Figure 11 | New Development Average Cost Summary
GIFA (m²)
Gross Cost per m² Nett Cost per m² Cost Per Pupil PlaceSample
SizeAverage Average Average
20th Percentile 20th Percentile 20th Percentile
80th Percentile 80th Percentile 80th Percentile
Figure 12 | Refurbishment Average Cost Summary
GIFA (m²)
Gross Cost per m² Nett Cost per m² Cost Per Pupil PlaceSample
SizeAverage Average Average
£1,281 £11,186 £25,361
£1,537 £11,186 £71,348
Whole SampleAll GIFA Bands
£1,413 £11,186 £50,789 3Insufficient Data Insufficient Data Insufficient Data
National School Delivery Cost Benchmarking | Primary, Secondary & SEN Schools
Page | 27 of 31
February 2017 EBDOG
Part Five Further Information
Tweseldown Primary, Hampshire County Council

National School Delivery Cost Benchmarking | Primary, Secondary & SEN Schools
EBDOG Page | 28 of 31
February 2017
We are keen to receive projects for our next publication planned for February 2018 and welcome project submissions from any Local Authority in the United Kingdom. Participating Authorities will be listed in the published report (see page 5), however any data supplied will be treated as commercially confidential and will not be shared with third parties without the submitting Authority providing written approval and / or written acknowledgement. All data submitted remains the property of the submitting Authority. We are keen to obtain further Primary, Secondary and SEN school cost data in particular. All submissions must use our standard form of cost analysis. For further information or to register your interest for the next study please contact Matt Robertson using the details found at the end of this publication.
Future Publications
Summary of Publications
Report Sample
Size Sample Type
Contributing Authorities
April 2013* 45 Primary & Secondary -
November 2013 39 Primary -
June 2014 70 Primary -
January 2015 122 Primary & Secondary 42
February 2016 343 Primary, Secondary & SEN 63
February 2017 545 Primary, Secondary & SEN 107
February 2018* - - -
* Report not currently available.
Images | Current & Previous Reports
Part Five | Further Information
Alfred Sutton Primary, Reading Borough Council
National School Delivery Cost Benchmarking | Primary, Secondary & SEN Schools
EBDOG Page | 29 of 31
February 2017
New Development Any project where 100% of the works being undertaken are new build and the site used is a greenfield site. Includes significant infrastructure and external works.
Re-Build & Extension Any project where over 50% of the works being undertaken are new build, where the site used is adjacent to or the same as the existing site. Including new build blocks, extensions to existing buildings and rebuilds which include elements of demolition.
Refurbishment Any project which contains significant alterations or less than 50% new build to existing buildings. The works are further categorised as light, medium and heavy refurbishment. See further definitions for these levels.
Refurbishment Level - Light Refurbishment Investment focused on common areas and essential repairs only. Extension of economic life is approxi-mately 5 years. Works include strip out of existing space, shell and core refurbishment including cosmetic upgrades. Assumes existing main plant, existing floors and ceilings are retained.
Refurbishment Level - Medium Refurbishment Investment involves full upgrade of the existing building services and finishes but stops short of major structural alterations. Extension of economic life is approximately 15 years. Works include strip out of existing space, shell and core refurbishment including cosmetic upgrades. No major structural or substruc-tural alterations. Existing floors and ceilings are retained and minor repairs only to façade.
Refurbishment Level - Heavy Refurbishment Investment includes significant structural alterations and may also include the replacement of facades and roof finishes. The complete renewal of internal fittings, finishes and MEP systems. The building is typically unoccupied. Extension of economic life is approximately 15 - 25 years. Works include strip out of existing space, shell and core refurbishment including cosmetic upgrades. Replacement to raised floors, ceilings and new services.
Spatial Measures (GIFA) Encompass the most common formats used by clients and industry to benchmark total construction costs, which in the case of schools has been taken as £/m² of the Gross Internal Floor Area (GIFA). This is related to throughout and is the total square metreage of accommodation delivered by a project. For Refurbishment projects the GIFA refers to the percentage of new build floor area only.
Total Project Cost Represents the overall project cost at tender stage, inclusive of fees, external works, abnormal costs, including minor building works and fittings and fixtures. It is inclusive of additions for preliminaries, contingency, overheads and profit.
Nett Cost per m² Represents the tendered cost per m² of GIFA, exclusive of fees, abnormals, external works, minor building works and alterations. It is inclusive of additions for preliminaries, contingency, overheads and profit. Fixed fittings and furnishings are included.
Gross Cost per m² Represents the tendered Total Project Cost per m² of GIFA.
Definitions of Key Terms
Cost Per Pupil Place Represents the Total Project Cost, divided by the number of additional pupil places being created by the works in the school. Where this data has not been available for refurbishment projects, the Total Project Cost has been divided by the total number of pupils in the school.
20th and 80th Percentiles The 20th percentile is the value below which 20% of the observations may be found, while the 80th percentile is the value below which 80% are found.
Abnormals These encompass substructure cost above normalised base cost and demolitions. The normalised base cost for substructures used was £120 per m² of GIFA. This value has been derived using the worked example for calculating substructure abnormals published by the former Department for Education and Employment (DFEE) within their document entitled “Education Building Projects: Information on Costs and Performance Data”. This calculation used within this report recognises the impact of timing (tender factor), location and size of projects.
Fees All professional (client) fee costs have been included where provided within the sample data. These fees include project management, cost management and other professional services associated to the project. In house architectural service fees are also included where applicable. If fee information was not available a standardised professional fee allowance of 12% has been included on all projects where the unadjusted tendered Contract Sum is £10m or less. A standardised professional fee allowance of 10% has been included on all projects where the unadjusted Contract Sum is in excess of £10m. A professional (client) fee of 3% has been applied to all centrally funded projects submitted by the EFA as agreed with the EFA.
Excluded Cost Elements Statutory fees, survey costs, loose furniture and equipment, client department costs including programme management, legal and land acquisition costs are excluded from all figures shown herein.
Preliminaries, Contingency, Overheads & Profit Included in all figures herein as a percentage cost of GIFA. In the case of Refurbishment projects the GIFA refers to the percentage of new build floor area only.
Location Factor All costs have been normalised to a common UK average price level using regional location factors published by BCIS to accord with the UK Mean 100. Index taken at November 2016.
Inflation All costs have been updated to the latest Building Cost Information Service (BCIS) ALL-IN Tender Price of Index (TPI) of 1st Quarter 2016 of 273. Index taken at November 2016. This adjusts costs for inflation. VAT is excluded throughout.
Please Note All cost data contained within this report relates to Tender Stage (Gateway 3, Contract Let) costs, unless otherwise identified as Outturn figures. Photographs contained throughout this publication are used with the permission of the associated Local Authority.
Key terms used throughout this publication and an outline of how data has been adjusted for inflation and regional cost variations are defined here.
Part Five | Further Information
National School Delivery Cost Benchmarking | Primary, Secondary & SEN Schools
EBDOG Page | 30 of 31
February 2017
For further information relating to this study or for details regarding future publications and how to participate please contact the individuals below. David Corcoran | Study Senior Lead Officer Strategic Manager Hampshire County Council [email protected] Matt Robertson | Study Lead Officer Strategic Consultancy Manager Hampshire County Council [email protected] Mike Raven | Study Co-Ordinating Officer Senior Project Manager East Riding of Yorkshire Council [email protected] For Quantity Surveying queries relating to costs, formulas used, the standard cost form and rationale please contact the individuals below. Stephen Smith Principal Quantity Surveyor Hampshire County Council [email protected] Pete Skinner Principal Quantity Surveyor East Riding of Yorkshire Council [email protected]
Publication Contacts Part Five | Further Information
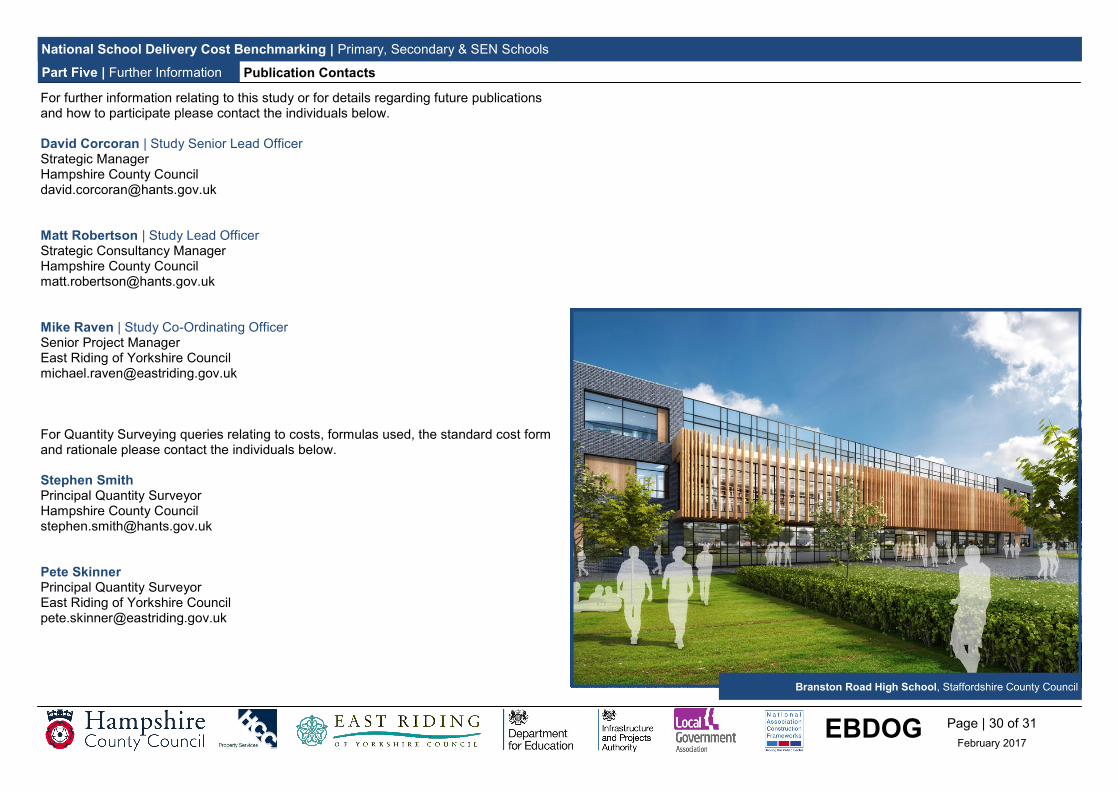
Branston Road High School, Staffordshire County Council

National School Delivery Cost Benchmarking | Primary, Secondary & SEN Schools
INTENTIONALLY BLANK
Page | 31 of 31
February 2017 EBDOG