ebitda margin (%) -...
TRANSCRIPT
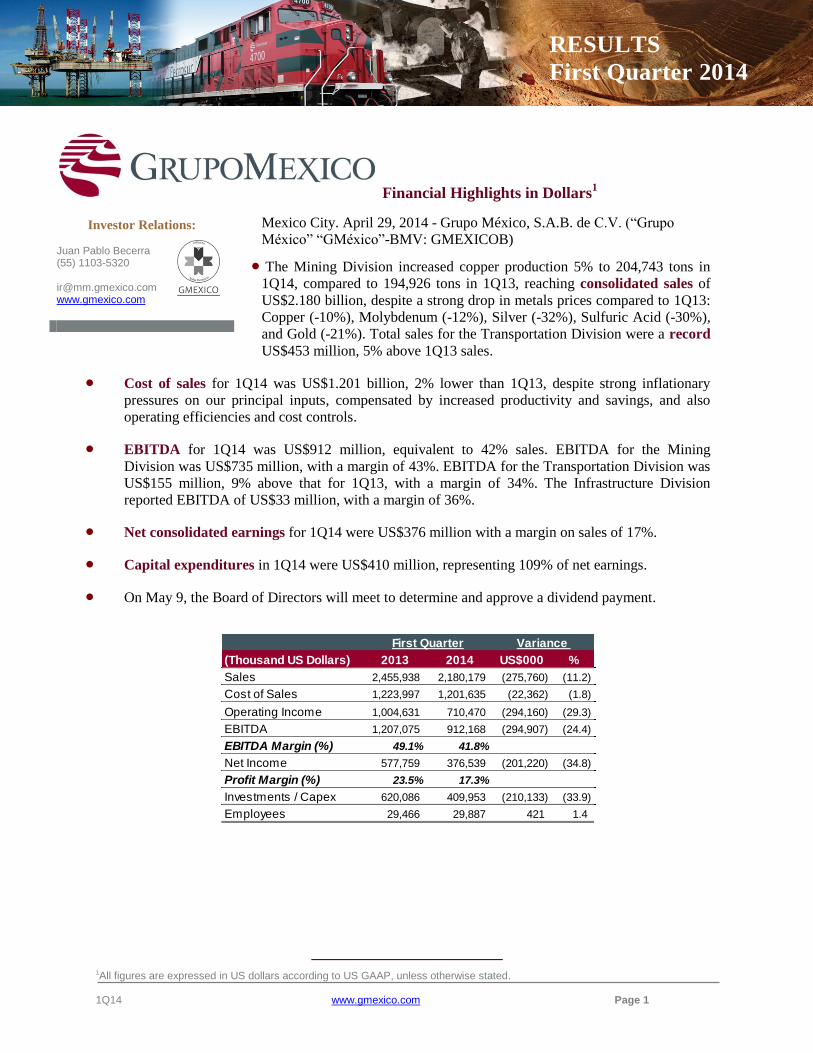
FIRST QUARTER RESULTS 2014 GRUPO MEXICO
1Q14 www.gmexico.com Page 1
Financial Highlights in Dollars1
Mexico City. April 29, 2014 - Grupo México, S.A.B. de C.V. (“Grupo
México” “GMéxico”-BMV: GMEXICOB)
The Mining Division increased copper production 5% to 204,743 tons in
1Q14, compared to 194,926 tons in 1Q13, reaching consolidated sales of
US$2.180 billion, despite a strong drop in metals prices compared to 1Q13:
Copper (-10%), Molybdenum (-12%), Silver (-32%), Sulfuric Acid (-30%),
and Gold (-21%). Total sales for the Transportation Division were a record
US$453 million, 5% above 1Q13 sales.
Cost of sales for 1Q14 was US$1.201 billion, 2% lower than 1Q13, despite strong inflationary
pressures on our principal inputs, compensated by increased productivity and savings, and also
operating efficiencies and cost controls.
EBITDA for 1Q14 was US$912 million, equivalent to 42% sales. EBITDA for the Mining
Division was US$735 million, with a margin of 43%. EBITDA for the Transportation Division was
US$155 million, 9% above that for 1Q13, with a margin of 34%. The Infrastructure Division
reported EBITDA of US$33 million, with a margin of 36%.
Net consolidated earnings for 1Q14 were US$376 million with a margin on sales of 17%.
Capital expenditures in 1Q14 were US$410 million, representing 109% of net earnings.
On May 9, the Board of Directors will meet to determine and approve a dividend payment.
1All figures are expressed in US dollars according to US GAAP, unless otherwise stated.
First Quarter
(Thousand US Dollars) 2013 2014 US$000 %
Sales 2,455,938 2,180,179 (275,760) (11.2)
Cost of Sales 1,223,997 1,201,635 (22,362) (1.8)
Operating Income 1,004,631 710,470 (294,160) (29.3)
EBITDA 1,207,075 912,168 (294,907) (24.4)
EBITDA Margin (%) 49.1% 41.8%
Net Income 577,759 376,539 (201,220) (34.8)
Profit Margin (%) 23.5% 17.3%
Investments / Capex 620,086 409,953 (210,133) (33.9)
Employees 29,466 29,887 421 1.4
Variance
RESULTS
First Quarter 2014
Investor Relations:
Juan Pablo Becerra (55) 1103-5320 [email protected] www.gmexico.com

FIRST QUARTER RESULTS 2014 GRUPO MEXICO
1Q14 www.gmexico.com Page 2
Highlights Profepa certifies Grupo Mexico as a Sustainable Company.- As part of its National Environmental Auditing Program, the Mexican Environmental Protection Agency (Profepa) certified Grupo Mexico as a Sustainable Company for its outstanding commitment to sustainable development, investment, and job creation. GMexico Capital Expenditures.- Capital expenditures in 1Q14 totaled US$410 million. The Mining Division invested US$360 million, US$197 million in Buenavista, US$47 million in Peru and US$45 million in other projects and operations. The Transportation Division invested US$26 million; orders were placed this quarter and payments will be made in subsequent quarters to ensure the progress of the division’s projects and meeting the US$519 million investment program for this year. The Infrastructure Division invested US$24 million, which is in keeping with the payment schedule to meet the approved budget of US$380 million for this year.
Mining Division
SX/EW III Plant at Buenavista.- Construction of the SX/EW II Plant is practically complete and the
initial testing began in April 2014. The total budget for the project is US$444 million, of which US$407
million has been expended. The plant will have a copper cathode production capacity of 120,000 tons
annually and is expected to start operations in 2Q14.
Southern Copper submits the Environmental Impact Assessment (EIA) for the Toquepala project in Tacna, Peru.- On April 16, 2014, we successfully held the public hearing required as a pre-condition for approval of the project’s EIA. We expect to receive approval of the EIA in 3Q14 to start construction. This project will increase annual production by 100,000 tons of copper content.
Aggressive Growth Plan.- Our investment projects continue to progress favorably, aiming to produce
1,331,000 tons of copper annually by 2017. Since we announced our expansion plan in 3Q10, production
has increased 20%.
AMC confirms its position as a global low-cost leader.- Despite an environment of inflationary
pressures and lower metals prices, AMC continues to post one of the highest EBITDA margins in the
Mining Industry, thanks to its efforts in containing costs and improving operating efficiency.
Transportation Division Automotive Segment.- ITM signed a multiple-year contract with Mazda Motors, to transport 100% of the company’s rail traffic from the assembly plant in Salamanca, Gto., connecting to Mexican, US, and Canadian railroads. With this, ITM moves closer to becoming the largest transporter of vehicles in the country, making this segment the second in importance for ITM in terms of revenue.
Steel Products and Minerals Segment.- Affirming the confidence our Steel Product customers have in the railroad as their primary means of transport for inputs and finished products, negotiations were completed and multiple-year contracts were signed with all the major Mexican steel companies, including AcelorMittal, Ternium, and Deacero.
Industrial Segment.- ITM signed a multiple-year contract in this segment with Crown Imports to transport the company’s beer production under the Modelo brands for export to the US.

FIRST QUARTER RESULTS 2014 GRUPO MEXICO
1Q14 www.gmexico.com Page 3
Advances in other Segments.- The track improvement project for the line between Mexico City and Cuautla, Morelos was started, which will provide rail service to industry in the eastern part of this state, following the signing of a collaboration agreement with the Morelos state government.
Infrastructure Division
Good operating performance.- The Infrastructure Division reported good operating performance, with
sales of US$91 million in 1Q14, representing a growth of 17% year over year. This increase is mainly due
to the startup of operations of the “Zacatecas” platform, the largest and most modern platform of its kind
currently serving Pemex, with a drilling depth capacity of 30,000 ft.
Mexico Generadora de Energía completes construction of the Second Combined Cycle Plant.-
Construction of the second 250 MW plant has been completed and initial testing began April 15 to start
commercial operations in 2Q14. The project was finished on time and within its US$540 million budget.
This project is part of Grupo Mexico’s strategy to supply all the electrical power for its mine operations in
Sonora, including the Buenavista expansion, at a lower cost than the CFE.
Arrival of the “Tabasco” platform.- Our fourth platform arrived at the port of Dos Bocas, Tabasco on
January 11 and started operations for Pemex in April on a 7-year contract. The “Tabasco” platform will
contribute US$40 million to the Infrastructure Division’s EBITDA annually.
Upcoming deliveries and startups.- Before the end of the year, we will have put another 400 ft
platform into operation, “Campeche”, received one of the modular units acquired in 2012, “Veracruz”,
started operations at the second 250 MW power plant, and the 74 MW Wind Farm, “El Retiro”, will have
started operations.

FIRST QUARTER RESULTS 2014 GRUPO MEXICO
1Q14 www.gmexico.com Page 4
Financing
GMexico maintains a solid balance with a low leverage level, with a net debt to EBITDA ratio of 0.85x.
Of the debt contracted, 91% is denominated in dollars and 87% is at fixed rate.
Grupo México Debt Schedule At March 31, 2014
2013
Gross Gross Cash & Net
(US$000) Debt Debt Banks(1)
Debt
Grupo Mexico - - 312,257 (312,257)
Americas Mining Corporation - - 244 (244)
Southern Copper Corporation 4,214,121 4,205,188 1,746,111 2,459,077
Asarco - - 76,698 (76,698)
Infraestructura y Transportes Mexico (ITM) - - 154,346 (154,346)
GFM - Ferromex 398,608 349,070 64,481 284,589
Ferrosur 80,654 62,092 90,884 (28,792)
México Proyectos y Desarrollos 897,400 1,187,668 103,062 1,084,606
Grupo Mexico (Consolidated) 5,590,783 5,804,018 2,548,083 3,255,935
(1) include Short Term Investment
As of March 31 2014
986
1,092
1,179
348 294
66 51 51 52
498
151
450
40 43 45 50 55
110 57 59 62 65
-
200
400
600
800
1,000
1,200
1,400
20
14
20
15
20
16
20
17
20
18
20
19
20
20
20
21
20
22
20
23
20
24
20
25
20
26
20
27
20
28
20
29
20
30
20
31
20
32
20
33
20
34
20
35
20
36
20
37
20
38
20
39
20
40
20
41
20
42
Mining Division Transportation Division Infrastructure Division

FIRST QUARTER RESULTS 2014 GRUPO MEXICO
1Q14 www.gmexico.com Page 5
Mining Division
Americas Mining Corporation
Financial Highlights
Average Metals Prices
Copper.- Production through March 31, 2014 was 204,743 tons, a 5% increase over 1Q13, due to greater
production at Cuajone(+13%), Buenavista (+11%), and Toquepala (+8%) as a result of increased
movement of ore, and also improved grades and recovery.
Molybdenum.- production increased 17% through March 31, 2014, to 5,606 tons, compared to 4,810
tons in 1Q13. This increase is due to the start of operations of the Molybdenum plant at Buenavista and
the reopening of the new Molydbenum plant at Mission.
Zinc.- Production decreased (-11%) through March 31, 2014, to 20,818 tons, compared to 23,457 tons in
1Q13. This decrease is a result of the stoppage at Charcas following an accident that occurred on
February 12; this mine represents 80% of our zinc production.
Silver.- Production increased 8% to 3.791 million ounces in 1Q14, compared to 1Q13, due to increased
production at our Cuajone (+55%) and Buenavista mines (+13), as a result of improved recovery.
Gold.- Production increased 2% through March 31, 2014, to 9,290 ounces, compared to 1Q13, due to
increased production at Toquepala (+13%) as a result of improved grades and recovery.
First Quarter
(Thousand US Dollars) 2013 2014 US$000 %
Sales 1,960,762 1,700,521 (260,241) (13.3)
Cost of Sales 924,238 928,624 4,386 0.5
Operating Income 874,744 585,304 (289,440) (33.1)
EBITDA 1,000,692 734,902 (265,790) (26.6)
EBITDA Margin (%) 51.0% 43.2%
Net Income 478,278 293,369 (184,909) (38.7)
Profit Margin (%) 24.4% 17.3%
Investments / Capex 365,821 359,620 (6,201) (1.7)
Variance
2Q 3Q 4Q Var.
2013 2013 2013 2014 2013 %
Copper ($cts/Pound) 325.19 323.25 328.01 323.77 360.01 (10.1)
Molybdenum ($dlls/Pound) 10.80 9.36 9.60 9.93 11.28 (12.0)
Zinc ($cts/Pound) 83.48 84.35 86.57 92.05 92.21 (0.2)
Silver ($dlls/Ounce) 23.10 21.39 20.77 20.46 30.03 (31.9)
Gold ($dlls/Ounce) 1,413.65 1,327.54 1,272.47 1,293.95 1,630.47 (20.6)
Lead ($cts/Pound) 93.17 95.41 95.78 95.49 104.33 (8.5)
Sulfuric Acid ($dlls/Ton) 88.37 90.12 92.56 69.56 99.79 (30.3)
Source: Copper & Silver - COMEX; Zinc & Gold - LME; Molybdenum - Metals Week Dealer Oxide
Sulfuric Acid - AMC
First Quarter

FIRST QUARTER RESULTS 2014 GRUPO MEXICO
1Q14 www.gmexico.com Page 6
Mining Division Sales
Cash Cost
The operating cash cost per pound of copper, cash cost, excluding byproducts was US$2.00 in 1Q14,
practically in keeping with that for 1Q13. The operating cash cost per pound of copper, cash cost, net of
byproducts was US$1.32 in 1Q14, compared to US$1.17 in 1Q13. This increase is due mainly to drops in
the prices for our principal byproducts.
Sales Distribution
The following chart shows AMC’s cumulative sales share by metal in 2014:
Mining Division First Quarter Variance January - March
2013 2014 %
Copper (m.t.) Sales 196,616 195,917 (699) (0.4)
Molybdenum (m.t.) Sales 4,875 5,531 656 13.5
Zinc (m.t.) Sales 23,456 24,357 901 3.8
Silver (Koz) Sales 4,394 3,149 (1,246) (28.3)
Gold (Oz) Sales 15,627 8,899 (6,728) (43.1)
Sulfuric Acid (m.t.) Sales 441,590 474,041 32,451 7.3
Copper82.0%
Silver3.7%
Molybdenum7.0%
Sulfuric Acid1.9%
Zinc3.0%
Gold0.7%
Others0.9% Lead
0.8%

FIRST QUARTER RESULTS 2014 GRUPO MEXICO
1Q14 www.gmexico.com Page 7
Projects
Buenavista Projects.- We continue the development of our US$3.4 billion investment program at this
unit which is expected to increase its copper production capacity by approximately 175% as well as our
molybdenum production.
The new Copper Molybdenum Concentrator has an annual production capacity of 188,000 tons of copper
and 2,600 tons of molybdenum. The project will additionally produce 2.3 million ounces of silver and
21,000 ounces of gold per year. The capital budget for the project is US$1.384 billion, reporting 72%
progress with an investment of US$654 million. The project is expected to be completed in the 1H15. Of
our major equipment 80 % is on site and 20% has been installed.
To date we have received the 61 trucks with a capacity of 400-tons, 7 shovels and 8 drills required for the
mine expansion; representing an investment of US$496 million.
Crushing, conveying and spreading system for leachable ore (Quebalix IV). This project will increase
production by improving SX/EW copper recovery and reducing processing time, in addition to reducing
hauling costs. The capital budget for the project is US$340 million. The project is expected to be
completed in the second half of 2015.
The remaining projects to complete the US$3.4 billion budgeted program include important investments
in infrastructure (power lines and substations, water supply, tailings dam, mine equipment shops, internal
roads, etc.).
Toquepala Projects.- Through March 31, 2014, we have invested a total US$295 million on the
Toquepala projects. These projects include the construction of a new crusher and conveyor belt system to
replace current haulage by rail.
Cuajone Projects.- Through March 31, 2014, we have invested US$35 million of the US$45 million
budgeted on the high pressure grinding rolls (HPGR) project. The project, which will produce a more
finely crushed material, is currently in the ramping up stage and we expect to reach full capacity during
2Q14. The project will generate cost savings improving copper recovery and reducing power
consumption in the crushing process.
The project to improve slope stability at the south area of the Cuajone mine, will remove
approximately 148 million tons of waste material to improve the mine design without reducing our
current production level. The mine equipment acquired includes one shovel, five trucks, one drill, and
auxiliary equipment. Besides preparing the mine for the future, this investment will avoid a reduction in
average ore grade between 2014 and 2018. Through March 31, 2014, we have expended US$61 million
of the total US$65 million budgeted. Tia Maria Project.- We are in the process of responding to comments received from the authorities and
stakeholders in February 2014 regarding the EIA. We are confident that working together we will meet
and respond to the comments received to the satisfaction of all parties involved to then move forward
with this important project.

FIRST QUARTER RESULTS 2014 GRUPO MEXICO
1Q14 www.gmexico.com Page 8
Transportation Division
ITM
Financial Highlights
Cumulative sales through 1Q14 increased 5% due to growth in sales in the Energy (17%), Industrial
(15%), and Automotive (11%) segments.
A total 11.963 billion net tons-kilometer were transported in 1Q14. The segments that experienced the
greatest growth were: Automotive 20%, due to increased exports from Nissan through Cd. Juárez and the
start of operations of Nissan’s second plant; Energy 16%, due to a 68% increase in fuel oil volumes
transported for Pemex, and Industrial 11%, due to increased exports from Crown Imports 20% and
movements of empty new trains for Gunderson and Trinity.
The segments that experienced the strongest drops were: Cement 10%, due to the downturn in the
Mexican construction industry and decreased traffic on exports through Guaymas bound for South
America; Steel Products 9%, due to decreased traffic from Altos Hornos de México 10% and Deacero due
to lower exports to South America through Veracruz; and Minerals 8%, principally due to decreased iron
ore traffic from Ternium to Monterrey and to Puebla.
The contribution to sales by segment through March 31, 2013 is shown following:
Sales by Segment Tons –Kms
First Quarter
(Thousand US Dollars) 2013 2014 US$000 %
Load Volume (MillionTons/Km) 12,006 11,963 (43) (0.4)
Sales 433,386 453,417 20,031 4.6
Cost of Sales 271,900 282,013 10,113 3.7
Operating Income 109,884 111,859 1,975 1.8
EBITDA 142,222 155,168 12,946 9.1
EBITDA Margin (%) 32.8% 34.2%
Net Income 73,447 86,445 12,998 17.7
Profit Margin (%) 16.9% 19.1%
Investments / Capex 36,425 26,592 (9,833) (27.0)
Variance

FIRST QUARTER RESULTS 2014 GRUPO MEXICO
1Q14 www.gmexico.com Page 9
Operating costs for the quarter report an increase of 4% compared to 1Q13, due mainly to increased labor,
1%, and diesel costs, 3%, reflecting a 12% increase in fuel prices, which is compensated by a 4%
decrease in liter consumption.
The EBITDA for 1Q13 increased 9% to US$155 million, with a margin on sales of 34%.

FIRST QUARTER RESULTS 2014 GRUPO MEXICO
1Q14 www.gmexico.com Page 10
Infrastructure Division
MPD
Financial Highlights
Through March 2014, consolidated sales were US$91 million, a 17% increase over 1Q13, due mainly to
the start of operations of the first 250 MW power plant that has been supplying Minera México since
December of last year. EBITDA for the Division increased 3% year over year to US$33 million.
Progress and Delivery of the 400ft platforms to serve Pemex.- GMexico has invested US$313
million of the US$493 million budgeted to acquire two new platforms for oil drilling. The first platform,
“Tabasco”, arrived in Mexico in January and started operations for Pemex in 2Q14. The second
platform, “Campeche”, will arrive in 3Q14 to start operations in 4Q14.
Progress in the construction of Modular Units to serve Pemex.- Through March 2014, US$93
million of the US$174 million budgeted has been invested in the two modular drilling units “Veracruz”
and “Tamaulipas”. There have been delays on the part of the builder and because of changes ordered by
Pemex. The first modular unit, “Veracruz”, is expected to arrive in 4Q14 and will start operations that
same quarter. The second modular unit, “Tamaulipas”, is scheduled to start operations in 1Q15.
Leon-Salamanca Highway.- Construction of the highway reports 50% completion. The highway is
scheduled to start operations in 1Q15. To date, US$195 million of the total US$400 million budgeted
has been expended.
Oaxaca Wind Farm.- The electromechanical works for the project have been completed and initial
testing began in April. We expect to start supplying power to the self-supply partners in May. This
project represents GMexico’s continued commitment to the environment. A total US$150 million will
be invested in the project, of which US$134 million has been expended to date.
* * * * *
First Quarter
(Thousand US Dollars) 2013 2014 US$000 %
Sales 77,198 90,535 13,337 17.3
Cost of Sales 43,195 55,156 11,961 27.7
Operating Income 22,879 22,539 (340) (1.5)
EBITDA 32,132 32,984 852 2.7
EBITDA Margin (%) 41.6% 36.4%
Net Income (Loss) 1,311 4,493 3,182 242.7
EBITDA Margin (%) 1.7% 5.0%
Investments / Capex 217,840 23,741 (194,100) (89.1)
Variance

FIRST QUARTER RESULTS 2014 GRUPO MEXICO
1Q14 www.gmexico.com Page 11
Company Profile
Grupo México “GMexico” is a holding company whose main activities are: (i) mining, being one of the world's largest
integrated copper producers; (ii) railroad service, with the most extensive network in Mexico, and (iii) engineering,
procurement, construction, and drilling services. These business lines are grouped under the following subsidiaries:
The Mining Division of GMexico is represented by its subsidiary Americas Mining Corporation (“AMC”), whose
principal subsidiaries are Southern Copper Corporation (“SCC”) in Mexico and Peru, and Asarco in the United States. The
sum of both companies holds the world's largest copper reserves. SCC trades on the New York and Lima stock exchanges.
SCC's stockholders, directly or through subsidiaries, are: GMexico (82.5%) and other stockholders (17.5%). AMC has
mines, metallurgic plants, and exploration projects in Peru, Mexico, the US, Chile, Argentina, and Ecuador. Asarco was
reincorporated into GMexico on December 9, 2009 and operates 3 mines and 1 smelting plant in Arizona and 1 refinery in
Texas.
The Transportation Division of GMexico is represented by its subsidiary Infraestructura y Transportes México, S.A. de
C.V. (“ITM”), whose principal subsidiaries are Grupo Ferroviario Mexicano, S.A. de C.V. (“GFM”), Ferrocarril
Mexicano, S.A. de C.V. (“Ferromex”), Ferrosur, S. A. de C. V. (“Ferrosur”), Intermodal México, S.A. de C.V. and Texas
Pacifico, LP, Inc. Ferromex is the largest railroad company with the most extensive coverage in Mexico. Ferromex
operates a track network of 8,111 kilometers covering approximately 81% of Mexico, connecting to five border points
with the United States, four ports on the Pacific Coast, and two on the Gulf of Mexico. Ferromex is controlled by
GMexico, holding 55.5%, Union Pacific owns 26% and Grupo Carso-Sinca Inbursa 18.5%. Ferrosur operates a track
network of 1,549 kilometers coving the central and southeastern part of the country, serving principally the states of
Tlaxcala, Puebla, Veracruz, and Oaxaca, and has access to the ports of Veracruz and Coatzacoalcos on the Gulf of
Mexico. Ferrosur is controlled by GMexico, holding 74.99%, with Grupo Carso-Sinca Inbursa holding the remaining
25.01%.
The Infrastructure Division of GMexico is represented by its subsidiaries México Proyectos y Desarrollos, S.A. de C.V.
(“MPD”), México Compañía Constructora, S.A. de C.V. (“MCC”), Servicios de Ingeniería Consutec, S.A. de
C.V.(“Consutec”), Compañía Perforadora México, S.A.P.I de C.V. (“La México”) and México Generadora de Energía
(“MGE”). MPD, La México, MCC, Consutec, and MGE are wholly owned by GMexico. MPD and MCC are active in
engineering, procurement, and infrastructure construction projects. Consutec engages in integral project engineering
activities. La México offers oil and water drilling services and related value added services such as cementation
engineering and directional or slanted drilling. MGE is active in the construction and service of the combined cycle power
plants.
___________________________ This report includes forward-looking statements. In addition to the risk and uncertainties noted in the report, there are certain factors that could cause results to differ materially from those anticipated by some of the statements made. Many of these risks and uncertainties are related to factors beyond the reasonable control of Grupo Mexico or that cannot be accurately estimated, such as future market conditions, metals prices, the behavior of other market stakeholders and the actions of government regulators, which are described in Grupo Mexico’s annual report. Grupo Mexico does not assume any obligation whatsoever regarding the updating of these projections to reflect events or circumstances occurring after the date of this report.

FIRST QUARTER RESULTS 2014 GRUPO MEXICO
1Q14 www.gmexico.com Page 12
(Thousands of US Dollars)
STATEMENT OF EARNINGS Q1-14 Q1-13 Variance 2014 2013 Variance
Net sales 2,180,179 2,455,938 (275,760) 2,180,179 2,455,938 (275,760)
Cost of sales 1,201,635 1,223,998 (22,363) 1,201,635 1,225,368 (23,733)
Exploration 16,361 11,694 4,667 16,361 10,324 6,037
Gross profit 962,183 1,220,246 (258,063) 962,183 1,220,246 (258,063)
Gross margin 44% 50% 44% 50%
Administrative expenses 59,728 54,796 4,932 59,728 54,796 4,932
EBITDA 912,168 1,207,075 (294,907) 912,168 1,207,075 (294,907)
Depreciation and amortization 191,985 160,819 31,165 191,985 160,819 31,165
Operating income 710,470 1,004,631 (294,160) 710,470 1,004,631 (294,160)
Operating margin 33% 41% 33% 41%
Interest expense 55,139 66,947 (11,808) 55,139 66,947 (11,808)
Interest income (8,434) (14,345) 5,911 (8,434) (14,345) 5,911
(Gain) loss in investments (71,715) (21,464) (50,251) (71,715) (21,464) (50,251)
Other (income) expense, net (8,041) (42,058) 34,017 (8,041) (42,058) 34,017
Earnings before Tax 743,521 1,015,551 (272,029) 743,521 1,015,551 (272,029)
Taxes 274,270 314,028 (39,758) 274,270 314,028 (39,758)
Participation in subsidiary not consolidated and
associated (7,042) (8,927) 1,885 (7,042) (8,927) 1,885
Net Earnings 476,293 710,449 (234,156) 476,293 710,449 (234,156)
Net income attributable to the non-controlling
interest 99,754 132,690 (32,936) 99,754 132,690 (32,936)
Net income attributable to GM 376,539 577,759 (201,220) 376,539 577,759 (201,220)
BALANCE SHEET
Cash and cash equivalents 2,548,083 3,190,421 (642,338) 2,548,083 3,190,421 (642,338)
Restricted cash 101,437 135,297 (33,860) 101,437 135,297 (33,860)
Notes and accounts receivable 892,401 986,670 (94,269) 892,401 986,670 (94,269)
Inventories 981,159 1,021,551 (40,392) 981,159 1,021,551 (40,392)
Prepaid and others current assets 834,628 920,182 (85,554) 834,628 920,182 (85,554)
Total Current Assets 5,357,708 6,254,121 (896,414) 5,357,708 6,254,121 (896,414)
Property, plant and equipment, Net 11,676,495 9,859,042 1,817,453 11,676,495 9,859,042 1,817,453
Leachable material, net 490,544 324,808 165,736 490,544 324,808 165,736
Other long term assets 2,711,054 3,130,814 (419,760) 2,711,054 3,130,814 (419,760)
Total Assets 20,235,801 19,568,785 667,016 20,235,801 19,568,785 667,016
Liabilities and Stockholders' Equity
Current - term debt 364,981 103,323 261,658 364,981 103,323 261,658
Accumulated liabilities 1,268,567 1,432,651 (164,084) 1,268,567 1,432,651 (164,084)
Current Liabilities 1,633,548 1,535,975 97,574 1,633,548 1,535,975 97,574
Long-term debt 5,439,037 5,487,460 (48,423) 5,439,037 5,487,460 (48,423)
Other non-current liabilities 1,416,663 1,831,217 (414,554) 1,416,663 1,831,217 (414,554)
Total Liabilities 8,489,248 8,854,652 (365,403) 8,489,248 8,854,652 (365,403)
Stockholders equity 2,003,496 2,003,496 (1) 2,003,496 2,003,496 (1)
Other equity accounts (720,240) (900,366) 180,126 (720,240) (900,366) 180,126
Retaining earnings 8,432,268 7,702,409 729,859 8,432,268 7,702,409 729,859
Total Stockholders' equity 9,715,524 8,805,539 909,984 9,715,524 8,805,539 909,984
Non-controlling interest. 2,031,029 1,908,594 122,435 2,031,029 1,908,594 122,435
Total Liabilities and Equity 20,235,801 19,568,785 667,016 20,235,801 19,568,785 667,016 - - - - - -
CASH FLOW
Net earnings 476,293 710,449 (234,156) 476,293 710,449 (234,156)
Depreciation and amortization 191,985 160,819 31,166 191,985 160,819 31,166
Deferred income taxes (65,672) 28,647 (94,319) (65,672) 28,647 (94,319)
Participation in subsidiary not consolidated and
associated (7,042) (8,927) 1,885 (7,042) (8,927) 1,885
Other Net (210) (2,136) 1,926 (210) (2,136) 1,926
Changes in assets and liabilities (5,878) 113,834 (119,712) (5,878) 113,834 (119,712)
Cash generated by operating activities 589,476 1,002,686 (413,210) 589,476 1,002,686 (413,210)
Capital expenditures (409,953) (620,086) 210,133 (409,953) (620,086) 210,133
Restricted cash (45,908) (33,407) (12,501) (45,908) (33,407) (12,501)
Other - Net 50,817 (120,239) 171,056 50,817 (120,239) 171,056
Cash used in investing activities (405,044) (773,732) 368,688 (405,044) (773,732) 368,688
Debt incurred 14,419 15,200 (781) 14,419 15,200 (781)
Debt amortization (20,922) (28,451) 7,529 (20,922) (28,451) 7,529
Dividends paid (170,644) (226,018) 55,374 (170,644) (226,018) 55,374
SCC common shares buyback (52,479) - (52,479) (52,479) - (52,479)
Cash used in financing activities (229,626) (239,269) 9,643 (229,626) (239,269) 9,643
Effect of exchance rate changes on cash and cash
equivalents 4,215 8,169 (3,954) 4,215 8,169 (3,954)
Net increase (decrease) cash & cash equivalents (40,980) (2,147) (38,833) (40,980) (2,147) (38,833)
Cash & cash equivalents at begin yr. 2,589,063 3,192,567 (603,504) 2,589,063 3,192,567 (603,504)
Cash & cash equivalents at yr. end 2,548,083 3,190,421 (642,337) 2,548,083 3,190,421 (642,337)
GRUPO MEXICO, S.A.B. DE C.V. (GM)
CONSOLIDATED FINANCIAL STATEMENTS (US GAAP)
Quarters Accumulated

FIRST QUARTER RESULTS 2014 GRUPO MEXICO
1Q14 www.gmexico.com Page 13
(Thousands of US Dollars)
STATEMENT OF EARNINGS Q1-14 Q1-13 Variance 2014 2013 Variance
Net sales 1,700,521 1,960,762 (260,241) 1,700,521 1,960,762 (260,241)
Cost of sales 928,624 924,239 4,385 928,624 925,609 3,015
Exploration 16,361 11,694 4,667 16,361 10,324 6,037
Gross profit 755,536 1,024,829 (269,293) 755,536 1,024,829 (269,293)
Gross margin 44% 52% 44% 52%
Administrative expenses 30,289 32,845 (2,556) 30,289 32,845 (2,556)
EBITDA 734,902 1,000,692 (265,790) 734,902 1,000,692 (265,790)
Depreciation and amortization 139,943 117,239 22,703 139,943 117,239 22,703
Operating income 585,304 874,744 (289,440) 585,304 874,744 (289,440)
Operating margin 34% 45% 34% 45%
Interest expense 43,035 55,585 (12,550) 43,035 55,585 (12,550)
Interest income (4,604) (5,983) 1,379 (4,604) (5,983) 1,379
Other (income) expense, net (7,983) (9,141) 1,158 (7,983) (9,141) 1,158
Earnings before Tax 554,856 834,283 (279,427) 554,856 834,283 (279,427)
Taxes 205,842 264,944 (59,102) 205,842 264,944 (59,102)
Participation in subsidiary not consolidated and
associated (6,038) (8,163) 2,125 (6,038) (8,163) 2,125
Net Earnings 355,052 577,502 (222,450) 355,052 577,502 (222,450)
Net income attributable to the non-controlling
interest 61,682 99,224 (37,542) 61,682 99,224 (37,542)
Net income attributable to AMC 293,369 478,278 (184,909) 293,369 478,278 (184,909)
BALANCE SHEET
Cash and cash equivalents 1,823,053 2,681,667 (858,614) 1,823,053 2,681,667 (858,614)
Restricted cash 32,845 51,481 (18,637) 32,845 51,481 (18,637)
Notes and accounts receivable 620,090 695,926 (75,835) 620,090 695,926 (75,835)
Inventories 905,506 945,994 (40,488) 905,506 945,994 (40,488)
Prepaid and others current assets 716,241 762,219 (45,978) 716,241 762,219 (45,978)
Total Current Assets 4,097,736 5,137,288 (1,039,552) 4,097,736 5,137,288 (1,039,552)
Property, plant and equipment, Net 8,318,003 6,990,652 1,327,351 8,318,003 6,990,652 1,327,351
Leachable material, net 490,544 324,808 165,736 490,544 324,808 165,736
Other long term assets 1,106,385 1,232,387 (126,002) 1,106,385 1,232,387 (126,002)
Total Assets 14,012,667 13,685,134 327,533 14,012,667 13,685,134 327,533
Liabilities and Stockholders' Equity
Long-term debt - 10,000 (10,000) - 10,000 (10,000)
Other non-current liabilities 1,496,878 1,533,413 (36,535) 1,496,878 1,533,413 (36,535)
Current Liabilities 1,496,878 1,543,413 (46,535) 1,496,878 1,543,413 (46,535)
Long term debt 4,205,188 4,204,121 1,067 4,205,188 4,204,121 1,067
Other long term liabilities 1,074,194 1,511,286 (437,092) 1,074,194 1,511,286 (437,092)
Total Liabilities 6,776,260 7,258,819 (482,559) 6,776,260 7,258,819 (482,559)
Stockholders equity 1,056,021 1,056,021 - 1,056,021 1,056,021 -
Other equity accounts (920,314) (1,141,842) 221,528 (920,314) (1,141,842) 221,528
Retained earnings 5,989,462 5,459,863 529,599 5,989,462 5,459,863 529,599
Total Stockholders' equity 6,125,170 5,374,043 751,127 6,125,170 5,374,043 751,127
Non-controlling interest. 1,111,237 1,052,272 58,965 1,111,237 1,052,272 58,965
Total Liabilities and Equity 14,012,667 13,685,134 327,533 14,012,667 13,685,134 327,533 - - - - - -
Cash Flow
Net earnings 355,052 577,502 (222,450) 355,052 577,502 (222,450)
Depreciation and amortization 139,943 117,239 22,703 139,943 117,239 22,703
Deferred income taxes (84,162) 16,852 (101,014) (84,162) 16,852 (101,014)
Participation in subsidiary not consolidated and
associated (6,038) (8,163) 2,125 (6,038) (8,163) 2,125
Others Net 197 10,322 (10,125) 197 10,322 (10,125)
Changes in assets and liabilities (50,783) 2,839 (53,622) (50,783) 2,839 (53,622)
Cash generated by operating activities 354,209 716,592 (362,383) 354,209 716,592 (362,383)
Capital expenditures (359,620) (365,821) 6,201 (359,620) (365,821) 6,201
Restricted cash 7,449 745 6,704 7,449 745 6,704
Capital reimbursement 66,476 (97,937) 164,413 66,476 (97,937) 164,413
Cash used in investing activities (285,694) (463,013) 177,318 (285,694) (463,013) 177,318
Debt incurred 273 258 15 273 258 15
Dividends paid (130,255) (236,298) 106,043 (130,255) (236,298) 106,043
SCC common shares buyback (52,479) - (52,479) (52,479) - (52,479)
Cash used in financing activities (182,461) (236,040) 53,579 (182,461) (236,040) 53,579
Effect of exchance rate changes on cash and cash
equivalents 6,354 (12,273) 18,627 6,354 (12,273) 18,627
Net increase (decrease) cash & cash equivalents (107,592) 5,266 (112,858) (107,592) 5,266 (112,858)
Cash & cash equivalents at begin yr. 1,930,646 2,676,401 (745,755) 1,930,646 2,676,401 (745,755)
Cash & cash equivalents at yr. end 1,823,054 2,681,667 (858,614) 1,823,054 2,681,667 (858,614)
AMERICAS MINNING CORPORATION (AMC)
CONSOLIDATED FINANCIAL STATEMENTS (US GAAP)
Quarters Accumulated
FIRST QUARTER RESULTS 2014 GRUPO MEXICO
1Q14 www.gmexico.com Page 14
(Thousands of US Dollars)
STATEMENT OF EARNINGS Q1-14 Q1-13 Variance 2014 2013 Variance
Net sales 453,417 433,386 20,031 453,417 433,386 20,031
Cost of sales 282,013 271,900 10,113 282,013 271,900 10,113
Gross profit 171,404 161,486 9,918 171,404 161,486 9,918
Gross margin 38% 37% 38% 37%
Administrative expenses 17,989 15,814 2,175 17,989 15,814 2,175
EBITDA 155,168 142,222 12,946 155,168 142,222 12,946
Depreciation and amortization 41,556 35,788 5,768 41,556 35,788 5,768
Operating Income 111,859 109,884 1,975 111,859 109,884 1,975
Operating margin 25% 25% 25% 25%
Interest expense 6,759 7,732 (973) 6,759 7,732 (973)
Interest income (2,283) (4,135) 1,852 (2,283) (4,135) 1,852
(Gain) loss in investments (27,363) (13,426) (13,937) (27,363) (13,426) (13,937)
Other (income) expense - Net (1,458) 251 (1,709) (1,458) 251 (1,709)
Earnings before Tax 136,204 119,462 16,742 136,204 119,462 16,742
Taxes 34,307 31,685 2,622 34,307 31,685 2,622
Participation in subsidiary not consolidated and
associated (1,004) (764) (240) (1,004) (764) (240)
Net Earnings 102,901 88,541 14,360 102,901 88,541 14,360
Net income attributable to the non-controlling
interest 16,456 15,094 1,362 16,456 15,094 1,362
Net income attributable to ITM 86,445 73,447 12,998 86,445 73,447 12,998 - - - - - -
BALANCE SHEET
Cash and cash equivalents 309,711 403,747 (94,036) 309,711 403,747 (94,036)
Notes and accounts receivable 205,731 216,847 (11,116) 205,731 216,847 (11,116)
Inventories 56,048 55,267 781 56,048 55,267 781
Prepaid and others current assets 94,183 73,295 20,888 94,183 73,295 20,888
Total Current Assets 665,673 749,156 (83,483) 665,673 749,156 (83,483)
Property, plant and equipment - Net 1,883,075 1,730,136 152,939 1,883,075 1,730,136 152,939
Other long term assets 674,892 707,338 (32,446) 674,892 707,338 (32,446)
Total Assets 3,223,640 3,186,630 37,010 3,223,640 3,186,630 37,010
Liabilities and Stockholders' Equity
Current portion of long-term debt 112,528 47,390 65,138 112,528 47,390 65,138
Accumulated liabilities 190,992 234,874 (43,882) 190,992 234,874 (43,882)
Current Liabilities 303,520 282,264 21,256 303,520 282,264 21,256
Long-term debt 298,634 431,872 (133,238) 298,634 431,872 (133,238)
Other non-current liabilities 127,854 98,136 29,718 127,854 98,136 29,718
Other liabilities 9,580 8,798 782 9,580 8,798 782
Total Liabilities 739,588 821,070 (81,482) 739,588 821,070 (81,482)
Stockholders equity 89,290 89,290 - 89,290 89,290 -
Other equity accounts 34,706 132,439 (97,733) 34,706 132,439 (97,733)
Retaining earnings 1,962,354 1,791,175 171,179 1,962,354 1,791,175 171,179
Total Stockholders' equity 2,086,350 2,012,904 73,446 2,086,350 2,012,904 73,446
Non-controlling interest. 397,702 352,656 45,046 397,702 352,656 45,046
Total Liabilities and Equity 3,223,640 3,186,630 37,010 3,223,640 3,186,630 37,010
CASH FLOW
Net earnings 102,901 88,541 14,360 102,901 88,541 14,360
Depreciation and amortization 41,556 35,788 5,768 41,556 35,788 5,768
Deferred income taxes (2,170) (1,617) (553) (2,170) (1,617) (553)
Participation in subsidiary not consolidated and
associated (1,004) (764) (240) (1,004) (764) (240)
Other Net 901 (2,605) 3,506 901 (2,605) 3,506
Changes in assets and liabilities (49,887) (65,333) 15,446 (49,887) (65,333) 15,446
Cash generated by operating activities 92,297 54,010 38,287 92,297 54,010 38,287
Capital expenditures (26,592) (36,425) 9,833 (26,592) (36,425) 9,833
Purchase shares (27,363) (13,426) (13,937) (27,363) (13,426) (13,937)
Dividends received - 141 (141) - 141 (141)
Cash used in investing activities (53,955) (49,710) (4,245) (53,955) (49,710) (4,245)
Debt amortization (8,799) (15,157) 6,358 (8,799) (15,157) 6,358
Dividends received (paid) - Net - (26,000) 26,000 - (26,000) 26,000
Cash used in financing activities (8,799) (41,157) 32,358 (8,799) (41,157) 32,358
Effect of exchance rate changes on cash and cash
equivalents (2,139) 20,442 (22,581) (2,139) 20,442 (22,581)
Net increase (decrease) cash & cash equivalents 27,404 (16,415) 43,819 27,404 (16,415) 43,819
Cash & cash equivalents at begin yr. 282,307 420,162 (137,855) 282,307 420,162 (137,855)
Cash & cash equivalents at yr. end 309,711 403,747 (94,036) 309,711 403,747 (94,036)
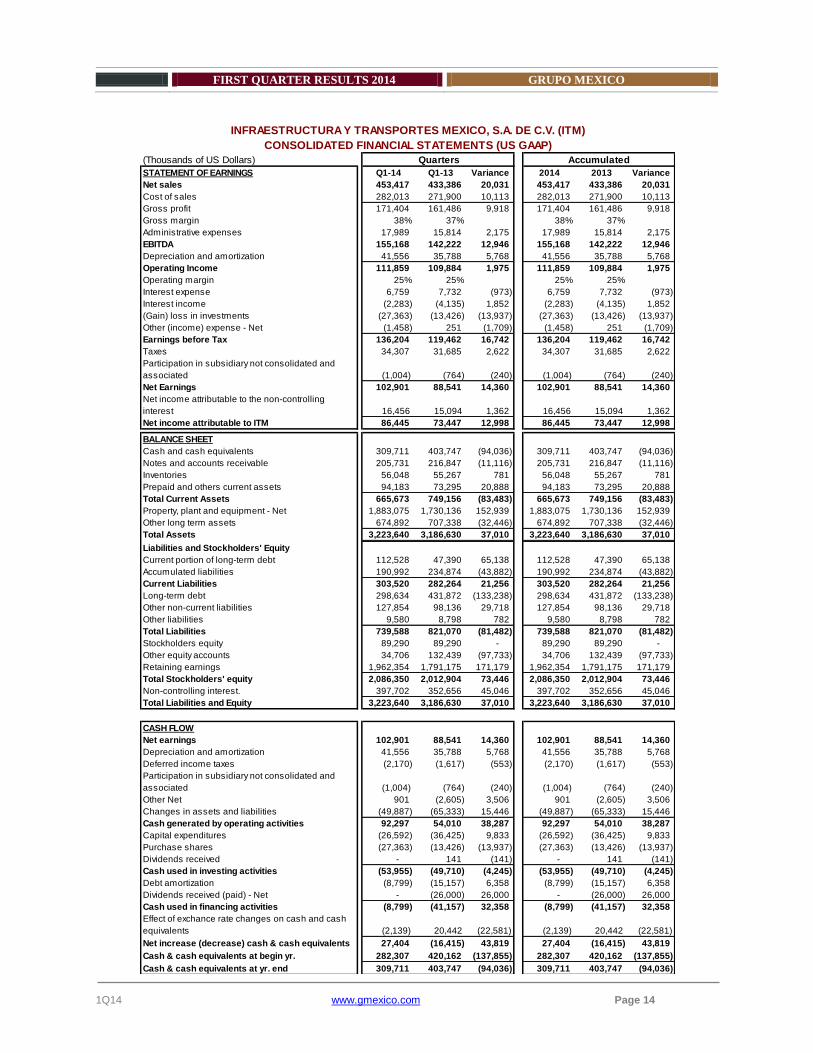
INFRAESTRUCTURA Y TRANSPORTES MEXICO, S.A. DE C.V. (ITM)
CONSOLIDATED FINANCIAL STATEMENTS (US GAAP)
Quarters Accumulated

FIRST QUARTER RESULTS 2014 GRUPO MEXICO
1Q14 www.gmexico.com Page 15
(Thousands of US Dollars)
STATEMENT OF EARNINGS Q1-14 Q1-13 Variance 2014 2013 Variance
Net sales 90,535 77,198 13,337 90,535 77,198 13,337
Cost of sales 55,156 43,195 11,961 55,156 43,195 11,961
Gross profit 35,380 34,003 1,377 35,380 34,003 1,377
Gross margin 39% 44% 39% 44%
Administrative expenses 3,293 3,913 (621) 3,293 3,913 (621)
EBITDA 32,984 32,132 852 32,984 32,132 852
Depreciation and amortization 9,549 7,211 2,337 9,549 7,211 2,337
Operating income 22,539 22,879 (340) 22,539 22,879 (340)
Operating margin 25% 30% 25% 30%
Interest expense 12,043 10,481 1,562 12,043 10,481 1,562
Interest income (1,568) (1,848) 280 (1,568) (1,848) 280
Other (income) expense, net (897) (2,042) 1,145 (897) (2,042) 1,145
Earnings before Tax 12,961 16,288 (3,328) 12,961 16,288 (3,328)
Taxes 13,948 14,977 (1,029) 13,948 14,977 (1,029)
Net Earnings (987) 1,311 (2,298) (987) 1,311 (2,298)
BALANCE SHEET
Cash and cash equivalents 103,062 52,206 50,857 103,062 52,206 50,857
Restricted cash 68,593 83,816 (15,223) 68,593 83,816 (15,223)
Notes and accounts receivable 66,580 73,898 (7,318) 66,580 73,898 (7,318)
Inventories 19,607 20,290 (683) 19,607 20,290 (683)
Prepaid and others current assets 130,258 138,272 (8,014) 130,258 138,272 (8,014)
Total Current Assets 388,101 368,482 19,619 388,101 368,482 19,619
Property, plant and equipment, Net 1,421,929 1,087,958 333,971 1,421,929 1,087,958 333,971
Other long term assets 508,546 461,984 46,562 508,546 461,984 46,562
Total Assets 2,318,576 1,918,424 400,152 2,318,576 1,918,424 400,152
Liabilities and Stockholders' Equity
Current portion of long-term debt 252,453 45,934 206,520 252,453 45,934 206,520
Accumulated liabilities 286,551 252,136 34,415 286,551 252,136 34,415
Current Liabilities 539,004 298,070 240,934 539,004 298,070 240,934
Long-term debt 935,215 851,467 83,747 935,215 851,467 83,747
Other non-current liabilities 306,528 322,528 (16,000) 306,528 322,528 (16,000)
Total Liabilities 1,780,747 1,472,065 308,681 1,780,747 1,472,065 308,681
Stockholders equity 667,497 491,410 176,087 667,497 491,410 176,087
Other equity accounts (189,444) (69,865) (119,579) (189,444) (69,865) (119,579)
Retaining earnings 59,738 24,813 34,925 59,738 24,813 34,925
Total Stockholders' equity 537,792 446,359 91,433 537,792 446,359 91,433
Non-controlling interest. 38 - 38 38 - 38
Total Liabilities and Equity 2,318,576 1,918,424 400,152 2,318,576 1,918,424 400,152 - - - - - -
CASH FLOW
Net earnings (987) 1,311 (2,298) (987) 1,311 (2,298)
Depreciation and amortization 9,549 7,211 2,338 9,549 7,211 2,338
Deferred income taxes 6,547 5,567 980 6,547 5,567 980
Other Net (1,308) (9,853) 8,545 (1,308) (9,853) 8,545
Changes in assets and liabilities 22,149 152,356 (130,207) 22,149 152,356 (130,207)
Cash generated by operating activities 35,950 156,592 (120,642) 35,950 156,592 (120,642)
Capital expenditures (23,741) (217,840) 194,099 (23,741) (217,840) 194,099
Restricted cash (53,357) (34,152) (19,205) (53,357) (34,152) (19,205)
Other - Net 56,156 40,370 15,786 56,156 40,370 15,786
Cash used in investing activities (20,942) (211,622) 190,679 (20,942) (211,622) 190,679
Debt incurred 14,146 14,942 (796) 14,146 14,942 (796)
Debt amortization (12,123) (13,294) 1,171 (12,123) (13,294) 1,171
Other - Net 4,765 37,440 (32,675) 4,765 37,440 (32,675)
Cash used in financing activities 6,788 39,088 (32,300) 6,788 39,088 (32,300)
Net increase (decrease) cash & cash equivalents 21,796 (15,941) 37,737 21,796 (15,941) 37,737
Cash & cash equivalents at begin yr. 81,266 68,148 13,118 81,266 68,148 13,118
Cash & cash equivalents at yr. end 103,062 52,206 50,855 103,062 52,206 50,855
MÉXICO PROYECTOS Y DESARROLLOS, S.A. DE C.V. (MPD)
CONSOLIDATED FINANCIAL STATEMENTS (US GAAP)
Quarters Accumulated