ec aa t : l …
TRANSCRIPT

EC�AA T��� �: L������� �� E������� I���������
Debraj Ray, University of Warwick, Summer ����
Slides �: Introduction
Slides �: Personal Inequality: Occupational Choice
Slides �: Functional Inequality: The Falling Labor Share
Slides �: Inequality and Conflict
Slides �s: Supplement: More on Cross-Group Violence
Postscript [if there is time]: Publishing without Perishing

I. Inequality and Divergence: Introduction

T�� G���� U-T���
The financial crisis sparked a new interest in inequality.
But inequality has been historically high
Growing steadily through late ��th century
Wol�, Piketty, Saez, Atkinson, many others
A classical view (due to Kuznets ����, ����)
Inequality rises and then falls with development
Instead: The Great U-Turn
Uneven versus compensatory changes
25%
30%
35%
40%
45%
50%
1910 1920 1930 1940 1950 1960 1970 1980 1990 2000 2010
Sha
re o
f top
dec
ile in
nat
iona
l inc
ome
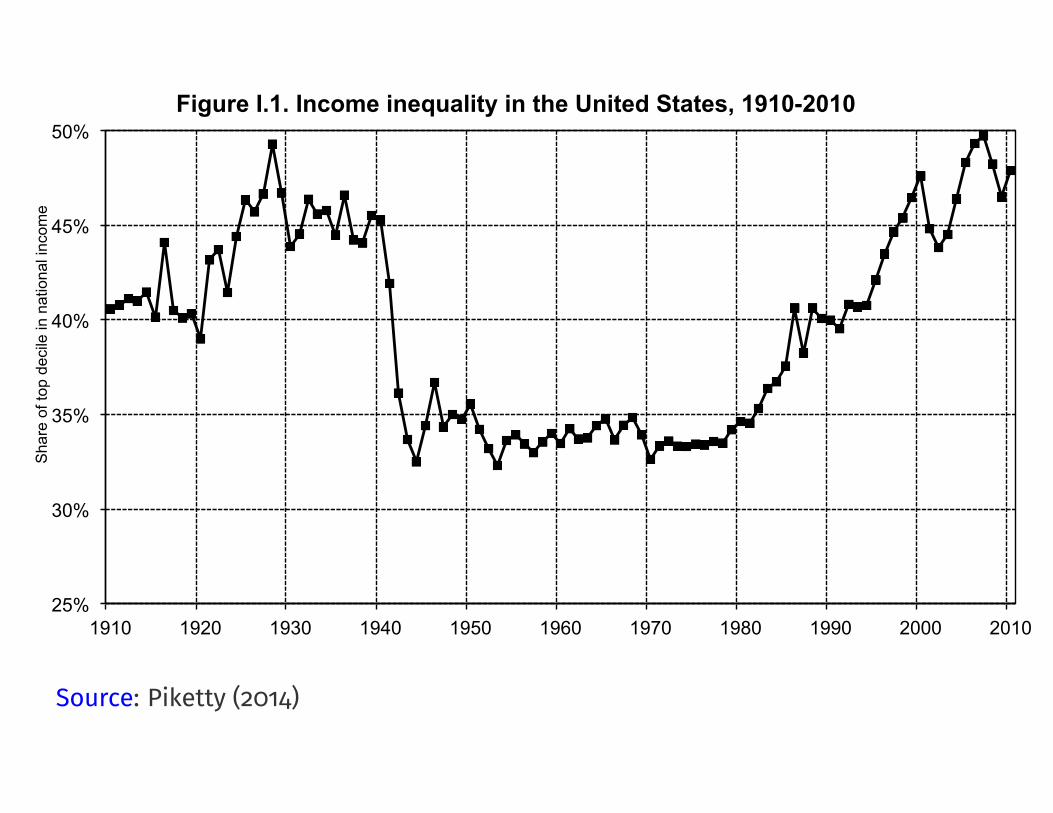
Figure I.1. Income inequality in the United States, 1910-2010
The top decile share in U.S. national income dropped from 45-50% in the 1910s-1920s to less than 35% in the 1950s (this is the fall documented by Kuznets); it then rose from less than 35% in the 1970s to 45-50% in the 2000s-2010s. Sources and series: see piketty.pse.ens.fr/capital21c.
Source: Piketty (����)

25%
30%
35%
40%
45%
50%
1900 1910 1920 1930 1940 1950 1960 1970 1980 1990 2000 2010
Sha
re o
f top
dec
ile in
tota
l inc
ome
The top decile income share was higher in Europe than in the U.S. in 1900-1910; it is a lot higher in the U.S. in 2000-2010. Sources and series: see piketty.pse.ens.fr/capital21c.
Figure 9.8. Income inequality: Europe vs. the United States, 1900-2010
U.S.
Europe
Source: Piketty (����)
0%
2%
4%
6%
8%
10%
12%
14%
16%
18%
20%
22%
24%
1910 1920 1930 1940 1950 1960 1970 1980 1990 2000 2010
Sha
re o
f top
per
cent
ile in
tota
l inc
ome
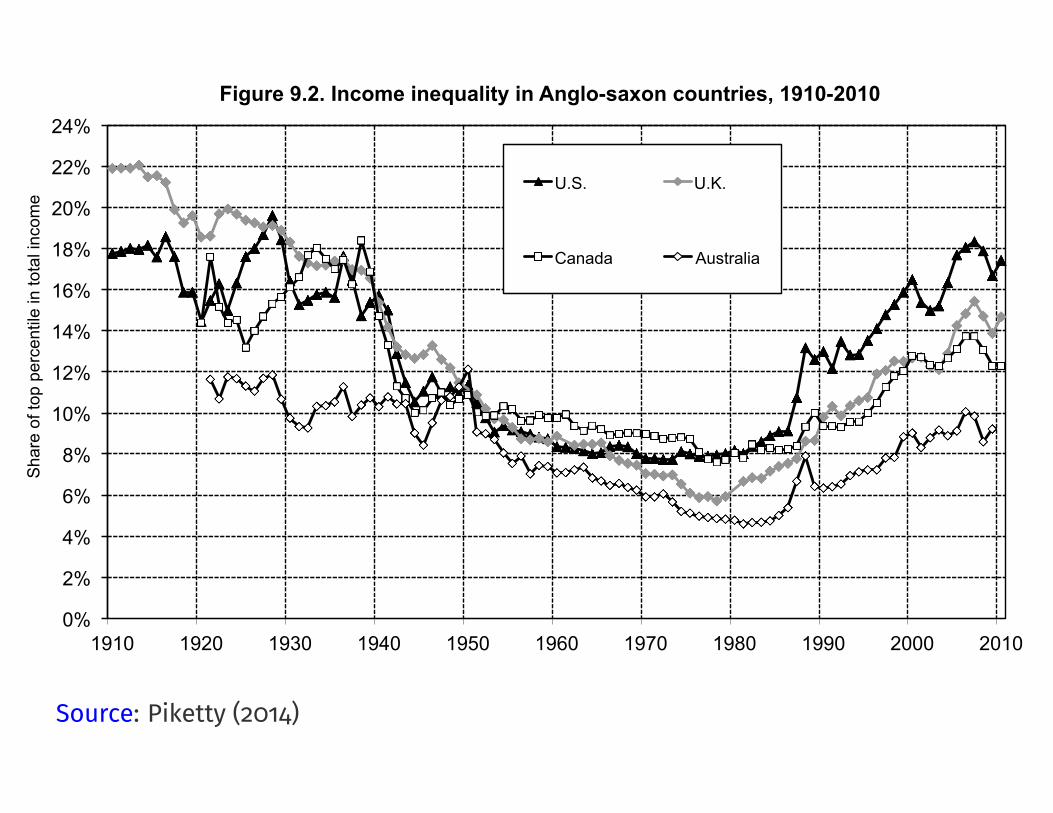
The share of top percentile in total income rose since the 1970s in all Anglo-saxon countries, but with different magnitudes. Sources and series: see piketty.pse.ens.fr/capital21c.
Figure 9.2. Income inequality in Anglo-saxon countries, 1910-2010
U.S. U.K.
Canada Australia
Source: Piketty (����)

0%
1%
2%
3%
4%
5%
6%
7%
8%
9%
10%
11%
12%
1910 1920 1930 1940 1950 1960 1970 1980 1990 2000 2010
Sha
re o
f top
0.1
% in
tota
l inc
ome
The share of the top 0.1% highest incomes in total income rose sharply since the 1970s in all Anglo-saxon countries, but with varying magnitudes. Sources and series: see piketty.pse.ens.fr/capital21c.
Figure 9.5. The top 0.1% income share in Anglo-saxon countries, 1910-2010
U.S. U.K.
Canada Australia
Source: Piketty (����)

P��������W��� I����-C������ I���������
Within-country:
Kuznets
Cross-country:
Solow
Neither story appears to work too well.

C������ �� ��� ���� C������
A recent book by Piketty:
summarizes the evidence (compelling and useful)
describes three “fundamental laws”
is a runaway hit in the United States, touching a raw nerve

P������’� T���� F���������� L���
First Fundamental Law:
Capital IncomeTotal Income
=Capital IncomeCapital Stock
⇥ Capital StockTotal Income
.
“Share of capital income � ROR on capital times the capital-output ratio”
Useful in organizing our mental accounting system.
Not an explanation.

Second Fundamental Law:
“Growth rate equals savings rate divided by capital-output ratio”
Derive:
K(t+ 1) = [1� �(t)]K(t) + I(t) = [1� �(t)]K(t) + s(t)Y (t)
Convert to growth rates:
G(t) =s(t)
✓(t)� �(t),
where G(t) = [K(t+ 1)�K(t))]/K(t) and ✓(t) = K(t)/Y (t).
Approximate per-capita version: subtract population growth rate:
g(t) ' s(t)
✓(t)� �(t)� n(t),
Note: Not a theory unless you take a stand on one or more of the variables.

B��������: “E���������” C������-O����� R����� U���� G����� R����!
Piketty:
“If one now combines variations in growth rates with variations in savings rate, it is
easy to explain why di�erent countries accumulate very di�erent quantities of
capital. . .One particularly clear case is that of Japan: with a savings rate close to ��
percent a year and a growth rate barely above � percent, it is hardly surprising that
Japan has over the long run accumulated a capital stock worth six to seven years
of national income. This is an automatic consequence of the [second] dynamic law
of accumulation.” (p.���)
“The very sharp increase in private wealth observed in the rich countries, and
especially in Europe and Japan, between ���� and ���� thus can be explained
largely by slower growth coupled with continued high savings, using the [second]
law . . . ” (p. ���)

The Third Fundamental Law:
r > g
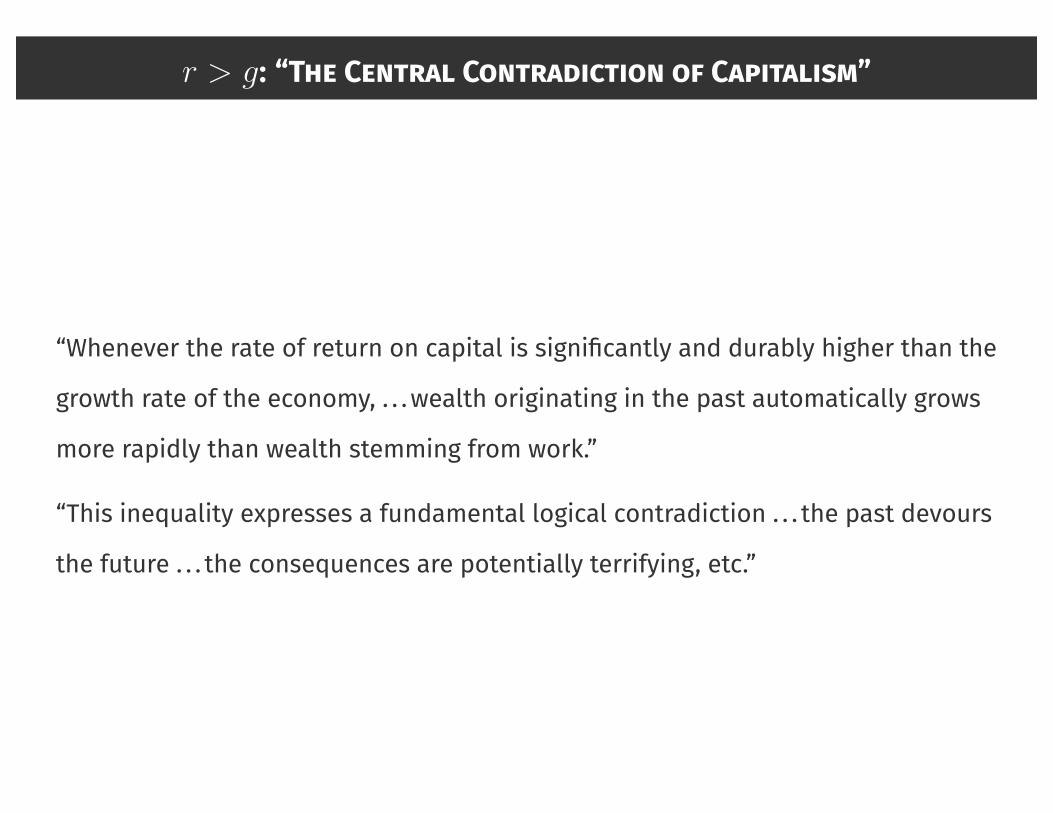
r > g: “T�� C������ C������������ �� C���������”
“Whenever the rate of return on capital is significantly and durably higher than the
growth rate of the economy, . . .wealth originating in the past automatically grows
more rapidly than wealth stemming from work.”
“This inequality expresses a fundamental logical contradiction . . . the past devours
the future . . . the consequences are potentially terrifying, etc.”

r > g in the data.
0%
1%
2%
3%
4%
5%
6%
0-1000 1000-1500 1500-1700 1700-1820 1820-1913 1913-1950 1950-2012 2012-2050 2050-2100
Ann
ual r
ate
of re
turn
or r
ate
of g
row
th
The rate of return to capital (pre-tax) has always been higher than the world growth rate, but the gap was reduced during the 20th century, and might widen again in the 21st century.
Sources and series: see piketty.pse.ens.fr/capital21c
Figure 10.9. Rate of return vs. growth rate at the world level, from Antiquity until 2100
Pure rate of return to capital r (pre-tax)
Growth rate of world output g

N�� � T��������, T���, B�� �� E��������� C��������
Return to Solow model with production function:
Yt = AK✓t [(1 + �)tLt]
1�✓,
where � is technical progress.
Capital accumulation:
K(t+ 1) = [1� �(t)]K(t) + s(t)Y (t).
Impose s(t) = s, �(t) = �, and Lt growing at rate n to get:
yt = Ak✓t
and
(1 + n)(1 + �)kt+1 = (1� �)kt + sAk✓t
Normalization: kt ⌘ Kt/Lt(1 + �)t and yt ⌘ Yt/Lt(1 + �)t.

N�� � T��������, T���, B�� �� E��������� C��������
So far: yt = Ak✓t and (1 + n)(1 + �)kt+1 = (1� �)kt + sAk✓t , so that
kt ! k⇤ '
sA
n+ � + �
�1/(1�✓)
and
yt ! y⇤ ' A1/(1�✓)
s
n+ � + �
�✓/(1�✓)
.
So the overall rate of growth converges to n+ �.
On the other hand, r is given by the marginal product:
rt = ✓A⇥Kt/(1 + �)tLt
⇤✓�1
= ✓Ak✓�1t
! ✓A
sA
n+ � + �
��1
=✓
s[n+ � + �],

N�� � T��������, T���, B�� �� E��������� C��������
So down to comparing r = ✓s [n+ � + �] with g = n+ �.
) r > g if ✓ � s (surely true empirically, but also for deeper reasons):
s is ine�cient if consumption can be improved in all periods.
Easy example: s = 1, but there are others.
Recall that Yt/Lt converges to
A1/(1�✓)(1 + �)t✓
s
n+ � + �
◆✓/(1�✓)
and per-capita consumption converges to the path
A1/(1�✓)(1 + �)t✓
s
n+ � + �
◆✓/(1�✓)
(1� s).
It follows that if s > ✓, the growth path is ine�cient.
So e�ciency implies r > g, but there is no prediction for inequality.

D����������� S������ R����
The Third Law is really a simple statement about di�erential savings rates.
For instance, assume that the rich earn predominantly capital income
yt = ct + kt
kt = syt, yt+1 = rkt
y(t) = y(0)(1 + sr)t
If initial rich share is x(0), and g is rate of growth, then t periods later:
x(t) = x(0)
✓1 + sr
1 + g
◆t
Can back out r if we know s and {x(t)}:
r =[x(t)/x(0)]1/t(1 + g)� 1
s
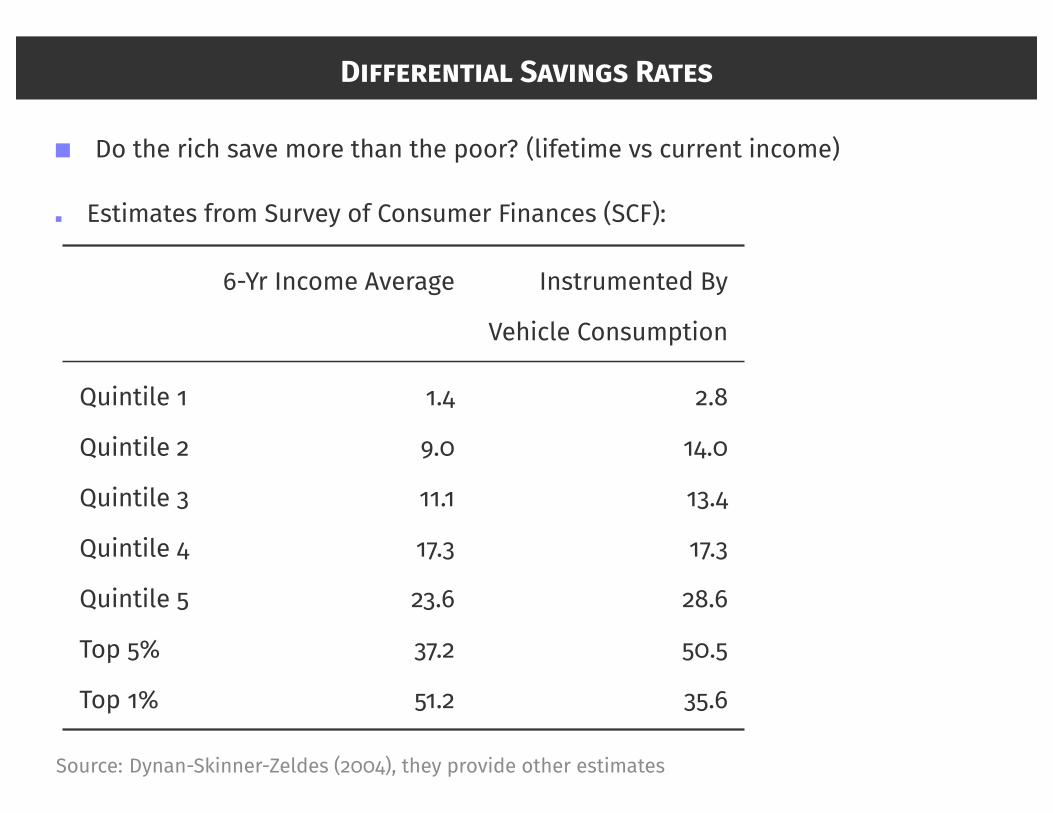
D����������� S������ R����
Do the rich save more than the poor? (lifetime vs current income)
Estimates from Survey of Consumer Finances (SCF):
�-Yr Income Average Instrumented By
Vehicle Consumption
Quintile � �.� �.�
Quintile � �.� ��.�
Quintile � ��.� ��.�
Quintile � ��.� ��.�
Quintile � ��.� ��.�
Top �� ��.� ��.�
Top �� ��.� ��.�
Source: Dynan-Skinner-Zeldes (����), they provide other estimates

r =[x(t)/x(0)]1/t(1 + g)� 1
s
Some quick calculations for top ��� in the US:
x0 = 1/3 in ����, rises to xt = 47/100 in ����.
Estimate for g: �� per year.
Estimate from Dynan et al for s: ��� (optimistic).
Can back out for r: r = 9.7%.
Inflation-adjusted rate of return on US stocks over ��th century: �.��
Much lower in the ����s and ����s, higher in the ����s and ����s.

r =[x(t)/x(0)]1/t(1 + g)� 1
s
Similar calculations for top �� in the US:
x0 = 8/100 in ����, rises to xt = 18/100 in ����.
Estimate for g: �� per year.
Estimate from Dynan et al for s: ���.
Can back out for r: r = 10.5%.

r =[x(t)/x(0)]1/t(1 + g)� 1
s
Try the top �.�� for the United States:
x0 = 2.2/100 in ����, rises to xt = 8/100 in ����.
Estimate for g: �� per year.
If these guys also save at �.�, then r = 14.4%!
If they save 3/4 of their income, then r = 9.6%.

r =[x(t)/x(0)]1/t(1 + g)� 1
s
Slightly better job for Europe, but not much. Top ���:
x0 = 29/100 in ����, rises to xt = 35/100 in ����.
Estimate for g: �� per year.
Estimate from Dynan et al for s: ���.
Can back out for r: r = 7.5%.
High relative to r in Europe.
UK the highest at �.�� over ��th century, others appreciably lower.
r =[x(t)/x(0)]1/t(1 + g)� 1
s
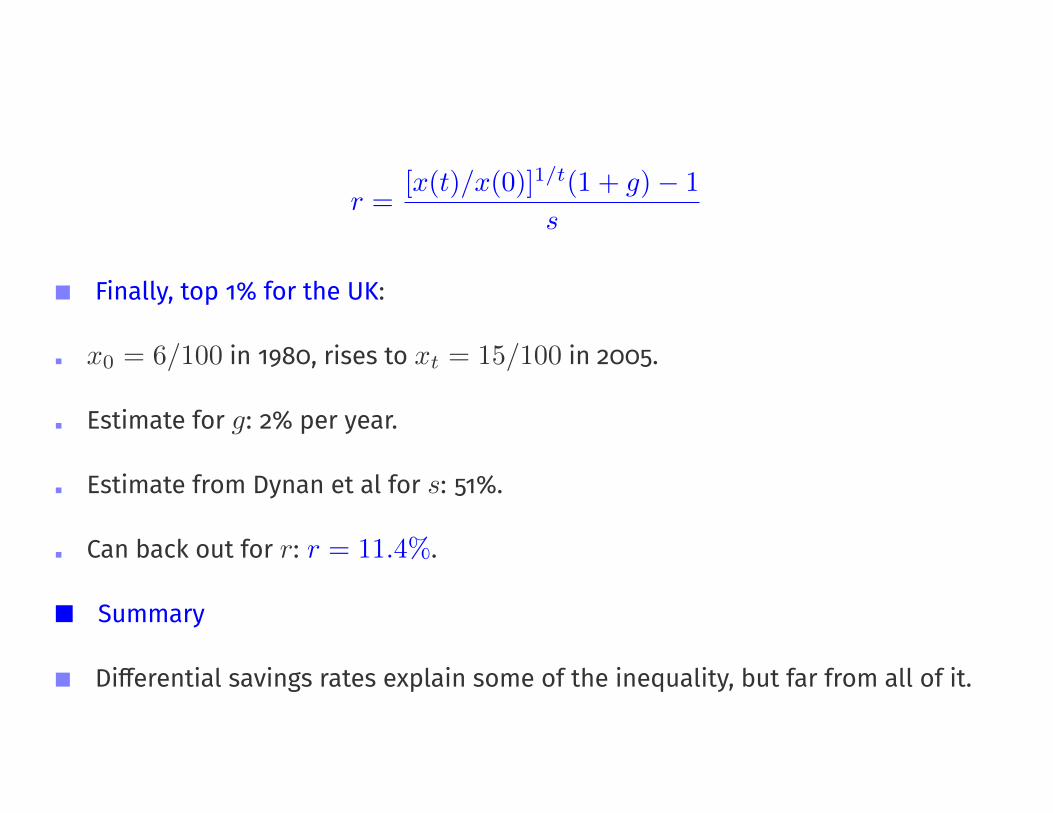
Finally, top �� for the UK:
x0 = 6/100 in ����, rises to xt = 15/100 in ����.
Estimate for g: �� per year.
Estimate from Dynan et al for s: ���.
Can back out for r: r = 11.4%.
Summary
Di�erential savings rates explain some of the inequality, but far from all of it.

W��� E������� ��� R���� �� R����� �� ��� R���?
Two groups of answers:
I. Physical access to higher rates of return.
II. Behavioral access to higher rates of return.
On I.
Stocks, hedge funds?
Private unincorporated businesses? (moral hazard, adverse selection)
Human capital? (inalienability)
On II.
Informational? (See Supplement)
Other behavioral reasons for underparticipation in capital markets � functional
move away from labor to capital.