eca cost of capital report
TRANSCRIPT

U:\Projects\CC Water - Milestone 3 (WACC) 474\Docs\CC Water Cost of capital_Summary report~draft-
8a.docx 24/02/2014
Ofwat PR14 review
Recommendations for the
Weighted Average Cost of
Capital 2015-20
Summary report
February 2014
submitted to the
Consumer Council for Water
by
Economic Consulting Associates
Economic Consulting Associates Limited
41 Lonsdale Road, London NW6 6RA, UK
tel: +44 20 7604 4546, fax: +44 20 7604 4547
www.eca-uk.com
ECONOMIC
CONSULTING
ASSOCIATES

Recommendations for WACC 2015-20, Summary report, February 2014
Contents
i
Contents
Abbreviations and acronyms iv
1 Introduction 1
1.1 Aims and steps 1
1.2 Developments in PR14 1
1.3 Assessment of WACC for PR14 2
2 Analysis of appropriate WACC for PR14 3
2.1 Top down approach indications 3
2.2 Bottom up approach – analysis of WACC factors 5
2.3 Future risk factors 12
ANNEXES 15
A1 Components of Cost of Capital 15
A2 Evidence from precedents and market activity 17
A2.1 Precedents for cost of capital – the declining trend 17
A2.2 Empirical evidence from market transaction activity 18
A2.3 Ofwat’s management of expectations 18
A2.4 Changes in risk profile 19
A3 Components of WACC: cost of debt 20
A3.1 Cost of new debt 20
A3.2 Unanticipated inflation 21
A3.3 Weighting existing (embedded) debt 22
A3.4 Conclusions on the cost of debt 23
A4 Components of WACC: risk free rate 24
A5 Components of WACC: market risk premium 27
A6 Components of WACC: equity beta 31
A6.1 The evidence from share price movements 31
A6.2 Market expectations of the beta estimate 39
A6.3 Conclusions on the equity beta 39
A7 Components of WACC: gearing 41
A8 Small company premium 43
U:\Projects\CC Water - Milestone 3 (WACC) 474\Docs\CC Water Cost of capital_Summary report~draft-8b.docx 24/02/2014
Recommendations for WACC 2015-20, Summary report, February 2014
Tables and figures
ii
A8.1 Debt 43
A8.2 Equity 43
A9 Comparison with Ofwat Guidance issued January 2014 45
A9.1 Debt 45
A9.2 Risk free rate 45
A9.3 Equity market risk premium 45
A9.4 Equity beta 46
A9.5 Gearing 47
A9.6 Summary 47
A10 Simulation approach 48
Tables and figures
Tables
Table 1 Regulatory precedents on WACC 4
Table 2 Effect of unanticipated inflation 22
Table 3 Regulatory precedents for risk free rate 25
Table 4 Equity risk premium precedents 27
Table 5 Returns on UK asset classes 1900 to 2012 28
Table 6 Real returns 1900 to 2012 28
Table 7 Estimated equity betas 32
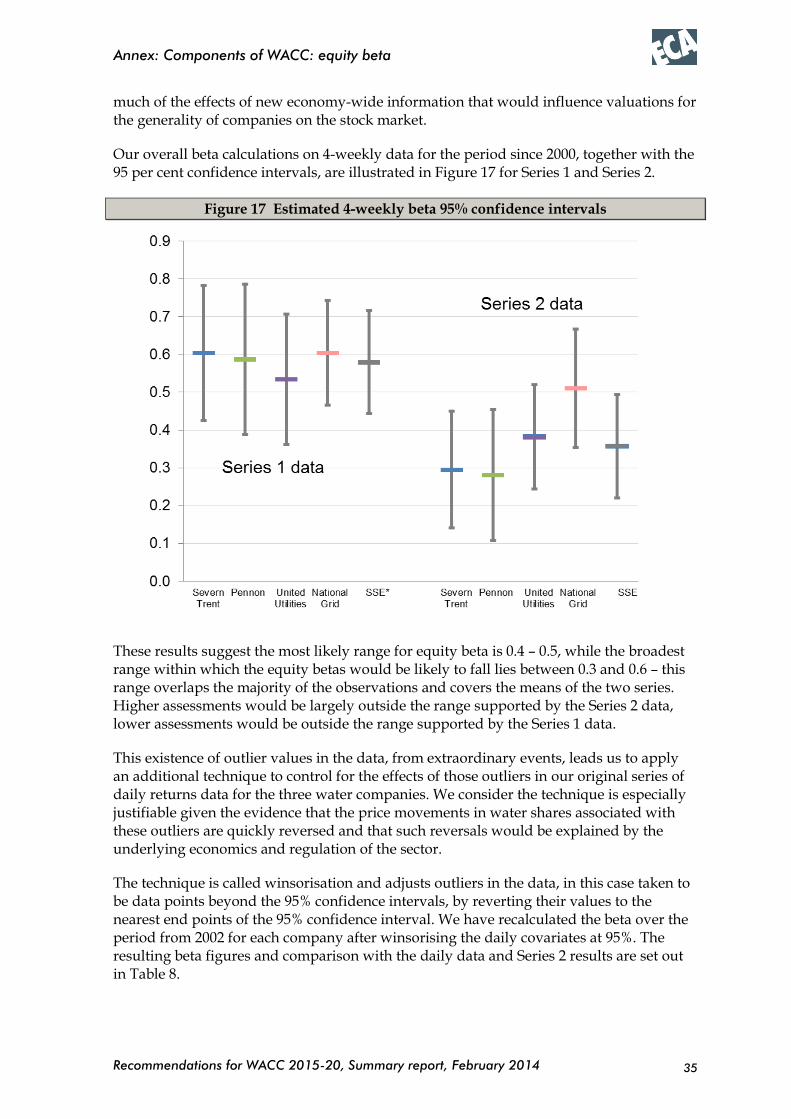
Table 8 Winsorised daily equity betas compared to Series 2 data 36
Table 9 Comparison between WACC calculations 47
Figures
Figure 1 Vanilla WACC trend of regulated values 2004-2013 4
Figure 2 Interest rates on water sector index-linked debt vs deflated benchmarks 6
Figure 3 Risk free rate regulatory precedents since 2009 7
Figure 4 Average trailing 5-year monthly equity betas for returns on each day of the month 9
Figure 5 Equity beta estimates over multiple return periods and series starting points 9
Figure 6 Increasing trend in gearing in the water sector 10
Figure 7 Recent trends and proposed range for WACC 12
Recommendations for WACC 2015-20, Summary report, February 2014
Tables and figures
iii
Figure 8 Increase of RCV compared to MEAV 19
Figure 9 Interest rates on water sector index-linked debt vs. deflated benchmarks 20
Figure 10 Interest rates on water sector nominal debt vs benchmarks 21
Figure 11 Real yield of recent index-linked bonds 24
Figure 12 Trends in risk free rate determinations 26
Figure 13 Dividend yield for UK market 29
Figure 14 Estimated 2-year daily equity return betas 32
Figure 15 Betas based on 4-weekly returns data – Series 1 34
Figure 16 Betas based on 4-weekly data – Series 2 34
Figure 17 Estimated 4-weekly beta 95% confidence intervals 35
Figure 18 Average trailing 5-year monthly equity betas for returns on each day of the month 36
Figure 19 Average beta estimates over multiple return periods and series starting dates 38
Figure 20 Company beta estimates over multiple return periods and series starting dates38
Figure 21 Increasing trend in actual and notional gearing in the water sector 41
Figure 22 Example histogram of simulated WACC values 49

Recommendations for WACC 2015-20, Summary report, February 2014
Abbreviations and acronyms
iv
Abbreviations and acronyms
AMP5 Asset management plans period 5 (April 2010 to March 2015)
CAA Civil Aviation Authority
capex Capital expenditure
CAPM Capital asset pricing model
CC Competition Commission
CC Water, CCW
The Consumer Council for Water
CoD Cost of debt
CoE Cost of equity
DMS Dimson, Marsh and Staunton data set
ECA Economic Consulting Associates
E(M)RP Equity (market) risk premium
FD Final determinations
MEAV Modern equivalent asset value (the value of assets in today’s prices)
NIE Northern Ireland Electricity
opex Operating expenditure
PMICR Post-maintenance interest coverage ratio
PR09 Ofwat’s 2009 price review for UK water companies
PR14 Ofwat’s 2014 price review for UK water companies
RCV Regulatory Capital Value
RFR Risk free rate
RPI Retail Price Index
SONI Northern Ireland electricity transmission system operator
Vanilla WACC
Weighted average cost of capital taking pre-tax debt and post-tax equity
WACC Weighted Average Cost of Capital
WASC Water and Sewerage Company
WOC Water-only company
Recommendations for WACC 2015-20, Summary report, February 2014
Introduction
1
Executive Summary
1 Introduction
This report provides a summary and high level overview of the main considerations and factors for the assessment of WACC for PR14. It also provides an estimate of the range within which we consider WACC is likely to fall for the period 2015-20. The annexes give some further details on key parameters and variables in the WACC calculation assumptions.
We note that vanilla WACC has tended to be on a falling trend for the past 5 years, as evidenced by various regulatory precedents in the network and utility industries which have fallen from 5.45% to 4.10% since 2009, a range of 1.35%. Our belief is that the decline is due to a sharp drop in underlying WACC and that regulators are adopting a gradual approach down to actual underlying WACC. While the trend may not continue indefinitely, the range illustrates the degree of uncertainty likely to exist in future projections
Our conclusion is that Vanilla WACC is likely to fall a little further and lie within the range 3.0% - 3.75% for the 2015-20 period, although we accept that regulatory precedent and caution suggests a value in the range 3.6% - 3.9% may be fixed, as indicated by Ofwat.
1.1 Aims and steps
This report provides a summary of our assessment of the appropriate weighted average cost of capital (WACC) for PR14.
We recognise that delivery of a cost of capital that is acceptable to both consumers and also companies and their investors is a balancing act between keeping prices as low as possible and ensuring that companies remain financeable and continue to invest appropriately. We also note that WACC is unlikely to be constant over the 5 year period. Our proposals take this into account by providing an estimated range of values within which we think the final WACC should be determined.
1.2 Developments in PR14
We note that for PR14 Ofwat is proposing to separate the price controls for wholesale and retail. Ofwat will allow a net retail margin for retail activities rather than a WACC. This will be included in retail prices for household customers and incorporated into the default tariffs for non-household customers. This net retail margin, expected to be 0.15%, will be set at a level to compensate for operational risks and to allow a return on retail capital employed.
Consequently the risks covered by the WACC will relate to wholesale risk only and hence will be more akin to the risks covered by the WACC set for energy networks (although we
Recommendations for WACC 2015-20, Summary report, February 2014
Introduction
2
recognise that the water supply chain also includes the upstream activities of reservoirs and water extraction).
Consequently this report sets out proposals for the range of WACC values that could be applied for all the sector companies’ wholesale businesses, although we also give consideration to a differential for small companies.
Setting the cost of capital is an important element of the water price review. It represented some 27 per cent of the overall revenue requirement in Ofwat’s PR09 (2010-15) final determinations – £12.9 billion over the five year period. The cost of capital is now responsible for more than £100 each year in the water and sewerage bills for the average household in England and Wales (27 per cent of the £376 current average annual household water and sewerage bill reported by Ofwat for 2012-13). It is a real cost, but one which cannot be fully observed – rather, it must be based on estimation of a variety of parameters. As not all the parameters have directly observable evidence, some judgement is necessary in arriving at proposed values. This summary report sets out the evidence and our proposals for the values of the component factors of WACC.
1.3 Assessment of WACC for PR14
Our analysis indicates a range for the value of WACC below that which has previously been applied. Building on our draft report, we have conducted robustness checks on all the parameters in the WACC calculation and have determined that an appropriate vanilla1 WACC lies in the range:
Vanilla WACC 3.0% – 3.75%
The corresponding assumptions for the ranges of the key parameters2 in WACC are:
Equity beta 0.5 – 0.6
Cost of equity (post-tax) 3.5% – 4.8%
Cost of debt (pre-tax) 2.6% – 2.9%
Gearing 60%
The rationale for these parameters is summarised in the following subsections with additional notes and data given in the supporting annexes.
Comparison with Ofwat
In their guidance note of January 2014, ‘Setting price controls for 2015-20 – risk and reward guidance’, Ofwat estimated a WACC of 3.6% - 3.9%, with a point estimate of 3.85%. Our range differs primarily in having a significantly lower cost of equity due to a much lower equity beta (Ofwat’s range is 0.75 – 0.80).
1 Vanilla WACC is calculated taking pre-tax debt rates (since interest charges are tax deductible) and post-tax equity returns (since dividends are paid post tax) 2 Our assumption is that the parameters are most likely to be determined within these ranges over the 5 year period 2015-20, but there is a 5%-10% chance that the values might lie outside the ranges
Recommendations for WACC 2015-20, Summary report, February 2014
Analysis of appropriate WACC for PR14
3
Our approach
To arrive at these estimates, we have undertaken both top down and bottom up assessments. In the top down approach we have examined regulatory precedents on the cost of capital in both the water sector and related sectors, particularly energy networks, and also considered market evidence of recent regulatory transactions. We have also undertaken a more detailed bottom up analysis assessing each of the cost of capital components and their drivers. We have particularly focussed on the beta values and the cost of debt for two reasons:
These items are specific to the water industry and the sector risk characteristics rather than generic market parameters
There are strong indications from the recent trends that there is scope within these parameters to set rates below recent regulatory precedents.
Some of the analyses draw on evidence from the parallel study we are carrying out on the 2012-13 update of the financial performance of companies over the PR09 period to date.
2 Analysis of appropriate WACC for PR14
2.1 Top down approach indications
Evidence from regulatory precedents
It is helpful to look at regulatory precedents on setting WACC over the recent past in the network and utility sectors. While WACC determinations are intended to be forward looking, it is notable over the past several years that, while WACC has been falling, regulatory determinations appear to be lagging behind. This may partly be due to a measure of caution in the face of uncertain change, but also the regulatory duty to the sector where some companies may in reality be facing higher (efficient) costs of capital.
We have focused on water and energy sector precedents when considering the overall assessment of WACC (rather than for example, airports, rail and communications) as network energy companies have broadly similar characteristics in terms of, for example, risk and gearing to water companies. The following table summarises regulator precedents from 2004 to date.

Recommendations for WACC 2015-20, Summary report, February 2014
Analysis of appropriate WACC for PR14
4
Table 1 Regulatory precedents on WACC
Vanilla
Organisation Sector/company Year WACC
CC NIE (provisional) 2013 4.10%
Ofgem Electricity distribution (WPD) 2013 4.24%
Ofgem Gas distribution 2012 4.24%
Ofgem Gas transmission 2012 4.38%
Ofgem Electricity transmission 2012 4.55%
CC Bristol water 2010 4.98%
Ofwat Water 2009 5.08%
Ofwat Water (small cos) 2009 5.45%
Ofgem Electricity distribution 2009 4.70%
Ofgem Gas distribution 2007 4.94%
Ofgem Transmission 2006 5.05%
Ofwat Water 2004 5.83%
Ofgem Electricity distribution 2004 5.50%
These precedents exhibit a clear downward trend as shown in the chart in Figure 1 below.
Figure 1 Vanilla WACC trend of regulated values 2004-2013
Extrapolating this graph would suggest a continuing rapid downward trend. However, it is our contention that cost of capital has previously been set at too high a level for some time and that regulators and the Competition Commission are only slowly reducing allowed cost of capital to its actual level. This ‘correction’ might be exacerbating the slope of the downward trend (and would mean that the downward trend cannot be simply projected as it does not necessarily reflect the underlying trend in real WACC), nevertheless, underlying sector factors are also significant.
Recommendations for WACC 2015-20, Summary report, February 2014
Analysis of appropriate WACC for PR14
5
This can be seen in some of the regulatory settlements where regulators assess a range for cost of capital (or its components) but the determination is at or towards the top of the range. For example, in 2010 the Competition Commission assessed a range for WACC for Bristol Water of 3.8%-5.0% yet their determination was 5.0%.
Evidence from market transactions
Additional evidence for cost of capital being set at too high a level in the past can be seen in the premiums to Regulatory Capital Value (RCV) of transactions:
In June 2013 Severn Trent rejected a bid valuing it at £5.3bn which represented a premium over RCV of approximately 30%. The Board stated that the bid undervalued Severn Trent.
A year earlier, in June 2012, Veolia sold 90% of its water business for a total transaction value of £1.24bn. This also represented a premium of about 30% on RCV.
These indicate that buyers appear prepared to accept returns below the existing level of WACC and are not inconsistent with other transactions in the water sector during AMP5 with five out of six completed transactions at a premium of around 25-30%. This suggests that bidders believe that there are substantial outperformance opportunities and/or that the allowed WACC has been set above actual WACC.
Consequently, the evidence of recent financial performance and transactions in the sector suggests that Ofwat’s currently allowed WACC of 5.1% (vanilla) is substantially higher than the actual WACC incurred. For example if the bid premiums suggest that WACC might have been overestimated by up to 25%-30%, the underlying WACC implied by the bids would have been 3.9% - 4.1%.
We also note in annex A2.4 that the RCV as a proportion of the actual asset value (technically the modern equivalent asset value, MEAV) is increasing and will continue to increase, which suggests that water company risk is reducing and hence betas may continue to reduce.
2.2 Bottom up approach – analysis of WACC factors
Each of the components of WACC (see annex A1) may be separately assessed and the likely range of WACC values determined from a build-up of parameter values3, also taking account of the ranges of the component factors. This section summaries the approach and sets out our preliminary assumptions for each factor.
3 This build-up can be done by arbitrarily picking values from each of the ranges, eg the lowest of each range together and the highest of each range together, or by a monte carlo simulation drawing values at random from within each range and combining them – repeated many times to obtain a probability distribution of WACC – see annex A10

Recommendations for WACC 2015-20, Summary report, February 2014
Analysis of appropriate WACC for PR14
6
2.2.1 Proposed ranges for each parameter
The following subsections summarise the data and key parameters in our estimation of the likely values for the main components of WACC.
Debt
Since PR09, interest rates on water sector debt have decreased significantly, in line with reductions of market benchmark yields. Figure 2 shows how strong this trend has been, with the data points for WOC and WASC index-linked debt issue yields indicating how far below the PR09 assumptions companies have successfully issued new bonds. While not presented here, there is a similar trend for fixed-rate debt issues.
Figure 2 Interest rates on water sector index-linked debt vs deflated benchmarks
In addition, our analysis suggests that companies have benefitted significantly from inflation that was higher than anticipated, to the tune of nearly £100 million in aggregate in 2012-13, providing an additional 0.3% to their return on equity.
Fixing a cost of debt in a range of 1.5%-2.0% as suggested by these data, would be unreasonably low for two reasons:
This does not take into account the costs of existing company debt, which must still be recovered. In 2012-13, companies had an average real cost of debt of 2.5%, down from 2.9% in 2011-12 (nominal costs of 5.4% and 6.6% respectively), however the relevant point will be the quantity and cost of embedded debt during the period 2015-20.
We believe that the recent ‘spot’ rate may be artificially low, as the central management of the economic situation has driven interest rates very low. Indeed, upward sloping yield curves today indicate market expectations of
Recommendations for WACC 2015-20, Summary report, February 2014
Analysis of appropriate WACC for PR14
7
higher interest rates in the future, suggesting we are at or near a turning point in yields. We assume new debt at a cost of 2.6% to 3.1%, on the assumption that rates will increase, and to ensure that all companies will be able to raise finance, not simply those with best access to debt capital markets4.
Based on these two points, we have assessed a sensible range for the cost of debt at 2.6% - 2.9%, based on a weighted average of old and the assumed range of new debt of 75:25, and incorporating a 0.1% allowance for the issuance costs of new debt. This reflects the lower costs for new debt issues, and gives incentives to companies to seek the lowest possible price when making new issues, but also allows headroom for the costs of existing debt and possible increases in the cost of new debt, as well as some insurance that all companies will be able to raise debt at cost-effective rates5.
Risk free rate
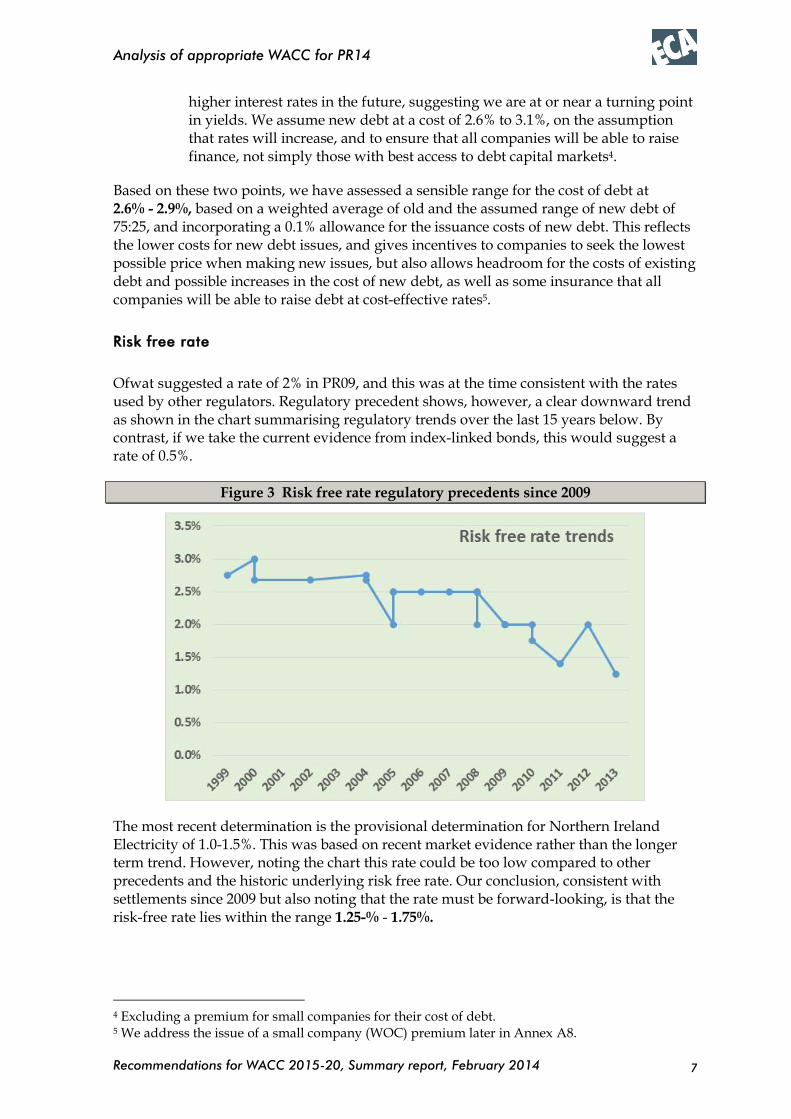
Ofwat suggested a rate of 2% in PR09, and this was at the time consistent with the rates used by other regulators. Regulatory precedent shows, however, a clear downward trend as shown in the chart summarising regulatory trends over the last 15 years below. By contrast, if we take the current evidence from index-linked bonds, this would suggest a rate of 0.5%.
Figure 3 Risk free rate regulatory precedents since 2009
The most recent determination is the provisional determination for Northern Ireland Electricity of 1.0-1.5%. This was based on recent market evidence rather than the longer term trend. However, noting the chart this rate could be too low compared to other precedents and the historic underlying risk free rate. Our conclusion, consistent with settlements since 2009 but also noting that the rate must be forward-looking, is that the risk-free rate lies within the range 1.25-% - 1.75%.
4 Excluding a premium for small companies for their cost of debt. 5 We address the issue of a small company (WOC) premium later in Annex A8.
Recommendations for WACC 2015-20, Summary report, February 2014
Analysis of appropriate WACC for PR14
8
Market risk premium (equity risk premium)
Since 2004 regulatory recommendations for the equity risk premium (ERP) have varied between 3.5% and 5.4%, with Ofwat the lowest (together with the CC) at 3.5% in 2004 and also the highest (at 5.4%) in 2009. Most regulatory settlements have been between 4.5% and 5.0% with an average of 18 recent settlements in the last ten years of 4.71%.
Bottom up analyses by us and others have included the following results and recommendations:
Analysing historic market returns between 1900 and 2012 suggests an ERP of 4.0 - 5.5%
An approach used by Fama and French adds average dividend yield to average dividend growth and implies an ERP of 4.4%, although if current dividend yields are used this would drop to 3.4%
A forward looking estimate of dividend yields used by Dimson, Marsh and Staunton suggests 4.5% - 5.0%
An estimate of future dividends used by the Competition Commission in 2013 suggesting around 4.5%
While historic returns are interesting, the rate should be forward looking. Taking all this evidence into account, we concur with the recent regulatory precedents and assess ERP at 4.5% - 5.0%.
Equity beta
Our estimation of an equity beta for the water sector is derived from a combination of the empirical evidence from the three largest listed companies (Severn Trent, Pennon and United Utilities6), and consideration of market expectations of equity returns. Our empirical analysis shows that the statistical approach for the beta estimation is critical for the calculation. Measures of beta using daily returns on a rolling two-year basis capture a few particularly volatile events but is probably a distortion of the underlying volatility of water company returns.
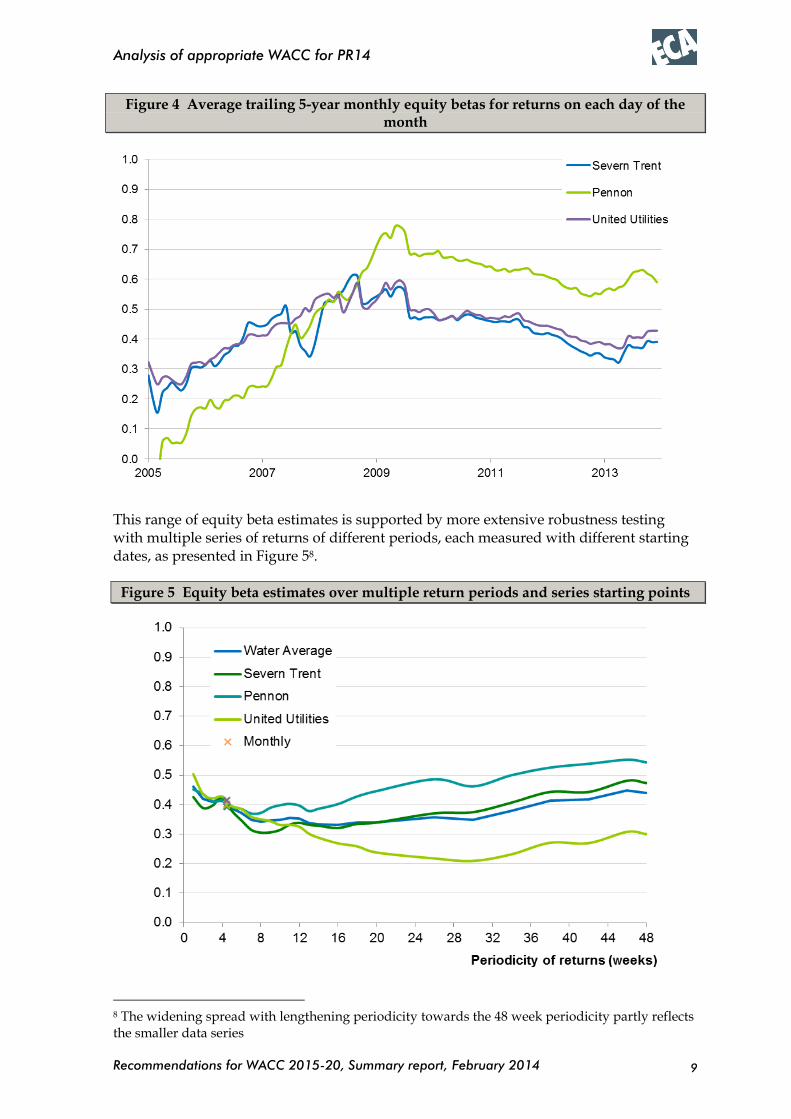
Extending the return period to one month, as is standard commercial practice, and by taking the average of the betas calculated using monthly returns from a set of series starting on each day of the month, we are able to control for these unusual events and derive a more sensible pattern of equity beta estimates for the companies. The average of these monthly series7 is presented in Figure 4.
6 Our analysis begins by measuring the equity beta, incorporating gearing. Where we have measured an asset beta, we have adjusted the equity beta for the effects of gearing. We have not included Dee Valley as it is significantly smaller than the other listed companies, with considerably lower trading volumes. 7 Averaging the monthly series starting on each separate day of the month should correct for any anomalies in the data such as first or last trading day of the month, or of the week, or other external factors such as reporting requirements, valuation dates etc
Recommendations for WACC 2015-20, Summary report, February 2014
Analysis of appropriate WACC for PR14
9
Figure 4 Average trailing 5-year monthly equity betas for returns on each day of the month
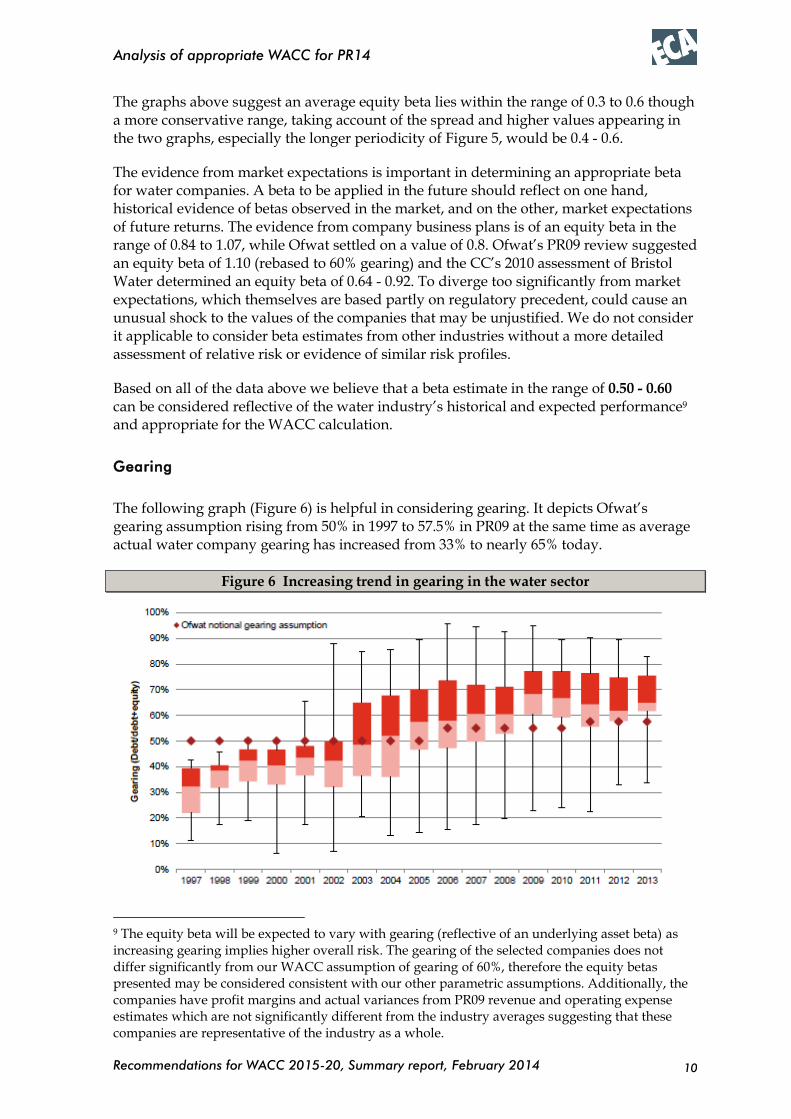
This range of equity beta estimates is supported by more extensive robustness testing with multiple series of returns of different periods, each measured with different starting dates, as presented in Figure 58.
Figure 5 Equity beta estimates over multiple return periods and series starting points
8 The widening spread with lengthening periodicity towards the 48 week periodicity partly reflects the smaller data series
Recommendations for WACC 2015-20, Summary report, February 2014
Analysis of appropriate WACC for PR14
10
The graphs above suggest an average equity beta lies within the range of 0.3 to 0.6 though a more conservative range, taking account of the spread and higher values appearing in the two graphs, especially the longer periodicity of Figure 5, would be 0.4 - 0.6.
The evidence from market expectations is important in determining an appropriate beta for water companies. A beta to be applied in the future should reflect on one hand, historical evidence of betas observed in the market, and on the other, market expectations of future returns. The evidence from company business plans is of an equity beta in the range of 0.84 to 1.07, while Ofwat settled on a value of 0.8. Ofwat’s PR09 review suggested an equity beta of 1.10 (rebased to 60% gearing) and the CC’s 2010 assessment of Bristol Water determined an equity beta of 0.64 - 0.92. To diverge too significantly from market expectations, which themselves are based partly on regulatory precedent, could cause an unusual shock to the values of the companies that may be unjustified. We do not consider it applicable to consider beta estimates from other industries without a more detailed assessment of relative risk or evidence of similar risk profiles.
Based on all of the data above we believe that a beta estimate in the range of 0.50 - 0.60 can be considered reflective of the water industry’s historical and expected performance9 and appropriate for the WACC calculation.
Gearing
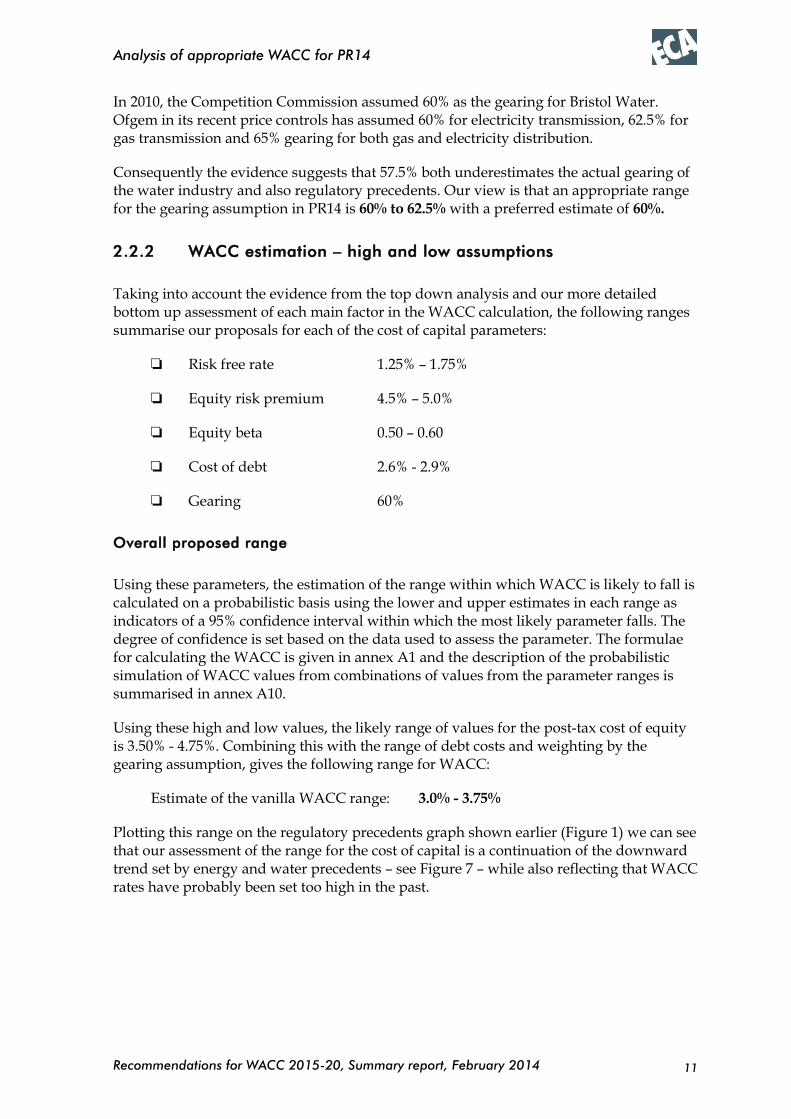
The following graph (Figure 6) is helpful in considering gearing. It depicts Ofwat’s gearing assumption rising from 50% in 1997 to 57.5% in PR09 at the same time as average actual water company gearing has increased from 33% to nearly 65% today.
Figure 6 Increasing trend in gearing in the water sector
9 The equity beta will be expected to vary with gearing (reflective of an underlying asset beta) as increasing gearing implies higher overall risk. The gearing of the selected companies does not differ significantly from our WACC assumption of gearing of 60%, therefore the equity betas presented may be considered consistent with our other parametric assumptions. Additionally, the companies have profit margins and actual variances from PR09 revenue and operating expense estimates which are not significantly different from the industry averages suggesting that these companies are representative of the industry as a whole.
Recommendations for WACC 2015-20, Summary report, February 2014
Analysis of appropriate WACC for PR14
11
In 2010, the Competition Commission assumed 60% as the gearing for Bristol Water. Ofgem in its recent price controls has assumed 60% for electricity transmission, 62.5% for gas transmission and 65% gearing for both gas and electricity distribution.
Consequently the evidence suggests that 57.5% both underestimates the actual gearing of the water industry and also regulatory precedents. Our view is that an appropriate range for the gearing assumption in PR14 is 60% to 62.5% with a preferred estimate of 60%.
2.2.2 WACC estimation – high and low assumptions
Taking into account the evidence from the top down analysis and our more detailed bottom up assessment of each main factor in the WACC calculation, the following ranges summarise our proposals for each of the cost of capital parameters:
Risk free rate 1.25% – 1.75%
Equity risk premium 4.5% – 5.0%
Equity beta 0.50 – 0.60
Cost of debt 2.6% - 2.9%
Gearing 60%
Overall proposed range
Using these parameters, the estimation of the range within which WACC is likely to fall is calculated on a probabilistic basis using the lower and upper estimates in each range as indicators of a 95% confidence interval within which the most likely parameter falls. The degree of confidence is set based on the data used to assess the parameter. The formulae for calculating the WACC is given in annex A1 and the description of the probabilistic simulation of WACC values from combinations of values from the parameter ranges is summarised in annex A10.
Using these high and low values, the likely range of values for the post-tax cost of equity is 3.50% - 4.75%. Combining this with the range of debt costs and weighting by the gearing assumption, gives the following range for WACC:
Estimate of the vanilla WACC range: 3.0% - 3.75%
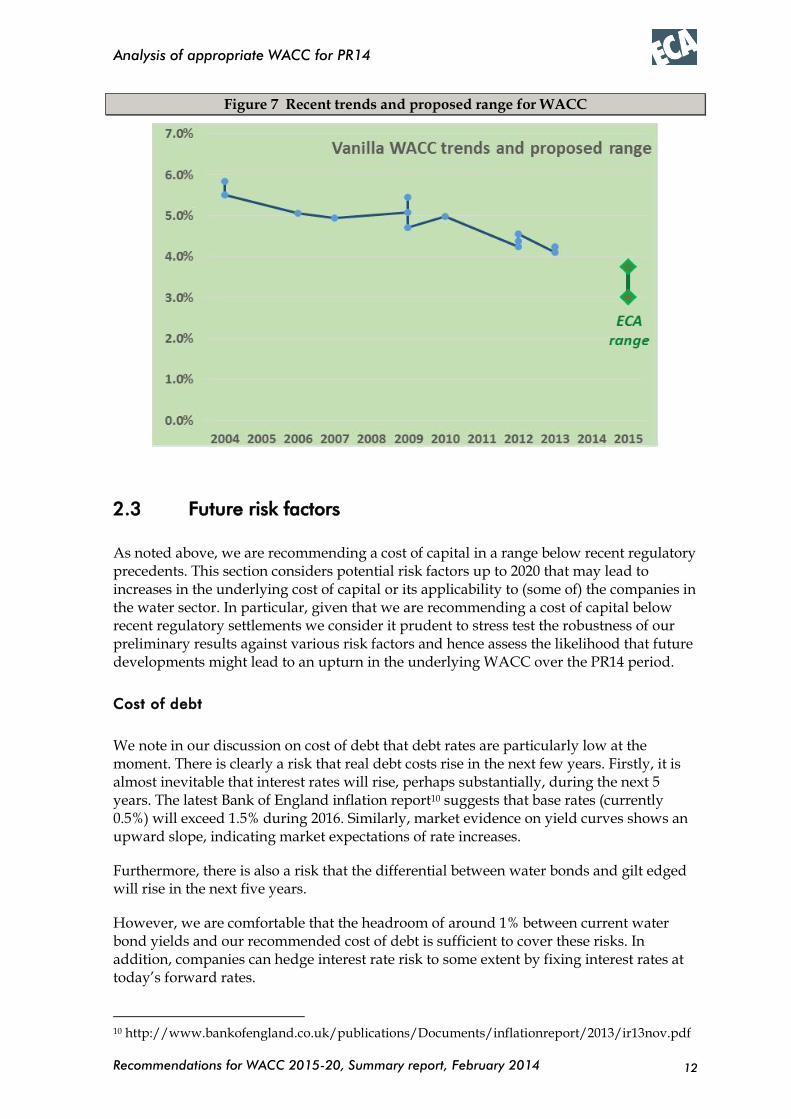
Plotting this range on the regulatory precedents graph shown earlier (Figure 1) we can see that our assessment of the range for the cost of capital is a continuation of the downward trend set by energy and water precedents – see Figure 7 – while also reflecting that WACC rates have probably been set too high in the past.
Recommendations for WACC 2015-20, Summary report, February 2014
Analysis of appropriate WACC for PR14
12
Figure 7 Recent trends and proposed range for WACC
2.3 Future risk factors
As noted above, we are recommending a cost of capital in a range below recent regulatory precedents. This section considers potential risk factors up to 2020 that may lead to increases in the underlying cost of capital or its applicability to (some of) the companies in the water sector. In particular, given that we are recommending a cost of capital below recent regulatory settlements we consider it prudent to stress test the robustness of our preliminary results against various risk factors and hence assess the likelihood that future developments might lead to an upturn in the underlying WACC over the PR14 period.
Cost of debt
We note in our discussion on cost of debt that debt rates are particularly low at the moment. There is clearly a risk that real debt costs rise in the next few years. Firstly, it is almost inevitable that interest rates will rise, perhaps substantially, during the next 5 years. The latest Bank of England inflation report10 suggests that base rates (currently 0.5%) will exceed 1.5% during 2016. Similarly, market evidence on yield curves shows an upward slope, indicating market expectations of rate increases.
Furthermore, there is also a risk that the differential between water bonds and gilt edged will rise in the next five years.
However, we are comfortable that the headroom of around 1% between current water bond yields and our recommended cost of debt is sufficient to cover these risks. In addition, companies can hedge interest rate risk to some extent by fixing interest rates at today’s forward rates.
10 http://www.bankofengland.co.uk/publications/Documents/inflationreport/2013/ir13nov.pdf

Recommendations for WACC 2015-20, Summary report, February 2014
Analysis of appropriate WACC for PR14
13
Market return
The market return consists of the risk free rate plus the equity risk premium. As indicated in our report, the evidence indicates that market returns have declined from historic levels. There is a risk that market returns will increase, for example due to increasing volatility in the event of further international economic turmoil or increased levels of terrorism. The risks of these events happening will, however, be priced into the existing market returns. Nevertheless these risks may have been mispriced.
However, we consider that, having proposed a range for risk free rate and an equity risk premium above indicated current levels, we have left sufficient headroom to allow for some reasonable increases in market return that may occur, beyond extreme events.
Equity beta
There is a risk that water companies will exhibit greater volatility in the future, against the market, than has been witnessed in recent years. We believe that this risk is low, though higher with reduced beta. Since privatisation, the markets are getting more comfortable with the risk of utilities. It is becoming increasingly clear that water companies are good at managing the risks of the business. Credit rating agencies similarly are becoming more comfortable with water companies and are slowly relaxing the constraints required to achieve specific credit ratings, for example the level of gearing.
The one danger that we can envisage is an increase in regulatory risk and in particular political interference with the regulatory process. This has been noticeable in the past few months. For example on 1 November the Guardian reported that:
“David Cameron has ordered ministers to examine how they could force water companies to cut household bills, as Labour piles on pressure over the cost of living. Downing Street said the government was looking at ‘household bills across the piece seriously’ and will next week make an announcement on reducing water costs, which reached an average of £388 per household this year.”
Nevertheless, we have not noticed a marked increase in utility share volatility in the last few months; Figure 4 could be indicating that current beta has started rising, however we have allowed for this in recommending a value for beta a little above the level suggested by Figure 4 and Figure 5. Regulatory risk is always a key component of water company risk and we envisage that the impact on regulatory risk of an increase in interference is low.
A further issue related to beta is that only four of the companies are listed on the stock exchange providing historic and current share price data. Of these we used the data from the three larger companies; the fourth was considered to be unrepresentatively small. The main financial indicators of these three companies are in line with market averages, suggesting that they are reasonably representative of the risk/return profiles of the sector as a whole.
Company size
There may be differing costs of debt and equity betas across companies which we have not taken directly into account in this report where we have constructed a generic cost of
Recommendations for WACC 2015-20, Summary report, February 2014
Analysis of appropriate WACC for PR14
14
capital. We note that in PR09 Ofwat included a small company debt premium of 0.1% for the largest two water only companies (WOCs) and 0.4% for the other water only companies. We agree that the largest WOCs will be able to access conventional bonds albeit not being able to quite attract the rates offered to larger companies, whereas the smaller WOCs may have to pursue alternative debt financing.
Similarly, Ofwat noted in PR09 that rating agencies require greater headroom for smaller companies because of greater risks such as higher asset concentration, higher revenue concentration and exposure to event risks. Although the CAPM suggests that these risks can be diversified away, in practice these risks will have a greater impact on the cash flows of smaller companies should they occur. Ofwat reduced the gearing assumption for smaller companies as a consequence by 5%
We include in Annex A8 a discussion of some cost of capital adjustments that we consider would be appropriate to make for small companies.
Credit risk and financeability
It may be reasonable for Ofwat, as Ofgem has signalled in its RIIO principles, to also consider ‘financeability in the round’ and take into account that a final assessment of the range or level of notional gearing and cost of capital allowance should not jeopardise financeability. The credit rating agencies use various metrics and these may have an impact both on the cost of debt and the ability to finance new debt for a desired level of gearing. We recognise that financeability is therefore important and could be an additional factor influencing the range of WACC values.
Recommendations for WACC 2015-20, Summary report, February 2014
Annex: Components of Cost of Capital
15
ANNEXES
The following annexes set out some details and discussion of the data and issues leading to our preliminary assumptions for the factors that in the calculation of the assumed WACC. The annexes cover all the main components of WACC, though particular consideration is given to those factors which are sector specific rather than market specific.
A1 Components of Cost of Capital
The cost of capital is applied as a percentage to the Regulatory Capital Value (RCV) to determine the return that companies require on their investment. It represented some 27 per cent of the overall revenue requirement in Ofwat’s PR09 (2010-15) final determinations – £12.9 billion over the five year period. This cost of capital reflects the weighted average of the cost of debt and the cost of equity. The cost of debt (CoD) is the interest payable to lenders. The cost of equity (CoE) is the level of expected profit or return on their equity that shareholders would need to invest in the company.
The weighted average cost of capital (WACC) can be calculated from the CoD, the CoE and a company’s gearing, the proportion of a company’s capital that is made up of debt (g):
𝑊𝐴𝐶𝐶=𝑔∙𝐶𝑜𝐷+(1−𝑔)∙𝐶𝑜𝐸
The CoE is typically derived by regulators by using the ‘Capital Asset Pricing Model (CAPM)’, a generally accepted technique of financial theory. This model refers to a risk-free rate (RfR), a market risk premium (MRP) and an equity beta factor (βE) reflecting the characteristics of risk that shareholders are exposed to:
𝐶𝑜𝐸=𝑅𝑓𝑅+𝛽𝐸∙𝑀𝑅𝑃
Each of these variables needs to be estimated, and it is probably fair to say they are all contentious. However, the RfR and MRP are generic across all businesses and UK regulators have a broadly accepted, if evolving, approach to estimating them. The CoD can be based on relatively hard historical evidence11.
There is a common but simplistic analysis that debt is cheaper than equity so higher gearing will lead to a lower weighted average cost of capital. It is simplistic mainly because it overlooks an interaction between g and βE. If a company increases its gearing (the share of its capital represented by debt), the business risk will be more concentrated on a smaller value of equity, and shareholders will therefore require higher rates of return (βE will increase). Lenders are also liable to require higher interest rates since higher levels of debt would mean less financial headroom in the business and a higher risk of default. Modelling the optimum gearing ratio is quite complex. It involves, among other things,
11 Ofgem has recently adopted an approach that uses a trailing average index of debt costs to minimise the need for judgements about the prospective cost of debt (in its RIIO T1 and GD1 reviews).
Recommendations for WACC 2015-20, Summary report, February 2014
Annex: Components of Cost of Capital
16
making assumptions about the drivers of interest rates and the tax status of marginal investors in equity and debt markets. This means it is not at all clear how changes in the level of gearing will impact on the overall cost of capital. Hence there needs to be caution about using a higher gearing in the CAPM model without adjusting other variables.
The remainder of this preliminary report provides our analysis for the appropriate assumptions about each of these variables. We also include a section describing recent precedents and then conclude with our summary of appropriate, consistent assumptions for the elements of WACC and hence a recommendation for the appropriate range for WACC for PR14.
We refer in this report to ‘vanilla’ WACC. This is calculated using the weighted average of the pre-tax cost of debt and the post-tax cost of equity. This is the WACC typically referred to by Ofwat and is used because interest costs are paid before tax and returns on equity are paid after tax has been deducted.
We focus in particular in this report on the factors which are specific to the water sector: the cost of debt, the equity beta for water sector companies and the appropriate gearing level. We provide only a high level analysis of the risk free rate and the market risk premium as these elements are generic across industries and have been well covered elsewhere; consequently we review regulatory precedents for these elements.
Recommendations for WACC 2015-20, Summary report, February 2014
Annex: Evidence from precedents and market activity
17
A2 Evidence from precedents and market activity
A2.1 Precedents for cost of capital – the declining trend
In PR09, Ofwat set a vanilla cost of capital allowance of 5.1%. This review took place during a financial crisis, triggered by a severe credit crunch in 2008. Although many of the uncertainties at that time have dissipated, financial markets remain in a state of anxiety. It has been some years since western economies have seen sustained growth, and recovery is clouded by fears that the political inability to resolve structural defects in the eurozone may yet propagate into a new global financial crisis; elsewhere in the world, ongoing tensions in the Middle East could have unpredictable consequences with major impacts on oil supply and prices, not just of oil.
At the same time, gilts are showing unprecedented low yields. Short-term index-linked gilts have been trading at negative yields and longer term yields are still fluctuating barely above 0.5 per cent.
Expectations for longer term equity market returns, despite experiencing a recent upturn, may also be converging to lower levels. The questions facing a regulator at this time are very different to those that faced Ofwat in PR09. Safe bond yields, real and nominal, are remarkably low. Concerns about the global economy are dampening expectations for returns on equity markets, despite some recent market gains. There may be an emerging mix of factors that could both increase the risk premium and reduce expectations for market returns. In this context, there is scope for well-regulated utilities to benefit from their relative safety and bond-like risk characteristics.
The improving financial situation and ease of obtaining finance has been reflected in regulatory decisions since PR09 which have shown a declining cost of capital:
In August 2010 the Competition Commission assessed the cost of capital as 3.8% - 5.0% but determined that the allowed vanilla WACC should be at the top of this range, that is 5.0%
In its price controls over the last 15 months, Ofgem has determined:
An electricity transmission WACC of 4.55%
A gas transmission WACC of 4.38%
A gas distribution WACC of 4.24%
A WACC for electricity distribution company WPD of 4.24%
In its preliminary decision for Northern Ireland Electricity, the Competition Commission assessed the WACC to be 4.1%
Consequently there is substantial regulatory precedent for a WACC well below the level that Ofwat set in 2009 and, furthermore, the WACC determinations appear to be on a declining trend.
Recommendations for WACC 2015-20, Summary report, February 2014
Annex: Evidence from precedents and market activity
18
We note that there are differences in the level of risk between water companies and energy companies and we refer in more detail to these regulatory decisions and their relevance to setting a precedent for PR14 in the more detailed sections that follow.
A2.2 Empirical evidence from market transaction activity
There is empirical evidence that the current WACC is viewed by the market as over-generous based on recent market activity.
Between May and June 2013 Severn Trent received three bids from a consortium consisting of Canadian infrastructure investor Borealis, the Kuwait Investment Office and the Universities Superannuation Scheme. The final (highest) bid valued Severn Trent at £5.3bn which represented a premium over RCV of approximately 30%. In June 2013, the Board of Severn Trent stated that:
"We have consistently made clear to the consortium our belief that Severn Trent has a value to our shareholders above the level it indicated it was willing to pay."
Hence the Board clearly believed that Severn Trent was worth a premium of more than 30% above RCV which suggests that the regulatory settlement in PR09 was overgenerous.
A year earlier, in June 2012, Veolia sold 90% of its water business, a combination of three water only companies, to a fund managed by Morgan Stanley and Prudential's M&G for a total transaction value of £1.24bn. This also represented a premium of about 30% on RCV.
These are not inconsistent with other transactions in the water sector during AMP5 with five out of six completed transactions at a premium of around 25-30%. Were bidders expecting performance in line with Ofwat’s PR09 assumptions and requiring return on equity consistent with Ofwat’s allowed return then the premium would have been zero; this suggests that there are substantial outperformance opportunities and/or that the allowed WACC has been set below actual WACC.
Consequently, the evidence suggests that Ofwat’s currently allowed WACC of 5.1% (vanilla) is substantially higher than the actual WACC incurred.
A2.3 Ofwat’s management of expectations
On 30 October, Sonia Brown, Ofwat’s Chief Regulation Officer, noted that the midpoint drawn from analyst reports is a 4.1% vanilla return and she stated
“I could see at the time that companies could do better and I hope that companies will do better than that, given the opportunities presented by the current economic environment”
In a keynote opening address at the November Water 2013 conference, Sonia Brown indicated the WACC that Ofwat would like to see for AMP6. She said that with nominal bond yields down around 1.2% since prices were set in 2009 and record low interest rates, there was:
“a real opportunity, as I said before, for this number to start with a 3.”

Recommendations for WACC 2015-20, Summary report, February 2014
Annex: Evidence from precedents and market activity
19
A2.4 Changes in risk profile
Following privatisation, the RCV was determined based on the opening market value of the companies and was not directly related to the value of the underlying assets. Indeed the RCV was substantially below the asset value which can be estimated as the replacement value of the assets, termed the modern equivalent asset value (MEAV). The following graph (Figure 8) shows how the RCV has approximately quadrupled relative to the MEAV.
Figure 8 Increase of RCV compared to MEAV
Some of the risk inherent in the water businesses relates to the fact that the companies are managing assets worth substantially more than the ‘book’ value on which the company receives a return. Consequently, this risk has reduced and will continue to reduce as companies replace existing assets and invest in new assets. In the long term we would expect the RCV to approach the total MEAV.
Recommendations for WACC 2015-20, Summary report, February 2014
Annex: Components of WACC: cost of debt
20
A3 Components of WACC: cost of debt
In this section we outline an analysis of the cost of debt as a component of the WACC. Firstly, we consider the market evidence of changes in interest rates since PR09.
A3.1 Cost of new debt
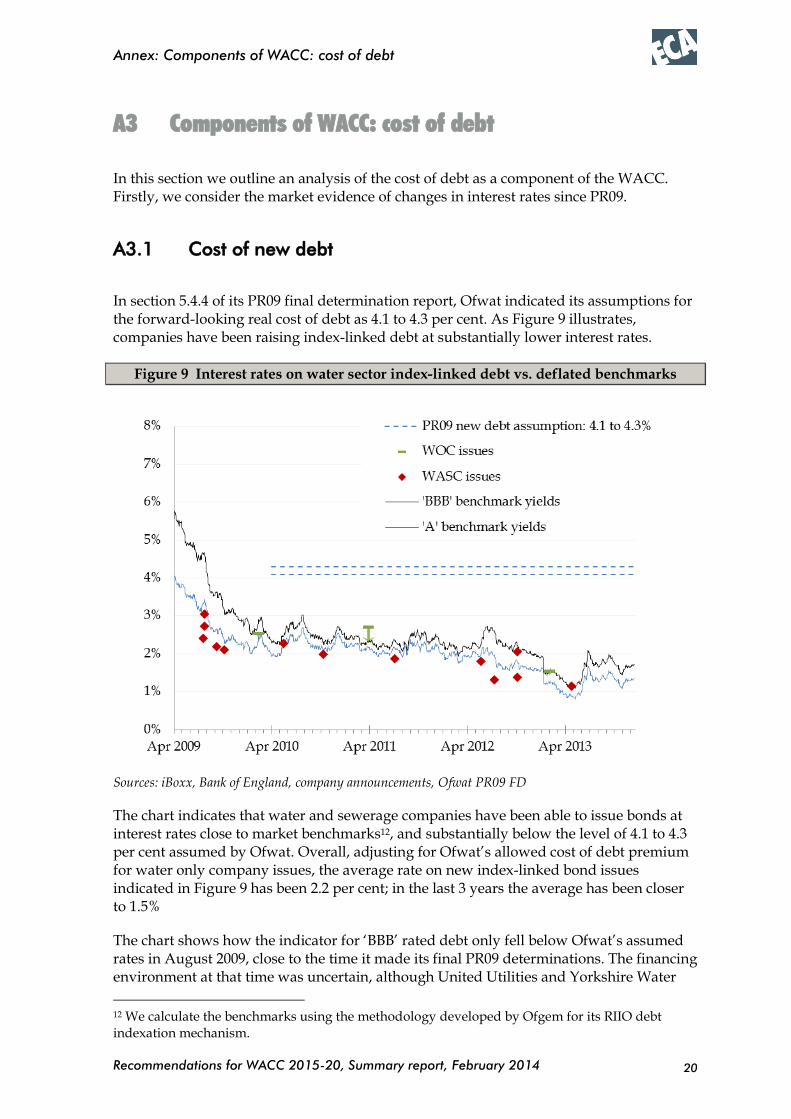
In section 5.4.4 of its PR09 final determination report, Ofwat indicated its assumptions for the forward-looking real cost of debt as 4.1 to 4.3 per cent. As Figure 9 illustrates, companies have been raising index-linked debt at substantially lower interest rates.
Figure 9 Interest rates on water sector index-linked debt vs. deflated benchmarks
Sources: iBoxx, Bank of England, company announcements, Ofwat PR09 FD
The chart indicates that water and sewerage companies have been able to issue bonds at interest rates close to market benchmarks12, and substantially below the level of 4.1 to 4.3 per cent assumed by Ofwat. Overall, adjusting for Ofwat’s allowed cost of debt premium for water only company issues, the average rate on new index-linked bond issues indicated in Figure 9 has been 2.2 per cent; in the last 3 years the average has been closer to 1.5%
The chart shows how the indicator for ‘BBB’ rated debt only fell below Ofwat’s assumed rates in August 2009, close to the time it made its final PR09 determinations. The financing environment at that time was uncertain, although United Utilities and Yorkshire Water
12 We calculate the benchmarks using the methodology developed by Ofgem for its RIIO debt indexation mechanism.
Recommendations for WACC 2015-20, Summary report, February 2014
Annex: Components of WACC: cost of debt
21
had been able to issue bonds below 3 per cent in July and Wessex Water and Thames Water issued bonds a little above 2 per cent in September and October 2009 respectively.
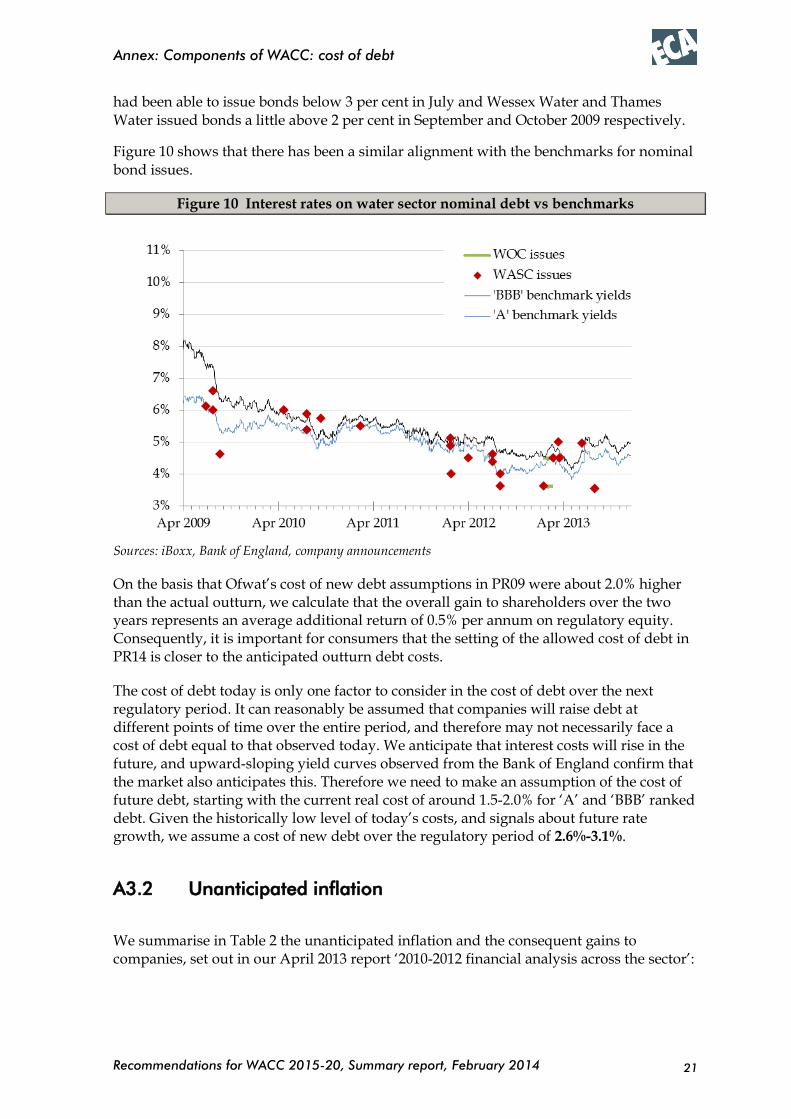
Figure 10 shows that there has been a similar alignment with the benchmarks for nominal bond issues.
Figure 10 Interest rates on water sector nominal debt vs benchmarks
Sources: iBoxx, Bank of England, company announcements
On the basis that Ofwat’s cost of new debt assumptions in PR09 were about 2.0% higher than the actual outturn, we calculate that the overall gain to shareholders over the two years represents an average additional return of 0.5% per annum on regulatory equity. Consequently, it is important for consumers that the setting of the allowed cost of debt in PR14 is closer to the anticipated outturn debt costs.
The cost of debt today is only one factor to consider in the cost of debt over the next regulatory period. It can reasonably be assumed that companies will raise debt at different points of time over the entire period, and therefore may not necessarily face a cost of debt equal to that observed today. We anticipate that interest costs will rise in the future, and upward-sloping yield curves observed from the Bank of England confirm that the market also anticipates this. Therefore we need to make an assumption of the cost of future debt, starting with the current real cost of around 1.5-2.0% for ‘A’ and ‘BBB’ ranked debt. Given the historically low level of today’s costs, and signals about future rate growth, we assume a cost of new debt over the regulatory period of 2.6%-3.1%.
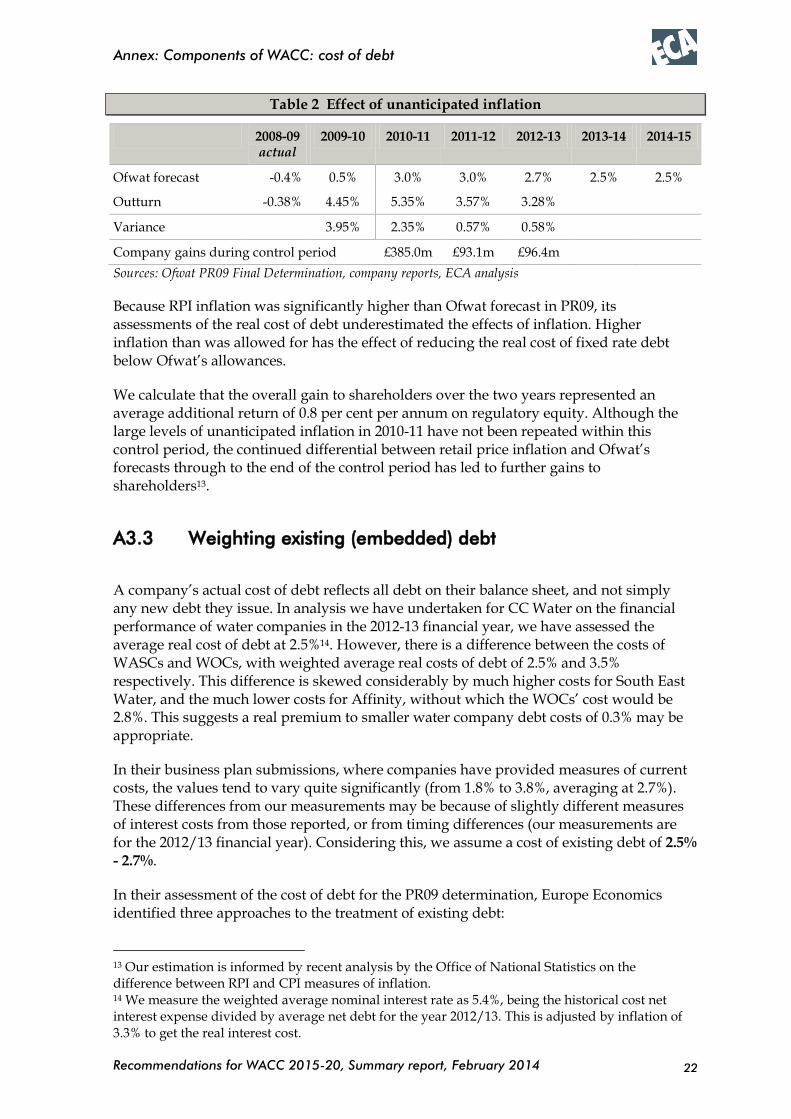
A3.2 Unanticipated inflation
We summarise in Table 2 the unanticipated inflation and the consequent gains to companies, set out in our April 2013 report ‘2010-2012 financial analysis across the sector’:
Recommendations for WACC 2015-20, Summary report, February 2014
Annex: Components of WACC: cost of debt
22
Table 2 Effect of unanticipated inflation
2008-09 actual
2009-10 2010-11 2011-12 2012-13 2013-14 2014-15
Ofwat forecast -0.4% 0.5% 3.0% 3.0% 2.7% 2.5% 2.5%
Outturn -0.38% 4.45% 5.35% 3.57% 3.28%
Variance 3.95% 2.35% 0.57% 0.58%
Company gains during control period £385.0m £93.1m £96.4m
Sources: Ofwat PR09 Final Determination, company reports, ECA analysis
Because RPI inflation was significantly higher than Ofwat forecast in PR09, its assessments of the real cost of debt underestimated the effects of inflation. Higher inflation than was allowed for has the effect of reducing the real cost of fixed rate debt below Ofwat’s allowances.
We calculate that the overall gain to shareholders over the two years represented an average additional return of 0.8 per cent per annum on regulatory equity. Although the large levels of unanticipated inflation in 2010-11 have not been repeated within this control period, the continued differential between retail price inflation and Ofwat’s forecasts through to the end of the control period has led to further gains to shareholders13.
A3.3 Weighting existing (embedded) debt
A company’s actual cost of debt reflects all debt on their balance sheet, and not simply any new debt they issue. In analysis we have undertaken for CC Water on the financial performance of water companies in the 2012-13 financial year, we have assessed the average real cost of debt at 2.5%14. However, there is a difference between the costs of WASCs and WOCs, with weighted average real costs of debt of 2.5% and 3.5% respectively. This difference is skewed considerably by much higher costs for South East Water, and the much lower costs for Affinity, without which the WOCs’ cost would be 2.8%. This suggests a real premium to smaller water company debt costs of 0.3% may be appropriate.
In their business plan submissions, where companies have provided measures of current costs, the values tend to vary quite significantly (from 1.8% to 3.8%, averaging at 2.7%). These differences from our measurements may be because of slightly different measures of interest costs from those reported, or from timing differences (our measurements are for the 2012/13 financial year). Considering this, we assume a cost of existing debt of 2.5%
- 2.7%.
In their assessment of the cost of debt for the PR09 determination, Europe Economics identified three approaches to the treatment of existing debt:
13 Our estimation is informed by recent analysis by the Office of National Statistics on the difference between RPI and CPI measures of inflation. 14 We measure the weighted average nominal interest rate as 5.4%, being the historical cost net interest expense divided by average net debt for the year 2012/13. This is adjusted by inflation of 3.3% to get the real interest cost.

Recommendations for WACC 2015-20, Summary report, February 2014
Annex: Components of WACC: cost of debt
23
Incorporate existing debt costs on a company-by-company basis
Make an adjustment for all companies based on a standard ratio of existing/new debt and a standard cost for that existing debt
Make no allowance and only used the cost of new debt
The first option is dismissed as it gives companies less incentive to seek the cheapest debt in future as costs can simply be passed on to customers. The second provides better incentives for companies, but puts all risk on to the customers, while the third provides the strongest incentives to companies, with them bearing the full cost (and benefit) of any changes to the cost of debt.
We assume the allowed cost of debt will remain fixed for the duration of the next control period, and that the current market cost of debt may be lower than a long-term forecast. Therefore, it would be in the companies’ interests to take either the second approach and adopt a current (lower) cost for new debt, weighted with a cost for existing debt, or to take the third approach and adopt a more conservative cost for new debt.
For our calculations we take the second approach. The particular weighting of existing and new debt is very specific to an individual company; many of the companies do not raise new finance on a regular basis, or have existing lines of credit, so a high waiting for existing debt is sensible. Ofwat has reported the industry average at 72%:28%, and have applied a rate of 75%:25%. We concur that this is an appropriate ratio.
A3.4 Conclusions on the cost of debt
Since PR09, interest rates on water sector debt have decreased significantly, in line with reductions on market benchmark yields. In addition, our analysis suggests that companies have benefitted significantly from inflation that was higher than anticipated, to the tune of nearly £100 million in aggregate in 2012-13, providing an additional 0.3% to their return on equity.
Fixing a cost of debt in a range of 1.5%-2.0% as might be implied by our analysis of recent new debt issues is problematic for two reasons:
We consider that this ‘spot’ rate may be unsustainably low, as the economic situation has driven interest rates artificially low and rates are likjely to rise in future
This does not take into account the costs of existing company debt, which must still be recovered. In 2012-13, companies had an average real cost of debt of 2.5%, down from 2.9% in 2011-12
Based on these two points, our assumption for a reasonable range for the cost of debt is 2.6% - 2.9%. This reflects the lower costs for new debt issues, and gives incentives to companies to seek the lowest possible price when making new issues, but also allows headroom for the costs of existing debt and possible future increases in the cost of new debt, as well as some insurance that all companies will be able to raise debt at cost-effective rates.

Recommendations for WACC 2015-20, Summary report, February 2014
Annex: Components of WACC: risk free rate
24
A4 Components of WACC: risk free rate
Ofwat suggested a risk free rate of 2% in PR09 and this is consistent with the rates used by other regulators. However, if we take the current evidence from 5-year index-linked bonds, this would suggest a rate of just 0.5% - see Figure 11 below.
Figure 11 Real yield of recent index-linked bonds
However, real yields are artificially low at present due to the lasting effects of the economic recession. The Competition Commission report on Bristol water noted that shorter-dated index-linked yields were affected by action by the authorities to address the credit crunch and recession and were therefore less relevant to estimating the long term RFR. Prior to 2010 the CC put less weight on longer-dated maturities due to possible distortion from pension fund asset allocation policies. Consequently although these yields of 0.5% provide an indication of a low risk free rate, particularly as yields have stayed below 1% for over five years, they do not give a direct answer to the risk free rate.
The CC, in its provisional determination for Northern Ireland Electricity, also noted that index-linked gilt yields are artificially low due to the imperfections associated with RPI as a measure of underlying inflation. There has been a historical gap between RPI and CPI measures of inflation of around 0.8 per cent, with a forecast increase in the gap to above 1 per cent. To the extent that CPI better reflects under-lying inflation, measures of return relative to RPI (such as index-linked gilts) may be artificially reduced as a result of that gap. This may be a factor behind negative short-term real yields, as would lower expectations of economic growth.
The Competition Commission in its decision on Bristol water in 2010 suggested a risk free rate of 1% in its low case and 2% in its high case.
Recommendations for WACC 2015-20, Summary report, February 2014
Annex: Components of WACC: risk free rate
25
Ofgem, in its recent reviews in the energy sector has assumed a risk free rate of 2%. This is despite the fact that European Economics, in its March 2011 report commissioned by Ofgem15, recommended a risk free rate of 1.3%-1.8% based on its analysis of European gilts and the CC decision on Bristol water.
The CC’s provisional determination for Northern Ireland Electricity proposes a range of 1 to 1.5 per cent for the real RFR even though it notes that the lower end of this range is well above current short-term real interest rates and would remain above short-term real interest rates during the period even if short-term real interest rates increased above the levels implied by current forward rates.
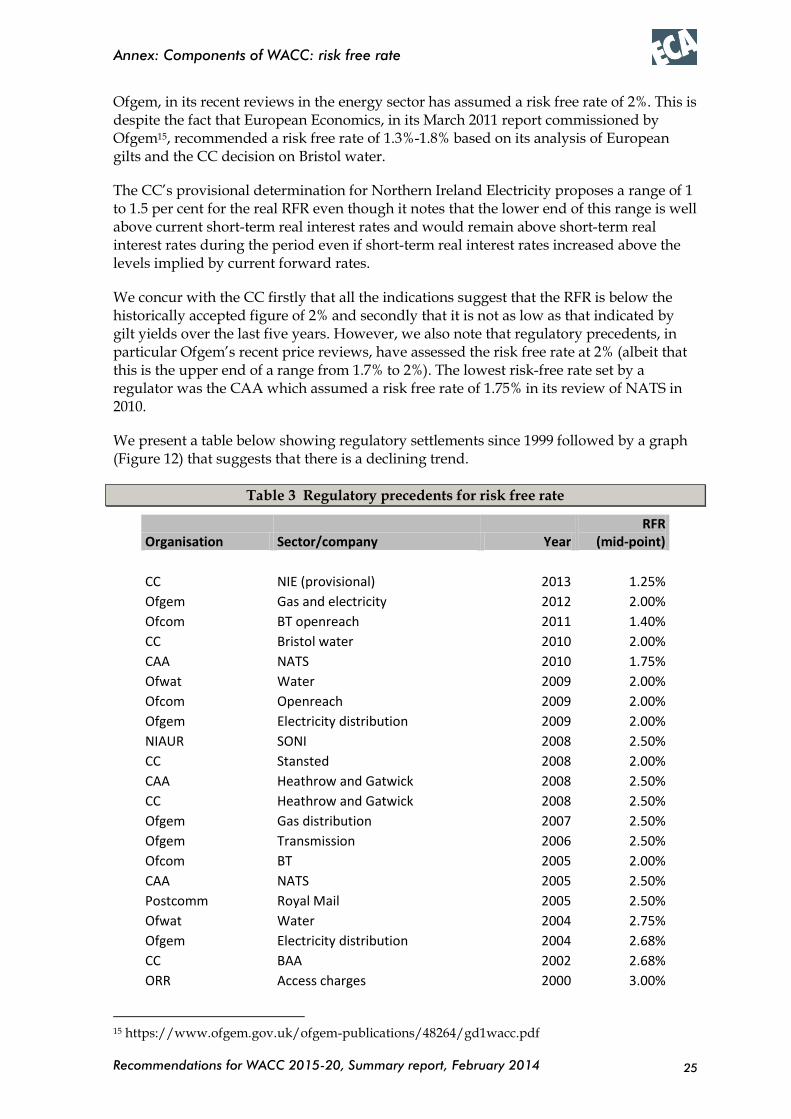
We concur with the CC firstly that all the indications suggest that the RFR is below the historically accepted figure of 2% and secondly that it is not as low as that indicated by gilt yields over the last five years. However, we also note that regulatory precedents, in particular Ofgem’s recent price reviews, have assessed the risk free rate at 2% (albeit that this is the upper end of a range from 1.7% to 2%). The lowest risk-free rate set by a regulator was the CAA which assumed a risk free rate of 1.75% in its review of NATS in 2010.
We present a table below showing regulatory settlements since 1999 followed by a graph (Figure 12) that suggests that there is a declining trend.
Table 3 Regulatory precedents for risk free rate
Organisation Sector/company Year RFR
(mid-point)
CC NIE (provisional) 2013 1.25%
Ofgem Gas and electricity 2012 2.00%
Ofcom BT openreach 2011 1.40%
CC Bristol water 2010 2.00%
CAA NATS 2010 1.75%
Ofwat Water 2009 2.00%
Ofcom Openreach 2009 2.00%
Ofgem Electricity distribution 2009 2.00%
NIAUR SONI 2008 2.50%
CC Stansted 2008 2.00%
CAA Heathrow and Gatwick 2008 2.50%
CC Heathrow and Gatwick 2008 2.50%
Ofgem Gas distribution 2007 2.50%
Ofgem Transmission 2006 2.50%
Ofcom BT 2005 2.00%
CAA NATS 2005 2.50%
Postcomm Royal Mail 2005 2.50%
Ofwat Water 2004 2.75%
Ofgem Electricity distribution 2004 2.68%
CC BAA 2002 2.68%
ORR Access charges 2000 3.00%
15 https://www.ofgem.gov.uk/ofgem-publications/48264/gd1wacc.pdf

Recommendations for WACC 2015-20, Summary report, February 2014
Annex: Components of WACC: risk free rate
26
Organisation Sector/company Year RFR
(mid-point)
CC Mid Kent Water 2000 3.00%
Ofgem Transmission 2000 2.68%
Ofwat Water 1999 2.75%
Figure 12 Trends in risk free rate determinations
In summary, we consider that the current ‘spot’ indication of risk free rates only a little over 1% may be too low given expectations of rising rates in future, but believe that this may provide a better indication of a lowering of the risk free rate over the next six years compared to historical precedent. It is quite likely that the provisional determination for Northern Ireland Electricity of 1.0 - 1.5% may turn out to be a little too low in the longer term and our conclusion is that the risk free rate lies within the range 1.25%-1.75%. Our point estimate is the middle of the range, 1.5%.
Recommendations for WACC 2015-20, Summary report, February 2014
Annex: Components of WACC: market risk premium
27
A5 Components of WACC: market risk premium
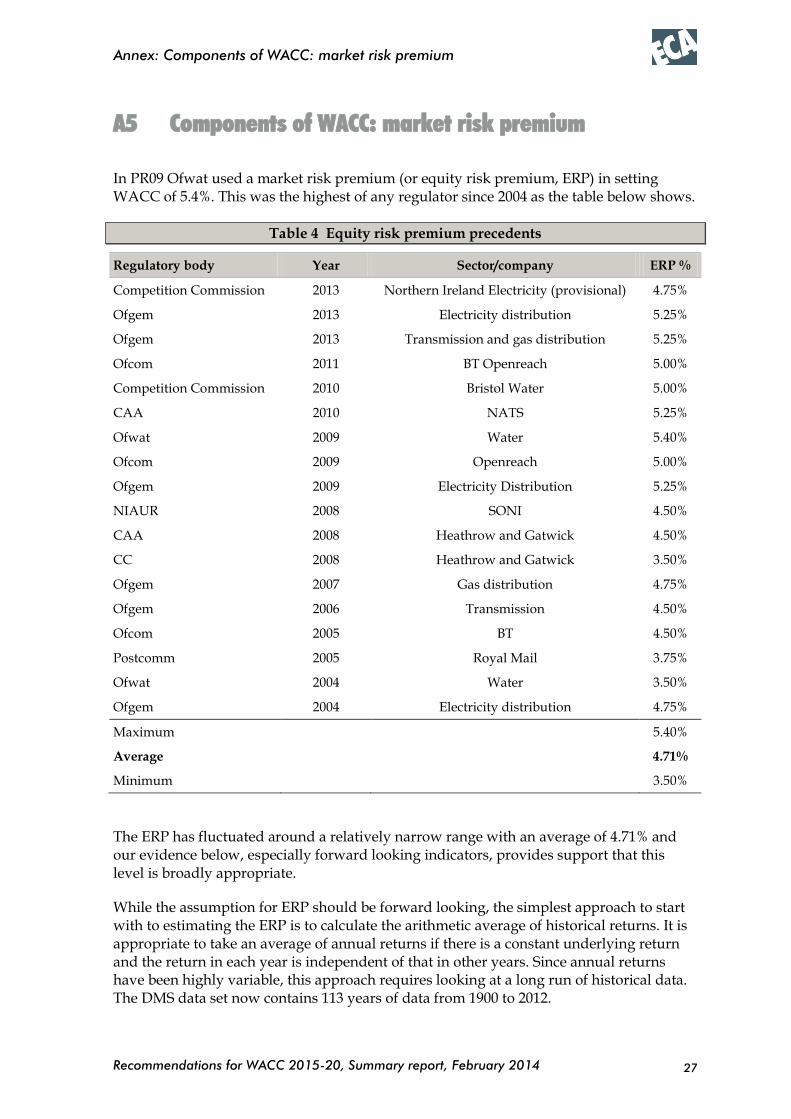
In PR09 Ofwat used a market risk premium (or equity risk premium, ERP) in setting WACC of 5.4%. This was the highest of any regulator since 2004 as the table below shows.
Table 4 Equity risk premium precedents
Regulatory body Year Sector/company ERP %
Competition Commission 2013 Northern Ireland Electricity (provisional) 4.75%
Ofgem 2013 Electricity distribution 5.25%
Ofgem 2013 Transmission and gas distribution 5.25%
Ofcom 2011 BT Openreach 5.00%
Competition Commission 2010 Bristol Water 5.00%
CAA 2010 NATS 5.25%
Ofwat 2009 Water 5.40%
Ofcom 2009 Openreach 5.00%
Ofgem 2009 Electricity Distribution 5.25%
NIAUR 2008 SONI 4.50%
CAA 2008 Heathrow and Gatwick 4.50%
CC 2008 Heathrow and Gatwick 3.50%
Ofgem 2007 Gas distribution 4.75%
Ofgem 2006 Transmission 4.50%
Ofcom 2005 BT 4.50%
Postcomm 2005 Royal Mail 3.75%
Ofwat 2004 Water 3.50%
Ofgem 2004 Electricity distribution 4.75%
Maximum 5.40%
Average 4.71%
Minimum 3.50%
The ERP has fluctuated around a relatively narrow range with an average of 4.71% and our evidence below, especially forward looking indicators, provides support that this level is broadly appropriate.
While the assumption for ERP should be forward looking, the simplest approach to start with to estimating the ERP is to calculate the arithmetic average of historical returns. It is appropriate to take an average of annual returns if there is a constant underlying return and the return in each year is independent of that in other years. Since annual returns have been highly variable, this approach requires looking at a long run of historical data. The DMS data set now contains 113 years of data from 1900 to 2012.

Recommendations for WACC 2015-20, Summary report, February 2014
Annex: Components of WACC: market risk premium
28
We have taken tables from the Competition Commission provisional determination on Northern Ireland Electricity to consider historic returns.
Table 5 below shows arithmetic estimates for mean annual real returns on equities, bonds and bills for the period 1900 to 2012, together with statistics for the standard error and standard deviation of the estimates.
Table 5 Returns on UK asset classes 1900 to 2012
Real returns Arithmetic mean Standard error Standard deviation
Equities 7.1% 1.9% 19.8%
Bonds 2.4% 1.3% 13.7%
Bills 1.1% 0.6% 6.3%
Source: Credit Suisse Global Investment Returns Sourcebook 2013
The next table below (Table 6) shows average returns over the period from 1900 to 2012 for different holding periods. It is usual to quote figures for the average of one-year returns even though investors in the equity market usually invest in the market for longer than a year. The table thus also shows average returns for some longer holding periods as well, using a number of different estimators.
Table 6 Real returns 1900 to 2012
The data in these two tables suggest an average historic return of around 6 to 7 per cent both in the UK and overseas. To derive the ERP, the risk free rate (estimated above as 1.25 to 1.75%) needs to be deducted. Subtracting the average of the RFR range leads to an ERP based on historic data in the range 4.5-5.5%. However it should be noted that the standard error around these historical estimates is substantial, implying a 95 per cent confidence interval of around 3 to 11 per cent for the market return and around 3 to 9 per cent for the ERP.
Furthermore, there is evidence that returns have declined and forward looking estimates tend to support an upper limit of 6.5% for market returns which suggests an ERP in the range 4.25-5.25%.
The CC report also notes that an alternative procedure, suggested by Fama and French, is to estimate the underlying return from the sum of average dividend yield and the average
Recommendations for WACC 2015-20, Summary report, February 2014
Annex: Components of WACC: market risk premium
29
rate of dividend growth. Using the full run of historical data for the UK, this suggests an underlying expected market return of 5.5 per cent and an ERP over Treasury Bills of 4.4 per cent (using Barclays data which prior to 1962 comprises fewer companies than the Dimson, Marsh and Staunton data used above but shows broadly similar (albeit slightly lower) results for average returns).
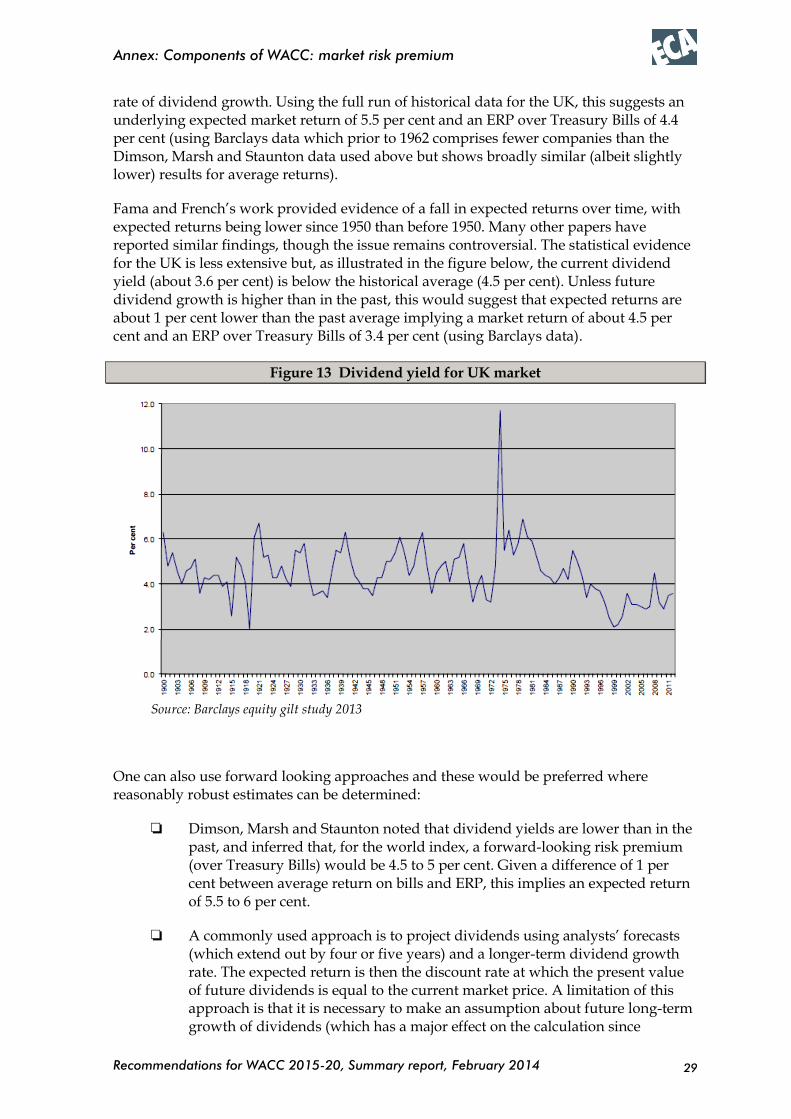
Fama and French’s work provided evidence of a fall in expected returns over time, with expected returns being lower since 1950 than before 1950. Many other papers have reported similar findings, though the issue remains controversial. The statistical evidence for the UK is less extensive but, as illustrated in the figure below, the current dividend yield (about 3.6 per cent) is below the historical average (4.5 per cent). Unless future dividend growth is higher than in the past, this would suggest that expected returns are about 1 per cent lower than the past average implying a market return of about 4.5 per cent and an ERP over Treasury Bills of 3.4 per cent (using Barclays data).
Figure 13 Dividend yield for UK market
Source: Barclays equity gilt study 2013
One can also use forward looking approaches and these would be preferred where reasonably robust estimates can be determined:
Dimson, Marsh and Staunton noted that dividend yields are lower than in the past, and inferred that, for the world index, a forward-looking risk premium (over Treasury Bills) would be 4.5 to 5 per cent. Given a difference of 1 per cent between average return on bills and ERP, this implies an expected return of 5.5 to 6 per cent.
A commonly used approach is to project dividends using analysts’ forecasts (which extend out by four or five years) and a longer-term dividend growth rate. The expected return is then the discount rate at which the present value of future dividends is equal to the current market price. A limitation of this approach is that it is necessary to make an assumption about future long-term growth of dividends (which has a major effect on the calculation since
Recommendations for WACC 2015-20, Summary report, February 2014
Annex: Components of WACC: market risk premium
30
dividends beyond year 4 or 5 account for a large part of present value at plausible discount rates). The Competition Commission NIE report’s estimate of ERP using this approach is around 4.5%
The CC concludes that the preferred methodology to calculate ERPs is to determine the market return and subtract the risk free rate rather than use the forward looking approach. While this approach appears to be more robust and we note also that the market return has tended to be less volatile than the estimates of ERP using forward looking approaches, the preferred approach is still to draw as much evidence as possible from forward looking indicators.
As noted above, the combination of historic and forward looking indicators provide evidence that points to an ERP broadly lying within the range 4.25% to 5. 25%, which is a little lower than the historical trend due to the decline in market returns. In the light of this and recent regulatory precedent our assumption of the ERP is a range of 4.5 - 5.0%.
Recommendations for WACC 2015-20, Summary report, February 2014
Annex: Components of WACC: equity beta
31
A6 Components of WACC: equity beta
The presence of a beta factor, and thus a risk premium in the cost of equity, is due to the presence of different exposure to risk for different types of companies/sectors within the market as a whole. Returns to investors, in particular returns to shareholders, are uncertain. Some of those uncertainties will correlate with uncertainties present in the generality of investments in the stock market, and financial theory says it is such correlation16 that leads shareholders to require a risk premium in expected returns to make an investment worthwhile.
Estimating a beta for the water sector requires consideration of how much correlated uncertainty (often called systematic or non-diversifiable risk) exists in a water business. Our analysis is based primarily around the evidence from share price movements. We also consider the market expectations of the beta estimate, and the impact diversions from this can have on prices and future returns.
A6.1 The evidence from share price movements
It is conventional to consider beta evidence from movements in the prices of frequently-traded shares. In the water sector, three listed companies, Pennon, Severn Trent and United Utilities remain and are representative of the sizes of companies in the sector17.
Pennon is the owner of South West Water, which contributes 40% of its revenue, but 87% of its operating profit. This shows that its remaining operations (Viridor) are much lower margin than water, and could be assumed to be more risky.
Severn Trent generates 82% of its revenue from its regulated water business, with 98% of its profit before tax and 97% of its assets, suggesting that the listed company is a good reflection of the underlying regulated water business.
United Utilities used to own non-regulated businesses, but completed the sale of all of these in 2010. While our analysis runs further back than this, we still feel confident that the data are reflective of the underlying regulated water business.
We have analysed the utilities themselves, and observe that the gearing of the selected companies does not differ significantly from our estimate of 60%, therefore adjusting the equity betas using actual gearing to get asset betas for the industry can be considered representative of the industry as a whole. Similarly, the companies have profit margins and actual variances from PR09 revenue and operating expense estimates that are not significantly different from the industry averages. However, as noted above, Pennon’s listed company, as parent of South West Water, is quite different from the underlying regulated water business.
16 It would be more accurate to say ‘covariance’ rather than ‘correlation’. 17 We have not included Dee Valley as it is significantly smaller than the other companies, with considerably lower trading volumes.

Recommendations for WACC 2015-20, Summary report, February 2014
Annex: Components of WACC: equity beta
32
We have calculated rolling two-year equity betas for each company using daily return data. These are measured by taking the daily returns for each company and for the market as a whole (using the FTSE all-share index), and measuring the beta over a two year period. Each data point in the chart represents the end of the two-year period of returns over which the beta is measured. The raw betas we calculate are as shown in Figure 14.
Figure 14 Estimated 2-year daily equity return betas
The betas for Severn Trent and United Utilities (and, although we do not show them, also for National Grid as a comparator from the electricity sector) show a similar pattern.
Our analysis shows the overall estimated betas and 95% confidence intervals for share returns since 2002 as set out in Table 7.
Table 7 Estimated equity betas
Central beta estimate
Standard error
95% confidence interval
Low High
Severn Trent 0.494 0.014 0.455 0.533
Pennon 0.414 0.015 0.372 0.455
United Utilities 0.549 0.013 0.514 0.585
Although these results suggest there is some confidence that equity betas are no higher than about 0.6 (the maximum value of the estimated 95% confidence intervals is 0.585), the pattern of 2-year betas over the last decade raises a question over the assumption that there is a stable underlying beta. The pattern suggests a marked downward trend in betas from about 2009. It looks possible that underlying betas had been rather higher than 0.6

Recommendations for WACC 2015-20, Summary report, February 2014
Annex: Components of WACC: equity beta
33
for the earlier part of the period and there is therefore a possibility that underlying betas might become higher again in future.
We have therefore looked into what lies behind the drop in betas after 2009 especially from around October 2010.
Our analysis has identified two particular events that appear to have influenced the beta calculations during the last decade: the stock market fall in May 2006 and the larger stock market fall in September to October 2008. It is the 2008 event falling out of the data that causes the 2-year beta figures to fall from October 2010.
We note that there are large swings in the covariations around these periods. Considering the data for Severn Trent, for example, we identified 17 occasions between 9 August 2007 to 31 December 2008 when the daily covariates between share and stock market returns were 3.5 standard deviations away from the covariance. This suggests the existence of outliers in the data, and it is these that were the likely main cause for the significant movements in the 2-year beta results rather than any underlying change in betas.
The middles of these two events occurred a multiple of four-weeks apart. We find that considering 4-weekly rather than daily data provides some insight into the beta influences. Using returns measured over a period of four weeks or a month is also supported by standard commercial practice, and reflects the likelihood that water company shares may react to the generality of daily stock market volatility in the short term but that over a period of say 1 month the water company shares revert to previous levels when their regulated returns are seen not to be unduly influenced by the short term stock market events.
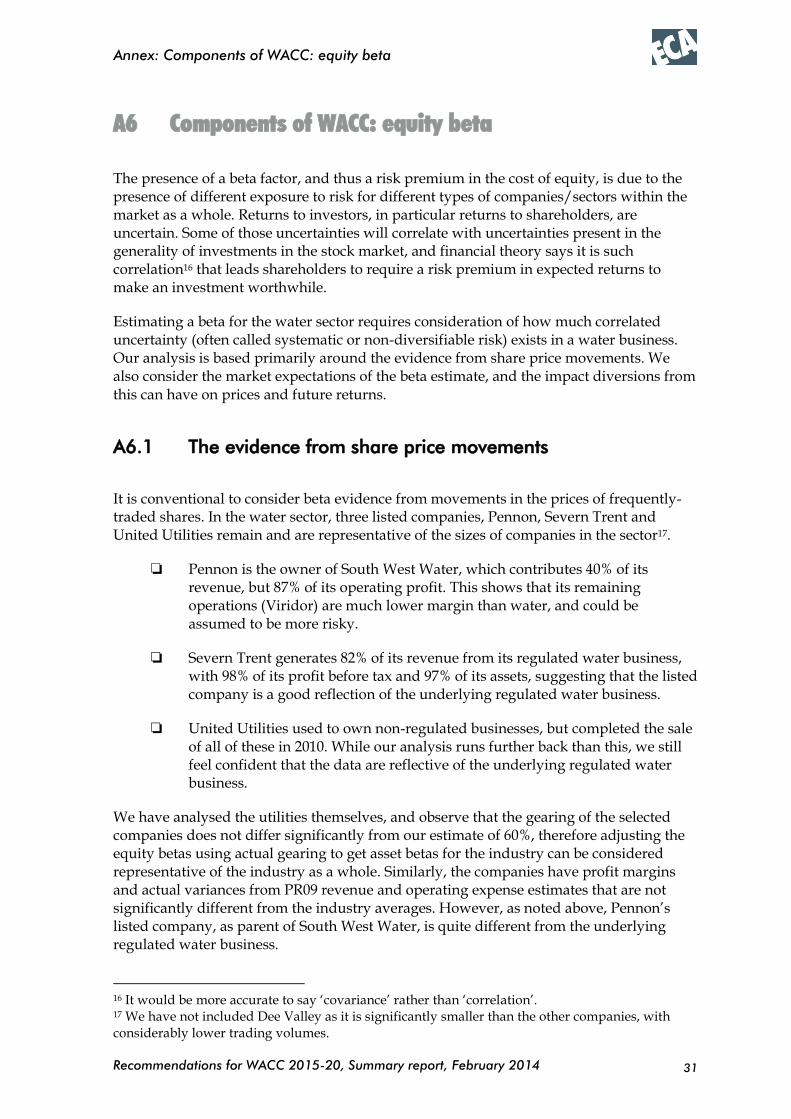
We set out two charts. Both charts show betas calculated using 4-weekly data on a rolling 182-week basis (namely 40 observations for each calculation), using exactly the same source data18, but with start dates two weeks apart; this is the only difference in how they are constructed. The charts (Figure 15 and Figure 16) show dramatically different results.
18 Source: Yahoo Finance
Recommendations for WACC 2015-20, Summary report, February 2014
Annex: Components of WACC: equity beta
34
Figure 15 Betas based on 4-weekly returns data – Series 1
Figure 16 Betas based on 4-weekly data – Series 2
The Series 1 data, presented in Figure 15, included observations in the market index and in water company prices of major falls in stock market valuations. However, unlike the stock exchange in general, the water shares bounced back up fairly quickly. The Series 2 data, presented in Figure 16, capture this rebounding effect of the water companies on account of starting two weeks apart from the Series 1 data.
After considering the underlying economics of systematic risk in the utilities sector we should not be too surprised to see a correction in water share prices after large stock market falls. This is because the regulatory regime inherently protects investors from
Recommendations for WACC 2015-20, Summary report, February 2014
Annex: Components of WACC: equity beta
35
much of the effects of new economy-wide information that would influence valuations for the generality of companies on the stock market.
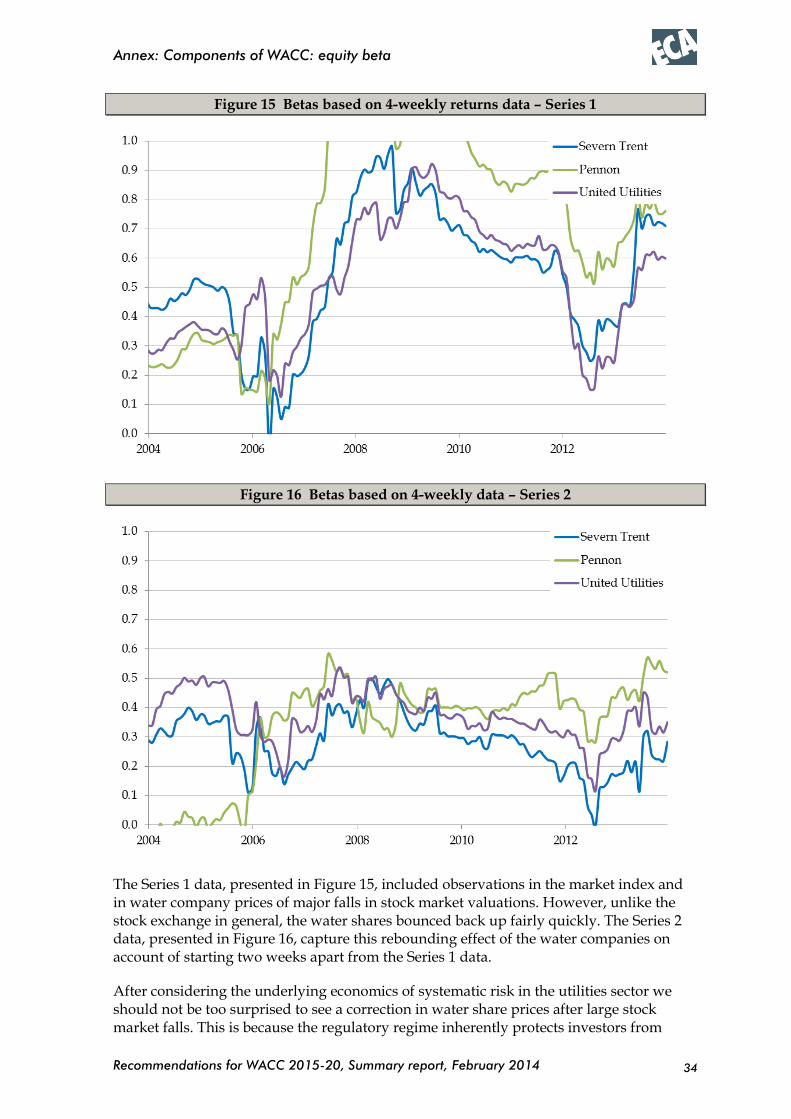
Our overall beta calculations on 4-weekly data for the period since 2000, together with the 95 per cent confidence intervals, are illustrated in Figure 17 for Series 1 and Series 2.
Figure 17 Estimated 4-weekly beta 95% confidence intervals
These results suggest the most likely range for equity beta is 0.4 – 0.5, while the broadest range within which the equity betas would be likely to fall lies between 0.3 and 0.6 – this range overlaps the majority of the observations and covers the means of the two series. Higher assessments would be largely outside the range supported by the Series 2 data, lower assessments would be outside the range supported by the Series 1 data.
This existence of outlier values in the data, from extraordinary events, leads us to apply an additional technique to control for the effects of those outliers in our original series of daily returns data for the three water companies. We consider the technique is especially justifiable given the evidence that the price movements in water shares associated with these outliers are quickly reversed and that such reversals would be explained by the underlying economics and regulation of the sector.
The technique is called winsorisation and adjusts outliers in the data, in this case taken to be data points beyond the 95% confidence intervals, by reverting their values to the nearest end points of the 95% confidence interval. We have recalculated the beta over the period from 2002 for each company after winsorising the daily covariates at 95%. The resulting beta figures and comparison with the daily data and Series 2 results are set out in Table 8.
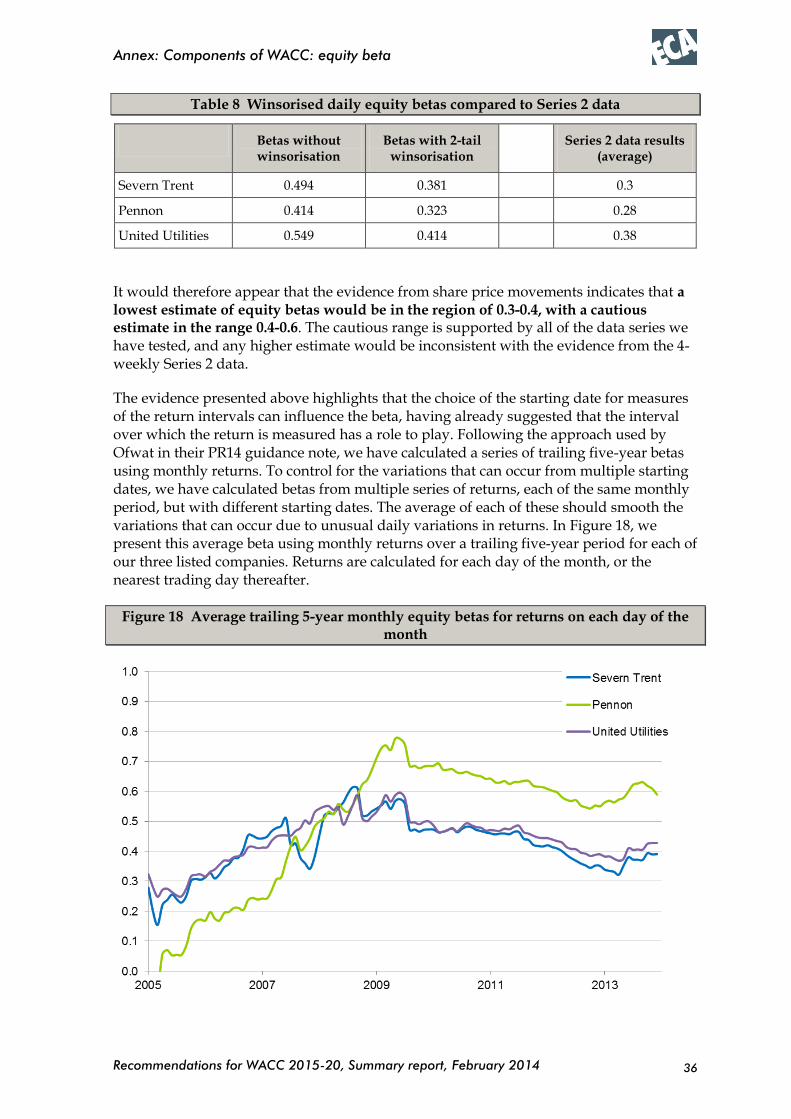
Recommendations for WACC 2015-20, Summary report, February 2014
Annex: Components of WACC: equity beta
36
Table 8 Winsorised daily equity betas compared to Series 2 data
Betas without winsorisation
Betas with 2-tail winsorisation
Series 2 data results (average)
Severn Trent 0.494 0.381 0.3
Pennon 0.414 0.323 0.28
United Utilities 0.549 0.414 0.38
It would therefore appear that the evidence from share price movements indicates that a lowest estimate of equity betas would be in the region of 0.3-0.4, with a cautious estimate in the range 0.4-0.6. The cautious range is supported by all of the data series we have tested, and any higher estimate would be inconsistent with the evidence from the 4-weekly Series 2 data.
The evidence presented above highlights that the choice of the starting date for measures of the return intervals can influence the beta, having already suggested that the interval over which the return is measured has a role to play. Following the approach used by Ofwat in their PR14 guidance note, we have calculated a series of trailing five-year betas using monthly returns. To control for the variations that can occur from multiple starting dates, we have calculated betas from multiple series of returns, each of the same monthly period, but with different starting dates. The average of each of these should smooth the variations that can occur due to unusual daily variations in returns. In Figure 18, we present this average beta using monthly returns over a trailing five-year period for each of our three listed companies. Returns are calculated for each day of the month, or the nearest trading day thereafter.
Figure 18 Average trailing 5-year monthly equity betas for returns on each day of the month

Recommendations for WACC 2015-20, Summary report, February 2014
Annex: Components of WACC: equity beta
37
Figure 18 shows clearly a trend in the equity betas of the three companies, with an increase from 2005 to a peak around 2009, a decline until the beginning of 2013, and the beginning or an increase through 2013. We also observe consistency in the betas for Severn Trent and United Utilities, with Pennon following a similar path but at more exaggerated levels; this is not surprising, given the different nature of Pennon’s operations. These data suggest that the equity beta for the companies should be in the
range 0.3 – 0.6 at the extremes, but more cautiously in the range 0.4 – 0.6, which encompasses most of the more recent data.
As an additional robustness check, we have measured the single equity beta for each of the three water companies from the beginning of 2000, over a range of return periods, from 1 week to 48 weeks. That is, from our data series going back to 2000, calculating the returns over intervals of 1 to 48 weeks, and calculating the beta from those series.
As with the average monthly betas presented in Figure 18, we derive series for each return period starting on different dates. That is, the 4-weekly beta is calculated from four different series of returns, each measured over a 4-week period but starting at weeks 0, 1, 2 and 3 in our series19. Correspondingly, the 5-weekly beta is measured in five separate 5-weekly return periods starting at weeks 0, 1, 2, 3 and 4, up until the 48-weekly beta with 48 different starting points. We calculate the average of all the companies’ betas for each starting point, giving a series of beta estimates for each return period. Figure 19 presents the distribution of these beta estimates for each return period, with the monthly betas from the same series of returns used in Figure 18 represented with crosses20.
We would tend to rely more on the estimates at the left hand end of these series as they contain a greater number of returns data points, and less ‘noise’ than longer periods. That is, the returns should reflect the market reactions to a similar and large set of information, rather than the smaller set which would be contained in longer return periods. The more information the returns are reflecting, the more accurately the beta will reflect a consistent covariance with the market. This also explains why the range between the maximum and minimum beta estimates increases with the returns period.
19 Including a series starting at the 4th week will be identical to starting in Week 0, except that it won’t include the first data point. 20 Note that a small rise with increasing return period may be expected, as the total sample size decreases
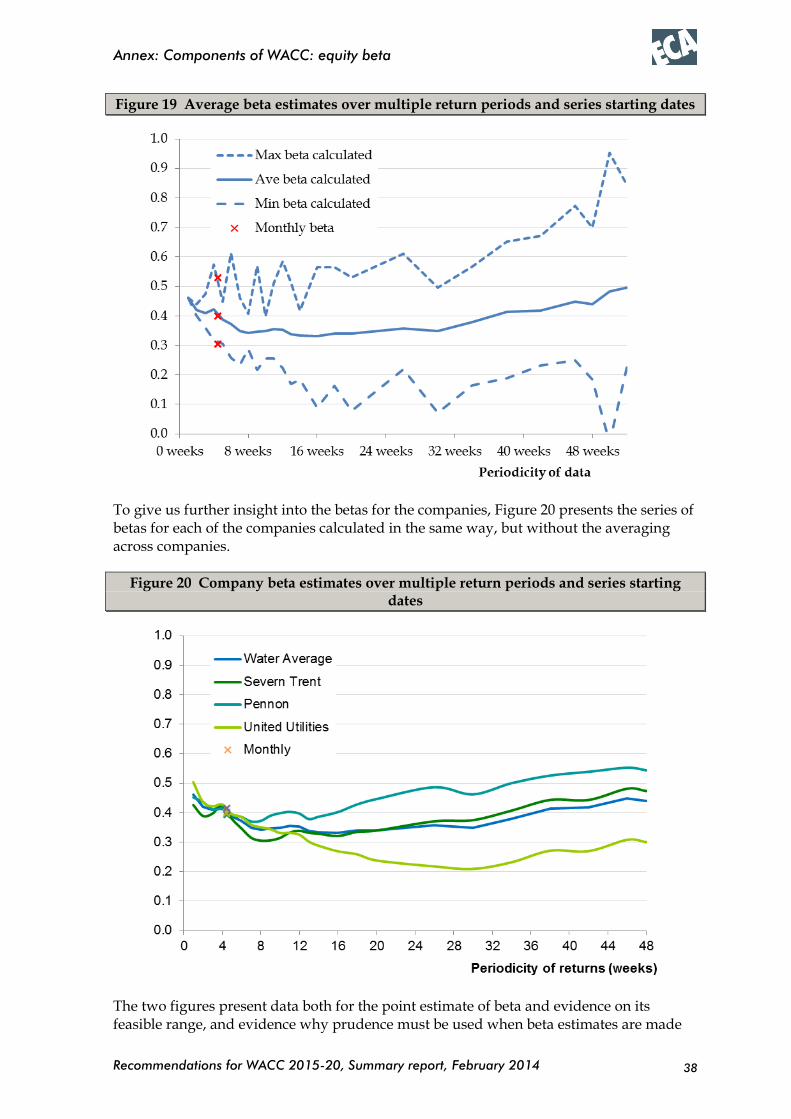
Recommendations for WACC 2015-20, Summary report, February 2014
Annex: Components of WACC: equity beta
38
Figure 19 Average beta estimates over multiple return periods and series starting dates
To give us further insight into the betas for the companies, Figure 20 presents the series of betas for each of the companies calculated in the same way, but without the averaging across companies.
Figure 20 Company beta estimates over multiple return periods and series starting dates
The two figures present data both for the point estimate of beta and evidence on its feasible range, and evidence why prudence must be used when beta estimates are made
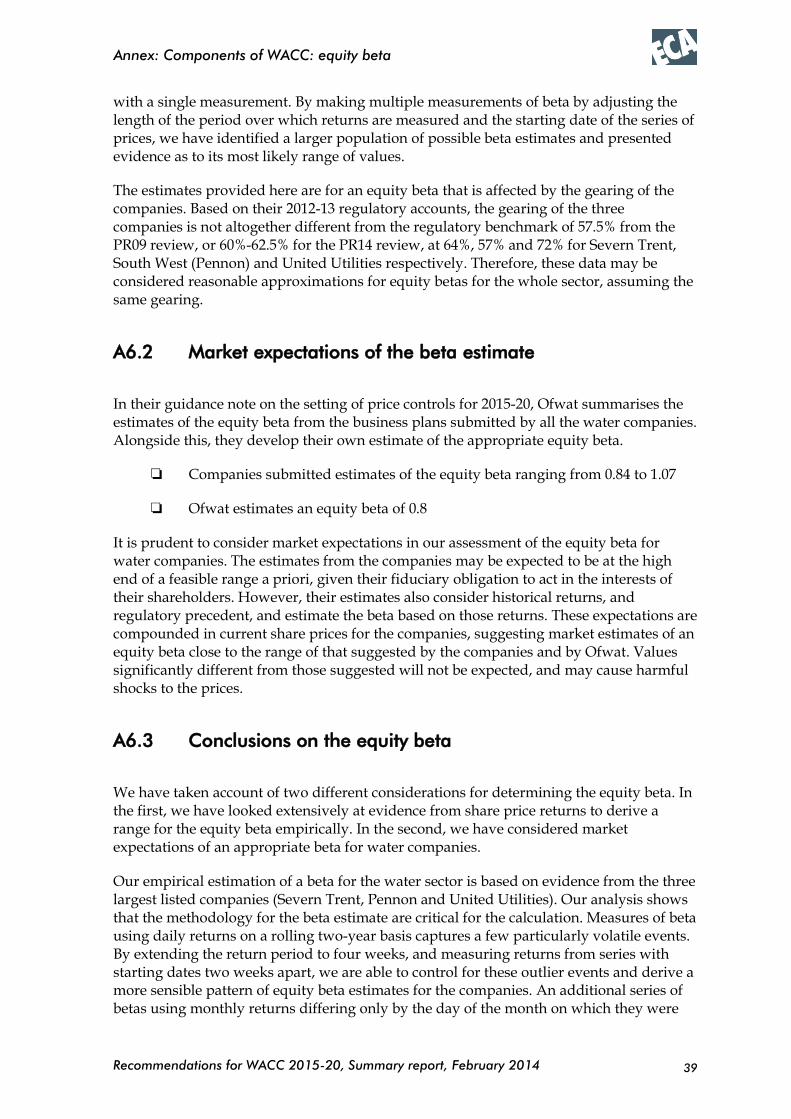
Recommendations for WACC 2015-20, Summary report, February 2014
Annex: Components of WACC: equity beta
39
with a single measurement. By making multiple measurements of beta by adjusting the length of the period over which returns are measured and the starting date of the series of prices, we have identified a larger population of possible beta estimates and presented evidence as to its most likely range of values.
The estimates provided here are for an equity beta that is affected by the gearing of the companies. Based on their 2012-13 regulatory accounts, the gearing of the three companies is not altogether different from the regulatory benchmark of 57.5% from the PR09 review, or 60%-62.5% for the PR14 review, at 64%, 57% and 72% for Severn Trent, South West (Pennon) and United Utilities respectively. Therefore, these data may be considered reasonable approximations for equity betas for the whole sector, assuming the same gearing.
A6.2 Market expectations of the beta estimate
In their guidance note on the setting of price controls for 2015-20, Ofwat summarises the estimates of the equity beta from the business plans submitted by all the water companies. Alongside this, they develop their own estimate of the appropriate equity beta.
Companies submitted estimates of the equity beta ranging from 0.84 to 1.07
Ofwat estimates an equity beta of 0.8
It is prudent to consider market expectations in our assessment of the equity beta for water companies. The estimates from the companies may be expected to be at the high end of a feasible range a priori, given their fiduciary obligation to act in the interests of their shareholders. However, their estimates also consider historical returns, and regulatory precedent, and estimate the beta based on those returns. These expectations are compounded in current share prices for the companies, suggesting market estimates of an equity beta close to the range of that suggested by the companies and by Ofwat. Values significantly different from those suggested will not be expected, and may cause harmful shocks to the prices.
A6.3 Conclusions on the equity beta
We have taken account of two different considerations for determining the equity beta. In the first, we have looked extensively at evidence from share price returns to derive a range for the equity beta empirically. In the second, we have considered market expectations of an appropriate beta for water companies.
Our empirical estimation of a beta for the water sector is based on evidence from the three largest listed companies (Severn Trent, Pennon and United Utilities). Our analysis shows that the methodology for the beta estimate are critical for the calculation. Measures of beta using daily returns on a rolling two-year basis captures a few particularly volatile events. By extending the return period to four weeks, and measuring returns from series with starting dates two weeks apart, we are able to control for these outlier events and derive a more sensible pattern of equity beta estimates for the companies. An additional series of betas using monthly returns differing only by the day of the month on which they were

Recommendations for WACC 2015-20, Summary report, February 2014
Annex: Components of WACC: equity beta
40
measured are averaged for each month and show a trend in equity betas which suggests a that the equity beta should lie within the range of 0.4-0.6 in the future.
Our beta estimates are supported by more extensive robustness testing with multiple series of returns of different periods, each measured with different starting points. The graphs above suggest an equity beta in the range of 0.3 to 0.6. We also note that the beta of the smaller company, Pennon, appears higher than Severn Trent’s and United Utilities’ and we consider that this is due to Pennon’s greater preponderance of non-regulated activity.
Our observations of equity beta values from company business plans and Ofwat’s own guidance suggest a market expectation of an equity beta in the range of 0.8 – 1.07. We note that PR09 suggested an equity beta of 1.10 (rebased to 60% gearing) and the CC’s 2010 assessment of Bristol Water determined an equity beta of 0.64 – 0.92. We believe it is prudent to take into account market expectations of an appropriate equity beta for water companies. We are reluctant to consider beta estimates from other industries without a more detailed assessment of relative risk.
Based on all of the data above we believe that a beta estimate in the range of 0.50 - 0.60 can be considered reflective of the water industry and appropriate for the WACC calculation. This range is within – though at the top of - the results of all of the data series we have tested. We have found the more likely range to be 0.4 – 0.5 though would consider it not unreasonable to increase the level by 0.1 to take account of market expectations and regulatory caution. This would result in the above range of 0.5- 0.6 which should be considered fair in comparison to market expectations of an appropriate equity beta.
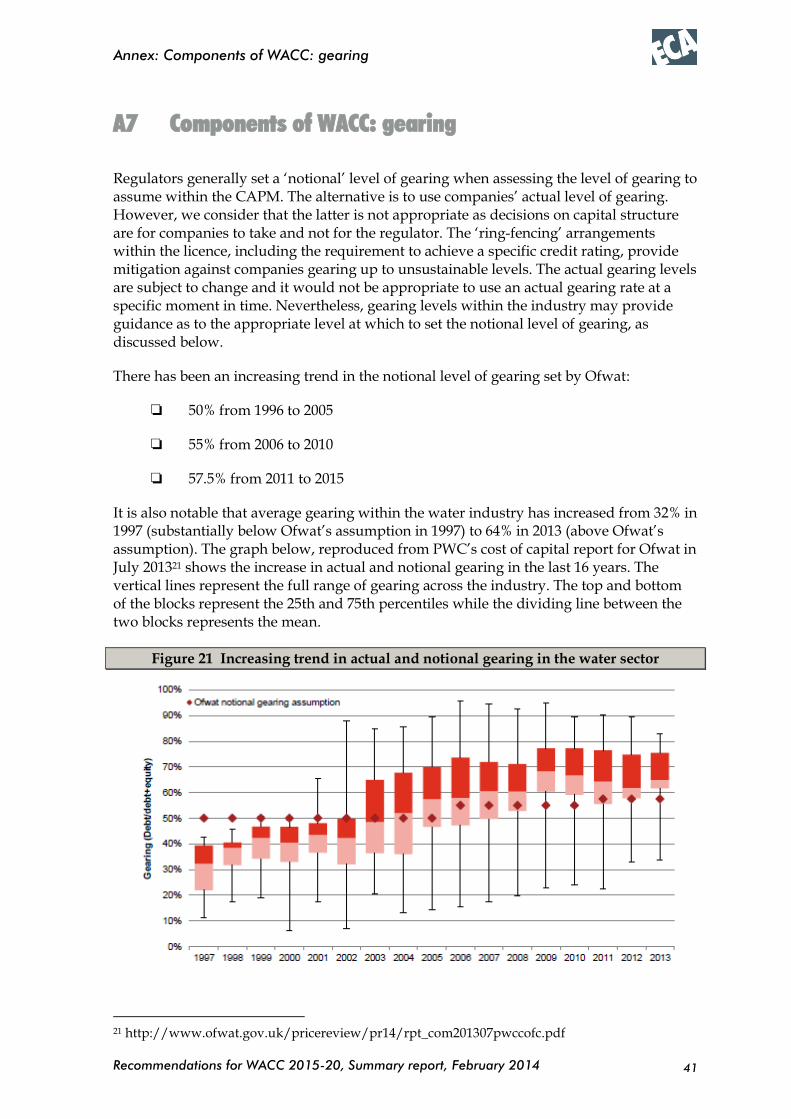
Recommendations for WACC 2015-20, Summary report, February 2014
Annex: Components of WACC: gearing
41
A7 Components of WACC: gearing
Regulators generally set a ‘notional’ level of gearing when assessing the level of gearing to assume within the CAPM. The alternative is to use companies’ actual level of gearing. However, we consider that the latter is not appropriate as decisions on capital structure are for companies to take and not for the regulator. The ‘ring-fencing’ arrangements within the licence, including the requirement to achieve a specific credit rating, provide mitigation against companies gearing up to unsustainable levels. The actual gearing levels are subject to change and it would not be appropriate to use an actual gearing rate at a specific moment in time. Nevertheless, gearing levels within the industry may provide guidance as to the appropriate level at which to set the notional level of gearing, as discussed below.
There has been an increasing trend in the notional level of gearing set by Ofwat:
50% from 1996 to 2005
55% from 2006 to 2010
57.5% from 2011 to 2015
It is also notable that average gearing within the water industry has increased from 32% in 1997 (substantially below Ofwat’s assumption in 1997) to 64% in 2013 (above Ofwat’s assumption). The graph below, reproduced from PWC’s cost of capital report for Ofwat in July 201321 shows the increase in actual and notional gearing in the last 16 years. The vertical lines represent the full range of gearing across the industry. The top and bottom of the blocks represent the 25th and 75th percentiles while the dividing line between the two blocks represents the mean.
Figure 21 Increasing trend in actual and notional gearing in the water sector
21 http://www.ofwat.gov.uk/pricereview/pr14/rpt_com201307pwccofc.pdf
Recommendations for WACC 2015-20, Summary report, February 2014
Annex: Components of WACC: gearing
42
This suggests that there is scope to further increase the gearing level to assume for PR14, as the mean has been above the last Ofwat assumption for almost ten years and above 60% since 2007.
In 2010, the Competition Commission assumed 60% as the gearing for Bristol Water. Ofgem in its recent price controls has assumed 60% for electricity transmission, 62.5% for gas transmission and 65% gearing for both gas and electricity distribution.
Consequently all the evidence suggests that 57.5% both underestimates the actual gearing of the water industry and also regulatory precedents.
A key test on whether the determined WACC is sustainable is to check that the water companies are financeable, that is are able to maintain an investment grade credit rating with sufficient headroom to deal with cost shocks. It is not within our remit to undertake detailed financeability analysis, however we would note that a principal indicator used by credit rating agencies is interest cover (specifically post-maintenance interest coverage ratio, PMICR). The current low interest rates will improve interest coverage ratios compared to historic interest covers and consequently there will be some scope to increase gearing from the level set in PR09.
We would note that the level of capex is higher in the water industry than in energy companies. Consequently we recommend a range of 60% to 62.5% for assumed gearing in PR14 with a central estimate at the bottom of the range.
It should be noted that WACC is not expected to be very sensitive to the gearing assumption as a higher gearing level would be anticipated to lead to an offsetting higher equity beta, as risk increases with higher gearing.
Recommendations for WACC 2015-20, Summary report, February 2014
Annex: Small company premium
43
A8 Small company premium
This section considers whether there should be a small company premium, given the possible higher risks and c=financing costs faced by the smallest companies.
A8.1 Debt
There appears to be evidence that the smaller water only companies cannot raise debt at the same levels as larger companies and their access to some lenders, for example the EIB is restricted due to the minimum lending amount of these institutions. Furthermore, our analysis of the interest payments of WoCS suggests that they are paying more on average than WaSCs. The amount varies widely between companies and years but on average the excess has been about 0.6% over the last there years (2010-11 to 2012-13). Closer inspection of this difference, through identification of outlier values from the two largest WoCs (South East Water being significantly higher than the others, and Affinity being significantly lower) suggests the difference is more like 0.3%.
As noted above, South East Water and Affinity are substantially larger than the other WoCs (RCV’s of around £1.0bn compared to £0.4bn or less for the others) and are able to obtain finance at rates closer to the WaSCs. Consequently we recommend excluding these two companies from any small company premium.
In business plans submitted by each of the companies, some of the smaller WoCs have suggested a small company premium of between 0.3% and 0.7%.
Our own analysis of specific financing of water companies has highlighted that two of the smaller companies (Portsmouth Water and Dee Valley Water) have been able to access the debt capital markets via a special purpose vehicle called Artesian Finance, set up by the Royal Bank of Scotland. The issues were made in 2002, at rates below those of the larger WaSCs, although the actual costs borne by the water companies would have been larger, incorporating other charges, such as administration fees. This example highlights that the smaller WoCs are able to access debt capital markets efficiently without necessarily having to issue of their own bonds. Similarly, some of the companies have parent companies with their own large balance sheets, or with interests in similar areas, allowing them to access debt more cheaply than if the company were to do it on its own.
Overall, we concur with PR09 and the CC determination for Bristol Water that a small company debt premium is justified and we would set this this at the same level, namely 0.3% - 0.4%.
A8.2 Equity
There is no evidence that the smaller WoCs are riskier than WaSCs. We note that in PR09, although Ofwat did not allow smaller companies higher return on equity, they did assume a lower level of gearing. We see no rationale for assuming that small companies cannot gear to the level of larger companies; this is consistent with the CC’s finding on

Recommendations for WACC 2015-20, Summary report, February 2014
Annex: Small company premium
44
Bristol Water, There was no evidence of a higher cost of equity or higher gearing when Bristol and Dee Valley were listed.
We believe that the 0.3% - 0.4% proposed additional cost of debt is adequate compensation for the smaller companies and that no further adjustment is needed.
Recommendations for WACC 2015-20, Summary report, February 2014
Annex: Comparison with Ofwat Guidance issued
January 2014
45
A9 Comparison with Ofwat Guidance issued January 2014
This section compares our estimates of the components of WACC with Ofwat’s guidance issued in January.
A9.1 Debt
Ofwat has assumed a cost of debt of 2.65%. This is their view for both embedded debt and new debt; Ofwat has assumed a ratio of 75%:25% embedded debt:new debt. Ofwat’s range is 2.6% - 2.8% for both embedded and new debt.
Our assumed cost of debt is 2.6% - 2.9%, based on a cost of existing debt of 2.5% - 2.7%, a cost of new debt of 2.6% - 3.1% (including transactions costs), and a weighting of embedded debt to new debt of 75%:25%. Our assessments of the current cost of debt are slightly lower than Ofwat’s and those taken from the companies’ business plans, possibly due to measurement differences or timing (as our measures are for the 2012/13 year. Our cost for new debt is higher than Ofwat’s assumption as our expectations of future rate increases, and the ability of companies to finance at these rates, are more conservative.
A9.2 Risk free rate
Ofwat proposes a range of 0.75% to 1.25% with a point estimate of 1.25%. This compares with our range of 1.25% to 1.75% and central estimate of 1.5%
Ofwat has used current yields adjusted for forward-looking expectations. However, we retain a concern that the current ‘spot’ risk-free rate may under-estimate the longer term rate. We also note the recent regulatory precedent of 2% by Ofgem in its reviews in 2011 and 2012.
A9.3 Equity market risk premium
Ofwat proposes a market risk premium of 5.5% compared to our analysis suggesting a range of 4.5% to 5.0%. Ofwat’s analysis is based on total market returns of 6.25% to 6.75%. We concur that historic evidence over the long term is market returns of 6%-7% suggesting a market risk premium of 4.5% - 5.5% (based on our RFR of 1.5%). However, the value for EMRP should be forward-looking. The evidence of reducing returns in recent years together with the forward evidence suggested by dividends leads us to put our market risk premium at the bottom half of this range, that is 4.5% - 5.0% .
It is worth noting that our central estimate of overall market return is 6.25%, not too dissimilar from Ofwat’s estimate of 6.25%-6.75%.

Recommendations for WACC 2015-20, Summary report, February 2014
Annex: Comparison with Ofwat Guidance issued
January 2014
46
A9.4 Equity beta
Ofwat has assumed an equity beta of 0.8 based on an overall range of 0.75-0.80, and cites evidence from the company business plans of equity beta estimates of 0.84 – 1.07. Their analysis focuses on an ‘observed’ asset beta22, presumably derived from an equity beta, although this is not stated. Their calculations are light on explanation. Whereas we have focused our calculations on return periods of weeks, Ofwat measure returns over a month, and lag this for five years (60 observations). We are able to recreate the shape of their asset beta graph, but not the level, as our asset beta comes out consistently lower than Ofwat’s in a simple visual comparison.
Another observation from the data is that Ofwat’s beta is measured from a single starting point in a month (we assume this is the 1st day of every month, or the nearest trading day thereafter). In our analysis, we calculate 31 series by using all 31 possible starting days in a month. The results are quite telling – the beta is much more stable when calculated from returns measured in the middle of a month than the beginning or end. We can hypothesise why this is, but its occurrence is evident. Therefore, when determining our best estimate of monthly beta, we look at all 31 series (using different starting days), and find that the equity beta is in line with our average series estimates for four-weekly returns.
In adjusting their asset beta of 0.3 to an equity beta of 0.8, Ofwat uses gearing of 62.5%. We adjust our historic equity betas down to an asset beta using company actual gearing, both constantly and adjusted based on company reports at the time, and then recalculate our projected equity betas using Ofwat’s constant assumed future gearing of 62.5%. With this approach we still observe much lower equity betas than Ofwat’s assumption.
Ofwat also note the use of Bayesian adjustments, which “seeks to rectify the possibility of low betas being underestimated, either as a consequence of statistical or market factors”. We have considered the use of Bayesian adjustments. Essentially, these adjustments make assumptions about the underlying distribution of the beta, usually that it should revert to the market beta of 1.0, and adjust it towards that a priori assumption if the measured value is significantly above or below this.
Ofwat have not made clear what their a priori assumption is, but our analysis suggests that, a priori, we would expect an equity beta below 1.0, and therefore expect that the observed betas of the water companies will not go towards 1.0. Given this, we have considered a Bayesian adjustment to be worth considering, but to be unnecessary I this instance.
Our empirical analysis derives an equity beta quite different from Ofwat’s, with the main results falling in the range 0.4-0.5. However, when we give consideration to market expectations on the equity beta and the observed regulatory practice of avoiding making too sharp adjustments in any one period, our proposed range has been increased by 1 point to 0.5-0.6.
22 Asset beta cannot, in our view, be ‘observed’ as stock market returns are measured in respect of equity, not assets. We therefore are uncertain as to whether Ofwat estimated equity beta and then calculated asset beta from that, or had some other method (not explained in their report) for arriving at an assumption on asset beta.
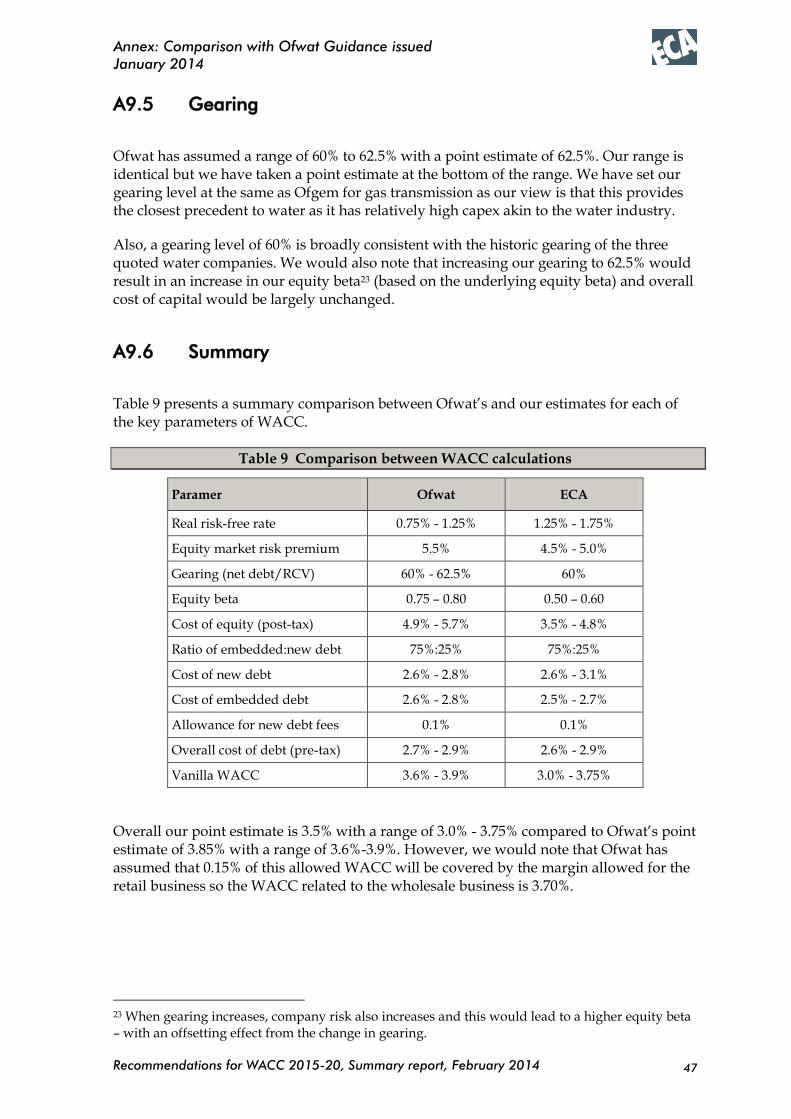
Recommendations for WACC 2015-20, Summary report, February 2014
Annex: Comparison with Ofwat Guidance issued
January 2014
47
A9.5 Gearing
Ofwat has assumed a range of 60% to 62.5% with a point estimate of 62.5%. Our range is identical but we have taken a point estimate at the bottom of the range. We have set our gearing level at the same as Ofgem for gas transmission as our view is that this provides the closest precedent to water as it has relatively high capex akin to the water industry.
Also, a gearing level of 60% is broadly consistent with the historic gearing of the three quoted water companies. We would also note that increasing our gearing to 62.5% would result in an increase in our equity beta23 (based on the underlying equity beta) and overall cost of capital would be largely unchanged.
A9.6 Summary
Table 9 presents a summary comparison between Ofwat’s and our estimates for each of the key parameters of WACC.
Table 9 Comparison between WACC calculations
Paramer Ofwat ECA
Real risk-free rate 0.75% - 1.25% 1.25% - 1.75%
Equity market risk premium 5.5% 4.5% - 5.0%
Gearing (net debt/RCV) 60% - 62.5% 60%
Equity beta 0.75 – 0.80 0.50 – 0.60
Cost of equity (post-tax) 4.9% - 5.7% 3.5% - 4.8%
Ratio of embedded:new debt 75%:25% 75%:25%
Cost of new debt 2.6% - 2.8% 2.6% - 3.1%
Cost of embedded debt 2.6% - 2.8% 2.5% - 2.7%
Allowance for new debt fees 0.1% 0.1%
Overall cost of debt (pre-tax) 2.7% - 2.9% 2.6% - 2.9%
Vanilla WACC 3.6% - 3.9% 3.0% - 3.75%
Overall our point estimate is 3.5% with a range of 3.0% - 3.75% compared to Ofwat’s point estimate of 3.85% with a range of 3.6%-3.9%. However, we would note that Ofwat has assumed that 0.15% of this allowed WACC will be covered by the margin allowed for the retail business so the WACC related to the wholesale business is 3.70%.
23 When gearing increases, company risk also increases and this would lead to a higher equity beta – with an offsetting effect from the change in gearing.
Recommendations for WACC 2015-20, Summary report, February 2014
Annex: Simulation approach
48
A10 Simulation approach
The factors determining WACC have been simplistically represented (e.g. in section 1.3) as lying within a range with a maximum and minimum value. More realistically, each of these parameters could be represented as a probability distribution: over the 5-year regulatory period each parameter will in reality take a variety of values, expected more often to be close to the centre of the range but occasionally at the ends of the range and beyond those end-points.
A probability distribution of the vanilla WACC can be estimated by carrying out a simulation analysis taking account of the uncertainty (represented as a probability distribution of values) involved in each underlying parameter of the vanilla WACC. The factors of uncertainty included in the probabilistic analysis are:
risk free rate
equity market risk premium
cost of debt
equity beta
We have further assumed that these factors follow a normal distribution24 in which the input ranges that we have stated in section 1.3 are the 95% probability range. Using this probability distribution of each factor we have generated a set of random variables – the approach commonly known as ‘Monte Carlo simulation’ - as the possible combination of input values for WACC. Each set of these random variables were then entered into the WACC calculation formula to generate one possible outcome for WACC. This process was repeated 1000 times to end up with 1000 possible WACC results, which forms a normal probability distribution of expected WACC values for the PR14 period. The histogram and the assigned probabilities of the 1000 simulated WACC results are depicted in Figure 22 below.
24 The Akain Information Criterion and the Chi-squared statistic on the analysis of past data indicate that it is
a fair assumption to assume that these values follow a normal distribution.
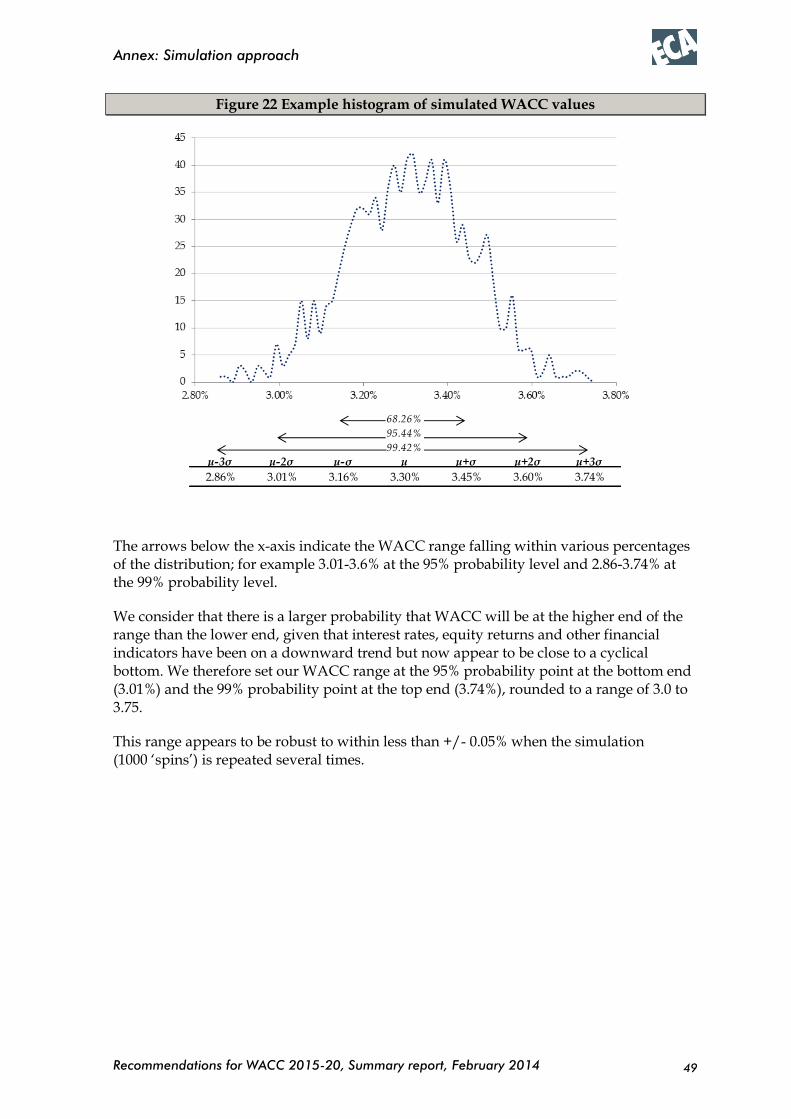
Recommendations for WACC 2015-20, Summary report, February 2014
Annex: Simulation approach
49
Figure 22 Example histogram of simulated WACC values
The arrows below the x-axis indicate the WACC range falling within various percentages of the distribution; for example 3.01-3.6% at the 95% probability level and 2.86-3.74% at the 99% probability level.
We consider that there is a larger probability that WACC will be at the higher end of the range than the lower end, given that interest rates, equity returns and other financial indicators have been on a downward trend but now appear to be close to a cyclical bottom. We therefore set our WACC range at the 95% probability point at the bottom end (3.01%) and the 99% probability point at the top end (3.74%), rounded to a range of 3.0 to 3.75.
This range appears to be robust to within less than +/- 0.05% when the simulation (1000 ‘spins’) is repeated several times.
68.26%
95.44%
99.42%
μ-3σ μ-2σ μ-σ μ μ+σ μ+2σ μ+3σ
2.86% 3.01% 3.16% 3.30% 3.45% 3.60% 3.74%