ecc report 172
TRANSCRIPT

Broadband Wireless Systems Usage in 2300-2400 MHz
March 2012
ECC Report 172

ECC REPORT 172 – Page 2
0 EXECUTIVE SUMMARY
The scope of this Report is to provide compatibility studies with respect to the potential use of the band 2300-2400 MHz by broadband wireless systems (BWS). These studies encompass:
Sharing scenarios within the band 2300-2400 MHz between BWS on the one hand and, on the other hand, other services/systems but also BWS
Adjacent band scenarios between BWS operating in the band 2300-2400 MHz and other services/systems operating either below 2300 MHz or above 2400 MHz.
This Report also investigates measures relating to cross-border coordination in case two countries deploy BWS in the band 2300-2400 MHz.
The two BWS systems under consideration are LTE and Mobile WiMAX, both operating in the TDD duplex mode. Some of the technical and operational parameters used in the studies are based on applicable standards or regulatory texts which represent the minimum performance requirement specifications of the BWS systems.
Coexistence has been studied under the assumption that apart from geographical separation and in some cases frequency offset, no interference management and operator coordination is conducted. The study was performed assuming worst case scenarios. Minimum performance requirement of the BWS systems were used in different scenarios, while the BWS product has a better performance in practice.
The simultaneous operation in a co-channel and co-location configuration of BWS and systems other than Telemetry systems / UAV is feasible with manageable constraints.
According to the MCL based studies, simultaneous operation of the BWS in a co-channel configuration with Telemetry Systems / UAV is feasible only with large separation distances. These separation distances are not feasible in situations where BWS and Telemetry systems/UAV are co-located. Additionally co-channel operation may be facilitated if simultaneous operation of BWS and telemetry / UAV can be avoided.
The adjacent band compatibility studies conclude that potential interference issues can be handled provided that appropriate mitigation techniques (e.g. frequency separation, separation distance, additional filtering, site engineering) are applied to protect existing services and systems.
0.1 ADJACENT BAND COMPATIBILITY SCENARIOS BELOW 2300 MHz
The coexistence between a LTE TDD macro base station and an earth station satellite receiver (for both Earth Exploration Satellite Service and Space Research Service) at the 2290 MHz boundary has been investigated. The results indicate a feasible implementation of BWS with a geographical separation distance of 3-7 km. Furthermore, since the number of earth stations is limited and their location is known in many countries, and that LTE TDD base stations have better characteristics in reality than those taken into account in the studies (better spurious emission performance than those contained in the specifications, site engineering techniques and/or power restrictions), the adjacent band compatibility between LTE-TDD operating within the band 2300-2400 MHz and space services operating below 2290 MHz is not expected to create difficulty. From the study between LTE TDD macro base stations operating in the 2300-2400 MHz band and a Deep Space service operating in the band 2290-2300 MHz band it can be concluded that a Deep Space earth station receiver installed close to a LTE TDD base station might require mitigation solutions including:
Frequency separation Additional filtering Site engineering techniques such as transmitter antenna tilting, and antenna direction and careful
deployment planning A combination of the above.
ECC REPORT 172 – Page 3
Furthermore it is shown that there is no significant impact from LTE TDD base stations to receiving satellites in EESS (space to space).
Regarding compatibility with radio astronomy earth stations (receiving in the band 2200-2290 MHz), it was shown that protection of these stations can be achieved for example by a suitable co-ordination zone around the limited number of observatory stations.
Administrations wishing to license the 2300-2400 MHz band to BWS should be aware that there is a potential conflict with MMDS system that might operate below 2300 MHz. Administrations are encouraged to perform appropriate studies for this scenario if MMDS systems are present.
0.2 SHARING SCENARIOS WITHIN 2300-2400 MHZ
For various BWS networks to coexist without guard band in the band 2300-2400 MHz, the use of mitigation techniques is required. Examples of mitigation techniques to improve the adjacent channel operation of BWS systems are (non-exhaustive list):
Synchronization of networks operating in adjacent channels Extra filtering Site engineering Main lobe planning between frequency neighbouring licensees Site coordination between operators.
The coexistence between BWS and SAP/SAB1 video links has been studied in a worst-case analysis. The results indicate that the required coupling loss depends on the video link scenario. In cordless or portable camera scenarios, coexistence can be feasible in the adjacent and alternate channel case; it has to be decided on a case-by-case basis if additional protection and sharing mechanisms have to be employed. In the co-channel case, dedicated protection and interference mitigation mechanisms would be required if BWS and video links are used at the same time in the same area. In a scenario involving a video link to a helicopter, the required coupling loss between the systems is higher, and a guard band between the BWS and video link systems is likely to be required if no further coordination measures are implemented.
The coexistence between BWS and Telemetry Systems (and coexistence between BWS and UAV – Unmanned aeronautical vehicles) is not ensured in a co-channel co-location configuration. Adjacent channel operation, geographical separation, time sharing or a combination of the previous may help to ensure coexistence.
Regarding Radio Amateur systems in the 2300-2400 MHz band, operating as a secondary service, it was shown that the required MCL (Minimum Coupling Loss) can be achieved by various mitigation techniques.
0.3 ADJACENT BAND COMPATIBILITY SCENARIOS ABOVE 2400 MHZ
The coexistence between BWS and Bluetooth within the device has been studied. It has been shown that in-device coexistence requires some mitigation techniques.
The results for the impact of macro LTE TDD BS on WLAN show that coexistence is feasible for indoor WLAN systems at antenna height of 1.5m with an interference probability smaller than 1%. The outdoor placed WLAN systems at 10 m height (worst case) will have very high interference probability. For the indoor case, WLAN AP interfering the Pico LTE TDD BS, there is a degradation in average bit rate. The results clearly show that increasing the offset frequency of LTE TDD decreases the bit rate degradation significantly. In all scenarios it is shown that using WLAN channel 5 instead of channel 1 will improve the situation significantly so that the coexistence between LTE TDD and WLAN would be feasible without mutual harmful interference.
1 These results can be extended for the evaluation of adjacent band compatibility with SAP/SAB links operated below 2300 MHz.

ECC REPORT 172 – Page 4
0.4 CROSS BORDER COORDINATION BETWEEN BWS SYSTEMS
As in other frequency bands where the mobile service is deployed (e.g. the bands 900, 1800, 2100 MHz…), a coordination between networks deployed on each side of a border will be needed so as to avoid interferences between networks operating in the same channel but also in adjacent channels. Such a coordination procedure is all the more relevant as network are operated in the TDD duplex mode, where base station to base station co-channel operations can occur.
The most efficient measure to alleviate interferences between TDD networks deployed on each side of a border is to enforce synchronisation between these networks (so that the base stations of the two networks transmit and receive exactly at the same time). Noting that this measure may not be easily implementable, other mitigation techniques may also be envisaged (guard bands, extra-filtering, site engineering, reduction of output power…).

ECC REPORT 172 – Page 5
TABLE OF CONTENTS
0 EXECUTIVE SUMMARY ............................................................................................................................ 2 0.1 ADJACENT BAND COMPATIBILITY scenarios below 2300 MHz ................................................... 2 0.2 SHARING scenarios within 2300-2400 MHz ..................................................................................... 3 0.3 ADJACENT BAND COMPATIBILITY scenarios above 2400 MHz ................................................... 3 0.4 Cross border coordination between BWS systems ........................................................................... 4
1 INTRODUCTION ......................................................................................................................................... 9
2 FREQUENCY USAGE ................................................................................................................................ 9 2.1 Frequency usageS below 2300 MHz .............................................................................................. 10 2.2 Frequency usageS within THE BAND 2300-2400 MHz .................................................................. 11 2.3 Frequency usageS above 2400 MHz .............................................................................................. 11
3 BWS SYSTEM CHARACTERISTICS ...................................................................................................... 12 3.1 BWS BS characteristics .................................................................................................................. 13 3.2 BWS UE characteristics .................................................................................................................. 14 3.3 BWS BS Antenna Pattern and emission mask ............................................................................... 15
4 SHARING SCENARIOS BELOW 2300 MHZ ........................................................................................... 16 4.1 Space services IN THE BAND 2200-2300 MHz (space To earth) .................................................. 16
4.1.1 SRS characteristics (2200-2290 MHz) .................................................................................. 16 4.1.2 SRS characteristics (2290-2300 MHz) .................................................................................. 16
4.2 space service IN THE BAND 2200-2290 MHz (SPACE TO SPACE) ............................................. 17 4.2.1 Conclusion ............................................................................................................................. 18
4.3 Deep Space research service (2290-2300 MHz) ............................................................................ 18 4.3.1 Interference from LTE TDD BS to SRS earth stations .......................................................... 18 4.3.2 Interference from LTE TDD BS to deep space SRS earth stations ...................................... 20
4.3.2.1 Deterministic approach .......................................................................................... 20 4.3.2.2 SEAMCAT approach ............................................................................................. 21
4.3.3 Impact of unwanted emission from LTE TDD BS to Deep Space Earth Station receivers ... 22 4.3.4 Conclusion ............................................................................................................................. 25
4.4 Telemetry ......................................................................................................................................... 25 4.5 Radio Astronomy Service ................................................................................................................ 25
4.5.1 Conclusion ............................................................................................................................. 26 4.6 Defence systems ............................................................................................................................. 26 4.7 Fixed Service ................................................................................................................................... 26
5 SHARING SCENARIOS WITHIN 2300-2400 MHZ .................................................................................. 26 5.1 SAP/SAB Video Links ..................................................................................................................... 26
5.1.1 SAP/SAB characteristics ....................................................................................................... 26 5.1.2 Coexistence scenario ............................................................................................................ 29 5.1.3 Methodology .......................................................................................................................... 33
5.1.3.1 General calculation of median Minimum Coupling Loss ....................................... 33 5.1.3.2 Correction of median MCL for 95% victim system reliability ................................. 34 5.1.3.3 Calculation of minimum separation distance ........................................................ 34 5.1.3.4 Calculation table example ..................................................................................... 34
5.1.4 Results – Scenario 1 “Cordless Camera Link” ...................................................................... 36 5.1.4.1 LTE TDD interfering with video link ....................................................................... 36 5.1.4.2 Video link interfering with LTE TDD ...................................................................... 37
5.1.5 Results – Scenario 2 “Mobile Video Link” ............................................................................. 38 5.1.5.1 LTE TDD interfering with video link ....................................................................... 38 5.1.5.2 Video link interfering with LTE TDD ...................................................................... 39
5.1.6 Results – Scenario 3 “Portable Video Link” ........................................................................... 40 5.1.6.1 LTE TDD interfering with video link ....................................................................... 40 5.1.6.2 Video link interfering with LTE TDD ...................................................................... 41

ECC REPORT 172 – Page 6
5.1.7 Conclusions ........................................................................................................................... 43 5.2 Telemetry ......................................................................................................................................... 43
5.2.1 Aeronautical telemetry ........................................................................................................... 43 5.2.2 Terrestrial Telemetry ............................................................................................................. 43 5.2.3 Telemetry characteristics ....................................................................................................... 44 5.2.4 Interferences from LTE to Telemetry ..................................................................................... 45 5.2.5 Interferences from Telemetry to LTE ..................................................................................... 49 5.2.6 Conclusions for Telemetry ..................................................................................................... 55
5.3 UAS (UNMANNED AIRCRAFT SYSTEMS) ................................................................................... 55 5.3.1 UAS characteristics ............................................................................................................... 55 5.3.2 Sharing configuration ............................................................................................................. 55
5.3.2.1 Methodology .......................................................................................................... 57 5.3.3 Impact from UAS to LTE TDD ............................................................................................... 58
5.3.3.1 Impact from LTE TDD to UAS ............................................................................... 58 5.3.4 Conclusion for UAS ............................................................................................................... 59
5.4 BWS versus BWS ........................................................................................................................... 59 5.4.1 BWS characteristics .............................................................................................................. 59 5.4.2 BWS-UE to BWS-UE ............................................................................................................. 59 5.4.3 BWS-BS to BWS-BS ............................................................................................................. 60 5.4.4 Conclusions ........................................................................................................................... 63
5.5 Amateur Service .............................................................................................................................. 63 5.5.1 Typical characteristics of a station in the Amateur Service ................................................... 64 5.5.2 Sharing scenarios .................................................................................................................. 64 5.5.3 Methodology .......................................................................................................................... 64 5.5.4 Conclusions ........................................................................................................................... 65
6 SHARING SCENARIOS ABOVE 2400 MHZ ........................................................................................... 66 6.1 Bluetooth ......................................................................................................................................... 66
6.1.1 Bluetooth characteristics ....................................................................................................... 66 6.1.2 Impact of Bluetooth to LTE TDD............................................................................................ 67 6.1.3 Impact of LTE TDD to Bluetooth ............................................................................................ 69 6.1.4 Conclusions ........................................................................................................................... 69
6.2 WLAN .............................................................................................................................................. 69 6.2.1 WLAN characteristics ............................................................................................................ 70 6.2.2 Impact of LTE TDD BS to WLAN AP ..................................................................................... 70 6.2.3 Impact of Home WLAN AP on LTE TDD system .................................................................. 72 6.2.4 Conclusions ........................................................................................................................... 74
7 APPROACHES FOR ASSISTING BORDER COORDINATION .............................................................. 75
8 CONCLUSIONS ........................................................................................................................................ 77 8.1 ADJACENT BAND compatibility scenarios below 2300 MHz ......................................................... 77 8.2 SHARING scenarios within 2300-2400 MHz ................................................................................... 78 8.3 ADJACENT BAND compatibility scenarios above 2400 MHz ......................................................... 78 8.4 Cross border coordination between BWS systems ......................................................................... 79
ANNEX 1: LTE TDD TRANSMITTER AND RECEIVER CHARACTERISTICS ............................................. 80
ANNEX 2: ADDITIONAL CALCULATION RESULTS REGARDING THE COEXISTENCE OF LTE-TDD AND SAP/SAB VIDEO LINKS ........................................................................................................................ 84
ANNEX 3: INTERFERENCE FROM LTE TDD BASE STATION TO EARTH STATION SATELLITE RECEIVERS DESCRIBED (DETERMINISTIC APPROACH) ........................................................................ 89
ANNEX 4: EMPIRICAL PROPAGATION MODEL (EPM 73) ......................................................................... 91
ANNEX 5: LIST OF REFERENCE .................................................................................................................. 92

ECC REPORT 172 – Page 7
LIST OF ABBREVIATIONS Abbreviation Explanation
3GPP 3rd Generation Partner Project
ACIR Adjacent Channel Interference Ratio
ACLR Adjacent Channel Leakage Ratio
ACLR - A Adjacent Channel Leakage Ratio – Absolute
ACLR – R Adjacent Channel Leakage Ratio – Relative
ACS Adjacent Channel Selectivity
AFH Adaptive Frequency Hopping
AP Access Point
AS Amateur Service
BEM Block Edge Mask
BS Base Station
BW Bandwidth
BWS Broadband Wireless System
CDMA Code Division Multiple Access
CEPT European Conference of Postal and Telecommunications Administrations
CS Circuit Switched
DEC Decision
DRS Data Relay Service
ECA European Common Allocation
ECC European Communication Council
EESS Earth Exploration Satellite Service
EIRP Effective Isotropic Radiated Power
ENG/OB Electronic News Gathering and Outside Broadcasting
ETSI European Telecommunications Standards Institute
ERC European Radio Committee
ERP Effective Radiated Power
EUTRA Evolved Universal Terrestrial Radio Access
FWA Fixed Wireless Access
GS Ground Station
GSO Geostationary Satellite Orbit
ITU International Telecommunication Union
IMT International Mobile Telephony
ISM Industrial Scientific Medical
IVS International VLBI Service
LEO Low Earth Orbit
LNA Low Noise Amplifier
LTE Long Term Evolution
MCL Minimum Coupling Loss
MSR Multi Standard Radio
N/A Not Applicable Not Available

ECC REPORT 172 – Page 8
OOB Out Of Band
PFD Power Flux Density
PMR Private Mobile radio
RAS Radio Astronomy Service
REC Recommendation
RF Radio Frequency
RX Receiver
SAP/SAB Services Ancillary to Programme making/Services Ancillary to Broadcasting
SAW Surface Acoustic Wave
SO Space Operation
SR Space Research
SRD Short Range Device
SRS Space Radio Services
TDD Time Division Duplex
TLM Telemetry
TS Terminal Station
TX Transmitter
UAS Unmanned Aircraft System
UAV Unmanned Aerial Vehicle
UE User Equipment
UHF Ultra High Frequency
UWB Ultra Wide Band
VHF Very High Frequency
VLBI Very Long Baseline Interferometry
WiMAX Worldwide interoperability for Microwave Access
Wt Wanted transmitter

ECC REPORT 172 – Page 9
1 INTRODUCTION
The scope of this Report is to provide compatibility studies with respect to the potential use of the band 2300-2400 MHz by broadband wireless systems (BWS). These studies encompass:
Sharing scenarios within the band 2300-2400 MHz between BWS on the one hand and, on the other hand, other services/systems but also BWS
Adjacent band scenarios between BWS operating in the band 2300-2400 MHz and other services/systems operating either below 2300 MHz or above 2400 MHz.
This Report also investigates measures relating to cross-border coordination in case two countries deploy BWS in the band 2300-2400 MHz.
The purpose of this Report is to calculate the minimum coupling loss or geographical separation or frequency separation required between systems operating within the same geographical areas or in general to calculate the technical conditions that would ensure proper operating conditions for BWS and other systems without putting undue constraint on either system.
The Report is structured as follows:
In Chapter 2, the Frequency usages are given. In Chapter 3, the BWS system characteristics are listed. In Chapter 4, the studies between BWS systems and other services below the band 2300-2400
MHz are described. In Chapter 5, the studies between BWS systems and other services in the band 2300-2400 MHz
are described, as well as coexistence studies between BWS systems. In Chapter 6, the studies between BWS systems and other services in band above 2400 MHz
are described. In Chapter 7, guidance on border coordination is provided. In Chapter 8 conclusions are drawn.
2 FREQUENCY USAGE
Table 1: shows an overview of main usages in and around the 2300-2400 MHz band. More details about the European Common Allocations and the relation to European Standards can be found in subsequent sections.
Table 1: Overview of usages in and around the 2300-2400 MHz band
2200 MHz 2290 MHz 2300 MHz 2400 MHz 2450 MHz 2483.5 MHz
BWS ISM band (e.g. WLAN, Bluetooth)
SPACE OPERATION (space-to-Earth) (space-to-space) EARTH EXPLORATION EXPLORATION-SATELLITE (space-to-Earth) (space-to-space) FIXED
FIXED MOBILE (except aero) SPACE RESEARCH (deep space) (space-to-Earth
FIXED MOBILE Radiolocation (RADIOLOCATION for region 2 and 3) Amateur Major utilisation : SAB/SAP (ERC/REC 25-10 [7]), EN 302 064 [26] Amateur (EN 301 783 [17]) Aeronautical telemetry (ECA, ERC/REC 62-
FIXED MOBILE RADIOLOCATION

ECC REPORT 172 – Page 10
2200 MHz 2290 MHz 2300 MHz 2400 MHz 2450 MHz 2483.5 MHz
MOBILE SPACE RESEARCH (space-to-Earth) (space-to-space) Major utilisation radio astronomy (as continuum line and VLBI observations)
02 [16])
TERRESTRIAL TELEMETRY
AERONAUTICAL TELEMETRY
It has to be noted that some footnotes and official documents add precisions on the use and the rights of this frequency band. - note 5.395: in France and Turkey, the use of the band 2310-2360MHz by the aeronautical mobile service for telemetry has priority over
uses by the mobile service (WRC-03) - note 5.384A (RR): 2300-2400-MHz is an identified frequency band for IMT; this identification does not establish priority in the Radio
Regulations (WRC-07) - ERC/REC 62-02E: Harmonised frequency band for civil and military airborne telemetry applications: recommends that for future
airborne applications the tuning range of equipment should primarily be in the frequency range 2300-2400MHz (…2300-2330 should primarily be used…2330-2400 should be used as an extension…).
2.1 FREQUENCY USAGES BELOW 2300 MHZ
For the band below 2300 MHz, ERC Report 25 [1] indicates that the systems operating in this band include terrestrial (fixed and mobile) and satellite (Space to Earth and Space to Space directions) services as shown in Table 2:
Table 2: ECA [1] information for 2 200 MHz to 2 300 MHz
Utilisation ERC/ECC
Documentation European Standard Comments
2 200 MHz to 2 290 MHz:
Defence Systems Radio Relay links 2 200 MHz to 2245 MHz
Fixed Links T/R 13-01 [41] EN 302 217 [42] Radio Astronomy Continuum line and VLBI
observations SAP/SAB EN 302 064
[26]Error! Reference source not found.
See Table C2 in [7]
EESS/ Space Operation/ Space Research
Satellite payload and platform Telemetry (space to earth)
2 290 MHz to 2 300 MHz:
Mobile applications Space Research (deep space)
Satellite payload and platform telemetry for space research (deep space)
Although there is no RAS allocation adjacent to the band proposed for BWS (2300-2400 MHz), there is an allocation to the Space Research Service in the band 2200-2290 MHz that is mainly used for geodetic VLBI measurements. Under the terms of the RR, these also constitute radio astronomy, as they are measurements using radio astronomical techniques; see the European Common Allocations in ERC Report 25 [1]. European stations of the International VLBI Service (IVS) are given in Table 3:

ECC REPORT 172 – Page 11
Table 3: Location of RAS VLBI stations within the CEPT
Country (location of station) IVS Component Name
Germany Geodetic Observatory Wettzell Italy Medicina Italy Noto (Sicily) Italy Matera Norway Ny-Alesund Geodetic Observatory The Russian Federation Radioastronomical Observatory Badary The Russian Federation Svetloe Radio Astronomy Observatory The Russian Federation Radioastronomical Observatory Zelenchukskaya Spain Observatorio Astronomico Nacional – Yebes Sweden Onsala Space Observatory Ukraine Simeiz
2.2 FREQUENCY USAGES WITHIN THE BAND 2300-2400 MHz
ERC Report 25 [1] identifies the European Common Allocation of the band 2300 MHz- 2400 MHz as for Fixed, Mobile, Radiolocation and amateur services. The Fixed and Mobile services are identified on a primary basis with the other two on a secondary basis.
Table 4: ECA [1] information for 2 300 MHz to 2 400 MHz
Utilisation ERC/ECC Documentation European Standard
Aeronautical Telemetry ERC/REC 62-02[16] - Amateur - EN 301 783 [17] Mobile Applications - - SAP / SAB ERC/REC 25-10 [7] EN 302 064 [26]
However, the examination of the relevant ERC/ECC Recommendations shows that these services might not utilize the entire frequency band. This information is relevant for the potential deployment of BWS based on a TDD duplex mode.
2.3 FREQUENCY USAGES ABOVE 2400 MHz
According to ERC Report 25 [1] the European common allocations are shown in Table 5:
Table 5: European common allocations [1] information for 2 400 MHz to 2 500 MHz
Utilisation ERC/DEC Documentation European Standard
Amateur and Amateur Satellite EN 301 783 [17] Non- Specific SRD’s ERC/REC 70-03 [43] EN 300 440 [48] Radiodetermination applications ERC/REC 70-03 [43]
ERC/DEC(01)08 [44] EN 300 440 [48]
Railway Applications ERC/REC 70-03 [43] EN 300 761 [49] RFID ERC/REC 70-03 [43] EN 300 440 [48] Wideband Data Transmitting Systems ERC/REC 70-03 [43] EN 300 328 [39] IMT Satellite Component Mobile Satellite Applications ECC/DEC(07)04 [46]
ECC/DEC(07)05 [47] ECC/DEC(99)02 [50]
ECC REPORT 172 – Page 12
Utilisation ERC/DEC Documentation European Standard
ERC/DEC(97)05 SAP/SAB ERC/REC 25-10 [7] EN 302 064
3 BWS SYSTEM CHARACTERISTICS
The transmission and reception characteristics for sharing studies is given in [15], for the technology labelled IMT‑2000 CDMA TDD, where LTE TDD (also called E-UTRA TDD) is included. Many characteristics are references to a 3GPP document, where in this document the corresponding ETSI document is instead referenced. A 3GPP reference “36.xyz” corresponds to an ETSI reference “136 xyz”.
There is an overview of the LTE-TDD technology in ETSI TR 102 837 [5], and the standard is described in more detail in documents such as ETSI TS 136 101 [2], ETSI TS 136 104 [3], and ETSI TS 136 211 [4]. In general, the technology is described the ETSI TS 136-series documents.
Mobile WiMAX parameters and characteristics are described in ETSI TR 102 837 V1.1.1_1.1.2 [5] and the ETSI Harmonised Standards EN 301 908 parts 19 [22] and 20 [23].
The ETSI standard documents [3],[14] and the WiMAX Forum Air interface specification [24] specify minimum requirements on ACLR, ACS and spurious emission levels. In practice, it is common for infra-structure vendors to offer products with significantly better performance for various reasons such as to accommodate special sharing situations in various markets or for deployment in co-siting situations or for improving the interference behaviour in specific sites.

ECC REPORT 172 – Page 13
3.1 BWS BS CHARACTERISTICS
Base Station parameters used in the sharing studies in this document are shown in Table 7:
Table 6: BWS BS transmitter and receiver parameters
Parameter LTE TDD technology Mobile WiMAX technology
Bandwidth (MHz) 5, 10, 20 [3] 5 / 10 Band (MHz) 2300-2400
Duplex mode TDD
Max BS output power Wide Area BS 46 dBm/10, 15 and 20 MHz 36 typical, 43 max dBm/5MHz
Local Area BS n 2
< + 24 dBm (for one transmit antenna port) < + 21 dBm (for two transmit antenna ports) < + 18 dBm (for four transmit antenna ports) [3]
N./A Column 3
Home BS N./A
BS Antenna height (m) Varies between 10-37.5 m above clutter height in studies 3033003030
Antenna Gain (dBi) 17 17
BS ACLR (dB)
Wide area BS: the least stringent of 45 dB and -15 dBm/MHz. Local area BS: the least stringent of 45 dB and -32 dBm/MHz. Home BS: the least stringent of 45 dB and -50 dBm/MHz. See Annex 2.
45 (first adjacent channel) / 50 (second adjacent channel)
BS Spurious emission specified by 3GPP (dBm/MHz) (beyond 10MHz outside operating band)
-30(dBm/MHz) [3] specified by 3GPP (beyond 10MHz outside operating band)
-30 dBm/MHz beyond +/-250% channel spacing
BS Operating band unwanted emsission mask
The requirements for general transmitter unwanted emission behavior in 2290-2300 MHz in [3] or the Multi Standard Radio (MSR) equipment requirements as specified in [14]
See [24]
BS Feeder loss (dB) 3 3 BS Antenna tilt (degrees) 3 (giving 3dB loss compared to the main lobe) [11] 3 BS Receiver ACS 40 (first adjacent channel) / 50 (second adjacent channel) Noise figure (dB) 5 Thermal noise (F.k.T.B) -102 dBm (LTE 5 MHz)
-99 dBm (LTE 10 MHz) -96 dBm (LTE 20 MHz)

ECC REPORT 172 – Page 14
Parameter LTE TDD technology Mobile WiMAX technology
Interference criterion I/N (dB) -6 Imax (dBm) -108 dBm (LTE 5 MHz)
-105 dBm (LTE 10 MHz) -102 dBm (LTE 20 MHz)
It should be noted that the BS parameters given in Table 6: are those of macro base stations. Micro and pico have different characteristics and their impact to telemetry systems is expected to be less significant than the one from macro BS.
3.2 BWS UE CHARACTERISTICS
Table 7: shows the BWS UE system characteristics.
Table 7: BWS UE transmitter and receiver parameters
Parameter LTE TDD technology Mobile WiMAX technology
Bandwidth (MHz) 5, 10, 20 (other channel bandwidths are available in the LTE standard but those are not considered in this report)
5 / 10
Maximum Ouput power (dBm) 23 26 max, typically 20 Antenna Height (m) 1.5 1.5 Antenna Gain (dBi) assumption
0 (omnidirectional) 0
ACLR (dB) 30 (1st adjacent channel) 30 (1st adjacent channel) / 44 (2nd adjacent channel) Spurious emissions (dBm/MHz)
-30 (beyond 10MHz outside the operating band) -30 dBm/MHz beyond +/-250 % channel spacing.
Receiver ACS 33 (1st adjacent channel) / 44 (2nd adjacent channel) Noise figure (dB) 9 Thermal noise (F.k.T.B) -98 dBm (LTE 5 MHz)
-95 dBm (LTE 10 MHz) -92 dBm (LTE 20 MHz)
Interference criterion I/N (dB) -6 Imax (dBm) -104 dBm (LTE 5 MHz)
-101 dBm (LTE 10 MHz) -98 dBm (LTE 20 MHz)

ECC REPORT 172 – Page 15
3.3 BWS BS ANTENNA PATTERN AND EMISSION MASK
Figure 1: illustrates BWS BS antenna according to Recommendation ITU-R F.1336-2 for (a) horizontal and (b) vertical patterns.
(a) (b)
Figure 1: BWS BS antenna (a) horizontal and (b) vertical pattern
Figure 2: depicts the unwanted emission mask for LTE TDD with a 20 MHz bandwidth in the SEAMCAT simulations. This figure is based on the unwanted emission mask for LTE TDD extracted from 3GPP TS 36.104 V10.0.0 (2010-09) (Table 6.6.3.2.1-6).
See ANNEX 1: for Category B emission limits for the case where LTE is at the edge of the band
Figure 2: An example of LTE TDD unwanted emission mask (20 MHz bandwidth, at the edge of the band) (used in the SEAMCAT studies in section WLAN)

ECC REPORT 172 – Page 16
4 SHARING SCENARIOS BELOW 2300 MHz
4.1 SPACE SERVICES IN THE BAND 2200-2300 MHz (SPACE TO EARTH)
The following table shows the protection criteria valid for SRS from 2200 MHz to 2300 MHz.
Table 8: Protection criteria for SRS and SRS (Deep Space)
Frequency Band Service Protection criteria ITU-R Recommendation
2200-2290 MHz SRS -216 dB(W/Hz) SA.609 [10] 2290-2300 MHz SRS (deep space) -222 dB(W/Hz) SA. 1157 [13]
4.1.1 SRS characteristics (2200-2290 MHz)
The band 2 200-2 290 MHz is allocated to the following services:
Earth exploration-satellite (space to-Earth), Space research (space-to-Earth) Space operation (space-to-Earth).
Space research communications are required for several kinds of functions: telecommand, maintenance telemetering, stored scientific data and real-time scientific data. According to Recommendation ITU-R SA.1154 [38] (Provisions to protect the space research (SR), space operations (SO) and Earth exploration-satellite services (EESS) and to facilitate sharing with the mobile service in the 2 025-2 110 MHz and 2 200-2 290 MHz bands ) and ITU-R SA.609 [10] (Protection criteria for radio communication links for manned and unmanned near Earth research satellites), the aggregate interference at the input terminals of the receiver in the earth station should not exceed −216 dBW/Hz for more than 0.1% of the time to protect the SR, SO and EES services from aggregate interference for unmanned missions and for 0.001% of the time for manned missions.
The earth station receiver assumptions are extracted from Report ITU-R SM.2057 [9], which provides interference studies from Ultra Wideband (UWB) systems to a number of services including space to earth services. Typical antenna gain for earth station is 46 dBi. For this case, in order to take into account more realistic situations and since the BWS systems to be deployed in the band 2300-2400 MHz are terrestrial, the fixed gain of the earth station antenna, which is directional because the ground station is tracking a LEO satellite in azimuth and in elevation, is replaced with the gain in the first side lobes, that is to say 31 dBi.
4.1.2 SRS characteristics (2290-2300 MHz)
The band 2 290-2 300 MHz is allocated to deep space research (space-to-Earth). According to Recommendation ITU-R RS.1157 [13], the protection criterion for SRS (deep space) is −222 dBW/Hz at the input of the earth station receiver. Typical antenna gain for SRS earth station is 62 dBi (diameter of 70 m). For this case, in order to take into account more realistic situations, the fixed gain of the earth station antenna, which is directional because the ground station is tracking a LEO satellite in azimuth and in elevation, is decreased by 40 dB in order to reach the antenna side lobes. Thus the effective antenna gain used in the calculations is 22 dBi.
The following figure shows a typical deep space SRS antenna pattern for the calculations extracted from Recommendation ITU-R SA. 509 [35].

ECC REPORT 172 – Page 17
Figure 3: Horizontal antenna pattern of the SRS Earth station (Recommendation ITU-R SA.509 [35])
4.2 SPACE SERVICE IN THE BAND 2200-2290 MHz (SPACE TO SPACE)
The frequency band 2200-2290 MHz is also used for EESS (Space-to-space). According to the general architecture of a typical Data Relay Satellite system (also called DRS), the band 2200-2290 MHz is used as a space- to-space link in the return direction (also known as the return inter-orbit link), from low-orbiting spacecraft to the data relay satellite (which is usually on geosynchronous orbit).
The characteristics of the return in orbit link received by the GSO satellite (Data Relay Satellite or DRS) are as follows:
maximum antenna gain of the GSO satellite = from 34.7 to 36 dBi, antenna diameter from 2.8 to 4.9 m
link reliability = 99.99 %. According to Recommendation ITU-R SA.1155 [6], the maximum aggregate interference level used as the basis for computing compatibility studies is -181 dBW/kHz (or – 151 dBW/MHz) for the band 2200-2290 MHz for EESS (Space to Space) to be exceeded for no more than 0.1 % of the time based on the orbital period of satellites for the various links of data relay satellite systems, in order to meet an interference-to-noise, I/N, power ratio of –10 dB.
A simple link budget analysis shows the interference level from LTE TDD devices in the band 2300-2400 MHz to satellite GSO receivers operating in the band 2200-2290 MHz.
Table 9: BS interference into GSO satellites
Parameter Units Value
Frequency MHz 2250 Wavelength m 0.13 OOB e.i.r.p. (power spectral density) of a single BWS device
dBm/MHz -30
Distance BWS – Satellite receiver in km km 36000 Space attenuation in dB dB 191 Satellite antenna gain in dBi dBi 34.7 Received power at the EESS sensor in 1 MHz bandwidth in dBm
dBm/MHz -186
Threshold in dBm in 1 MHz bandwidth dBm/MHz -121.0 Margin with a single BWS device in dB dB 64.9 Half antenna beamwidth ° 3.00

ECC REPORT 172 – Page 18
Parameter Units Value
Maximum number of BWS transmitters 3068810 Size of the satellite footprint: radius in km assuming a flat earth
Km 1885
In this table, the maximum permissible interference level at the satellite receiver is calculated. The contribution of a single base station to the aggregate interference is also calculated. Then the two levels are compared and the number of base stations that would reach together the maximum permissible interference level at the satellite receiver is calculated. This number of BS is roughly 3 million which would correspond to a hypothetical average density of 0.27 base stations per km².
It should be noted that this figure far exceeds a typical average base stations density over such a large territory. It should be also noted that the assumptions taken in the calculations are conservative:
A 0dBi antenna gain has been assumed for the side-lobes of the antenna base stations whereas a typical front-to-back ratio of 25 dB is generally assumed. With a maximum antenna gain of 17 dBi, this would lead to an off-axis gain of -8 dBi at a 90° elevation.
The level of spurious emissions of BWS has set at -30 dBm/MHz. The current specifications contain requirements far below this figure.
4.2.1 Conclusion
In conclusion, BWS does not have any considerable negative impact on space to space service.
4.3 DEEP SPACE RESEARCH SERVICE (2290-2300 MHz)
Calculation of interference that may result from atmospheric and precipitation effects should be based on weather statistics that apply for 0.001% of the time. Note that this reference percentage of time is 0.001 % is equivalent to the probability of interference in SEAMCAT (see simulation results below).
4.3.1 Interference from LTE TDD BS to SRS earth stations
A LTE TDD base station operating according to the transmission parameters given in Table 7: is assumed.
LTE TDD base station spurious emission requirements (-30 dBm/MHz) are according Table 6: and an earth station tolerated interference according to Table 8: (This is rescaled to -126 dBm/MHz for this study) are assumed. This corresponds to a required isolation of 96 dB which would be achieved through consideration of antenna gains and distance dependent propagation loss.
The received interference level is calculated using field strength curves correcting for frequency (in prescribed way [8, Annex 5]) and converting the results to dBm taking into account e.g. receiver antenna gain and transmitter antenna gain.
For a compatibility study between LTE TDD and SRS, the calculated separation distances between Wt (SRS Earth receiver) and BS reference cell (LTE TDD) in the band 2200 – 2290 MHz are summarized in Table 10: An interference probability of about 0.1% for various interfering antenna heights was used.
The protection criteria for SRS in the band 2200-2290 MHz is -216 dB(W/Hz) and was converted into -186 dBm/Hz in order to be used in SEAMCAT.

ECC REPORT 172 – Page 19
Table 10: Calculated separation distances between Wt (SRS Earth station receiver) and BS reference cell (LTE TDD) for an interference probability about 0.1 % for various interfering antenna heights
Antenna height 10 m Antenna height 20 m Antenna height 37.5 m
Calculated separation distances between Wt and BS reference cell (km)
4.2 km 5.4 km 7.0 km
Figure 4: and Figure 6: shows the received interference power for three choices of h1 (height over representative clutter height) plus free space curve for reference for EESS and Space Research, respectively. The receiver is at the representative clutter height. The horizontal line corresponds to the earth station protection criteria.
2300 MHz
-200
-190
-180
-170
-160
-150
-140
-130
-120
-110
-100
-90
-80
1 10 100
Distance (km)
Rec
eive
d i
nte
rfer
ence
po
wer
(d
Bm
)
h1=10mh1=20mh1=37.5mFree spaceEESS
Figure 4: interference power per MHz as function of distance for EESS (31 dBi receiver antenna gain)
The Figures shows that the interference levels can be held below the tolerated levels when distances are as small as 3-7 km even when the 3GPP specification for spurious emission levels of -30 dBm/MHz is just met.
In countries where the number of earth stations is limited with well-known locations sharing can be further improved by e.g. deploying LTE TDD stations with local (i.e. near the earth stations) restrictions on characteristics like antenna tilt, antenna directions, and/or transmission power.

ECC REPORT 172 – Page 20
4.3.2 Interference from LTE TDD BS to deep space SRS earth stations
4.3.2.1 Deterministic approach
It is assumed that a LTE TDD BS operating just at the 2300 MHz boundary and that there is a space to earth receiver station operating at the 2290 MHz boundary. This means that there is 10 MHz guard band between the systems. The following potential interference paths (dotted arrows) exist, see Figure 5:
Figure 5: Possible interference paths
The interference path (1) is studied since it is assumed to be the most critical case. The paths (3) and (4) are considered to have a negligible impact due to the weak satellite signal and in case of path (4) also the down tilt of the BS.
In this study, an interferer system with -30 dBm/MHz spurious emission at the antenna connector is interfering with a receiver in a victim system with a tolerated interference level at the receiver input of -216 dBW/Hz or -126 dBm/MHz at the receiver input corresponding to a required attenuation of 96 dB. The attenuation contains effects of propagation loss, antenna gains, feeder loss and effects of antenna tilt.
In this section, a method for converting the portion of the attenuation corresponding to propagation loss into a required distance is given. The method uses “power” in dBm units rather than “power/MHz” in the dBm/MHz units.
The method is based on field strength curves as function of distance for various choices of transmitter base station height over clutter assuming a transmitter operating at 1 kW (60 dBm) ERP Recommendation ITU-R P.1546-4 [8]. We study the distance at which a transmitted signal (acting as interference) at -30 dBm ERP has attenuated 96 dB to reach -126 dBm received signal at the victim receiver input.
In Figure 6: the received interference power for three choices of h1->h3 is shown (plus free space for reference) when using the assumption of a spurious emission level of -30 dBm/MHz. The horizontal line, -126 dBm shows the tolerated interference levels per MHz for EESS and Space Research services respectively. The Figure shows that the interference levels can be held below the tolerated levels when distances are as small as 3-7 km.

ECC REPORT 172 – Page 21
In countries where the earth stations are few with well-known locations, co-existence can be further improved by e.g. deploying LTE TDD stations with local (i.e. nearer the earth stations) restrictions on characteristics like antenna tilt, antenna directions, and/or spurious emission power
2300 MHz
-200
-190
-180
-170
-160
-150
-140
-130
-120
-110
-100
-90
-80
1 10 100
Distance (km)
Rec
eive
d i
nte
rfer
ence
po
wer
(d
Bm
)
h1=10mh1=20mh1=37.5mFree spaceSpace Research
Figure 6: Received interference power per MHz as function of distance for Space Research (22 dBi receiver antenna gain)
4.3.2.2 SEAMCAT approach
According to Recommendation ITU-R SA.1157 [13], the protection criterion for the deep-space research services is −222 dBW/Hz at the input of the earth station receiver. The receiver antenna gain in an antenna side lobe is assumed to be one of either 40 dBi or 60 dBi. The propagation model between VR and IT is ITU-R P. 1546-4 (land path, 50 % of time, local clutter height 0 m) [8]
The same methodology as in Space services IN THE BAND 2200-2300 MH is used, with some differences in parameter values.
For compatibility study between LTE TDD and SRS (deep space), the calculated separation distances between Wt (SRS Earth station receiver) and BS reference cell (LTE TDD) in the band 2290 – 2300 MHz are summarised in Table 11: for an interference probability of about 0.001% for various interfering antenna heights.
Two cases were considered:
No guard band between systems (fc of interferer at 2310 MHz with 20 MHz channel BW); 10 MHz guard band between systems (fc of interferer at 2320 MHz with 20 MHz channel BW).
The protection criteria for SRS (deep space) in the band 2200-2290 MHz -222 dBW/Hz was translated, in order to be used in SEAMCAT, as -192dBm/Hz

ECC REPORT 172 – Page 22
Table 11: Calculated separation distances between Wt (deep SRS Earth receiver) and BS reference cell (LTE TDD) for an interference probability about 0.001%
for various interfering antenna heights
Frequency Separation
Antenna height 10 m
Antenna height 20 m
Antenna
height 37.5 m
Calculated separation distances between Wt and BS reference cell (km)
- > 20 km >27km > 33 km 10 MHz 6 km 8.0 km 9.5 km
4.3.3 Impact of unwanted emission from LTE TDD BS to Deep Space Earth Station receivers
We assume that we have a LTE TDD BS operating just at the 2300 MHz boundary and that there is a space to earth receiver station operating in the 2290-2300 MHz band border. The interference paths are the same as those depicted in Figure 8: and also in this case the path (1) is considered most interesting.
The methodology in this study is identical in to the one used in section 4.1 with the following changes:
The operating band unwanted emission behaviour in 2290-2300 MHz specified by the technology is represented by single value associated with the interferer transmission power (per MHz).
A single value h1=37.5m of transmitter antenna height over clutter is investigated The receiver antenna gain is assumed to be either 40 or 60 dBi. The protection criterion, tolerated receiver interference power is -222 dBW/Hz [13]. In order to
be able to calculate a required path loss, this value is rescaled to the same unit as the transmitter emission to -132 dBm/MHz.
The operating band unwanted emission requirements are defined for different cases in [3]: Category A and Category B equipment where Category B is relevant for Europe. Furthermore, the Category B requirements come with two options: Option 1 and Option 2. For Option 1, the requirements for the 2300-2400 MHz band are specified for system bandwidths of 5, 10, 15 and 20 MHz in Table 6.6.3.2.1-6 in [3]. For Option 2, there are stricter requirements for other bands but not for the band of interest in this study.
It is of great interest for the industry to have Multi Standard Radio (MSR) equipment where many 3GPP based technologies can be implemented on the same platform. The document [14] specifies the often stricter radio transmission and reception requirements for MSR equipment. In particular, the 2300-2400 MHz band is associated with stricter requirements on a MSR platform. These requirements are equivalent with the above mentioned Option 2 requirements.
The requirements for general transmitter unwanted emission behaviour for 2290-2410 MHz in Table 6.6.3.2.1-6 in [3] and the stricter MSR equipment requirements as specified in Table 6.6.2.1-1 in [14] are depicted in Figure 7: as a function of the frequency distance to the 2300 MHz band edge. All tabulated values have been converted to the unit dBm measured over 1 MHz to enable plotting, visual comparison and the subsequent calculations.

ECC REPORT 172 – Page 23
-14
-12
-10
-8
-6
-4
-2
0
2
4
0 1 2 3 4 5 6 7 8 9 10 11
Frequency distance from band edge (MHz)
Min
imu
m r
equ
irem
ent
(dB
m @
1 M
Hz)
General BSMSR
Figure 7: Unwanted emission masks
The following unwanted emission levels are taken into account:
3 dBm per MHz corresponding to a absolute worst case using the general BS requirement with a Deep Space earth station operating just at the 2300 MHz band edge.
-13 dBm per MHz corresponding to the ‘flat’ portion of the MSR profile beyond 1.5 MHz -43 dBm per MHz corresponding to an additional 30 dB attenuation due to extra filtering with
respect to the ‘flat’ portion of the MSR profile. The last case is motivated by the fact that it is straightforward to apply 30 dB (or even higher) extra attenuation beyond a certain guard space with an external filter. Such filters could be realised with a guard band in the order of 3-4 MHz or less depending on used filter technology.
The remaining BWS transmitter parameters are taken from Table 6: The results are shown in Figure 8:

ECC REPORT 172 – Page 24
2300 MHz
-200
-190
-180
-170
-160
-150
-140
-130
-120
-110
-100
-90
-80
1 10 100
Distance (km)
Rec
eive
d i
nte
rfer
ence
po
wer
(d
Bm
)
General BS & 40 dBi
MSR & 40 dBi
MSR & add. filter & 60 dBi
MSR & add. filter & 40 dBi
Deep Space
Figure 8: Received interference power per MHz as function of distance for Deep Space for various combinations of unwanted emission levels, receiver antenna gain and extra 30 dB-filtering
The above figure shows the relationship between separation distance and received interference power for a number of cases (Curves correspond from right to left to the legend from top to bottom). The horizontal line corresponds to the Deep Space protection criterion.
It is shown that using the general BS requirements and a 40 dBi receiver antenna gives a separation distance in the order of 50 km. Instead, if the MSR requirements are assumed and allowing for some guard band and an extra filter attenuating 30 dB, the distance decreases to about 8 km. Using a higher receiver antenna gain of 60 dBi increases this distance to about 20 km. This guard band could be obtained by not using part of the 2290-2300 MHz band, or by not allocating the lowest part of the 2300 MHz band (or a combination).
Consequently, having a very sensitive Deep Space earth station receiver close to a broadband wireless system such as LTE TDD might require solutions such as:
Designing according to the MSR requirements [14] Frequency separation Additional filtering Site engineering techniques such as transmitter antenna tilting, and antenna direction and
careful deployment planning A combination of the above.

ECC REPORT 172 – Page 25
4.3.4 Conclusion
It can be concluded that having a very sensitive Deep Space earth station receiver close to a broadband wireless system such as LTE TDD might require some mitigation techniques.
4.4 TELEMETRY
The adjacent band compatibility studies provided in section 5.2 (within the band 2300-2400 MHz) are also applicable to telemetry equipment working in frequencies below the 2300 MHz.
4.5 RADIO ASTRONOMY SERVICE
The compatibility study between BWS and RAS usage in the adjacent band 2200-2290 MHz is presented in this section. As an illustration in relation to protection requirements, the following simple study was performed based on LTE-TDD transmitter parameters from Table 6:.
The LTE-TDD transmitter is assumed to be operating near the lower band edge (2300 MHz) with a RAS observatory making a continuum observation in the allocated band below 2290 MHz – i.e. more than 10MHz away from the transmit band edge where a flat spurious emission limitation region of -30dBm/MHz specified by 3GPP applies.
The applicable parameters used for the radio astronomy observation can be derived from Recommendation ITU-R RA.769 [36] and are presented in the following table:
Table 12: RAS Station parameters
Parameter Value
Observing Bandwidth (MHz) 10 Observing Frequency (MHz) 2285 Antenna height (m) 50 *Antenna Gain (dBi) 0 Spectral pfd threshold of interference ’SH’ (dB(W m-2 Hz-1))
-248.6
* Note on RAS station antenna gain. In this case, interference to the radio astronomy station will almost always be received through the
antenna side lobes, so the very high gain main beam response to the interference is not considered. We calculate the threshold levels of interference for a particular value of side-lobe gain, which we choose as 0 dBi (see Recommendation ITU-R RA.769) [36]. Since the number of RAS VLBI stations in Europe is low, an administration can study specific sites and antennas on a case by case basis
The power spectral density of the spurious emission radiated in the observing band is:
-30dBm/MHz – Feeder loss + Antenna gain – Antenna tilt loss
i.e. -30 – 3 + 17 – 3 = -19 dBm/MHz (or -109 dBW/Hz)
And the consequent spfd SBWS using the equation given in ITU-R REC RA.769 [36] is:
SBWS = -109 + 20 log(2.285x10⁹) -158.5 = -80.3 dB(W m-2 Hz-1)
(where 2.285x10⁹ Hz is the observing frequency).
The path loss LPROT required to reduce SBWS to the RAS interference threshold limit SH (given in the table above) to produce acceptable interference levels at the station is:
LPROT = SBWS - SH
LPROT = -80.3 – (-248.6) = 168.3 dB

ECC REPORT 172 – Page 26
As an example, the minimum distance (dmin) to provide the required path loss at this frequency when calculated according to Recommendation ITU-R P. 452-11 for open rural areas (where stations of the RAS are usually located) will give a protection distance of 73 km.
For protection of RAS stations a MCL of 168.3 dB is needed; this can be achieved for example by a suitable co-ordination zone around observatories listed in Table 3: Deployment of BWS base stations within the co-ordination zone could be assessed on a case by case basis for non-interference. Additional path losses due to terrain effects between the transmitter and observatory may facilitate deployment at reduced distances in some locations. These effects might be assessed using a path loss prediction tool with an appropriate terrain and clutter database. In addition, reduction of the spurious emission power, for example by additional filtering or by using equipment with better spurious emission characteristics than specified by standardization organisations, manipulation of the transmit antenna pattern in situ, etc. may also be used in combination to meet the requirements of Recommendation ITU-R RA.769 [36].
4.5.1 Conclusion
Regarding co-existence with radio astronomy earth stations, it was shown that protection of these stations can be achieved for example by a suitable co-ordination zone around the relatively few observatory stations.
4.6 DEFENCE SYSTEMS
The adjacent channel part of the telemetry section 5.2 can be extrapolated to cover these systems.
4.7 FIXED SERVICE
Fixed services are deployed within CEPT (about 1000 links in 16 countries where the 2025-2110 MHz band is paired with the band 2200-2290 MHz; point to point links can be unidirectional or bidirectional). Interference studies were not performed in this report as the risk of interference was, because of highly directional antennas and the probable deployment in rural areas, considered to be very low.
5 SHARING SCENARIOS WITHIN 2300-2400 MHZ
5.1 SAP/SAB VIDEO LINKS
5.1.1 SAP/SAB characteristics
According to ERC/REC 25-10 [7], in many CEPT countries temporary audio and video SAP/SAB links have, for many years, successfully shared frequency bands with other civil and military radiocommunication applications. Additional demand for SAP/SAB frequencies during large scale events may require temporary loan of frequencies from other services. Therefore SAP/SAB services have a history of spectrum sharing.
Annex 2 of [25] recommends frequency ranges and preferred sub-bands for Audio and Video SAP/SAB links. For the spectrum range under consideration, cordless cameras and portable/mobile video links are of relevance since their recommended tuning range includes the 2300-2400 MHz band (although it is not a preferred sub-band for these services).
Typical application scenarios and technical characteristics of SAP/SAB equipment are described in detail in ERC Report 38 (video links) [26] . Table 1 of [26] (reproduced in Table 13: below) specifies the maximum output powers (EIRP), as well as the minimum transmit and receive antenna gains.

ECC REPORT 172 – Page 27
Table 13: Typical Technical Characteristics for ENG/OB Links
Type of Link
Range Max
E.I.R.P. Min Tx
ant. gain
Min Rx ant. gain
Radio Link Path
Suitable Frequency
Range Description
Cordless Camera
<500 m
6 dBW 13 dBW (22 GHz or 47 GHz)
0 dBi 6 dBi Usually clear line of sight.
Currently < 12 GHz
Handheld camera with integrated transmitter, power pack and antenna
Portable Link
<2 km
16 dBW 6 dBi 17 dBi Not always clear line of sight.
<5 GHz Handheld camera but with separate bodyworn transmitter, power pack and antenna.
Mobile Link
<10 km
26 dBW 3 dBi 13 dBi Often obstructed and susceptible
<5 GHz Mounted in helicopters, motorcycles, pedal cycles, cars, racing cars and boats. One or both link terminals may be used when moving.
Temporary Point-to-point Link
<80 km each hop for links at <10 GHz
40 dBW 13 dBi 17 dBi Usually clear line of sight for OB, but often obstructed for ENG use.
<10 GHz for long hops. Hop length at >10 GHz limited by precipitation fading.
Link terminals are mounted on tripods, temporary platforms, purpose built vehicles or hydraulic hoists.
Additionally, Appendix 1 of [26] gives some characteristics of antennas used commonly in ENG/OB systems. An example link budget for the calculation of link margins of ENG/OB video links can be found in Appendix 2 of [26].
The transmitter output spectrum shall be considered with respect to the measurement mask in Figure 9:where B is the declared channel bandwidth. The power is required to be determined outside the channel bandwidth B within block 2 and block 3 as shown in Figure 9:

ECC REPORT 172 – Page 28
Figure 9: Measurement Mask normalized to channel bandwidth [27]
The required bandwidth (ACLR) power limits are given in the following Table 14: to Table 18: from [26]
Table 14: Integrated power limits relative to PMAX for P0 < 0.3 W eirp
Each half of the region Both halves of the region
Block 2 -36 dB -33 dB
Block 3 -42 dB -39 dB
Table 15: Integrated power limits relative to PMAX for P0 > 0.3 W eirp
Each half of the region Both halves of the region
Block 2 -36 dB - 10 log (P0/0.3) -33 dB - 10 log (P0/0.3)
Block 3 -42 dB - 10 log (P0/0.3) -39 dB - 10 log (P0/0.3)
Table 16: Discrete spectral components relative to PMAX for P0 < 0.3 W eirp
Power in any 3 kHz bandwidth
Block 2D < -48 dB
Block 3D < -54 dB
Table 17: Discrete spectral components relative to PMAX for P0 > 0.3 W eirp
Power in any 3 kHz bandwidth
Block 2D < -48 dB - 10 log (P0/0.3)
Block 3D < -54 dB - 10 log (P0/0.3) The level of spurious transmitter emissions, measured as described in the specification [26], shall not exceed the limits given in the following table. The measurement bandwidth for carrier frequencies > 1000 MHz is 1 MHz.
Table 18: Radiated spurious emissions
State Other frequencies <= 1
000 MHz > 1 000 MHz
Operating 250 nW 1 µW
Standby 2 nW 20 nW

ECC REPORT 172 – Page 29
5.1.2 Coexistence scenario
Video link SAP/SAB equipment is typically used in a variety of scenarios which are quite different from each other. E.g., a cordless camera link might consist of a small hand-held camera transmitter and a small portable receiver. On the other hand, large TV trucks or even helicopters can be used to carry video link equipment which gives significant difference in antenna height, gain, and propagation environment. ERC Report 38 [25] includes a collection of examples.
For the present study, three usage scenarios of video links have been selected which are described in the following Table 19: and illustrated in Figure 10:, Figure 11: and Figure 12:
Table 19: Usage scenarios and antenna parameters for wireless video link coexistence study [26]
# Name Transmitter Tx Ant. Type,
Gain, Height Receiver Rx Ant. Type,
Gain, Height Propagation Model [29]
1 Cordless Camera Link
portable hand-held camera
semi-sphere omnidirectional, 5 dBi, 1.5 m
portable hand-held receiver
directional (e.g., Disk Yagi), 16 dBi, 1.5 m
Urban, below rooftop
2 Mobile Video Link
portable camera on motorcycle
semi-sphere omnidirectional, 5 dBi, 1.5 m
receiver on helicopter
semi-sphere omnidirectional, 5 dBi, 150 m
Free Space (helicopter links); Open area (ground links)
3 Portable Video Link
two-man radio camera
directional (e.g., Disk Yagi), 16 dBi, 3 m
TV van 1.2 m Parabolic Dish, 27 dBi, 5 m
Suburban, below rooftop
Figure 10: Scenario 1 - Cordless Camera Link [26]

ECC REPORT 172 – Page 30
Figure 11: Scenario 2 - Mobile Video Link [26]
Figure 12: Scenario 3 - Portable Video Link [26]
Scenarios 1 and 3 are located in an urban environment, whereas scenario 2 is placed in a rural environment. The selection of environments influences the coexistence analysis since it affects parameters like LTE-TDD base station height, transmit powers, propagation models, etc (see Table 20: and Table 21: below). It is assumed that in the rural scenarios, an LTE-TDD wide-area BS transmits at 46 dBm (43 dBm for a bandwidth of 5 MHz), whereas in the urban deployments, a local area BS transmits at a maximum power of 24 dBm [3].
The coexistence scenarios studied here involve LTE TDD (one BS or one UE) on the one hand, and one video link transmitter and receiver on the other hand. Both systems are analyzed in their role as interferers and as the victim. Within the 2300-2400 MHz band, the systems are assumed to be deployed either in the same channel (co-channel case), in channels directly adjacent to each other (adjacent channel case), or with a guard band in-between (alternate channel case). The guard band is assumed to be sufficiently large so that received out-of-band emissions are in the spurious domain.
This coexistence analysis only takes into account the effects of interferer emissions in the victim’s receive band. It is assumed and expected that the selectivity of the victim’s receiver is high enough so that the emission effects dominate receiver blocking effects.
For LTE-TDD parameters, the values in Table 6: Table 20: and Table 21: have been used. These values generally represent worst-case assumptions under the chosen deployment scenarios, e.g. regarding transmiit powers, antenna directions, ACLR and spurious emission power levels. For example, it is highly unlikely that an LTE UE is granted all available bandwidth. If a fraction of the available bandwidth is assigned, this will significantly reduce the UE’s out-of-band emissions. Further, frequency-selective scheduling could be applied in the case that LTE experiences interference from a video link employing a smaller bandwidth. It should also be noted that the required performance values regarding ACLR and spurious emissions are typically exceeded significantly by devices in production.

ECC REPORT 172 – Page 31
Table 20: LTE TDD BS transmitter parameters
Parameter (unit) Symbol BS - LTE TDD value
Max output power (dBm) PMAX Scenarios 1 and 3: 24 [3] Scenario 2: 43 (5 MHz) and 46 (10 and 20 MHz)
(Note 1)
Antenna height (m) Ht Scenarios 1 and 3: 15 Scenario 2: 37.5
Antenna horizontal direction
Always pointed at victim receiver
Antenna Directivity Loss (dB)
Gtd Explicitly calculated iteratively with separation distance and according to ITU-R F.1336-2 radiation pattern, peak side lobes [11]
Adjacent Channel Leakage Ratio (relative to maximum Tx power, or absolute OOB emitted power)
ACLR-R, ACLR-A
Scenarios 1 and 3: ACLR-R = 45 dB, ACLR-A = -32 dBm/MHz
Scenario 2: ACLR-R = 45 dB, ACLR-A = -15 dBm/MHz Effective ACL is either the relative (ACLR-R) or absolute limit (ACLR-A), whichever is less stringent [3] (Note 2).
Note 1: For the case that the victim receiver bandwidth is smaller than the interfering transmitter bandwidth, only a part of the transmitted power effectively causes interference. For this reason, interference mitigation factors of Gb = 0 dB, 3 dB or 6 dB have been employed, representing the Tx/Rx bandwidth ratios. - If the victim receiver bandwidth is larger than the interfering transmitter bandwidth, it is assumed that the resulting interference is sufficiently described and dominated by the received signal power in the transmission band, and no additional emissions (ACLR, spurious etc.) were added.
Note 2: ACLR describes the out-of-band emissions in the adjacent band. If the victim receiver bandwidth is smaller than the interfering transmitter bandwidth, only a fraction of the out-of band emissions effectively causes interference. Since ACLR emissions are not evenly distributed over the adjacent channel’s spectrum, specific interference mitigation factors Gb were derived from the transmitter’s out-of band emission masks, and applied only if ACLR-R represents the valid requirement (see section 5.1.3). - If the receiver bandwidth is larger than the transmission bandwidth, it is assumed that the resulting interference is sufficiently described and dominated by the ACLR in the first adjacent band, and no additional emissions (spurious etc.) were added.
Table 21: LTE TDD UE transmitter parameters
Parameter (unit) Symbol UE - LTE TDD value
Maximum output power (dBm) PMAX 23 (Note 1)
ACLR (dB) – 1st channel ACLR 30 (Note 2) Note 1: For the case that the victim receiver bandwidth is smaller than the interfering transmitter bandwidth, only a part of the
transmitted power effectively causes interference. For this reason, interference mitigation factors of Gb = 0 dB, 3 dB or 6 dB have been employed, representing the Tx/Rx bandwidth ratios. - If the victim receiver bandwidth is larger than the interfering transmitter bandwidth, it is assumed that the resulting interference is sufficiently described and dominated by the received signal power in the transmission band, and no additional emissions (ACLR, spurious etc.) were added.
Note 2: ACLR describes the out-of-band emissions in the adjacent band. If the victim receiver bandwidth is smaller than the interfering transmitter bandwidth, only a fraction of the out-of band emissions effectively causes interference. Since ACLR emissions are not evenly distributed over the adjacent channel’s spectrum, specific interference mitigation factors Gb were derived from the transmitter’s out-of band emission masks, and applied only if ACLR-R represents the valid requirement (see section 5.1.3). - If the receiver bandwidth is larger than the transmission bandwidth, it is assumed that the resulting interference is sufficiently described and dominated by the ACLR in the first adjacent band, and no additional emissions (spurious etc.) were added.
For the coexistence with LTE, some further assumptions have been made regarding the wireless video link transmitters and receivers (see Table 22:):

ECC REPORT 172 – Page 32
Table 22: Wireless Video Link parameters
Parameter (unit) Symbol Video link receiver value
Tx/Rx Bandwidth (MHz) Br 5, 10, 20 [16]
Frequency band (MHz) 2300-2400
Tx Max output power (dBm) PMAX Scenario 1: 17 [30] Scenarios 2 and 3: 30 [31]
(Note 1)
Feeder loss (dB) Gfe 0.5 [30]
Antenna tilt (degrees) Scenarios 1 and 3: 0 Scenario 2 Tx: 0; Rx: semi-sphere
pointing towards earth surface
Antenna horizontal direction Pointed at interferer, or 20 degrees away from interferer
Antenna Directivity Loss horizontal (dB) Grdh
Scenario 1: 0, or 4 if pointed 20 degrees ainterferer
Scenario 2: 0 Scenario 3: 0, or 20 if pointed 20 degrees
interferer
Antenna Directivity Loss vertical (dB)
Grdv
Scenario 1: explicitly calculated iteratively with separation distance and according to ITU-R F.1336-2 radiation pattern, peak side lobes [11]
Scenario 2: 0 Scenario 3: 0, or 20 if
1. interferer is outside of a main lobe of 3.5 degrees, and
2. Grdh = 0 dB Adjacent Channel Leakage Ratio (relative to maximum Tx power)
ACLR-R see Tables 13 and 14 (Note 2).
Spurious emissions (dBm/MHz ) Isp -30 [25]
Rx Noise figure (dB) F 4 [30] Note 1: see Note 1 of Table 20:. Note 2: see Note 2 of Table 20: . As an approximation of the fraction of video link equipment ACLR-R which is effective interference in
an adjacent receiver bandwidth smaller than the transmitter bandwidth, the specific interference mitigation factors for an LTE TDD local area BS were employed.
The vertical direction of the video link receiver antenna is assumed to be parallel to the surface in scenarios 1 and 3. In scenario 1, for the video link receiver antenna the same vertical directivity as for the LTE-TDD base station antenna (according to Recommendation ITU-R F.1336-2 [11]radiation pattern) is assumed. In scenario 3, an extra attenuation of 20 dB is added for the video link receiver antenna if the interferer is outside of a main lobe of 3.5 degrees. In scenario 2, the video link receiver antenna is assumed to be semi-sphere omnidirectional with a constant gain.
The video link transmit antennas are semi-sphere omnidirectional with the exception of scenario 3, where a directivity pattern according to Recommendation ITU-R F.1336-2 [11] is assumed.
With respect to horizontal direction, the video link antenna is assumed to be pointed directly at the LTE TDD BS or UE. In an additional set of calculations, it is pointed 20 degrees away, resulting in an additional 4 dB loss for antennas with moderate directivity (see antenna pattern in Figure 11 in [26]), and 20 dB loss for parabolic dish antennas with a high degree of directivity.

ECC REPORT 172 – Page 33
5.1.3 Methodology
The following set of equations and example link budget table are provided to outline the calculation methodology for Minimum Coupling Loss and Minimum Separation Distance in the three coexistence scenarios.
5.1.3.1 General calculation of median Minimum Coupling Loss
In general, the required median Minimum Coupling Loss, MCL50, is calculated as follows:
MCL50 = Pt + Gt – Gtd – Gfe + Gr – Grdh – Grdv – IC – Gb
where, in logarithmic scale (dB or dBm),
Pt: Effective transmitted interfering power, originating from either co-channel transmitted power, adjacent channel leaked power, or interference in the spurious domain.
Pt = PMAX for the co-channel case, Pt = max{PMAX – ACLR; 10 log(Bt 10ACLA/10)} in the adjacent case, Pt = Bt · Isp in the alternate channel case, where Isp = maximum absolute interference emission density in the spurious domain
Gt: Transmit antenna gain (maximum, at main lobe).
Gtd: Transmit antenna directivity loss, if transmit antenna is not pointed directly at victim receive antenna. A radiation pattern according to Recommendation ITU-R F.1336 [11] (peak side lobe) has been assumed for LTE-TDD BS transmit antennas as well as the directed video link transmit antenna in scenario 3. The directivity loss is calculated taking into account antenna heights, tilt, direction of victim, and radiation pattern.
Gfe: Transmit antenna feeder loss
Gr: Receive antenna gain (maximum, at main lobe)
Grd: Receive antenna directivity loss, if receiver antenna is not pointed directly at interfering transmitter antenna. The loss depends on the geometries, directions and radiation patterns of the employed antennas, see Table 22:
Grd = Grdh + Grdv, the horizontal / vertical antenna directivity loss components
IC: Interference Criterion: Maximum allowable received interference power. This was set to a constant I = N – 6 dB for both wireless video links as well as BWS receivers. I/N = –6 dB is a value commonly used in coexistence studies involving video links as well as BWS [30][31][32]
N = Pth = –174 + 10 log(Br) + F
is the effective thermal noise at the receiver, k·T·Br at T = 300 K, amplified by the receiver noise figure F.
Gb: Bandwidth mitigation factor,
Gb = 0 in the alternate channel case, Gb = specific mitigation factor derived from the transmitter’s emission mask in the adjacent channel case, Gb = max{0; 10 log (Bt/Br)} for the co-channel case,
where
Bt: Bandwidth of Interferer system. Calculations have been performed for Bt = 5, 10, 20 MHz.
Br: Bandwidth of Victim system. Calculations have been performed for Br = 5, 10, 20 MHz [16].
The specific mitigation factors Gb in the adjacent channel case were derived from the LTE TDD BS (wide area and local area) and UE transmitter emission masks, see Tables 6.6.3.2.1-6 and 6.6.3.2A-3 in [3], and Table 6.6.2.1.1-1 in [2]. To derive the ratio of interfering OOB emissions that are effective in an adjacent band which is smaller than the transmitter’s bandwidth (for which ACLR-R is usually defined), the ratio of allowable transmitted emissions in adjacent bands of 5, 10, and 20 MHz were calculated from the emission masks. These are reproduced in Table 23: below.

ECC REPORT 172 – Page 34
Table 23: Specific ACLR-R interference mitigation factors Gb in the adjacent channel case
Interfering Tx bandwidth Victim Rx bandwidth
ACLR-R Interference mitigation factors
LTE TDD BS (Wide Area)
LTE TDD BS (Local Area)
LTE TDD UE
20 MHz 10 MHz 0.19 dB 1.95 dB 1.90 dB
20 MHz 5 MHz 1.64 dB 3.40 dB 3.29 dB
10 MHz 5 MHz 1.45 dB 1.45 dB 1.04 dB Note that the emission masks were not used to derive OOB emissions themselves, but only in order to estimate the reduction in effective interference.
5.1.3.2 Correction of median MCL for 95% victim system reliability
If the median MCL50 is realized, in the presence of fading the maximum tolerable interfere level for the victim system is exceeded 50 % of the time. This might not be acceptable, so that additionally, the fading statistics can be taken into account in order to correct the MCL to a value for which the interference is below the tolerable limit e.g. for 95 % of the time. This corrected value is calculated as MCL95:
MCL95 = MCL50 + σ · sqrt(2) erf–1(2·0.95 –1)
erf–1 denotes the inverse error function.
For this correction, only log-normal fading was taken into account with a distance-dependent standard deviation σ as given in [29].
5.1.3.3 Calculation of minimum separation distance
The required coupling losses MCL50 or MCL95 can be translated into a required separation distance between interfering transmitter and victim receiver. For this purpose, the Modified Hata Propagation model [29] was used under the assumption of the propagation environments given in Table 22:
For the ground-to-helicopter link in usage scenario 2, the free space path loss model
L = 32.5 + 20 log(f/MHz) + 20 log(d/km)
was employed instead.
In the Modified Hata model, the path loss depends on antenna heights and distances as well as carrier frequency and radio environment. The calculation of the necessary separation distance from a given resulting path loss was performed in an iterative manner, since the required path loss is in turn influenced by distance-dependent parameters such as vertical antenna directivity loss, and the distance-dependent slow fading standard deviation σ.
5.1.3.4 Calculation table example
Table 24: illustrates the calculation of the minimum separation distance for Scenario 1, co-channel LTE-TDD BS interferer, system bandwidths 20 MHz.

ECC REPORT 172 – Page 35
Table 24: Example tabular derivation of separation distance to obtain a path loss of MCL95 : Scenario 1, LTE BS co-channel interferer (some intermediate calculation steps have been omitted)
Parameter Symbol Unit Value
Tx antenna height ht m 15
Lower nominal Tx frequency limit f0t MHz 2300
Upper nominal Tx frequency limit f1t MHz 2320
Tx Bandwidth Bt MHz 20
Rx antenna height hr m 1.5
Lower nominal Rx frequency limit f0r MHz 2300
Upper nominal Rx frequency limit f1r MHz 2320
Rx Bandwidth Br MHz 20
Rx Noise figure F dB 4
Thermal noise, N=-174+10*log10(B/Hz)+F N dBm -96.99
I/N requirement I/N dB -6
Maximum Transmitted Power PMAX dBm 24
Effective Interfering Transmitted Power Pt dBm 24
Tx Antenna Gain (max.) Gt dBi 17
Feeder Loss Gfe dB 3
Rx Antenna Gain (max.) Gr dBi 16
Rx antenna sidelobe attenuation (if Rx antenna is not pointed at interferer)
Grd dB
-0.08
Tx antenna discriminator (if Tx antenna not pointed at victim) Gtd dB -9.37
==> maximum allowable interference IC dBm -102.99
==> Bandwidth intf mitigation factor dB 0
Minimum Coupling Loss (Median) MCL50 dB 147.54
Standard deviation below rooftop sigma dB 9
MCL for 95% reliability, below roof MCL95 dB 162.35
Separation Distance d km 3.24
L urban L dB 162.35
L suburban L dB 150.11
L open area L dB 129.87
L free space L dB 109.97
elevation (relative to 3 degree BS tilt) degrees 2.76
azimuth (relative to maximum gain direction) degrees 0.01
LTE BS directional antenna gain (ITU-R F.1336 peak [11]) dB -9.37
elevation (relative to 0 degrees Rx tilt) degrees 0.24
azimuth (relative to maximum gain direction) degrees 0.01
Video link directional antenna gain (ITU-R F.1336 peak [11]) dB -0.08

ECC REPORT 172 – Page 36
5.1.4 Results – Scenario 1 “Cordless Camera Link”
5.1.4.1 LTE TDD interfering with video link
Required Minimum Coupling Loss and separation distances in this scenario are given below, in Table 25:for the worst case of interferer transmit antenna and victim receiver antenna being directed to each other, and applying a coupling loss that leads to a 95 % reliability of the video link system. Also, the results for the less stringent case that the receiver antenna is facing 20 degrees away, and applying the median coupling loss, are given in Table 26:.
It can be observed that for the case of co-channel coexistence, separation distances of around 3 to 4 km are required if the interferer is a LTE TDD BS. For UE interferers, smaller separation distances below 1 km are required in the co-channel case (Table 25:). These distances decrease to less than 1.5 km or around 200 m (BS or UE interferer) for the case that the median coupling loss is employed instead of the 95th percentile, and the receiver antenna is not directly pointed at the interferer (Table 26:).
If LTE uses a channel adjacent to the wireless video link system, separation distances around 400 m (from BS) or 200 m (from UE) are observed (Table 25:). These are reduced to 50-80 m for the case of median coupling loss and a receiver antenna 20° out of alignment with respect to the interference direction (Table 26:).
If the active LTE channel is separated from the video link channel by a sufficiently large guard band, the separation distances are similar to the adjacent case for the BS interferer, but only around 100 m for the (UE interferer, if 95 % reliability is required for the video link, and the antennas exhibit a worst-case alignment. For median MCL and 20° offset, the separation distance is reduced to only 50-60 m for both BS and UE interferers.
Table 25: MCL and corresponding Separation Distances d (95% victim system reliability) for usage scenario 1 “Cordless Camera Link”, antenna directions aligned. LTE interferer
Interference scenario
Victim (videolink) bandwidth
Interfering system and bandwidth
LTE TDD BS LTE TDD UE
20 MHz 10 MHz 5 MHz 20 MHz 10 MHz 5 MHz
Co-channel
20 MHz MCL (dB) 162.3 162.3 162.3 156.8 156.8 156.8
d (km) 3.236 3.236 3.236 0.609 0.609 0.609
10 MHz MCL (dB) 162.3 165.3 165.3 156.8 159.8 159.8
d (km) 3.236 3.953 3.953 0.609 0.744 0.744
5 MHz MCL (dB) 162.3 165.3 168.3 156.8 159.8 162.8
d (km) 3.236 3.953 4.780 0.609 0.744 0.900
Adjacent
20 MHz MCL (dB) 129.4 129.4 129.4 139.9 139.9 139.9
d (km) 0.373 0.373 0.373 0.203 0.203 0.203
10 MHz MCL (dB) 128.7 130.1 130.1 140.7 142.0 142.0
d (km) 0.359 0.392 0.392 0.213 0.231 0.231
5 MHz MCL (dB) 129.8 131.0 131.9 141.8 143.2 143.9
d (km) 0.385 0.417 0.442 0.229 0.250 0.263
Alternate 20 / 10 / 5 MHz
MCL (dB) 130.6 130.0
d (km) 0.408 0.106

ECC REPORT 172 – Page 37
Table 26: Median MCL and corresponding Separation Distances d for usage scenario 1 “Cordless Camera Link”, receiver antenna facing 20° away. LTE interferer
Interference scenario
Victim (videolink) bandwidth
Interfering system and bandwidth
LTE TDD BS LTE TDD UE
20 MHz 10 MHz 5 MHz 20 MHz 10 MHz 5 MHz
Co-channel
20 MHz MCL (dB) 145.4 145.4 145.4 138.0 138.0 138.0
d (km) 1.066 1.066 1.066 0.178 0.178 0.178
10 MHz MCL (dB) 145.4 147.9 147.9 138.0 141.0 141.0
d (km) 1.066 1.264 1.264 0.178 0.217 0.217
5 MHz MCL (dB) 145.4 147.9 150.4 138.0 141.0 144.0
d (km) 1.066 1.264 1.483 0.178 0.217 0.266
Adjacent
20 MHz MCL (dB) 83.2 83.2 83.2 108.0 108.0 108.0
d (km) 0.053 0.053 0.053 0.072 0.072 0.072
10 MHz MCL (dB) 82.1 84.5 84.5 109.1 111.0 111.0
d (km) 0.051 0.054 0.054 0.072 0.075 0.075
5 MHz MCL (dB) 83.9 86.3 88.2 110.7 113.0 114.0
d (km) 0.054 0.057 0.059 0.075 0.078 0.078
Alternate 20 / 10 / 5 MHz
MCL (dB) 85.7 98.0
d (km) 0.056 0.061 Deviating further from worst-case assumptions to more realistic ones (e.g., the UE only being assigned 1/3 of the resource blocks, abandoning perfect BS antenna alignment with the victim receiver, assuming reduced ACLR and spurious emissions) additionally reduces the required separation distances.
5.1.4.2 Video link interfering with LTE TDD
Table 27: corresponds to the same scenario and link assumptions as made for the results in Table 25:, but this time the video link transmitter of scenario 1 interferes with the LTE TDD (BS or UE) reception. Comparing the two tables, it can be observed that video link interfering into LTE results in significantly smaller separation distances (approximately one third to one half of the distances) than the other way around. Hence, in this scenario, the LTE system as the interferer is the limiting interference direction.
As for the case of LTE TDD interferer, the separation distances are further reduced if less strict requirements regarding antenna alignment and reliability percentile are made if video link interferes with LTE (see the results in Annex 2).
Table 27: MCL and corresponding Separation Distances d (95% victim system reliability) for usage scenario 1 “Cordless Camera Link”, antenna directions aligned. Video link interferer
Interference scenario
Victim (LTE)
bandwidth
Victim LTE TDD BS Victim LTE TDD UE
Interfering system bandwidth
20 MHz 10 MHz 5 MHz 20 MHz 10 MHz 5 MHz
Co-channel
20 MHz MCL (dB) 144.8 144.8 144.8 144.8 144.8 144.8
d (km) 1.031 1.031 1.031 0.278 0.278 0.278
10 MHz MCL (dB) 144.8 147.9 147.9 144.8 146.7 146.7
d (km) 1.031 1.259 1.259 0.278 0.314 0.314
5 MHz MCL (dB) 144.8 147.9 151.1 144.8 146.7 148.5
d (km) 1.031 1.259 1.553 0.278 0.314 0.354
Adjacent 20 MHz MCL (dB) 120.2 120.9 122.0 96.4 97.8 100.2

ECC REPORT 172 – Page 38
Interference scenario
Victim (LTE)
bandwidth
Victim LTE TDD BS Victim LTE TDD UE
Interfering system bandwidth
20 MHz 10 MHz 5 MHz 20 MHz 10 MHz 5 MHz
d (km) 0.206 0.217 0.232 0.060 0.061 0.063
10 MHz MCL (dB) 121.0 122.4 123.0 98.0 101.1 102.8
d (km) 0.217 0.238 0.248 0.061 0.064 0.065
5 MHz MCL (dB) 122.1 123.5 124.4 100.5 103.6 106.1
d (km) 0.233 0.255 0.271 0.064 0.067 0.070
Alternate 20 / 10 / 5 MHz
MCL (dB) 121.7 99.6
d (km) 0.226 0.062
Results for other combinations of assumptions (median or 95% MCL, antenna directions) for all three scenarios can be found in ANNEX 2:.
5.1.5 Results – Scenario 2 “Mobile Video Link”
5.1.5.1 LTE TDD interfering with video link
Required Minimum Coupling Loss and separation distances in this scenario are given in Table 28: and Table 29: below. Scenario 2 is characterized by a very low path loss (free space propagation). Therefore, the attenuation to interfering signals is low. This leads to very high required interferer separation distances especially in the co-channel case.
For the case of co-channel coexistence, infeasible separation distances of more than 500 km are required for LTE-TDD BS interferers. For UE interferers, separation distances are above 200 km. Even if the worst case constraints are slightly reduced (median MCL and 20° receiver antenna offset, Table 29:), very large distances are still required for BS interferers.
In the adjacent channel case, separation distances of up to 43 km for LTE base stations, and up to 13 km for LTE UEs are observed. A reduction to around 4-7 km or 1-2 km (BS or UE) can be achieved for median MCL and 20° offset.
For alternate channel use (20 MHz distance between channels) separation of LTE BS/UE reduces to a distance of 1-2 km, but only 200 m to 400 m for the case of relaxed constraints regarding MCL statistics and antenna directions.
Table 28: MCL and corresponding Separation Distances d (95% victim system reliability) for usage scenario 2 “Mobile Video Link”, antenna directions aligned. LTE interferer
Interference scenario
Victim (videolink) bandwidth
Interfering system and bandwidth
LTE TDD BS LTE TDD UE
20 MHz 10 MHz 5 MHz 20 MHz 10 MHz 5 MHz
Co-channel
20 MHz MCL (dB) 173.1 173.1 170.1 145.8 145.8 145.8
d (km) >500 >500 >500 201.8 201.8 201.8
10 MHz MCL (dB) 173.1 176.1 173.1 145.8 148.8 148.8
d (km) >500 >500 >500 201.8 283.6 283.6
5 MHz MCL (dB) 173.1 176.1 176.1 145.8 148.8 151.8

ECC REPORT 172 – Page 39
Interference scenario
Victim (videolink) bandwidth
Interfering system and bandwidth
LTE TDD BS LTE TDD UE
20 MHz 10 MHz 5 MHz 20 MHz 10 MHz 5 MHz
d (km) >500 >500 >500 201.8 283.6 402.4
Adjacent
20 MHz MCL (dB) 127.8 127.8 124.7 115.8 115.8 115.8
d (km) 25.2 25.2 17.6 6.344 6.344 6.344
10 MHz MCL (dB) 130.7 130.9 127.8 116.9 118.8 118.8
d (km) 35.5 36.2 25.3 7.234 9.015 9.015
5 MHz MCL (dB) 132.3 132.5 130.9 118.5 120.8 121.8
d (km) 42.4 43.3 36.2 8.661 11.2 12.7
Alternate 20 / 10 / 5 MHz
MCL (dB) 108.3 105.8
d (km) 2.661 2.011
Table 29: Median MCL and corresponding Separation Distances d for usage scenario 2 “Mobile Video Link”, receiver antenna facing 20° away. LTE interferer
Interference scenario
Victim (videolink) bandwidth
Interfering system and bandwidth
LTE TDD BS LTE TDD UE
20 MHz 10 MHz 5 MHz 20 MHz 10 MHz 5 MHz
Co-channel
20 MHz MCL (dB) 158.3 158.3 155.3 131.0 131.0 131.0
d (km) >500 >500 >500 36.6 36.6 36.6
10 MHz MCL (dB) 158.3 161.3 158.3 131.0 134.0 134.0
d (km) >500 >500 >500 36.6 51.9 51.9
5 MHz MCL (dB) 158.3 161.3 161.3 131.0 134.0 137.0
d (km) >500 >500 >500 36.6 51.9 73.0
Adjacent
20 MHz MCL (dB) 111.9 111.9 108.5 101.0 101.0 101.0
d (km) 4.055 4.055 2.745 1.150 1.150 1.150
10 MHz MCL (dB) 115.0 115.2 111.9 102.1 104.0 104.0
d (km) 5.834 5.952 4.071 1.315 1.638 1.638
5 MHz MCL (dB) 116.7 116.9 115.3 103.7 106.0 107.0
d (km) 7.055 7.270 5.952 1.590 2.042 2.302
Alternate 20 / 10 / 5 MHz
MCL (dB) 85.6 91.0
d (km) 0.197 0.366
5.1.5.2 Video link interfering with LTE TDD
In the reverse interference direction, as can be observed in Table 30:, separation distances are smaller compared with Table 28:, due to the application of a different channel model (open area). The interference takes place between ground stations and does not involve an aircraft as in the LTE interferer case. However, co-channel operation with separation distances in the order of 3/30 km (UE/BS victim) seems unfeasible unless additional protection measures are implemented. Adjacent or alternate channel operation might also require additional protection measures in certain cases.

ECC REPORT 172 – Page 40
Table 30: MCL and corresponding Separation Distances d (95% victim system reliability) for usage scenario 2 “Mobile Video Link”, antenna directions aligned. Video link interferer
Interference scenario
Victim (LTE)
bandwidth
Victim LTE TDD BS Victim LTE TDD UE
Interfering system bandwidth
20 MHz 10 MHz 5 MHz 20 MHz 10 MHz 5 MHz
Co-channel
20 MHz MCL (dB) 156.0 156.0 156.0 147.8 147.8 147.8
d (km) 26.7 26.7 26.7 2.843 2.843 2.843
10 MHz MCL (dB) 156.0 159.0 159.0 147.8 150.8 150.8
d (km) 26.7 30.4 30.4 2.843 3.438 3.438
5 MHz MCL (dB) 156.0 159.0 162.0 147.8 150.8 153.8
d (km) 26.7 30.4 34.3 2.843 3.438 4.199
Adjacent
20 MHz MCL (dB) 109.0 110.1 111.6 115.3 116.0 116.8
d (km) 1.356 1.455 1.608 0.197 0.209 0.226
10 MHz MCL (dB) 110.2 112.2 113.3 116.0 117.1 117.7
d (km) 1.455 1.673 1.795 0.209 0.233 0.248
5 MHz MCL (dB) 111.8 113.9 115.4 116.9 118.0 118.8
d (km) 1.624 1.868 2.065 0.229 0.255 0.277
Alternate 20 / 10 / 5 MHz
MCL (dB) 107.6 114.0
d (km) 1.240 1.182
5.1.6 Results – Scenario 3 “Portable Video Link”
5.1.6.1 LTE TDD interfering with video link
Required Minimum Coupling Loss and separation distances in scenario 3 are given in Table 31: and Table 32:. In this scenario, a very high-gain receiver antenna with narrow beam is employed, so that the effective interference is greatly influenced by the antenna positions and directions. In a worst-case scenario, of course a perfect alignment of antennas has to be assumed.
It is observed that co-channel coexistence requires separation distances of around 30 km for a BS interferer, and around 6-7 km for a UE interferer. If the receiver antenna direction is off-axis, separation distances are less than half of these values (see ANNEX 2:), and a relaxation towards median MCL further reduces the required distances further to 3-4.5 km (BS) or 600-800 m (UE), see Table 32:.
If LTE uses a channel adjacent to the wireless video link system, separation distances around 2 km (from BS) or 1 km (from UE) are observed. These can be significantly reduced to 350 m or 100 m (BS or UE) for the case of median coupling loss and a receiver antenna 20° out of beam with respect to the interference direction.
For alternate channel use (20 MHz distance between channels), the separation distance exhibits a values of approximately 2 km (BS interferer) or 500 m (UE interferer), but only 334 m for the case of relaxed constraints regarding MCL statistics and antenna directions for the BS interferer, and only 42 m for the UE interferer.

ECC REPORT 172 – Page 41
Table 31: MCL and corresponding Separation Distances d (95 % victim system reliability) for usage scenario 3 “Portable Video Link”, antenna directions aligned. LTE interferer
Interference scenario
Victim (videolink) bandwidth
Interfering system and bandwidth
LTE TDD BS LTE TDD UE
20 MHz 10 MHz 5 MHz 20 MHz 10 MHz 5 MHz
Co-channel
20 MHz MCL (dB) 173.1 173.1 173.1 167.8 167.8 167.8
d (km) 25.9 25.9 25.9 5.550 5.550 5.550
10 MHz MCL (dB) 173.1 176.1 176.1 167.8 170.8 170.8
d (km) 25.9 29.2 29.2 5.550 6.711 6.711
5 MHz MCL (dB) 173.1 176.1 179.1 167.8 170.8 173.8
d (km) 25.9 29.2 32.9 5.550 6.711 8.197
Adjacent
20 MHz MCL (dB) 130.6 130.6 130.6 137.8 137.8 137.8
d (km) 1.793 1.793 1.793 0.782 0.782 0.782
10 MHz MCL (dB) 129.6 131.5 131.5 138.9 140.8 140.8
d (km) 1.688 1.904 1.904 0.838 0.945 0.945
5 MHz MCL (dB) 131.1 133.0 134.5 140.5 142.8 143.8
d (km) 1.866 2.104 2.325 0.927 1.077 1.155
Alternate 20 / 10 / 5 MHz
MCL (dB) 132.5 131.1
d (km) 2.042 0.503
Table 32: Median MCL and corresponding Separation Distances d for usage scenario 3 “Portable Video Link”, receiver antenna facing 20° away. LTE interferer
Interference scenario
Victim (videolink) bandwidth
Interfering system and bandwidth
LTE TDD BS LTE TDD UE
20 MHz 10 MHz 5 MHz 20 MHz 10 MHz 5 MHz
Co-channel
20 MHz MCL (dB) 138.5 138.5 138.5 133.0 133.0 133.0
d (km) 3.014 3.014 3.014 0.567 0.567 0.567
10 MHz MCL (dB) 138.5 141.5 141.5 133.0 136.0 136.0
d (km) 3.014 3.682 3.682 0.567 0.693 0.693
5 MHz MCL (dB) 138.5 141.5 144.5 133.0 136.0 139.0
d (km) 3.014 3.682 4.452 0.567 0.693 0.846
Adjacent
20 MHz MCL (dB) 103.3 103.3 103.3 103.0 103.0 103.0
d (km) 0.302 0.302 0.302 0.080 0.080 0.080
10 MHz MCL (dB) 102.7 104.1 104.1 104.1 106.0 106.0
d (km) 0.290 0.318 0.318 0.086 0.098 0.098
5 MHz MCL (dB) 103.8 105.2 106.2 105.7 108.0 109.0
d (km) 0.311 0.344 0.365 0.096 0.111 0.118
Alternate 20 / 10 / 5 MHz
MCL (dB) 104.8 93.0
d (km) 0.334 0.042
5.1.6.2 Video link interfering with LTE TDD
Table 33: and Table 34: reflect the protection distances for scenario 3 if the video link transmitter represents the interferer to LTE TDD, for perfectly aligned antennas or a 20° off-axis video link transmit antenna. (Note that for scenarios 1 and 2, the video link transmit antenna is omnidirectional, so its alignment does not influence the results.)

ECC REPORT 172 – Page 42
In Table 33:, all antennas are perfectly aligned towards each other, and a 95% reliability for the victim system is assumed. Comparing the resulting separation distances with the other interference direction (Table 30:Table 31), it can be observed that as in the other two scenarios, the video link interferer requires lower distances than the LTE interferer case. In Table 34: significantly reduced separation distances for a relaxed set of requirements are observed.
Table 33: MCL and corresponding Separation Distances d (95 % victim system reliability) for usage scenario 3 “Portable Video Link”, antenna directions aligned. Video link interferer
Interference scenario
Victim (LTE)
bandwidth
Victim LTE TDD BS Victim LTE TDD UE
Interfering system bandwidth
20 MHz 10 MHz 5 MHz 20 MHz 10 MHz 5 MHz
Co-channel
20 MHz MCL (dB) 167.0 167.0 167.0 158.8 158.8 158.8
d (km) 13.1 13.1 13.1 2.300 2.300 2.300
10 MHz MCL (dB) 167.0 170.1 170.1 158.8 161.8 161.8
d (km) 13.1 16.0 16.0 2.300 2.810 2.810
5 MHz MCL (dB) 167.0 170.1 173.1 158.8 161.8 164.8
d (km) 13.1 16.0 19.6 2.200 2.810 3.398
Adjacent
20 MHz MCL (dB) 111.8 112.7 113.9 114.7 115.7 117.3
d (km) 0.358 0.376 0.408 0.128 0.137 0.152
10 MHz MCL (dB) 112.8 114.3 115.0 115.8 117.9 118.9
d (km) 0.380 0.420 0.437 0.138 0.158 0.169
5 MHz MCL (dB) 114.0 115.4 116.3 117.5 119.5 121.0 d (km) 0.412 0.451 0.479 0.155 0.176 0.195
Alternate 20 / 10 / 5 MHz
MCL (dB) 118.4 123.7 d (km) 0.551 0.233
Table 34: Median MCL and corresponding Separation Distances d for usage scenario 3 “Portable Video Link”, transmit antenna facing 20° away. Video link interferer
Interference scenario
Victim (LTE)
bandwidth
Victim LTE TDD BS Victim LTE TDD UE
Interfering system bandwidth
20 MHz 10 MHz 5 MHz 20 MHz 10 MHz 5 MHz
Co-channel
20 MHz MCL (dB) 150.6 150.6 150.6 139.5 139.5 139.5 d (km) 4.497 4.497 4.497 0.646 0.646 0.646
10 MHz MCL (dB) 150.6 153.6 153.6 139.5 142.5 142.5 d (km) 4.497 5.492 5.492 0.646 0.789 0.789
5 MHz MCL (dB) 150.6 153.6 156.7 139.5 142.5 145.5 d (km) 4.497 5.492 6.708 0.646 0.789 0.964
Adjacent
20 MHz MCL (dB) 57.3 63.3 67.3 69.7 71.0 72.6 d (km) 0.007 0.015 0.020 0.007 0.007 0.008
10 MHz MCL (dB) 63.6 69.0 72.3 71.1 73.2 74.2 d (km) 0.015 0.022 0.027 0.007 0.009 0.009
5 MHz MCL (dB) 67.9 74.3 80.0 72.7 74.9 76.5 d (km) 0.020 0.031 0.044 0.008 0.009 0.011
Alternate 20 / 10 / 5 MHz
MCL (dB) 88.2 80.7 d (km) 0.076 0.014

ECC REPORT 172 – Page 43
5.1.7 Conclusions
This study provides a worst-case analysis of constraints in terms of minimum coupling loss and separation distances for the coexistence between an LTE-TDD system as the interferer and a wireless video link system as the victim, and vice versa. It is assumed that apart from geographical separation, no interference management and operator coordination can be conducted. The results of the study do not apply to situations where operators could coordinate their activities or to situations where the actual propagation conditions can be taken into account. New studies are required for systems using advanced interference management mechanisms, for example system deployments taking into account acceptable transmit powers (micro base stations) for particular geographical areas, or based on cognitive technologies.
The results regarding scenario 1 “Cordless Camera Link” indicate that coexistence can be feasible in the adjacent and alternate channel case, since the required separation distance is moderate. If the receiver performance of wireless video links and the LTE transmitter performance exceed the requirement values in Table 6: and Table 13:, the observed separation distances can further be reduced to even smaller values. It has to be decided on a case-by-case basis if additional protection and sharing mechanisms have to be employed. In the co-channel case, dedicated protection and coexistence mechanisms would be required under worst case conditions.
In scenario 2 “Mobile Video Link”, such further protection and coexistence mechanisms are probably required except in the presence of a guard band of more than 20 MHz between the systems. For the case of video link as a victim, this is mainly due to the very low path loss propagation model under worst case conditions and large coverage of the receiver antenna mounted on a helicopter. This is certainly a special propagation case which calls for dedicated coordination measures. In the case of video link transmitters interfering into LTE receivers in this scenario, separation distances are significantly reduced.
The results for scenario 3 “Portable Video Link” indicate that coexistence based on geographical separation is feasible at least in the alternate channel (guard band) case if on a case-by-case basis, some additional protection measures are deployed. If certain separation corridors around the main lobe of the narrow-beam video link receive antenna could be employed, geographical separation could be feasible in the adjacent channel case as well, especially if the employed devices exceed the performance limits by a significant amount. In the co-channel case, additional dedicated protection and coexistence mechanisms would be probably be required due to significant necessary separation distances.
5.2 TELEMETRY
5.2.1 Aeronautical telemetry
The system is composed of ground stations and airborne stations. Telemetry signals are transmitted by airborne stations (e.g. aircraft, missile) to ground stations. Telecommand can be associated to telemetry systems; telecommand signals are transmitted by ground stations to airborne stations in another frequency band.
Aeronautical telemetry uses the band 2310-2400 MHz.
5.2.2 Terrestrial Telemetry
The system is composed of ground stations only. Telemetry signals are sent from a ground station to another ground station.
Terrestrial telemetry uses the band 2200-2400 MHz.
The scenarios involving terrestrial telemetry ground stations are assumed to be covered by the scenarios involving aeronautical telemetry ground stations. Therefore, there is no scenario per se in this study involving terrestrial telemetry.

ECC REPORT 172 – Page 44
5.2.3 Telemetry characteristics
This paragraph gives some information about aeronautical telemetry systems. Some of them have been extracted from the IRIG STANDARD 106 [30] some other characteristics are representative of French aeronautical telemetry systems.
Aeronautical telemetry and telecommand operations are used for flight testing of manned and unmanned aerospace vehicles. These systems contribute to the security tests. Vehicles are tested to their design limits, thus making safety of flight dependent on the reliability of information received on a real-time basis.
Table 35: TLM transmitter (airborne) and receiver (ground) parameters
Parameter Value (aeronautical telemetry in the
2300/2400MHz band
Airborne Transmission
Bandwidth (MHz) 1 to 40 Max output power (dBm) 2 to 40 Antenna gain (dB) 0 to 3 Max e.i.r.p. (dBm) 43 Antenna height (m) Varies between 0 to 20000
Ground Reception
Noise level (dBm/MHz) -110 (assumption) Feeder loss (dB) 1 Antenna Gain 28 to 45 dBi (tracking antenna) Antenna diagram See below (Figure 13:Antenna pattern used
for “ground” telemetry stations) Aperture (3 dB) 1 to 10 degrees Diameter 2 to 18 m Antenna height (receiver) 5 m to 30m (assumption for this study : 20m) Polarisation Left-hand circular, right-hand circular, as well
as linear Tracking band Azimuth +/- 180°, elevation from 0 to 90°
Pattern calculated using Recommendation ITU-R F.699 [31] are represented for 3 antennas (Ant-TLM_28, Ant-TLM_35 and Ant-TLM_48) in the Figure 13: below.

ECC REPORT 172 – Page 45
-20,0
-10,0
0,0
10,0
20,0
30,0
40,0
50,0
-180 -140 -100 -60 -20 20 60 100 140 180
MHz
dBAnt-TLM_28dB
Ant-TLM_35dB
Ant-TLM_48dB
Figure 13: Antenna pattern used for “ground” telemetry stations
5.2.4 Interferences from LTE to Telemetry
The relevant scenarios involve LTE as the interferer (both base stations and user equipment’s) with telemetry ground station as the victim see Figure 14:. As mentioned earlier, this study is restricted to scenarios involving telemetry ground stations (covering both the terrestrial and aeronautical telemetry).
Figure 14: Interference paths from BWS systems to telemetry ground stations
Calculations consist of evaluating the necessary attenuation or minimum coupling loss (MCL) to insure coexistence without any interference impact (i.e. fulfilling the interference criterion). MCL is calculated as follows:
MCL = [Pe + Ge – Pfe]LTE + [Gr –Pfr – IC]TLM - 10log(Be.LTE/Br.TLM) - ∆ Polarisation
where the main characteristics and assumptions are described below and also summarized in Tables 36 and 37:

ECC REPORT 172 – Page 46
[Pe]LTE : LTE output power o Co-channel: LTE BS, Pe = 46 dBm, [Table 6:] and LTE UE, Pe = 23 dBm, [Table 7:] o Adjacent channel:
LTE BS: ACLR = 45 dB [Table 2] For a 20 MHz and a 10 MHz channel bandwith: Pe_OOB = 46-45= 1 dBm
that means -12 dBm/MHz (for a 20 MHz LTE channel) and -9 dBm/Mhz (for a 10 MHz LTE channel)
For a 5 MHz channel bandwith: Pe_OOB 43-45= -2 dBm or -9 dBm/MHz LTE UE: ACLR=30 dB: Pe_OOB = 23-30= -7 dBm and spectrum emission limit gives -
13 dBm/MHz o Spurious : Pe_Spurious = - 30dBm/MHz, [Table 6:]
[ Ge ]LTE :Antenna gain o LTE BS: Ge= 17 dB o LTE UE: Ge= 0 dB
[Pfe]LTE : Feeder loss o LTE BS: Pfe = 3 dB o LTE UE: Pfe = 0 dB
[Gr]TLM: Two scenarios have been studied: o LTE main beam to TLM ground station main beam, various antennas are used for telemetry,
but only two maximum gain values (28 dBi and 45dBi) are used in this contribution o LTE main beam to TLM ground station side lobe, in that case assumption for Gr = -2dBi.
This corresponds to the side-lobe level for a maximum gain of 28 dBi, (for a maximum gain of 45 dBi, the back lobe level would have been of -10 dBi).
[IC]TLM : Using the interference criteria, I/N = -6 dB [33], TLM receiver sensitivity can be calculated as [IC]TLM = N-6. In this study, only Telemetry services with 4 and 10 MHz bandwidth have been considered which results in [IC]TLM-4 = -110dBm and [IC]TLM-10 = -106dBm, respectively.
10log (Be.LTE/Br.TLM): only used in the co-channel case. If Be.LTE is lower than Br.TLM, no bandwidth ratio is taken into account. Table below gives values of this factor
Table 36: Mitigation factor due to the difference of bandwidth (dB)
Be.LTE
Assumptions for TLM bandwidth
Br.TLM 5MHz 10MHz 20MHz 2 MHz 3.9 6.9 10 4 MHz 0.9 3.9 6.9 8 MHz 0 0.9 3.4 10 MHz 0 0 3 20 MHz 0 0 0
For the purpose of this study, only 4 and 10 MHz bandwidths have been considered for Telemetry.
Due to the various possibilities of bandwidth ratio, only three cases are performed in this contribution, 0 dB, 3dB and 6.9 dB that corresponds respectively to the following Be.LTE/Br.TLM couples: [5/10] [20/10] and [20/4], since min and max values are not the most often used. * ∆ Polarisation: considering that TLM polarisation can be circular or linear, no mitigation factor due to a difference of polarisation is taken into account.
When MCL is determined, separation distance can be calculated, using an appropriate propagation model (EPM73 and HATA):
EPM73: empirical propagation model (takes into account antenna heights). EPM 73 is outlined in ANNEX 4:
‘extended HATA’: takes into account antenna heights. All the calculations are performed for a co-frequency situation (2350 MHz) as well as the adjacent channel situation. Additionally, scenarios where only LTE spurious emissions are relevant have also been considered.

ECC REPORT 172 – Page 47
Table 37: and Table 38: illustrate the results for the different scenario performed in this study.
Table 37: Coexistence between LTE-BS and ground telemetry
LTE-BS TLM LTE-BS TLM MCL (dB) Separation distance
(km)
Scenario Interferer main beam directed towards:
Pe dBm
Ge dB Pfe dB Gr dB
PFr dB
IC dBm (10/4MHz)
Be/Br= 5/10 (0dB)
Be/Br= 20/10 (3dB)
Be/Br= 20/4 (7dB)
EPM73 extended Hata
Co-channel scenario
Victim main beam
46 (43) 17 3 28 1 -106/-110 190 190 190 81 150
46 (43) 17 3 45 1 -106/-110 207 207 207 175 270
Victim side lobes 46 (43) 17 3 -2 1 -106/-110 160 160 160 44 50
Adjacent-channel scenario
Victim main beam
-12 (-9) 17 3 28 1 -106/-110 148 145 145 31/28 13/11
-12 (-9) 17 3 45 1 -106/-110 165 162 162 50/46 60/55
Victim side lobes -12 (-9) 17 3 -2 1 -106/-110 118 115 115 4/3 1.8/1.5
Spurious scenario
Victim main beam
-30 17 3 28 1 -106/-110 127 127 127 11 3
-30 17 3 45 1 -106/-110 144 144 144 27 12
Victim side lobes -30 17 3 -2 1 -106/-110 97 97 97 0.4 0.5 In a co-channel coexistence configuration, coexistence between LTE-BS and ground telemetry leads to great separation distances in a main beam to main beam sharing case. Even if we consider a main beam to side lobe scenario, separation distances remain large.

ECC REPORT 172 – Page 48
Table 38: Coexistence between LTE-UE and ground telemetry
LTE-UE TLM LTE-UE TLM MCL (dB) Separation distance
(km)
Scenario Interferer main beam directed towards:
Pe dBm
Ge dB Pfe dB Gr dB
PFr dB
IC dBm (10/4MHz)
Be/Br= 5/10 (0dB)
Be/Br= 20/10 (3dB)
Be/Br= 20/4 (7dB)
EPM73 extended Hata
Co-channel scenario
Victim main beam
23 dBm 28 1 -106/-110 156 153 153 29 / 26 3,4 / 2,8
23 dBm 45 1 -106/-110 173 170 170 47 / 44 26 / 23
Victim side lobes 23 dBm -2 1 -106/-110 126 123 123 6 / 5 0.6 / 0.5
Adjacent-channel scenario
Victim main beam
-13 dBm/MHz 28 1 -106/-110 130 130 130 8 0,7
-13 dBm/MHz 45 1 -106/-110 147 147 147 21 2
Victim side lobes -13 dBm/MHz -2 1 -106/-110 100 100 100 0.5 0.1
Spurious scenario
Victim main beam
-30 dBm/MHz 28 1 -106/-110 113 113 113 2 0,2
-30 dBm/MHz 45 1 -106/-110 130 130 130 8,5 0,7
Victim side lobes -30 dBm/MHz -2 1 -106/-110 83 83 83 <0.1 <0.1 In a co-channel coexistence configuration, coexistence between LTE-UE and ground telemetry leads to separation distances up to 44km in a main beam to main beam sharing case. If we consider a main beam to side lobe scenario, separation distances decrease significantly. According to the assumptions, interference criteria and propagation model there may still be a need for a separation distance between the two systems.. It is noted that result correspond to an interference coming from only one LTE-user equipment. No cumulative effect of the UEs has been carried out but on the other hand, Pmax for UE was used.

ECC REPORT 172 – Page 49
Summary of coexistence between LTE and TLM systems (rounded-off values):
Table 39: Separation distance between TLM and LTE
LTE-TLM scenario
Main beam to LTE-BS TLM LTE-UE TLM
MCL Separation distance / EPM
MCL Separation distance / EPM
co-channel Main beam (45 dBi)
207 dB 170 km 173/170 dB 45 km
adjacent channel
165 dB 50 km 147 dB 21 km
spurious 144 dB 27 km 130 dB 8 km
co-channel Side lobe (-2 dBi)
160 dB 44 km 126/123 dB 6 km
adjacent channel
118 dB 4 km 100 dB 0.5 km
spurious 97 dB 0.7 km 83 dB 0.1 km H.BS-LTE= 37.5 m H.UE-LTE= 1.5 m H.TLM= 20 m
In a co-channel coexistence configuration, large separation distances are needed to avoid interference on telemetry system, even with LTE-UE.
In adjacent channel or spurious coexistence configuration, the “main beam to side lobe” configuration could fulfil cohabitation criteria, however the “main beam to main beam” doesn’t lead to coexistence without constraint.
Methods of improving co-existence between TLM and BWS can be listed below as various elements may have an impact on the results:
Down-tilt of the base station antenna power control for terminal mutual orientation of TLM and LTE antennas.’
5.2.5 Interferences from Telemetry to LTE
This study assesses the impact of airborne TLM to LTE base stations and terminals.
The relevant scenarios involve aeronautical telemetry transmitter as the interferer with LTE system (both base stations and user equipment) as the victim.

ECC REPORT 172 – Page 50
Figure 15: Interference paths from aeronautical telemetry transmitter to BWS BS
Using the same methodology as previous section, the minimum coupling loss (MCL) is calculated as follows
MCL = [Pe + Ge – Pfe]TLM + [Gr –Pfr – IC]LTE - 10log(Be.TLM/Br.LTE) - ∆ Polarisation where main characteristics and assumptions are described below and also summarized in Table 6: and Table 7::
[Pe]TLM : o Co channel: Pe = 40 dBm
o Adjacent channel: Pe = 40 - 35 dBc (assumption, based on Recommendation ITU-R SM.1541) – adjacent channels emissions falling in the receiving band of LTE (ACS/blocking of the LTE receiver not considered)
o Spurious : Pe = 40 - 53 dBc (43 +10log(P), based on Recommendation ITU-R SM.329) [ Ge]TLM : Ge = 3 dB [3] [Pfe]TLM: Pfe = 1 dB [Gr]LTE: For the worst case when the aircraft is in the main lobe of the LTE base station antenna
(Gmax in azimuth, Gmax -3 dB in elevation), in order to model the antenna tilt in LTE BS, a 3dB mitigation factor is taken into account in the link budget,. For other calculations, assumption on LTE BS antenna elevation diagram is based on Recommendation ITU-R F.1336 [11]
[IC]LTE : Using the interference criteria, I/N = -6 dB (reference: Recommendation ITU-R M.1459 [32]), LTE receiver sensitivity can be calculated as [IC]LTE = N-6.
10log (Be.TLM/Br.LTE): only used in the co-channel case. If Be.TLM is lower than Br.LTE, no bandwidth ratio is taken into account. Table 40: shows values of this factor:

ECC REPORT 172 – Page 51
Table 40: Mitigation factor due to the difference of bandwidth (dB)
Be.TLM
Br.LTE 2 MHz 4 MHz 8 MHz 10 MHz 20 MHz 5MHz 0 0 0 3 6 10MHz 0 0 0 0 3 20MHz 0 0 0 0 0
For the purpose of this study, only the yellow-highlighted cases have been considered.
* ∆ Polarisation: considering that TLM polarisation can be circular or linear, no mitigation factor due to a difference of polarisation is taken. When MCL is determined, a separation distance can be calculated, using an appropriate propagation model (free space, EPM73): free space: adapted to line of sight link budgets, EPM73: empirical propagation model (takes into account antenna heights: Hr_BS=37.5 m, Hr_UE=1.5
m). For He_TLM, calculations are performed for 2 values 300 m and 3000 m).
The calculations have been performed for a co-frequency situation (2350 MHz) as well as the adjacent channel situation.

ECC REPORT 172 – Page 52
Table 41: and Table 42: give results for the different scenario performed in this study.
Table 41: co channel basis, coexistence between ground telemetry and LTE BS
TLM LTE-BS TLM LTE-BS MCL (dB) Separation distance (km) Scenario Pe
dBm Ge dB
Pfe dB Gr dB PFr dB IC dBm (5/10/20MHz)
Be/Br= 4/5
Be/Br= 4/10
Be/Br= 10/20
Free space EPM7*
3000m 300m
Co-channel 38 3 1 17 -3 3 -108/-105/-102 159 156 153 >500 250 >500 Adjacent-channel 3 3 1 17 -3 3 -108/-105/-102 124 121 118 16/11/8 9/6/4 16/11/8 Spurious -15 3 1 17 -3 3 -108/-105/-102 106 103 100 2/1 1 1 On a co channel basis, coexistence between LTE-BS and aeronautical telemetry leads to high separation distances, when the aircraft is in the main lobe of the LTE receiving base station antenna.
Table 42: co channel basis, coexistence between ground telemetry and LTE UE
TLM LTE-UE TLM LTE-UE MCL (dB) Separation distance (km) Scenario Pe
dBm Ge dB
Pfe dB Gr dB PFr dB IC dBm (5/10/20MHz)
Be/Br= 4/5
Be/Br= 4/10
Be/Br= 10/20
Free space*
EPM73
3000m
Co-channel 38 3 1 0 0 -104/-101/-98 144 141 138 160 / 110/80
90 / /60/45
38
Adjacent-channel 3 3 1 0 0 -104/-101/-98 109 106 103 3 / 2 1.6/1 3 Spurious -15 3 1 0 0 -104/-101/-98 91 88 85 0,3 / 0,2 0.2 -15 On a co channel basis, coexistence between LTE-UE and aeronautical telemetry leads to separation distances up to 100 km. It should be noted that the free-space model may not be appropriate for terminals, depending on the environment. *the EPM 73 model takes into account the antenna heights of the transmitter and the receiver. The maximum height is 3000 m.

ECC REPORT 172 – Page 53
Summary of coexistence between LTE and TLM systems (rounded-off values), in a scenario where the aircraft is in the main lobe of the LTE receiving base station antenna:
Table 43: Separation distances between TLM and LTE
LTE-TLM scenario
TLM LTE-BS TLM LTE-UE
MCL Separation distance FREE SPACE
MCL Separation distance FREE
SPACE
co-channel 159 dB >500 km 144 dB 160 km
adjacent channel 124 dB 15 km 109 dB 3 km
spurious 106 dB 2 km 91 dB 0.3 km In a co-channel coexistence configuration, large separation distances are needed to avoid interference on LTE system.
In adjacent channel or spurious scenario, coexistence between LTE and TLM may be possible.
Further studies were performed only for base stations and for co-channel. The airborne TLM is not placed anymore in the main beam of the LTE receiving base station antenna. More precisely, the off-axis gain of the antenna in elevation is considered whereas the gain is maximum in azimuth. The minimum coupling loss (MCL) has been calculated for several altitudes of the airborne TLM:
Table 44: examples of separation distances between TLM and LTE
Scenario 1 2 3 4
TLM altitude 3000 m 5000 m 5000 m 5000 m Distance between TLM and LTE 50 km 20.1 km 11.2 km 7 km Visible horizon 140 km 176 km 176 km 176 km Radio horizon 251 km 316 km 316 km 316 km Angle above horizontal* 3,5° 14° 26,5° 45° Decoupling antenna loss (at angle +3°) -7.5 dB -18 dB -20 dB -23 dB Off-axis antenna gain 9,5 dBi -1 dBi -3 dBi -6 dBi Attenuation loss 134 dB 126 dB 121 dB 117 dB I calculated -87.5 dBm -90 dBm -87 dBm -86 dBm
Calculated value of I/N, using the assumptions described in this table (using free space)
LTE 5 MHz -102
14.5 dB 12 dB 15 dB 16 dB
LTE 10 MHz -99
11.5 dB 9 dB 12 dB 14 dB
LTE 20 MHz -96
8.5 dB 6 dB 9 dB 10 dB
MCL to satisfy I/N=-6 dB
LTE 5 MHz 154.5 dB 144 dB 142 dB 139 dB
LTE 10 MHz 151.5 dB 141 dB 139 dB 136 dB
LTE 20 MHz 148.5 dB 138 dB 136 dB 134 dB
Corresponding separation distance (free space)
LTE 5 MHz 540 km** 160 km 128 km 90 km
LTE 10 MHz 380 km** 114 km 90 km 64 km
LTE 20 MHz 270 km** 80 km 64 km 50 km * Angle between the horizontal and the axis “LTE base station – TLM airborne” ** Note that these distances far exceed the radio horizon Potential jamming zones are calculated in the vertical plane: result is given below; the 4 cases above are illustrated on the same figure.
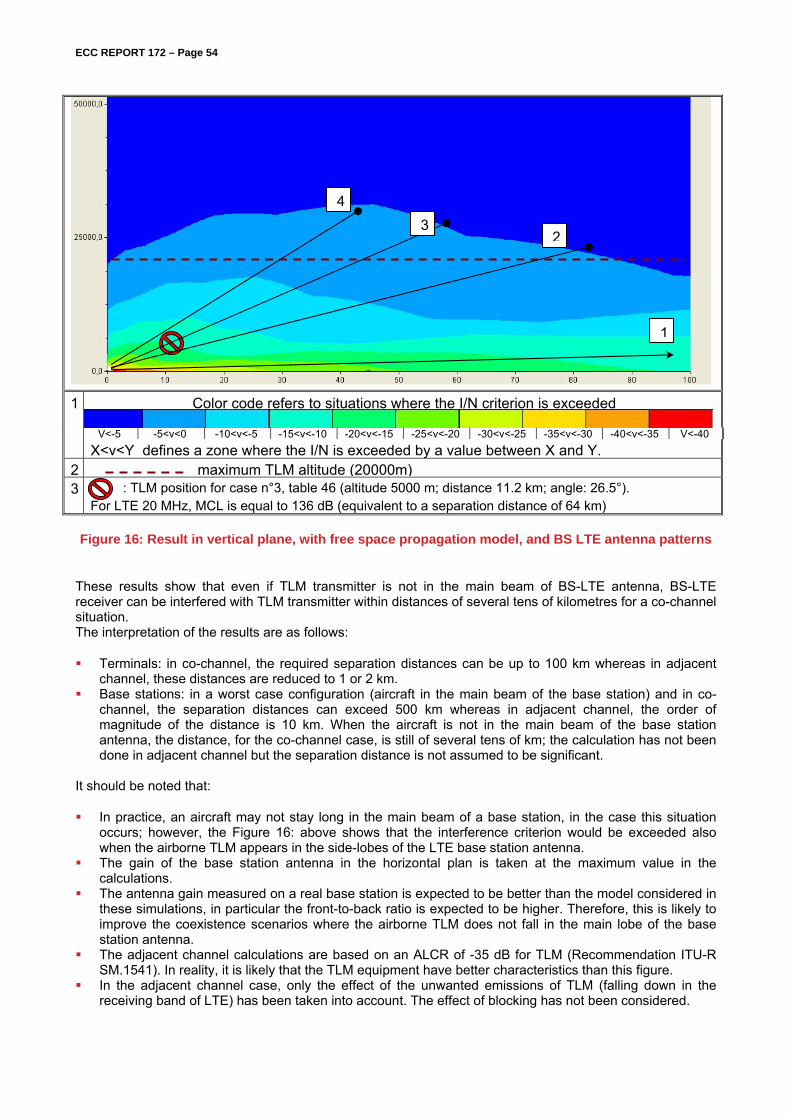
ECC REPORT 172 – Page 54
1 Color code refers to situations where the I/N criterion is exceeded
V<-5 -5<v<0 -10<v<-5 -15<v<-10 -20<v<-15 -25<v<-20 -30<v<-25 -35<v<-30 -40<v<-35 V<-40 X<v<Y defines a zone where the I/N is exceeded by a value between X and Y. 2 maximum TLM altitude (20000m)3 : TLM position for case n°3, table 46 (altitude 5000 m; distance 11.2 km; angle: 26.5°).
For LTE 20 MHz, MCL is equal to 136 dB (equivalent to a separation distance of 64 km)
Figure 16: Result in vertical plane, with free space propagation model, and BS LTE antenna patterns
These results show that even if TLM transmitter is not in the main beam of BS-LTE antenna, BS-LTE receiver can be interfered with TLM transmitter within distances of several tens of kilometres for a co-channel situation. The interpretation of the results are as follows:
Terminals: in co-channel, the required separation distances can be up to 100 km whereas in adjacent channel, these distances are reduced to 1 or 2 km.
Base stations: in a worst case configuration (aircraft in the main beam of the base station) and in co-channel, the separation distances can exceed 500 km whereas in adjacent channel, the order of magnitude of the distance is 10 km. When the aircraft is not in the main beam of the base station antenna, the distance, for the co-channel case, is still of several tens of km; the calculation has not been done in adjacent channel but the separation distance is not assumed to be significant.
It should be noted that:
In practice, an aircraft may not stay long in the main beam of a base station, in the case this situation occurs; however, the Figure 16: above shows that the interference criterion would be exceeded also when the airborne TLM appears in the side-lobes of the LTE base station antenna.
The gain of the base station antenna in the horizontal plan is taken at the maximum value in the calculations.
The antenna gain measured on a real base station is expected to be better than the model considered in these simulations, in particular the front-to-back ratio is expected to be higher. Therefore, this is likely to improve the coexistence scenarios where the airborne TLM does not fall in the main lobe of the base station antenna.
The adjacent channel calculations are based on an ALCR of -35 dB for TLM (Recommendation ITU-R SM.1541). In reality, it is likely that the TLM equipment have better characteristics than this figure.
In the adjacent channel case, only the effect of the unwanted emissions of TLM (falling down in the receiving band of LTE) has been taken into account. The effect of blocking has not been considered.
1
3
4
2

ECC REPORT 172 – Page 55
The level of interference on LTE depends on the bandwidth. A signal with a large bandwidth (e.g 20 MHz) is less sensitive to interference than a small bandwidth (e.g. 5 MHz).
5.2.6 Conclusions for Telemetry
This study provides a worst-case analysis regarding telemetry. The results of this deterministic study show that in a co-channel configuration, large separation distances are needed to avoid harmful interference on telemetry system from LTE (and vice versa).In adjacent channel, the separation distances decrease drastically so that the operation of TLM and LTE is possible. Some reasonable mitigation techniques may however be needed to ensure that no interference occurs when the airborne TLM is in the main lobe of the LTE base station antenna. In practice, depending on the trajectory of the aircraft, an airborne TLM might not stay in the LTE base station main beam for a long time.
5.3 UAS (UNMANNED AIRCRAFT SYSTEMS)
This section aims at studying the sharing between BWS and UAS (Unmanned Aeronautical Systems) in a co-frequency situation.
5.3.1 UAS characteristics
UAS is composed with one or several UAV (Unmanned Aircraft Vehicle) and a ground station (GS). UAS uses telecommand (uplink) and video links (downlink). Some UAS uses symmetrical link between UAV and ground station (same bandwidth for the uplink and for the downlink, same modulation, etc.).
Taking into account the various possible UAS/LTE configurations, and to simplify this contribution, only one example of an UAS is presented hereafter. This table gives relevant information about UAS.
Table 45: UAS parameters
Parameters Value Comments
Aircraft (UAV)
Bandwidth (MHz) 5 (1.5 to 20) One channel used at a time, which bandwidth
extends from 1.5 to 20 MHz)
Max output power (dBm) 23 to 40 An EIRP value of 38 dBm is used for the study
Antenna gain (dBi) 1 0 to 2 dB
Losses (dB) 0 to 1.5 An EIRP value of 38 dBm is used for the study
Max eirp (dBm) 38
Antenna height (m) 0 to 3000
Thermal noise (dBm) -90
Ground station (GS)
Bandwidth (MHz) 5
Max output power (dBm) 23
Antenna gain (dBi) 5 Some ground stations use more than one antenna
(directional and omni directional)
Max eirp (dBm) 40 25 to 41dBm
Antenna height (m) 2
Thermal noise (dBm) -90
5.3.2 Sharing configuration
The scenarios studied in this contribution are the following:
the first scenario involves UAS transmitters (aircraft or ground station) as the interferer and LTE system receivers (base station or user equipment) as the victims,

ECC REPORT 172 – Page 56
the second one involves LTE system transmitters as the interferers and UAS receivers as the victims.
The figure below illustrates the different interferer links between the two systems.
Figure 17: Different interferer links
This contribution includes the case of systems with only a data downlink (i.e. aircraft sensor or instrumentation pod), UAS using two separate frequency bands for up-link and down-link. This kind of equipment is used all over France and in international area, during military trials.
In this case the possible interferer links are presented on the following figure.
Figure 18: Interferer links

ECC REPORT 172 – Page 57
5.3.2.1 Methodology
First step of the study consists in calculating the necessary attenuation or minimum coupling loss (MCL) between UAS and LTE to insure coexistence without any interference.
Second step consists in evaluating separation distance if necessary between the two systems.
MCL calculations are based on the following equations
For the UAS as an interferer
MCL = [Pe + Ge – Pfe]UAS + [Gr –Pfr – IC]LTE - 10log(Be.UAS/Br.LTE) - ∆ Polarisation For the LTE as an interferer
MCL = [Pe + Ge – Pfe]LTE + [Gr –Pfr – IC]UAS - 10log(Be.LTE/Br.UAS) - ∆ Polarisation
The following characteristics and assumptions are used in the analysis:
[IC]: interference criteria used is a I/N = -6 dB. [Gr]LTE: Assumption on LTE BS antenna elevation diagram is based on ETSI EN302326. BS-LTE antenna tilt is 3 (cf. table 1). Considering that UAV transmitter altitude can move up to 3000 m, it is assumed that 3dB mitigation can be taken in the scenario involving the UAV aircraft segment (“BS-LTEUAV” cases).
Due to the various possible values of bandwidth ratio, only one case is performed in this contribution, which corresponds to the following Be.UAS/Br.LTE couples: [5/10].
o When UAS is the interferer, Be.UAS is lower than Br.LTE, so no bandwidth ratio is taken into account
o When LTE is the interferer, the bandwidth ratio is 10log (Be.LTE/Br.UAS) = 10log (10/5) = 3dB ∆ Polarisation: considering that UAS polarisation can be either circular or linear, no mitigation factor due
to a difference of polarisation is taken.
The protection distances for the interference-free operation of UAS or LTE receivers can be estimate from MCL using appropriate propagation model. Two propagation models are used
the free-space propagation model is well adapted for line of sight link budgets, calculated separation distance is limited to line of sight distance,
the empirical EPM73 propagation model takes into account the antenna heights and is well adapted for terrestrials systems.
All the calculations are performed for a co-frequency situation (2350 MHz).

ECC REPORT 172 – Page 58
5.3.3 Impact from UAS to LTE TDD
Table 46: and Table 47: present results where UAS GS act as interferer.
Table 46: interference calculation from UAS (ground and airborne) to LTE base stations
Scenario UAS
LTE-BS (H=37,5m) 10log(Be/Br) MCL Separation distance (km)
Radio electrical
line of sight dist.
UAS LTE-BS EIRP dBm
Gr dB
PFr dB
IC dBm
5MHz / 10MHz
Free space
EPM73
UAV transmitter 38 17 -3
3 -105 0 154 dB
>500 250 251
GS transmitter 40 17 3 -105 0 159
dB >500 33
31
Table 47: interference calculation from UAS (ground and airborne) to LTE user equipment
Scenario UAS
LTE-BS (H=1,5m) 10log(Be/Br) MCL Separation distance (km)
Radio electrical
line of sight dist.
UAS LTE-UE EIRP dBm
Gr dB
PFr dB
IC dBm
5MHz / 10MHz
Free space
EPM73
UAV transmitter 38 0 0 -101 0 139 dB
90 42 231
GS transmitter 40 0 0 -101 0 141 dB
114 13 11
5.3.3.1 Impact from LTE TDD to UAS
Table 48: and Table 49: present presents results where LTE TDD acts as interferer.
Table 48: interference calculation from LTE (base stations and user equipments) to UAS airborne stations
Scenario UAS
UAV (H=3000m) 10log(Be/Br) MCL Separation distance (km)
Radio electrical
line of sight dist.
LTE UAS-UAV
EIRP dBm
Gr dB
PFr dB
IC dBm
10MHz / 5MHz
Free space
EPM73
LTE-BS 46+17-3-3
1 0 -96 3 151 dB
360 202 251
LTE-UE 23 1 0 -96 3 116 dB
6 3 231

ECC REPORT 172 – Page 59
Table 49: interference calculation from LTE (base stations and user equipments) to UAS ground stations
Scenario UAS
GS (H=2m) 10log(Be/Br) MCL Separation distance (km)
Radio electrical
line of sight dist.
LTE UAS-GS
EIRP dBm
Gr dB
PFr dB
IC dBm
10MHz / 5MHz
Free space
EPM73
LTE-BS 46+17-3 5 0 -96 3 158 dB
>500 32 31
LTE-UE 23 5 0 -96 3 121 dB
11 4 11
When the line of sight distance is lower than calculated separation distance, this value is taken into account.
5.3.4 Conclusion for UAS
The results show that LTE and UAS cannot share spectrum on a co-channel basis. Frequency separation, geographical separation, time sharing or a combination of these mitigation methods help to ensure coexistence. It needs to be mentioned that constraints from LTE on UAS are almost the same as constraints from UAS on LTE.
5.4 BWS VERSUS BWS
5.4.1 BWS characteristics
The BWS systems which are considered in this section are LTE TDD. All characteristics in this section are based on ETSI TR 102 837 V1.1.1_1.1.2 reference [5].
5.4.2 BWS-UE to BWS-UE
It is assumed that adjacent channels are operating by two different operators.
The methodology for deriving of BEM out-of-block baseline level for UE is presented below.
UE to UE interference in the 2.6 GHz band is presented in ECC Report 131 [33]. A similar approach is taken during this analysis to calculate the out of band (OOB) emission levels.
The user density is estimated in the same way as the 2.6 GHz analysis as presented in ECC Report 131 [33]. It is assumed that the baseline level calculations for 2.6 GHz band are applicable to the baseline level calculations at 2.3 GHz band. The main difference between the two bands considered is the difference in propagation loss. Analysis shows that the OOB power level, POOB, is proportional to the square of the
operating frequency f, i.e. 2
OOB fP
For the 2.6 GHz band, two baseline levels were derived to limit terminal station desensitization below 3 dB for less than 5 % of the time:
a. In a network where the probability of collision between victim and interferer packets cannot be taken into account, a BEM baseline level of -27 dBm / 5 MHz can be justified. This is applicable to network provide circuit switch (CS) services.
b. In a network where probability of collision between victim and interferer packets can be taken into account, as it would be the case for two packet-based mobile broadband systems (or packet switch, PS network), a BEM baseline level of -15.5dBm /5 MHz can be justified.
However in the 2.3 GHz band only b) above needs to be taken into account.

ECC REPORT 172 – Page 60
From above results, baseline levels for 2.3 GHz band can be deduced as follows:
2600
2350log10 10OOB_2.6GHzGHz OOB_2,3 PP dB
45,0 OOB_2.6GHzGHz OOB_2,3 PP dB
Beyond these calculations derived from the 2.6 GHz band [34], it is suggested that the "correction factor" of 0,45 dB for transposing the 2.6 GHz results into 2.3 GHz is finally not taken into account. Such an approach does not compromise the coexistence performance (the percentage of cases where UE may suffer from interference is slightly the same). Moreover, it enables the reuse of RF components developed for 2.6 GHz TSs in the implementation of TSs for the 2 GHz band. Hence, the derivation of this level by applying the methodology used for the 2.6 GHz band resulting in -27 dBm / 5 MHz baseline.
From above analysis, it can be seen that TS to TS OOB baseline level for the 2.3 GHz band is the same as for the 2.6 GHz band. That is:
MHz5dBm/ 5.15 GHz OOB_2,3 P
5.4.3 BWS-BS to BWS-BS
Adjacent channels are operated by two different operators. BS to BS interference scenario include the Interference between two TDD blocks which takes into account that there is leakage from interferer into the victim block and there is an additional contribution to the interference due to victim receiver selectivity according to frequency offset with victim. Note that receiver selectivity is typically implicitly defined by ACS and blocking requirements found in e.g. 3GPP specifications.
Figure 19: Licensing situation for two adjacent frequency blocks
For a given spatial separation, BS-BS interference is most severe where transmission powers are high, where the respective antennas have high gains and are within line-of-sight of each other, and where radio propagation conditions approach those of free space. This is likely to be the case for wide-area (macro-cellular) base stations with high antenna placements, resulting in the worst-case geometry depicted in Figure 20:.

ECC REPORT 172 – Page 61
GTilt
GA GTilt
GPL PTx EIRPx
PRx GA
Separation distance 100 m
Figure 20: Base-to-base interference scenario
In accordance with the assumptions in [35], the BS BEM baseline level is computed for a line-of-sight base-to-base separation distance of 100 m, and for a 1 dB desensitisation of the victim BS.
For line-of-sight base station separations of less than 100 meters, some form of cooperation between the licensees may be required. This might involve a judicious choice of carrier frequencies and/or antenna orientations, or some other form of mitigation.
The calculations of maximal EIRP to avoid adjacent channel and co channel interference is performed as follow
The requirements that must be met in order to avoid the need for coordination at separations of 100 m (and beyond) can be considered with reference to the adjacent-channel interference ratio2 (ACIR).
dB99
)6102()17380360(
)(
INRPGGGGEIRP
PPACIR
NATiltPLTiltx
IRx
where RxP is the received adjacent-channel interferer power, IP is the “experienced” interference power at the
receiver, xEIRP = 60 dBm/(5 MHz) is the interfering base station’s in-block mean e.i.r.p.,
TiltG = -3 dB
represents loss due to antenna tilt at each of the transmitter and receiver, PLG = -80 dB is free-space mean
path gain3 for a separation of 100 meters at a nominal frequency of 2300 MHz, AG = 17 dBi is the receiver
antenna gain, NP = -102 dBm/(5 MHz) is the receiver noise floor4 (for a nominal receiver bandwidth of 5 MHz
and noise figure of 5 dB), and finally, INR
= -6 dB is the interference-to-noise ratio for a 1 dB receiver desensitization. Note that a 1 dB desensitization implies an experienced interference power of -108 dBm/(5 MHz).
The required ACIR of 99 dB can be achieved through various combinations of transmitter adjacent-channel leakage ratio (ACLR) and receiver adjacent-channel selectivity (ACS)5. Subject to the constraint that the interferer’s ACLR and the victim’s ACS be equal (i.e., that the burden of protection from interference is placed equally on the interferer and victim BSs), it follows that we require ACS = ACLR = 102 dB in order to realize an ACIR of 99 dB.
Given an interferer ACLR of 102 dB, the corresponding BS BEM baseline level, BLBS,P , may be computed as
MHz5/dBm4210260, ACLREIRPP xBLBL
2 The ACIR is defined as the ratio of the power of an adjacent-channel interferer as received at the victim, divided by the
interference power “experienced” by the victim receiver as a result of both transmitter and receiver imperfections. 3 Path loss is 20 log10(f) + 20 log10(d)-147.55 dB where d is separation in meters, and f is frequency in Hz. 4 Equal to kTB.NF, where k is Boltzmann’s constant, T is the ambient temperature, B is the noise-equivalent bandwidth, and NF is
the noise factor. 5 The ACLR of a signal is defined as the ratio of the signal’s power divided by the power of the signal when measured at the output
of a (nominally rectangular) receiver filter centred on an adjacent frequency channel. The ACS of a receiver is defined as the ratio of the receiver’s filter attenuation over its passband divided by the receiver’s filter attenuation over an adjacent frequency channel. It can be readily shown that ACIR1 = ACLR1+ ACS1.

ECC REPORT 172 – Page 62
where xEIRP is the base station in-block e.i.r.p.
To calculate the maximal EIRP in the block, the first step of the calculation is to derive the interference power limit in order to limit BS desensitization to 1 dB, based on a receiver noise floor of -102 dBm (including a receiver noise figure of 5 dB and based on a receiver bandwidth of 5 MHz). Interference power limit is
dBN
I dbiondesensitat
87,5110log10 10
)1(
10
The thermal noise floor (TNF) is
TNF = 10 Log10(kTB) + Noise Figure + 30 = -102 dBm The link budget below is performed under the assumption that two (adjacent) TDD blocks are licensed to different operators and a separation distance of 100 meters between base stations. The coupling loss (CL) is
CL=-free space loss-interferer antenna downtilt loss-victim antenna loss+victim antenna gain In this scenario the coupling loss becomes
CL= -80 - 3 - 3 + 17 = 69 dB
The interferer in-block e.i.r.p. thus becomes
EIRPinterferer = CL + ACS – (I/N) -TNF For the first adjacent channel the ACS is -40
EIRPinterferer 1st channel = 69 + 40 – 108 = 1 dBm For the second adjacent channel the ACS is -50
EIRPinterferer 2nd channel = 69 + 50 – 108 = 11 dBm From the above results the possible usage according to the current standard is depicted in blue in Figure 21:. For reference the BEM in the neighbouring 2.5 GHz band is depicted in red.

ECC REPORT 172 – Page 63
-10 -5 0 5-60
-40
-20
0
20
40
60
80
Frequency offset [MHz]
dBm
/5M
Hz
Figure 21: Block edge masks based on current standard, and mask from the 2.5 GHz band for reference
Figure 21: illustrates that mitigation techniques (including synchronization) are needed in order to operate two networks in adjacent bands. Examples of mitigation or other techniques to make deployment in adjacent bands possible (non exhaustive list)
Synchronization between frequency neighbouring licensees. This might not be possible in a service and/or technology neutral scenario
Extra filtering Base station placement Main lobe planning between frequency neighbouring licensees
5.4.4 Conclusions
It can be concluded that two BWS BSs, operating in close proximity and in adjacent frequency blocks, should be synchronized and coordinated in order to be able to use high power amplifiers and antennas. In case of non-synchronized systems the necessary frequency separation will be large or the output power will be very low.
5.5 AMATEUR SERVICE
The Amateur Service is globally harmonized allocated to the band proposed for BWS.
This section gives further details on the sharing between BWS and the AS in a co-frequency situation (2300-2400 MHz).

ECC REPORT 172 – Page 64
5.5.1 Typical characteristics of a station in the Amateur Service
Recommendation ITU-R M.1732 [40] provides characteristics of stations operating in the amateur service for use in sharing studies.
Table 50: Examples of Amateur Service characteristics in the band 2300–2400 MHz
Parameter
EME6
SSB Voice
FM Voice
Digital Voice and Multimedia6
Necessary bandwidth and class of emission (emission designator)
50H0A1A 50H0J2A
2K70J3E 11K0F3E 16K0F3E 20K0F3E
2K70G1D 6K00F7D 16K0D1D 150KF1W 10M5F7W
Transmitter Power7 (dBW) 17 – 31.7 3 – 31.7 3 – 31.7 1 - 10
Transmitter Feeder Loss (dB)
1 - 4 0 - 10 0 - 10
1 - 3
Transmitting antenna gain (dBi).
25 - 40 0 - 40 0 - 40
30
Typical e.i.r.p.(dBW) 38 - 70.7 33 – 71.7 33 – 71.7 28 - 39
Antenna polarisation
Horizontal, Vertical, LHCP RHCP
Horizontal, Vertical.
Horizontal, Vertical.
Horizontal, Vertical.
Receiver IF bandwidth (kHz)
0.4 2.7 9
15 2.7, 6, 16, 150, 10000
Receiver Noise Figure (dB) 1 1 – 7 (Typically 1 at 2300 MHz)
1 – 7 (Typically 1 at 2300 MHz)
2
5.5.2 Sharing scenarios
Two sharing scenarios can be distinguished:
The first scenario involves an amateur radio transmitter as the interferer and the LTE system receiver (base station or user equipment) as the victims,
The second one involves LTE system transmitters as the interferers and amateur radio receivers as the victims.
5.5.3 Methodology
The analysis is performed in two steps. The first step exists of the calculation of the necessary attenuation for minimum coupling loss (MCL) between the amateur station and LTE to assure coexistence without any harmful interference.
The second step is a determination of the minimum separation distance between the two systems.
MCL calculations are based on the following equations.
For the station in the AS as an interferer:
6 In Recommendation ITU-R M.1732 [40] the specific 2300 - 2400 MHz band is not included for all modes
of operation. In these cases the next lowest frequency range with data is the 1240 - 1300 MHz band. These figures can be considered representative for the 2300 MHz band.
7 Maximum powers are determined by individual administrations.

ECC REPORT 172 – Page 65
MCL = [Pe + Ge – Pfe]AS + [Gr –Pfr – IC]LTE – 10log(Be.AS/Br.LTE) - ∆ Pol.
For the LTE transmitter as an interferer:
MCL = [Pe + Ge – Pfe]LTE + [Gr –Pfr – IC]AS – 10log(Be.LTE/Br.AS) - ∆ Pol.
Where:
IC is based on the thermal noise and an interference criterion I/N = -6 dB for LTE and I/N = -10 dB for the AS.
Due to the various possible values of bandwidth ratio, only a 10 MHz LTE bandwidth is used, which corresponds to a worst case Be.AS/Br.LTE ratio of 4x10⁻⁵
When the AS is the interferer, Be.AS is lower than Br.LTE, so no bandwidth ratio is taken into account. When LTE is the interferer, the worst case bandwidth ratio is 10log(Be.LTE/Br.AS) = 10log (107/400) = 44 dB
∆ Pol. = polarisation factor. Assuming that the polarisation of the amateur station can be either circular or linear, no mitigation factor due to a difference in polarisation is considered.
All calculations have been performed for a co-frequency situation with an antenna height of the amateur station of 25 metres
Table 51: Table 52: and Table 53: give results for each scenario performed in this study.
Table 51: interference calculation from AS to LTE base stations
Scenario AS LTE-BS (H=37,5m) 10log(Be/Br) MCL
AS LTE-BS EIRP [dBm] Gr [dB] Pfr [dB] IC [dBm] 15kHz/10MHz
AS transmitter 63* 17 3 -105 0 182 dB
Table 52: interference calculation from AS to LTE UE
Scenario AS LTE-UE (H=1,5m) 10log(Be/Br) MCL
AS LTE UE EIRP [dBm] Gr [dB] Pfr [dB] IC [dBm] 15kHz/10MHz
AS transmitter 63* 0 0 -101 0 164 dB * The above calculations, provided in the Tables 51 and 52, refer to a best case scenario (lowest mentioned radiated power from the amateur station has been used).
Table 53: interference calculation from LTE (BS and UE) to AS
Scenario LTE AS (H=25m) 10log(Be/Br) MCL
LTE AS EIRP [dBm] Gr [dB] Pfr [dB] IC [dBm] 10MHz/15kHz
LTE-BS transmitter 46+17-3 33 5 -141 28 201 dB LTE-UE transmitter 23 33 5 -141 28 164 dB
5.5.4 Conclusions
In co-channel case where the antenna main lobes are pointing at each other, the required MCL between LTE and stations in the Amateur Service can be significant. Various mitigation techniques can be used to protect both BWS and Amateur service.
Constraints from LTE on the AS are almost the same as constraints from the AS on LTE. It should be noted that the Amateur Service is a secondary user of the band (see Table 1:).

ECC REPORT 172 – Page 66
6 SHARING SCENARIOS ABOVE 2400 MHZ
6.1 BLUETOOTH
6.1.1 Bluetooth characteristics
The following characteristics are taken from [18]. The Bluetooth system operates in the 2.4 GHz ISM band. This frequency band is 2400 - 2483.5 MHz. RF channels are spaced 1 MHz and are ordered in channel number k according to f_carrier=2402+k MHz, k=0,…,78. Bluetooth devices are classified into three power classes based on the modulation mode with the highest output power.
Table 54: Bluetooth characteristics
Parameter Value
Bandwidth (MHz) 1
Band (MHz) 2400 - 2483.5 MHz,
f_carrier=2402+k MHz, k=0,…,78.
Max BS output power (dBm)le (style: Arial 10pt bold white)
Power class 1 20
Power class 2 4
Power class 3 0
Antenna Gain (dBi) 0
Receiver sensitivity (dBm) -70 dBm or lower
In-device8 coexistence properties between LTE TDD and Bluetooth are studied. Already today, most smart phones and laptops support Bluetooth and it is expected to be the case also in devices with LTE TDD, and it is important to study these coexistence characteristics within the terminal device.
The interferer transmitter and victim receiver chains within the terminal device are outlined in Figure 22:. The studies will play LTE TDD and Bluetooth in the roles of either victim or interferer. It is assumed that there is a 15 dB antenna coupling loss between the Bluetooth transmitter antenna and a separate LTE TDD receiver antenna.
8 In-device is understood as multiple systems incorporated in the UE.

ECC REPORT 172 – Page 67
Victim band filter
Channel filter
Interferer band filter
Channel filter
15 dB antenna coupling loss
Device
LNA Output amplifier
Figure 22: Outline of in-device interferer and victim filter/amplifier structures
The frequency band situation we are studying is depicted in Figure 23: There is an interferer transmitter band filter with imperfect attenuation outside the transmitter band, and there is a victim receiver band filter with imperfect receiver characteristics outside the receiver band. The LTE TDD and Bluetooth carriers operate in their designated band. The respective distance to the band edge in common is an important factor.
2400 MHz border
2300-2400 Mhz band 2400-2485 Mhz band
LTE-TDD carrier Bluetooth carrier
Figure 23: Outline of studied interferer and victim band filter characteristics
6.1.2 Impact of Bluetooth to LTE TDD
First it is assumed that an in-device Bluetooth interferes with LTE TDD. One possible issue of the 2300-2400 MHz band is the risk of saturation of the receiver LNA blocking LTE TDD channels due to transmission in the lower end of the band 2400-2483 MHz, e.g. in 2400-2420 MHz.

ECC REPORT 172 – Page 68
Saturation will occur if the ISM signal present at the LTE TDD LNA input is in the neighbourhood or exceeding the compression point9 of the input LNA(s). It is assumed that the 1 dB compression point is in the range of -25 to -15 dBm given a reasonable performance.
If a Bluetooth transmission at 10 dBm10 in 2400-2420 MHz is assumed, the input signal at the LNA would be -5 dBm given the assumed antenna coupling loss. If not further attenuated, then a LTE TDD received signal received simultaneously on any channel in the full 2300-2400 MHz band would be blocked due to saturation of the input LNA. The LTE TDD receiver filter must suppress the ISM signal by some 20 dB in this example.
To get an idea of the filter rejection of a high-volume SAW filter we turn to Figure 24: that shows a typical filter response for a product in use in the ISM band 2400-2483 MHz. A LTE TDD 2300-2400 MHz receiver band filter with a 100 MHz pass-band band would still have a similar response but shifted downwards in frequency. Looking the upper edge of the filter response, it is evident that we need about a 20 MHz frequency separation to achieve the required suppression of the lowest ISM channels with up to 40 dB.
Figure 24: Example SAW filter response for the ISM band. The receiver (full or truncated) band filter for LTE TDD is similar but is shifted down in frequency and the band widths differ slightly
Example SAW filter response for the ISM band. The receiver (full or truncated) band filter for LTE TDD is similar but is shifted down in frequency and the band widths differ slightly. If we are using a 2300-2400 MHz band receiver filter sufficient rejection can be satisfied for Bluetooth operating in 2420-2483 MHz. In the case of Bluetooth operating in 2400-2420 MHz, the Bluetooth signal cannot be sufficiently rejected.
One practical and standardized solution that is fully under the control of the terminal device is to use the Bluetooth feature of adaptive frequency hopping (AFH) where the used frequencies can be restricted to those sufficiently far away from the band edge (above 2420 MHz) so as not to cause any problems.
Another solution is to use a truncated LTE TDD band filter. As an example, a SAW filter truncated to 2300-2380 MHz could achieve the 40 dB rejection across the whole ISM band but as is evident from Figure 24:, to the price of about 20 MHz frequency separation to get sufficient roll-off. Other filter technologies might lead to smaller frequency distances.
A LTE TDD signal received at low level may also be blocked by a Bluetooth transmission. The LTE TDD in-band block requirement [21] apply up to 15 MHz from the operating-band edges and is thus applicable in this situation up to 2415 MHz. The LTE TDD receiver must be able to withstand (≤5 MHz) blockers of -56 dBm
9At high power input levels, the amplifiers’ (preferably constant) gain will drop compared to its’ gain for low power signals – the amplifier
gets saturated. The 1 dB compression point specifies the power level where the amplifier gain is 1 dB smaller than its’ value for low power signal value.
10 Representing e.g. communication with a wireless head set

ECC REPORT 172 – Page 69
with a 5 MHz frequency separation to the wanted signal11, and -44 dBm with a 10 MHz frequency separation. These tolerated interference values could possibly be slightly better in implementations, but are still much lower than the interfering signal that has a power of in the order of -5 dBm with a 10 dBm Bluetooth transmission.
An ISM band filter with a response according to Figure 24: would accomplish about 40 dB attenuation to LTE TDD carriers beyond 20 MHz outside the ISM band. The situation would be alleviated if the LTE TDD operation can be moved to a carrier further away from the band edge, or if Bluetooth uses adaptive frequency hopping. Also in this situation, AFH or using a truncated band filter with a e.g. 20 MHz frequency separation to the ISM band for roll-off, a Bluetooth blocking signal would be manageable for a wanted signal in the upper LTE TDD channel.
6.1.3 Impact of LTE TDD to Bluetooth
Bluetooth will continue to be an integrated part of many terminal devices and from a user perspective it is also important that these services are not interfered by LTE TDD signals emanating from the same device. The Bluetooth standard [18] specifies a receiver sensitivity of -70 dBm, but state-of-the-art receivers have a receiver sensitivity of about -90 dBm, e.g., in (19), it is specified to be -93 dBm. Thus, a state-of-the-art receiver tolerates in the order of 23 dB desensitization.
In Figure 4 in [21], Noise Floor Degradation (y-axis) is specified as a function of interference level (x-axis) at the Bluetooth receiver LNA (after the receiver band filter). The figure shows that below an interference level of -30 dBm (below the compression point) there is no degradation. With a tolerated 23 dB degradation (y-axis), the tolerated LNA input interference level is about 0 dBm.
Assuming full band operation at the upper channel, 15 dBm LTE TDD output power and a 15 dB antenna coupling loss between the LTE transmitter branch and the WLAN/Bluetooth input, the power at the WLAN or Bluetooth input will be 0 dBm, and hence will constitute acceptable interference.
Hence, when LTE TDD operates below 15 dBm in the uppermost full band channel, the interference desensitizes the Bluetooth communication, but still it works according to specifications. 12
6.1.4 Conclusions
Simultaneous operation of LTE TDD and Bluetooth within a device is expected to be likely. In certain worst case scenarios when Bluetooth is operating close to the 2400 MHz band edge there can be interference issues.
Fortunately in this situation the device has full control over the choice of Bluetooth channels and may allocate them such that frequency usage close to the 2400 MHz edge is avoided by means of adaptive frequency hopping.
This will greatly alleviate any issues in the direction of interference from Bluetooth to a full band upper-channel LTE TDD, since the ISM band filter has ample margin to suppress the Bluetooth signal.
Interference in the other direction, from full band upper-channel LTE TDD to Bluetooth could be an issue without power restrictions in that LTE TDD channel. A regulatory solution could be to employ restrictions in that channel.
6.2 WLAN
This section studies compatibility between LTE TDD and WLAN in the adjacent bands.
11 The wanted signal is assumed to be received at a level 6 dB higher than the receiver sensitivity level 12 In addition, there is some more margin, since the Bluetooth receiver band filter will reject some fraction of the interference signal
power since it is likely quite wide (5-20 MHz) and the filter will have room to partially roll off within that band width.

ECC REPORT 172 – Page 70
6.2.1 WLAN characteristics
Technical parameters of the WLAN 802.11n AP [39] used for the study are summarized in Table 55: and WLAN channels are shown in Figure 25:.
Table 55: Parameters of WLAN 802.11n AP system operating in the band 2400-2483.5 MHz
LTE TDD interferer Victim system
Band 2400-2483.5 MHz WLAN 802.11n AP Receiver bandwidth, kHz 16250 Receiver noise figure (NF), dB 10 Receiver antenna height, m 10 or 1.5 Receiver antenna gain, dBi 2 Center frequency, MHz 2412, 2432 Receiver thermal noise (No), dBm -102.07 Noise floor (N) =No + NF -92.07 I/N objective, dB 0
Figure 25: Non-Overlapping Channels for 2.4 GHz WLAN
6.2.2 Impact of LTE TDD BS to WLAN AP
In this part, we study the impact of wide area BS LTE network on WLAN AP receiver using SEAMCAT.
In SEAMCAT, we have created a two ring LTE BS with Cell Range of 1 km and the WLAN victim has randomly placed within 2 km from the centre LTE Cell. This in turn results in a statistical evaluation. The performance metric is the interference probability which is defined as the probability that interference is larger than the noise for I/N=0.
The simulations were performed for two LTE TDD bandwidths (i.e. 20MHz and 10MHz) and the two first WLAN channels namely channel 1 and channel 5 with centre frequencies at 2412 MHz and 2432 MHz respectively. The LTE TDD frequencies considered are given in Table 56:.
Table 56: Frequency considered for two bandwidths (20 and 10 MHz) and for different guard bands (0, 10 MHz)
Guard band (MHz) Frequency bandwith
20 MHz 10 MHz
0 2390 2395 10 2380 2385
We have considered two scenarios as follows:
Both LTE BS and WLAN AP are located outdoor which corresponds to worst case scenario LTE BS is outdoor and WLAN AP is indoor where wall penetration loss should be considered

ECC REPORT 172 – Page 71
20 MHz LTE Bandwidth
The simulation is performed for two LTE BS antenna heights namely 37.5 and 20m and two WLAN AP antenna heights of 10 and 1.5m. The results are presented in Table 57:.
Table 57: Simulation results for LTE BS with 20MHz bandwidth
LTE Antenna Height [m]
LTE EIRP [dBm]
WLAN AP Location
WLAN AP Antenna height [m]
Frequency Offset [MHz]
Interference Probability
WLAN Channel 1
InterferenceProbability
WLAN Channel 5
37.5 60 Outdoor 10 0 82% 16% 37.5 60 Outdoor 10 10 82% 9% 37.5 60 Outdoor* 10 0 81% 0% 37.5 60 Indoor 10 0 32% 4.9% 37.5 60 Indoor* 10 0 32% 0% 37.5 60 Indoor 10 10 32% 2.5% 37.5 60 Indoor 1.5 0 0.9% 0.1% 37.5 60 Indoor 1.5 10 0.9% 0.05 20 38 Outdoor 10 0 4.2% 0% 20 38 Outdoor 10 10 4.2% 0% 20 38 Indoor 10 0 1.2% 0% 20 38 Indoor 1.5 0 0.01% 0%
20 38 Indoor 1.5 10 0.01% 0% *10 dB reduction in spurious emission
As the results show, it is noticeable that for lower WLAN antenna height (1.5m) the two networks can coexist without problem with an interference probability lower than 1%. The outdoor placed WLAN systems at 10 m height (worst case) will have very high interference probability. A frequency offset of 10 MHz of the LTE system will not reduces the interference probability if the operating band edge remains at 2400 MHz. However using WLAN channel 5 instead of channel 1 would significantly reduce the interference probability due to that the victim now only experience spurious emission levels from the LTE systems. And with a 10 dB reduction of the spurious emission there is no harmful interference from LTE towards WLAN system. It should be emphasized that in the real world the products always have much lower spurious level than -30dBm specified by 3GPP. So, 10 dB reductions in spurious level is a realistic approach. This indicates that using WLAN channel 1 causes problem for coexistence of the two systems. So with some coordination a solution would be that WLAN uses another channel in ISM band instead of channel 1 when LTE TDD is using the upper 20 MHz of band 2.3 – 2.4 GHz.
10 MHz LTE Bandwidth
The simulation results are presented in Table 58:. The results illustrate the same behavior as for 20 MHz case. No mitigation method is needed for low WLAN antenna height. For other cases using channel 5 instead of channel 1 can realize the coexistence of the two networks.

ECC REPORT 172 – Page 72
Table 58: Simulation results for LTE BS with 10 MHz bandwidth
LTE Antenna Height [m]
LTE EIRP [dBm]
WLAN AP Location
WLAN APAntenna height
[m]
Frequency Offset [MHz]
Interference Probability
WLAN Channel 1
InterferenceProbability
WLAN Channel 5
37.5 60 Outdoor 10 0 95% 16% 37.5 60 Outdoor 10 10 62% 13% 37.5 60 Outdoor * 10 10 60% 0% 37.5 60 Indoor 10 0 46% 4.8% 37.5 60 Indoor* 10 0 46% 0% 37.5 60 Indoor 10 10 23% 3.6% 37.5 60 Indoor 1.5 0 1.5% 0.1% 37.5 60 Indoor 1.5 10 0.5% 0% 20 38 Outdoor 10 0 6.3% 0% 20 38 Outdoor 10 10 2.7% 0% 20 38 Indoor 10 0 1.6% 0% 20 38 Indoor 1.5 0 0.01% 0% 20 38 Indoor 1.5 10 0% 0%
*10 dB reduction in spurious emission
Comparison of the results for 20 and 10 MHz LTE bandwidth shows higher interference probability for 10 MHz bandwidth case. This is due to the fact that the same total power is used for 10 and 20 MHz LTE channels which will result in the 20 MHz channel have a lower power/MHz and in turn lower OOB level compared to a 10 MHz channel measured over victim receiver bandwidth. The spurious domain starts at same frequency for the two bandwidths. Thus a 20 MHz channel will cause less interference if measured over same victim bandwidth.
6.2.3 Impact of Home WLAN AP on LTE TDD system
In this section, we investigate the interference from WLAN AP to LTE TDD Pico cell. The same method as previous section has been used with the difference that the WLAN AP is randomly placed with minimum distance interval of 0-3 m, shown in Figure 26: and both systems are placed indoor. The performance metric is the bit rate degradation in the LTE system.
The simulation parameters and settings are presented in Table 59:
Table 59: SEAMCAT simulation settings
Interferer – parameter (unit) Value
frequency (MHz) 2412, 2432
frequency bandwidth (MHz) 16.25
WLAN AP EIRP (dBm) 20
WLAN transmitter mask See figure 5
WLAN AP height (m) 1.5
WLAN UE height (m) 1.5
WLAN cell radius (m) 10
WLAN interferer OFDMA/DL
WLAN antenna Omni directional with 0 dBi antenna gain
Victim – parameter (unit) Value
frequency (MHz) 2395 , 2390

ECC REPORT 172 – Page 73
Interferer – parameter (unit) Value
frequency bandwidth (MHz) 10 , 20
Max allowed transmit power of mobile (dBm) 24
LTE BS height (m) 1.5
LTE UE height (m) 1.5
LTE Cell radius (m) 1.5
LTE Cell victim OFDMA/UL
LTE antenna Omni directional with 0 dBi antenna gain
Pico BS ACS for first adjacent channel (dB) 46
Pico BS ACS for second adjacent channel (dB)
54
Propagation Model – parameter (unit) Value
IT-VR path , IT-WR path, WT-VR path Free space
Victim receiver->Interfering transmitter Path Delta X (m)
Random between 0-3
Figure 26: Locations of the victim and interfering networks
Numerical results are presented in the Table 60:
Table 60: Impact of a WLAN AP on LTE system
LTE Bandwidth [MHz]
Frequency Offset [MHz]
Average bit rate
Average bit rate Degradation[%]
WLAN Channel 1
Average bit rate Degradation[%]
WLAN Channel 5
20 0 7 0.1
20 10 1 0.0
10 0 18 0.4
10 10 2 0.0
Comparison of the results for 20 and 10 MHz LTE bandwidth shows higher average bit rate degradation for 10 MHz bandwidth case. This is due to WLAN unwanted emission mask which is shown in Figure 27: These results also show that using WLAN channel 5 will allow the coexistence of the two systems.

ECC REPORT 172 – Page 74
Figure 27: WLAN transmitter mask [39]
6.2.4 Conclusions
The results for the impact of macro LTE TDD BS on WLAN show that coexistence is feasible for indoor WLAN systems at antenna height of 1.5 m with an interference probability smaller than 1%. The outdoor placed WLAN systems at 10 m height (worst case) will have very high interference probability. For the indoor case, WLAN AP interfering the Pico LTE TDD BS, there is a degradation in average bit rate. The results clearly show that increasing the offset frequency of LTE TDD decreases the bit rate degradation significantly. In all scenarios it is shown that using WLAN channel 5 instead of channel 1 will improve the situation significantly so that the coexistence between LTE TDD and WLAN would be feasible without mutual harmful interference.

ECC REPORT 172 – Page 75
7 APPROACHES FOR ASSISTING BORDER COORDINATION
The procedure for coordinating two BWS networks (operating in TDD mode) deployed in neighbouring countries in the band 2300-2400 MHz is depicted in this chapter.
Figure 28: An example of need for border coordination
In a normal deployment scenario, three sectors per site would be used to cover an area including the border front as well. The emission from an operator in country 1 may cause interference to users located in country 2, as shown in Figure 29:. To avoid any performance degradation, a coordination is needed between the two operators.
Country 1 Country 2Country 1 Country 2
Figure 29: Interference from an operator in country 1 to another operator in country 2
As shown in Figure 29: above, the network in country 1 may interfere the network in country 2. The interference level from the operator in country 1 to the operator in country 2 depends on the frequency utilization of the band at the border.
Let us consider the situation at the border between two countries where 10 MHz blocks have been have licensed in the band 2300-2400 MHz. It is assumed that operator A in country 1 and operator B in country 2 are licensed to operate a few blocks of 10 MHz. Depending on the spectrum allocation of the blocks on either side of border, two different deployment scenario are of interest.

ECC REPORT 172 – Page 76
Operator A is authorized in blocks 1, 2 and 3. At the same time operator B owns at least one of the mentioned blocks, see Figure 30:
Operator A is authorized in block 1 and operator B owns block 3, see Figure 31:
In the first case, operator A operates in a frequency allocation that totally or partly overlaps operator B in the other country, see Figure 30:.
In the second case there is a guard band between frequencies used by operator A and B, see Figure 31:.
Figure 30: An example of spectrum allocation with overlap within the 2300-2400 MHz band as explained in scenario 1
Figure 31: An example of spectrum allocation with a guard band between operators in different countries within the 2300-2400 MHz band, as explained in scenario 2
In general, there are two cases of border coordination that neighbouring countries need to consider:
Co-channel coexistence (the same block is used on either side of border) Adjacent channel coexistence (adjacent channels are used in either side of border)
The interference from operator A to operator B as mentioned above is independent of the access technology, this is why coordination between operators is needed. Coordination between operators utilizing the frequency blocks simplifies coexistence scenarios across the border.
Synchronization is the key factor for both operators in order to operate the network without interfering with each other. In case synchronization is not possible, then there are mitigation techniques available. There are of course pros and cons in each case.
Examples of mitigation techniques:

ECC REPORT 172 – Page 77
Frequency planning o Consider a frequency guard band between blocks that are used in either country, see Figure
31:. In this case, keep the coverage on the cost of capacity Extra filtering, valid for the adjacent channel case Site engineering Output power planning
o Coverage limitation in some cases
8 CONCLUSIONS
The scope of this Report is to provide compatibility studies with respect to the potential use of the band 2300-2400 MHz by broadband wireless systems (BWS). These studies encompass:
Sharing scenarios within the band 2300-2400 MHz between BWS on the one hand and, on the other hand, other services/systems but also BWS
Adjacent band scenarios between BWS operating in the band 2300-2400 MHz and other services/systems operating either below 2300 MHz or above 2400 MHz.
This Report also investigates measures relating to cross-border coordination in case two countries deploy BWS in the band 2300-2400 MHz.
The two BWS systems under consideration are LTE and Mobile WiMAX, both operating in the TDD duplex mode. Some of the assumed technical and operational parameters used in the studies are based on applicable standards or regulatory texts which represent the minimum performance requirement specifications of the BWS systems.
Coexistence has been studied under the assumption that apart from geographical separation and in some cases frequency offset, no interference management and operator coordination is conducted. The study was in most cases performed assuming worst case scenarios. Minimum performance requirement of the BWS systems were used in different scenarios, while the BWS product has a better performance in practice.
The simultaneous operation in a co-channel and co-location configuration of BWS and systems other than Telemetry systems / UAV is feasible with manageable constraints.
According to the MCL based studies, simultaneous operation of the BWS in a co-channel configuration with Telemetry Systems / UAV is feasible only with large separation distances. These separation distances are not feasible in situations where BWS and Telemetry systems/UAV are co-located. Additionally co-channel operation may be facilitated if simultaneous operation of BWS and telemetry / UAV can be avoided.
The adjacent band compatibility studies conclude that potential interference issues can be handled provided that appropriate mitigation techniques (e.g. frequency separation, separation distance, additional filtering, site engineering) are applied to protect existing services and systems.
8.1 ADJACENT BAND COMPATIBILITY SCENARIOS BELOW 2300 MHZ
The coexistence between a LTE TDD macro base station and an earth station satellite receiver (for both Earth Exploration Satellite Service and Space Research Service) at the 2290 MHz boundary has been investigated. The results indicate a feasible implementation of BWS with a geographical separation distance of 3-7 km. Furthermore, since the number of earth stations is limited and their location is known in many countries, and that LTE TDD base stations have better characteristics in reality than those taken into account in the studies (better spurious emission performance than those contained in the specifications, site engineering techniques and/or power restrictions), the adjacent band compatibility between LTE-TDD operating within the band 2300-2400 MHz and space services operating below 2290 MHz is not expected to create difficulty.

ECC REPORT 172 – Page 78
From the study between LTE TDD macro base stations operating in the 2300-2400 MHz band and a Deep Space service operating in the 2290-2300 MHz band it can be concluded that a Deep Space earth station receiver installed close to a LTE TDD base station might require solutions including:
Frequency separation Additional filtering Site engineering techniques such as transmitter antenna tilting, and antenna direction and careful
deployment planning A combination of the above. Furthermore it is shown that BWS does not have any considerable negative impact on space to space service.
Regarding compatibility with radio astronomy earth stations (receiving in the band 2200-2290 MHz), it was shown that protection of these stations can be achieved for example by a suitable co-ordination zone around the limited number of observatory stations.
Administrations wishing to license the 2300-2400 MHz band to BWS should be aware that there is a potential conflict with MMDS system that might operate below 2300 MHz. Administrations are encouraged to perform appropriate studies for this scenario if MMDS systems are present.
8.2 SHARING SCENARIOS WITHIN 2300-2400 MHZ
For various BWS networks to coexist without guard band in the band 2300-2400 MHz, the use of different mitigation techniques is required. Examples of mitigation techniques to improve the adjacent channel operation of BWS systems are (non-exhaustive list)
Synchronization of networks operating in adjacent channels Extra filtering Site engineering Main lobe planning between frequency neighbouring licensees Site coordination between operators The coexistence between BWS and SAP/SAB13 video links has been studied in a worst-case analysis The results indicate that the required coupling loss depends on the video link scenario. In cordless or portable camera scenarios, coexistence can be feasible in the adjacent and alternate channel case; it has to be decided on a case-by-case basis if additional protection and sharing mechanisms have to be employed. In the co-channel case, dedicated protection and interference mitigation mechanisms would be required if BWS and video links are used at the same time in the same area. In a scenario involving a video link to a helicopter, the required coupling loss between the systems is higher, and a guard band between the BWS and video link systems is likely to be required if no further coordination measures are implemented.
The coexistence between BWS and Telemetry Systems (and coexistence between BWS and UAV – Unmanned aeronautical vehicles) is not ensured in a co-channel/co-location configuration. Adjacent channel operation, geographical separation, time sharing or a combination of the previous may help to ensure coexistence.
Regarding Radio Amateur systems in the 2300-2400 MHz band, operating as a secondary service, it was shown that the required MCL (Minimum Coupling Loss) can be achieved by various mitigation techniques.
8.3 ADJACENT BAND COMPATIBILITY SCENARIOS ABOVE 2400 MHZ
The coexistence between BWS and Bluetooth has been studied within the device. It has been shown that in-device coexistence requires some mitigation techniques. Simultaneous operation of LTE TDD and Bluetooth within a device is expected to occur. In worst case scenarios when Bluetooth is operating close to the 2400 13 These results can be extended for the evaluation of adjacent band compatibility with SAP/SAB links operated below 2300 MHz.

ECC REPORT 172 – Page 79
MHz boundary there can be interference issues. Fortunately in this situation the device has full control over the choice of Bluetooth channels. Frequency usage close to the 2400 MHz edge can be avoided by means of adaptive frequency hopping. This will greatly alleviate any issues in the direction of interference from Bluetooth to a full band upper-channel LTE TDD, since the ISM band filter has ample margin to suppress the Bluetooth signal. Interference in the other direction, from full band upper-channel LTE TDD to Bluetooth could be an issue without power restrictions in that LTE TDD channel. A regulatory solution could be to employ frequency separation.
The results for the impact of macro LTE TDD BS on WLAN show that coexistence is feasible for indoor WLAN systems at antenna height of 1.5 m with an interference probability smaller than 1%. The outdoor placed WLAN systems at 10 m height (worst case) will have very high interference probability. For the indoor case, WLAN AP interfering the Pico LTE TDD BS, there is a degradation in average bit rate. The results clearly show that increasing the offset frequency of LTE TDD decreases the bit rate degradation significantly. In all scenarios it is shown that using WLAN channel 5 instead of channel 1 will improve the situation significantly so that the coexistence between LTE TDD and WLAN would be feasible without mutual harmful interference.
8.4 CROSS BORDER COORDINATION BETWEEN BWS SYSTEMS
As in other frequency bands where the mobile service is deployed (e.g. the bands 900, 1800, 2100 MHz…), a coordination between networks deployed on each side of a border will be needed so as to avoid interferences between networks operating in the same channel but also in adjacent channels. Such a coordination procedure is all the more relevant as networks are operated in the TDD duplex mode, where base station to base station co-channel operations can occur.
The most efficient measure to alleviate interferences between TDD networks deployed on each side of a border is to enforce synchronisation between these networks (so that the base stations of the two networks transmit and receive exactly at the same time). Noting that this measure may not be easily implementable, other mitigation techniques may also be envisaged (guard bands, extra-filtering, site engineering, reduction of output power…).

ECC REPORT 172 – Page 80
ANNEX 1: LTE TDD TRANSMITTER AND RECEIVER CHARACTERISTICS
The Radio transmission and reception characteristics for sharing studies is given in [15], for the technology labelled IMT‑2000 CDMA TDD, where LTE TDD (also called E-UTRA TDD or LTE TDD) is included. Many characteristics are references to a 3GPP document, where in this document the corresponding ETSI document is instead referenced. A 3GPP document “36.xyz” corresponds to an ETSI document “136 xyz”.
The following characteristics are taken from ETSI TS 136 104 [3]. We focus on the relevant requirements, namely those for Category B (Europe) equipment operating in unpaired bands above 1 GHz, although [3] covers many other cases.
Unwanted emissions consist of out-of-band emissions and spurious emissions. Out of band emissions are unwanted emissions immediately outside the channel bandwidth resulting from the modulation process and non-linearity in the transmitter but excluding spurious emissions. Spurious emissions are emissions which are caused by unwanted transmitter effects such as harmonics emission, parasitic emission, intermodulation products and frequency conversion products, but exclude out of band emissions.
The out-of-band emissions requirement for the BS transmitter is specified in [3] both in terms of Adjacent Channel Leakage power Ratio (ACLR) and operating band unwanted emissions. The Operating band unwanted emissions define all unwanted emissions in the downlink operating band plus the frequency ranges 10 MHz above and 10 MHz below the band. Unwanted emissions outside of this frequency range are limited by a spurious emissions requirement. Hence, for all band widths, the spurious domain starts at 10 MHz outside the band.
A.1.1 SPURIOUS EMISSION
In this document we focus on Category B requirements in [3] valid for Europe [12]. According to the principles stated in Appendix 3 to the Radio Regulations, the spurious domain generally consists of frequencies separated from the centre frequency of the emission by 250 % or more of the necessary bandwidth of the emission. However, ETSI requirements are tougher, and the spurious domain starts already at 10 MHz outside the band for carrier bandwidths up to 20 MHz. For a band width of 1.4 and 3 MHz, 10 MHz is also sufficient to satisfy the 250 % requirement. The studies in this report use the tougher ETSI requirements since all LTE TDD equipment will at least satisfy these requirements.
The power of any spurious emission shall not exceed the limits in Table 61:
Table 61: BS Spurious emissions limits, Category B
Frequency range Maximum level Measurement
bandwith Note
9 kHz - 150 kHz -36 dBm 1 kHz Note 1 150 kHz - 30 MHz -36 dBm 10 kHz Note 1 30 MHz - 1 GHz -36 dBm 100 kHz Note 1 1 GHz - 12.75 GHz -30 dBm 1 MHz Note 2
NOTE 1: Bandwidth as in ITU-R SM.329 [2], s4.1
NOTE 2: Bandwidth as in ITU-R SM.329 [2], s4.1. Upper frequency as in ITU-R SM.329 [2] , s2.5 table 1
Thus, for this report, the value of -30 dBm measured over 1 MHz is relevant.

ECC REPORT 172 – Page 81
A.1.2 ACLR
Adjacent Channel Leakage power Ratio (ACLR) is the ratio of the filtered mean power centred on the assigned channel frequency to the filtered mean power centred on an adjacent channel frequency. The requirements shall apply whatever the type of transmitter considered (single carrier or multi-carrier). It applies for all transmission modes foreseen by the manufacturer's specification. For a multi-carrier BS, the requirement applies for the adjacent channel frequencies below the lowest carrier frequency transmitted by the BS and above the highest carrier frequency transmitted by the BS for each supported multi-carrier transmission configuration.
The ACLR is defined with a square filter of bandwidth equal to the transmission bandwidth configuration of the transmitted signal centred on the assigned channel frequency and a filter centred on the adjacent channel frequency according to the tables below.
For Category B Wide Area BS, either the ACLR limit of 45 dB apply or the absolute limit of -15 dBm/MHz apply, whichever is less stringent [3].
For Local Area BS, either the ACLR limit of 45 dB apply or the absolute limit of -32 dBm/MHz shall apply, whichever is less stringent [3].
For Home BS, either the ACLR limit of 45 dB apply or the absolute limit of -50 dBm/MHz apply, whichever is less stringent [3].
A.1.3 OPERATING BAND UNWANTED EMISSIONS
Unless otherwise stated, the Operating band unwanted emission limits are defined from 10 MHz below the lowest frequency of the downlink operating band up to 10 MHz above the highest frequency of the downlink operating band. In this study it means the range from 2290 MHz to 2410 MHz.
The requirements shall apply whatever the type of transmitter considered (single carrier or multi-carrier) and for all transmission modes foreseen by the manufacturer's specification. The unwanted emission limits in the part of the downlink operating band that falls in the spurious domain are consistent with ITU-R Recommendation SM.329 [12].
Emissions shall not exceed the maximum levels specified in the tables below, where:
∆f is the separation between the channel edge frequency and the nominal -3dB point of the measuring filter closest to the carrier frequency.
f_offset is the separation between the channel edge frequency and the centre of the measuring filter. f_offsetmax is the offset to the frequency 10 MHz outside the downlink operating band. ∆fmaxis equal to f_offsetmaxminus half of the bandwidth of the measuring filter. For a multicarrier E-UTRA BS the definitions above apply to the lower edge of the carrier transmitted at the lowest carrier frequency and the higher edge of the carrier transmitted at the highest carrier frequency.
In [3], there are various requirements defined for Wide Area BS, Local Area BS, and Home BS. In this Annex the focus is on the Wide Area BS requirements.
Minimum requirements for Wide Area BS (Category B, Option 1)[3]
For E-UTRA BS operating in Bands 1, 2, 3, 4, 7, 10, 33, 34, 35, 36, 37, 38, 39, 40 (2300-2400 MHz), 41, emissions shall not exceed the maximum levels specified in Table 64:

ECC REPORT 172 – Page 82
Table 62: General operating band unwanted emission limits for 1.4 MHz channel bandwidth (E‑UTRA bands >1 GHz) for Category B
Frequency offset of measurement filter ‑3dB
point, ∆f
Frequency offset of measurement filter centre
frequency, f_offset
Minimum requirement Measurement bandwidth
(Note 1)
0 MHz ≤∆f < 1.4 MHz 0.05 MHz ≤f_offset < 1.45 MHz
dBMHz
offsetfdBm
05.0
_
4.1
101
100 kHz
1.4 MHz ≤∆f < 2.8 MHz 1.45 MHz ≤f_offset < 2.85 MHz
-11 dBm 100 kHz
2.8 MHz ≤∆f ≤∆fmax 3.3 MHz ≤f_offset < f_offsetmax
-15 dBm 1 MHz
Table 63: General operating band unwanted emission imits for 3 MHz channel bandwidth (E‑UTRA bands >1 GHz) for Category B
Frequency offset of measurement filter ‑3dB
point, ∆f
Frequency offset of measurement filter centre frequency,
f_offset
Minimum requirement Measurement bandwidth
(Note 1)
0 MHz ≤∆f < 3 MHz 0.05 MHz ≤f_offset < 3.05 MHz
dBMHz
offsetfdBm
05.0
_
3
105
100 kHz
3 MHz ≤∆f < 6 MHz 3.05 MHz ≤f_offset < 6.05 MHz
-15 dBm 100 kHz
6 MHz ≤∆f ≤∆fmax 6.5 MHz ≤f_offset < f_offsetmax
-15 dBm 1 MHz
Table 64: General operating band unwanted emission limits for 5, 10, 15 and 20 MHz channel bandwidth (E-UTRA bands >1 GHz) for Category B
Frequency offset of measurement filter ‑3dB
point, ∆f
Frequency offset of measurement filter centre
frequency, f_offset
Minimum requirement Measurement bandwidth
(Note 1)
0 MHz ≤∆f < 5 MHz 0.05 MHz ≤f_offset < 5.05 MHz
dBMHz
offsetfdBm
05.0
_
5
77
100 kHz
5 MHz ≤∆f < min(10 MHz, ∆fmax)
5.05 MHz ≤f_offset < min(10.05 MHz, f_offsetmax)
-14 dBm 100 kHz
10 MHz ≤∆f ≤∆fmax 10.5 MHz ≤f_offset < f_offsetmax
-15 dBm (Note 3) 1 MHz
Minimum requirements for MSR BS [14]
Band Category 3 contains the band 2300-2400 MHz.
For a BS operating in Band Category 1 or Band Category 3, emissions shall not exceed the maximum levels specified in Table 65:Table 65: below, where:
∆f is the separation between the RF bandwidth edge frequency and the nominal -3 dB point of the measuring filter closest to the carrier frequency.
f_offset is the separation between the RF bandwidth edge frequency and the centre of the measuring filter.
f_offsetmax is the offset to the frequency 10 MHz outside the downlink operating band. ∆fmaxis equal to f_offsetmaxminus half of the bandwidth of the measuring filter.

ECC REPORT 172 – Page 83
Table 65: Operating band unwanted emission mask (UEM) for BC1 and
Frequency offset of measurement filter ‑3dB
point, ∆f
Frequency offset of measurement filter centre
frequency, f_offset
Minimum requirement Measurement bandwidth
(Note 1)
0 MHz ≤∆f < 0.2 MHz 0.015MHz ≤f_offset < 0.215MHz
-14 dBm 30 kHz
0.2 MHz ≤∆f < 1 MHz 0.215MHz ≤f_offset < 1.015MHz
30 kHz
(Note 1) 1.015MHz ≤f_offset < 1.5 MHz
-26 dBm 30 kHz
1 MHz≤∆f≤min(∆fmax, 10 MHz)
1.5 MHz≤f_offset < min(f_offsetmax, 10.5 MHz)
-13 dBm 1 MHz
10 MHz≤∆f≤∆fmax 10.5 MHz≤f_offset < f_offsetmax
-15 dBm (Note 3) 1 MHz
NOTE 1: This frequency range ensures that the range of values of f_offset is continuous. NOTE 2: As a general rule for the requirements in the present subclause, the resolution bandwidth of the measuring equipment should
be equal to the measurement bandwidth. However, to improve measurement accuracy, sensitivity and efficiency, the resolution bandwidth may be smaller than the measurement bandwidth. When the resolution bandwidth is smaller than the measurement bandwidth, the result should be integrated over the measurement bandwidth in order to obtain the equivalent noise bandwidth of the measurement bandwidth.
NOTE 3: The requirement is not applicable when ∆fmax< 10 MHz.

ECC REPORT 172 – Page 84
ANNEX 2: ADDITIONAL CALCULATION RESULTS REGARDING THE COEXISTENCE OF LTE-TDD AND SAP/SAB VIDEO LINKS
Table 66: MCL and corresponding Separation Distances d (95 % victim system reliability) for usage scenario 1 “Cordless Camera Link”, receiver antenna facing 20° away. LTE interferer.
Interference scenario
Victim (videolink) bandwidth
Interfering system and bandwidth
LTE TDD BS LTE TDD UE
20 MHz 10 MHz 5 MHz 20 MHz 10 MHz 5 MHz
Co-channel
20 MHz MCL (dB) 158.4 158.4 158.4 154.9 154.9 154.9
d (km) 2.494 2.494 2.494 0.535 0.535 0.535
10 MHz MCL (dB) 158.4 161.4 161.4 154.9 156.2 156.2
d (km) 2.494 3.046 3.046 0.535 0.585 0.585
5 MHz MCL (dB) 158.4 161.4 164.3 154.9 156.2 158.8
d (km) 2.494 3.046 3.683 0.535 0.585 0.693
Adjacent
20 MHz MCL (dB) 125.6 125.6 125.6 136.0 136.0 136.0
d (km) 0.293 0.293 0.293 0.156 0.156 0.156
10 MHz MCL (dB) 124.9 126.8 126.8 137.1 139.0 139.0
d (km) 0.282 0.318 0.318 0.168 0.191 0.191
5 MHz MCL (dB) 126.3 128.3 129.4 138.7 140.5 141.3
d (km) 0.305 0.348 0.377 0.187 0.211 0.222
Alternate 20 / 10 / 5 MHz
MCL (dB) 127.8 121.8
d (km) 0.338 0.089
Table 67: Median MCL and corresponding Separation Distances d for usage scenario 1 “Cordless Camera Link”, antenna directions aligned. LTE interferer.
Interference scenario
Victim (videolink) bandwidth
Interfering system and bandwidth
LTE TDD BS LTE TDD UE
20 MHz 10 MHz 5 MHz 20 MHz 10 MHz 5 MHz
Co-channel
20 MHz MCL (dB) 148.7 148.7 166.5 142.0 142.0 142.0
d (km) 1.335 1.335 4.259 0.232 0.232 0.232
10 MHz MCL (dB) 148.7 151.3 169.5 142.0 145.0 145.0
d (km) 1.335 1.567 5.151 0.232 0.281 0.281
5 MHz MCL (dB) 148.7 151.3 172.5 142.0 145.0 148.0
d (km) 1.335 1.567 6.291 0.232 0.281 0.343
Adjacent
20 MHz MCL (dB) 88.1 88.1 88.1 112.0 112.0 112.0
d (km) 0.060 0.060 0.060 0.076 0.076 0.076
10 MHz MCL (dB) 86.9 89.4 89.4 113.1 115.0 115.0
d (km) 0.058 0.061 0.061 0.077 0.080 0.080
5 MHz MCL (dB) 88.9 91.3 92.8 114.7 117.0 118.0
d (km) 0.061 0.065 0.066 0.080 0.082 0.084
Alternate 20 / 10 / 5 MHz
MCL (dB) 90.6 102.0
d (km) 0.063 0.065

ECC REPORT 172 – Page 85
Table 68: Median MCL and corresponding Separation Distances d for usage scenario 1 “Cordless Camera Link”, antenna directions aligned. Video link interferer.
Interference scenario
Victim (LTE)
bandwidth
Victim LTE TDD BS Victim LTE TDD UE
Interfering system bandwidth
20 MHz 10 MHz 5 MHz 20 MHz 10 MHz 5 MHz
Co-channel
20 MHz MCL (dB) 129.1 129.1 129.1 119.5 119.5 119.5
d (km) 0.369 0.369 0.369 0.086 0.086 0.086
10 MHz MCL (dB) 129.1 132.3 132.3 119.5 122.5 122.5
d (km) 0.369 0.455 0.455 0.086 0.090 0.090
5 MHz MCL (dB) 129.1 132.3 135.5 119.5 122.5 125.5
d (km) 0.369 0.455 0.561 0.086 0.090 0.095
Adjacent
20 MHz MCL (dB) 90.1 91.2 92.9 83.5 84.5 85.9
d (km) 0.062 0.064 0.067 0.048 0.049 0.050
10 MHz MCL (dB) 91.3 93.5 94.7 84.6 86.5 87.5
d (km) 0.064 0.068 0.070 0.049 0.050 0.051
5 MHz MCL (dB) 93.1 95.3 97.0 86.1 88.1 89.5
d (km) 0.067 0.071 0.074 0.050 0.052 0.053
Alternate 20 / 10 / 5 MHz
MCL (dB) 92.4 85.5
d (km) 0.066 0.050
Table 69: MCL and corresponding Separation Distances d (95 % victim system reliability) for usage scenario 2 “Mobile Video Link”, receiver antenna facing 20° away. LTE interferer.
Interference scenario
Victim (videolink) bandwidth
Interfering system and bandwidth
LTE TDD BS LTE TDD UE
20 MHz 10 MHz 5 MHz 20 MHz 10 MHz 5 MHz
Co-channel
20 MHz MCL (dB) 173.1 173.1 170.1 145.8 145.8 145.8
d (km) >500 >500 >500 200.3 200.3 200.3
10 MHz MCL (dB) 173.1 176.1 173.1 145.8 148.8 148.8
d (km) >500 >500 >500 200.3 284.3 284.3
5 MHz MCL (dB) 173.1 176.1 176.1 145.8 148.8 151.8
d (km) >500 >500 >500 200.3 284.3 403.4
Adjacent
20 MHz MCL (dB) 127.8 127.8 124.7 115.8 115.8 115.8
d (km) 25.4 25.4 17.7 6.321 6.321 6.321
10 MHz MCL (dB) 130.7 130.9 127.8 116.9 118.8 118.8
d (km) 35.3 36.0 25.4 7.198 8.970 8.970
5 MHz MCL (dB) 132.3 132.5 130.9 118.5 120.8 121.8
d (km) 42.3 43.5 36.0 8.704 11.3 12.7
Alternate 20 / 10 / 5 MHz
MCL (dB) 108.3 105.8
d (km) 2.675 2.001

ECC REPORT 172 – Page 86
Table 70: Median MCL and corresponding Separation Distances d for usage scenario 2 “Mobile Video Link”, antenna directions aligned. LTE interferer.
Interference scenario
Victim (videolink) bandwidth
Interfering system and bandwidth
LTE TDD BS LTE TDD UE
20 MHz 10 MHz 5 MHz 20 MHz 10 MHz 5 MHz
Co-channel
20 MHz MCL (dB) 158.3 158.3 155.3 131.0 131.0 131.0
d (km) >500 >500 >500 36.7 36.7 36.7
10 MHz MCL (dB) 158.3 161.3 158.3 131.0 134.0 134.0
d (km) >500 >500 >500 36.7 51.5 51.5
5 MHz MCL (dB) 158.3 161.3 161.3 131.0 134.0 137.0
d (km) >500 >500 >500 36.7 51.5 73.1
Adjacent
20 MHz MCL (dB) 111.9 111.9 108.5 101.0 101.0 101.0
d (km) 4.029 4.029 2.728 1.154 1.154 1.154
10 MHz MCL (dB) 115.0 115.2 111.9 102.1 104.0 104.0
d (km) 5.833 5.951 4.070 1.315 1.638 1.638
5 MHz MCL (dB) 116.7 116.9 115.3 103.7 106.0 107.0
d (km) 7.054 7.269 5.951 1.590 2.041 2.301
Alternate 20 / 10 / 5 MHz
MCL (dB) 85.6 91.0
d (km) 0.197 0.366
Table 71: Median MCL and corresponding Separation Distances d for usage scenario 2 “Mobile Video Link”, antenna directions aligned. Video link interferer.
Interference scenario
Victim (LTE)
bandwidth
Victim LTE TDD BS Victim LTE TDD UE
Interfering system bandwidth
20 MHz 10 MHz 5 MHz 20 MHz 10 MHz 5 MHz
Co-channel
20 MHz MCL (dB) 141.1 141.1 141.1 133.0 133.0 133.0 d (km) 11.4 11.4 11.4 1.075 1.075 1.075
10 MHz MCL (dB) 141.1 144.1 144.1 133.0 136.0 136.0 d (km) 11.4 14.0 14.0 1.075 1.313 1.313
5 MHz MCL (dB) 141.1 144.1 147.2 133.0 136.0 139.0 d (km) 11.4 14.0 17.2 1.075 1.313 1.604
Adjacent
20 MHz MCL (dB) 93.1 94.1 95.7 87.3 88.3 89.7 d (km) 0.469 0.503 0.556 0.055 0.058 0.063
10 MHz MCL (dB) 94.2 96.3 97.4 88.4 90.3 91.3 d (km) 0.508 0.584 0.626 0.058 0.066 0.071
5 MHz MCL (dB) 95.9 98.0 99.6 89.9 91.9 93.3 d (km) 0.567 0.652 0.721 0.065 0.073 0.081
Alternate 20 / 10 / 5 MHz
MCL (dB) 91.6 86.0 d (km) 0.395 0.050

ECC REPORT 172 – Page 87
Table 72: MCL and corresponding Separation Distances d (95% victim system reliability) for usage Scenario 3 “Portable Video Link”, receiver antenna facing 20° away. LTE interferer.
Interference scenario
Victim (videolink) bandwidth
Interfering system and bandwidth
LTE TDD BS LTE TDD UE
20 MHz 10 MHz 5 MHz 20 MHz 10 MHz 5 MHz
Co-channel
20 MHz MCL (dB) 153.2 153.2 153.2 147.8 147.8 147.8
d (km) 7.905 7.905 7.905 1.503 1.503 1.503
10 MHz MCL (dB) 153.2 156.2 156.2 147.8 150.8 150.8
d (km) 7.905 9.559 9.559 1.503 1.818 1.818
5 MHz MCL (dB) 153.2 156.2 159.2 147.8 150.8 153.8
d (km) 7.905 9.559 11.7 1.503 1.818 2.220
Adjacent
20 MHz MCL (dB) 114.1 114.1 114.1 125.9 125.9 125.9
d (km) 0.611 0.611 0.611 0.356 0.356 0.356
10 MHz MCL (dB) 113.7 114.9 114.9 126.5 127.5 127.5
d (km) 0.593 0.642 0.642 0.371 0.398 0.398
5 MHz MCL (dB) 114.6 116.1 117.1 127.4 128.6 129.0
d (km) 0.630 0.696 0.746 0.394 0.426 0.439
Alternate 20 / 10 / 5 MHz
MCL (dB) 115.6 119.7
d (km) 0.675 0.239
Table 73: Median MCL and corresponding Separation Distances d for usage Scenario 3 “Portable Video Link”, antenna directions aligned. LTE interferer.
Interference scenario
Victim (videolink) bandwidth
Interfering system and bandwidth
LTE TDD BS LTE TDD UE
20 MHz 10 MHz 5 MHz 20 MHz 10 MHz 5 MHz
Co-channel
20 MHz MCL (dB) 158.4 158.4 158.4 153.0 153.0 153.0
d (km) 11.0 11.0 11.0 2.095 2.095 2.095
10 MHz MCL (dB) 158.4 161.4 161.4 153.0 156.0 156.0
d (km) 11.0 13.5 13.5 2.095 2.558 2.558
5 MHz MCL (dB) 158.4 161.4 164.4 153.0 156.0 159.0
d (km) 11.0 13.5 16.4 2.095 2.558 3.125
Adjacent
20 MHz MCL (dB) 118.1 118.1 118.1 123.0 123.0 123.0
d (km) 0.791 0.791 0.791 0.297 0.297 0.297
10 MHz MCL (dB) 117.3 118.9 118.9 124.1 126.0 126.0
d (km) 0.760 0.840 0.840 0.318 0.359 0.359
5 MHz MCL (dB) 118.6 120.1 121.2 125.7 128.0 129.0
d (km) 0.823 0.910 0.976 0.352 0.409 0.438
Alternate 20 / 10 / 5 MHz
MCL (dB) 119.7 113.0
d (km) 0.883 0.153

ECC REPORT 172 – Page 88
Table 74: MCL and corresponding Separation Distances d (95 % victim system reliability) for usage Scenario 3 “Portable Video Link”, receiver antenna facing 20° away. Video link interferer.
Interference scenario
Victim (LTE) bandwidth
Victim LTE TDD BS Victim LTE TDD UE
Interfering system bandwidth
20 MHz 10 MHz 5 MHz 20 MHz 10 MHz 5 MHz
Co-channel
20 MHz MCL (dB) 165.5 165.5 165.5 154.3 154.3 154.3 d (km) 12.0 12.0 12.0 1.718 1.718 1.718
10 MHz MCL (dB) 165.5 168.5 168.5 154.3 157.3 157.3 d (km) 12.0 14.6 14.6 1.718 2.078 2.078
5 MHz MCL (dB) 165.5 168.5 171.6 154.3 157.3 160.3 d (km) 12.0 14.6 17.7 1.718 2.078 2.538
Adjacent
20 MHz MCL (dB) 110.3 111.3 112.7 76.2 77.3 112.4 d (km) 0.323 0.347 0.376 0.010 0.011 0.111
10 MHz MCL (dB) 111.4 113.2 113.9 77.4 113.0 114.1 d (km) 0.347 0.391 0.411 0.011 0.115 0.124
5 MHz MCL (dB) 112.8 114.4 115.4 79.1 114.7 116.3 d (km) 0.380 0.420 0.450 0.013 0.129 0.142
Alternate 20 / 10 / 5 MHz
MCL (dB) 117.7 120.2 d (km) 0.523 0.185
Table 75: Median MCL and corresponding Separation Distances d for usage Scenario 3 “Portable Video Link”, antenna directions aligned. Video link interferer.
Interference scenario
Victim (LTE)
bandwidth
Victim LTE TDD BS Victim LTE TDD UE
Interfering system bandwidth
20 MHz 10 MHz 5 MHz 20 MHz 10 MHz 5 MHz
Co-channel
20 MHz MCL (dB) 152.1 152.1 152.1 144.0 144.0 144.0 d (km) 4.975 4.975 4.975 0.873 0.873 0.873
10 MHz MCL (dB) 152.1 155.1 155.1 144.0 147.0 147.0 d (km) 4.975 6.076 6.076 0.873 1.067 1.067
5 MHz MCL (dB) 152.1 155.1 158.2 144.0 147.0 150.0 d (km) 4.975 6.076 7.422 0.873 1.067 1.290
Adjacent
20 MHz MCL (dB) 64.7 67.5 72.1 74.8 75.9 77.5 d (km) 0.016 0.020 0.027 0.010 0.010 0.011
10 MHz MCL (dB) 67.6 74.2 77.9 76.0 78.2 79.3 d (km) 0.020 0.030 0.039 0.010 0.012 0.013
5 MHz MCL (dB) 72.8 80.2 84.6 77.7 79.9 81.6 d (km) 0.028 0.045 0.060 0.011 0.013 0.015
Alternate 20 / 10 / 5 MHz
MCL (dB) 89.9 86.1 d (km) 0.085 0.020

ECC REPORT 172 – Page 89
ANNEX 3: INTERFERENCE FROM LTE TDD BASE STATION TO EARTH STATION SATELLITE RECEIVERS DESCRIBED (DETERMINISTIC APPROACH)
1. Adapting field strength curves in Recommendation ITU-R P.1546-4(10/2009). Method for point-to-area predictions for terrestrial services in the frequency range 30 MHz to 3 000 MHz [8]to a frequency of 2300 MHz by prescribed extrapolation method
2. Converting resulting curves from Step 1 from field strength (dB μV/m) to received power levels (dBm) Receiver antenna gain is part of this conversion and is either 22 or 31 dBi
3. Modifying curves with respect to effective radiated power, transmitter antenna gain and tilt, and feeder loss
Convert from 60 dBm effective radiated power to -30 dBm effective radiated power (shift curves 90 dB down)
Taking into account transmitter antenna gain: 17 dBi – 2.15 = 14.85 dBd (shift curves 14.85 dB up Feeder loss and tilt effect: 3+3 dB (shift 6 dB down) Total effect: Shift received power level curves from Step 2 81.15 dB down 4. Highlighting horizontal threshold line in diagram corresponding to a 96 dB attenuation -30-96= - 126 dBm 5. Reading required distances from where curves from Step 3 cross threshold from Step 4 The propagation curves in Annexes 2, 3 and 4 of [8] represent field-strength values for 1 kW effective eradiated power (e.r.p.) at nominal frequencies of 100, 600 and 2 000 MHz, respectively, as a function of various parameters; the curves used in this study refer to land paths.
The data sets with numerical values making up the curves in [8] can be found in excel sheets in the ITU-R web page. nterpolation or extrapolation of the values obtained for these nominal frequency values should be used to obtain field-strength values for any given required frequency using the method given in Annex 5, § 6 of [8]. Such extrapolation has been done with the specified method (valid up to 3000 MHz) for the studied frequency 2300 MHz.
The curves in Figures 9 and 17 in Annex 4 of [8] have been used in the prescribed extrapolation method in Step 1.
In Step 2, the received power are converted from field strength values with the unit dB μV/m to received power levels in dBm for the data sets corresponding to the curves in [8] according to the formula:
2,77)log(20/ dBidBm rMHzmVdBr GfEP (dBm)
where MHzf 2300 (MHz) and dBirG receiver antenna gain (dBi) which is either 31 dBi for EESS and 22
dBi for Space Research.
In Step 3, the resulting power values are corrected with respect to transmitter antenna gains and tilt, feeder loss and emitted power by subtracting 81.15 dB.
The received power level curves have been created with an assumed effective radiation power of -30 dBm and hence we compare with a threshold tolerated received interference power level of -126 dBm (Step 4), which correspond to a 96 dB path loss attenuation.
From the crossing of the threshold with these curves the required distances corresponding to 96 dB attenuation can be read directly.
The results are plotted for three examples of transmitter antenna heights over representative clutter (h1=10, 20 and 37.5m) corresponding to the BS antenna height over the representative clutter and with a receiver height h2 at the representative clutter height, for EESS (Figure 4:) and Space Research (Figure 6:), respectively.
The receiver antenna height above clutter could be modified according to Equations 27 b and 27 f in Annex 5, §9 of [8].

ECC REPORT 172 – Page 90
The equation 27 b in [8] defines the correction factor (dB) as Kh2 log10(h2 / R') where h2 is the modified receiver antenna height and R'= 10m on land for rural or open area environment, and where Kh2 = 3.2�6.2log10( fMHz ) (27 f in [8]).
When the receiving/mobile antenna is on land in a rural or open environment, the value R' is set to 10 m.
As an example, for h2=35m this equates to: 24*log10( 35/10 ) = 13 dB, meaning that the curves in Figures 4 and 6 should be shifted 13 dB up.

ECC REPORT 172 – Page 91
ANNEX 4: EMPIRICAL PROPAGATION MODEL (EPM 73)
EPM 73 [37] is a propagation model which has the advantage of simplicity of manual calculations of basic transmission loss, and which provides a degree of accuracy which is similar to that obtained with other more sophisticated models which compute basic transmission loss.
The model uses a minimum number of parameters and is based on both theoretical and empirical considerations. Also, given a value of basic transmission loss and, for example, antenna heights and frequency, the appropriate value of distance may be calculated. The model provides an estimate of mean basic transmission loss, in dB, with an associated standard deviation. It has been compared with measured values over a frequency range of approximately 20-10,000 MHz.
Approximately 7000 paths have been considered in many different areas. Comparison with other more sophisticated models indicates comparable results, including predictions for sea water paths and for frequencies down to 1 MHz (but not substantiated by measurements between 1 and 20 MHz).

ECC REPORT 172 – Page 92
ANNEX 5: LIST OF REFERENCE
[1] ERC Report 25: "THE EUROPEAN TABLE OF FREQUENCY ALLOCATIONS AND UTILISATIONS IN THE FREQUENCY RANGE 9 kHz to 3000 GHz; Lisboa 02- Dublin 03- Kusadasi 04- Copenhagen 04- Nice 07- Baku 08".
[2] ETSI Technical Specification ETSI TS 136 101 V8.11.0 (2010-10): LTE; Evolved Universal Terrestrial Radio Access (E-UTRA); User Equipment (UE) radio transmission and reception”
[3] ETSI Technical Specification ETSI TS 136 104 V9.5.0 (2010-10): LTE; Evolved Universal Terrestrial Radio Access (E-UTRA); Base Station (BS) radio transmission and reception”
[4] ETSI Technical Specification ETSI TS 136 211 V9.1.0 (2010-04):” LTE; Evolved Universal Terrestrial Radio Access (E-UTRA); Physical channels and modulation”.
[5] ETSI Technical Report ETSI TR 102 837 V1.1.1_1.1.2: “Electromagnetic compatibility and Radio spectrum Matters (ERM); System Reference document (SRdoc); Broadband Wireless Systems in the 2 300 MHz to 2 400 MHz range”
[6] RECOMMENDATION ITU-R SA.1155 Protection criteria related to the operation of data relay satellite systems
[7] ERC Recommendation 25-10 – Frequency ranges for the use of temporary terrestrial audio and video SAP/SAB links (incl. ENG/OB)
[8] Recommendation ITU-R P.1546-4(10/2009). Method for point-to-area predictions for terrestrial services in the frequency range 30 MHz to 3 000 MHz
[9] Report ITU-R SM.2057 “Studies related to the impact of devices using ultra-wideband technology on radiocommunication services”
[10] Recommendation ITU-R SA.609 Protection criteria for radiocommunication links for manned and unmanned near-Earth research satellites
[11] Recommendation ITU-R F.1336 Reference radiation patterns of omnidirectional, sectoral and other antennas in point-to-multipoint systems for use in sharing studies in the frequency range from 1 GHz to about 70 GHz
[12] Recommendation ITU-R SM.329-10 (02/2003). Unwanted emissions in the spurious domain. [13] Recommendation ITU-R SA.1157. Protection criteria for deep-space research [14] ETSI TS 137 104 V9.3.0 (2010-10). Digital cellular telecommunications system (Phase 2+); Universal
Mobile Telecommunications System (UMTS); LTE; E-UTRA, UTRA and GSM/EDGE; Multi-Standard Radio (MSR) Base Station (BS) radio transmission and reception (3GPP TS 37.104 version 9.3.0 Release 9)
[15] REPORT ITU-R M.2039-2 (11/2010). CHARACTERISTICS OF TERRESTRIAL IMT-2000 SYSTEMS FOR FREQUENCY SHARING/INTERFERENCE ANALYSES
[16] CEPT/ERC Recommendation 62-02 E “HARMONISED FREQUENCY BAND FOR CIVIL AND MILITARY AIRBORNE TELEMETRY APPLICATIONS”
[17] ETSI EN 301 783 “Electromagnetic compatibility and Radio spectrum Matters (ERM); Land Mobile Service; Commercially available amateur radio equipment; Part 1: Technical characteristics and methods of measurement”
[18] Bluetooth specification version 4.0, June 30, 2010. https://www.bluetooth.org/docman/handlers/downloaddoc.ashx?doc_id=229737
[19] White paper: Filter Recommendations For Coexistence With LTE and WiMAX. Bluetooth Special Interest Group. https://www.bluetooth.org/docman/handlers/downloaddoc.ashx?doc_id=228067
[20] Product data sheet, Texas Instruments. CC2567-PAN1327, CC2567-PAN1317. ANT + Bluetooth® Single-Chip, Dual-Mode Module. http://focus.ti.com/lit/ds/symlink/cc2567-pan1317.pdf
[21] Evolved Universal Terrestrial Radio Access (E-UTRA); User Equipment (UE) radio transmission and reception (3GPP TS 36.101 version 10.1.1 Release 10)
[22] ETSI EN 301 908-19 “IMT cellular networks; Harmonized EN covering the essential requirements of article 3.2 of the R&TTE Directive Part 19: OFDMA TDD WMAN (Mobile WiMAX) TDD User Equipment (UE)”
[23] ETSI EN 301 908-20 “IMT cellular networks; Harmonized EN covering the essential requirements of article 3.2 of the R&TTE Directive; Part 20: OFDMA TDD WMAN (Mobile WiMAX) TDD Base Stations (BS)”
[24] WiMAX Forum® Air Interface specifications WMF-T23-005-R015v05: "WiMAX Forum® Mobile RadioSpecification".
[25] ERC Report 38, « HANDBOOK ON RADIO EQUIPMENT AND SYSTEMS VIDEO LINKS FOR ENG/OB USE «

ECC REPORT 172 – Page 93
[26] EN 302 064-1 V1.1.2 (2004-07) “Electromagnetic compatibility and Radio spectrum Matters (ERM); Wireless Video Links (WVL) operating in the 1,3 GHz to 50 GHz frequency band; Part 1: Technical characteristics and methods of measurement”
[27] Recommendation ITU-R SA 509-2 “Space research earth station and radio astronomy reference antenna radiation pattern for use in interference calculations, including coordination procedures”
[28] ETSI ES 202 239 V1.1.1 (2003-10) Electromagnetic compatibility and Radio spectrum Matters (ERM); Wireless digital video links operating above 1,3 GHz; Specification of typical receiver performance parameters for spectrum planning
[29] ERC REPORT 68 ”MONTE-CARLO SIMULATION METHODOLOGY FOR THE USE IN SHARING AND COMPATIBILITY STUDIES BETWEEN DIFFERENT RADIO SERVICES OR SYSTEMS”
[30] IRIG DOCUMENT 106-11 PART I: TELEMETRY STANDARDS [31] Recommendation ITU-R F.699: Reference radiation patterns for fixed wireless system antennas for
use in coordination studies and interference assessment in the frequency range from 100 MHz to about 70 GHz
[32] Recommendation ITU-R M.1459, "Protection criteria for telemetry systems in the aeronautical mobile service and mitigation techniques to facilitate sharing with geostationary broadcasting-satellite and mobile-satellite services in the frequency bands 1 452 1 525 and 2 310 2 360 MHz".
[33] ECC Report 131: DERIVATION OF A BLOCK EDGE MASK (BEM) FOR TERMINAL STATIONS IN THE 2.6 GHz FREQUENCY BAND (2500-2690 MHz)
[34] CEPT Report 19 Report from CEPT to the European Commission in response to the Mandate to develop least restrictive technical conditions for frequency bands addressed in the context of WAPECS
[35] ITU-R Recommendation SA.509, “Space research earth station and radio astronomy reference antenna radiation pattern for use in interference calculations, including coordination procedures”
[36] ITU-R Recommendation RA.769, “Protection criteria used for radio astronomical measurements” [37] M.N. Lustgarten, James A. Madison, “An Empirical Propagation Model (EPM - 73),” in IEEE
Transactions on Electromagnetic Compatibility, Vol. EMC-19, No. 3, August 1977, p. 301-309. [38] Recommendation ITU-R SA.1154,”Provisions to protect the space research (SR), space operations
(SO) and Earth exploration-satellite services (EES) and to facilitate sharing with the mobile service in the 2 025-2 110 MHz and 2 200-2 290 MHz bands”
[39] ETSI EN 300 328 "Electromagnetic compatibility and Radio spectrum Matters (ERM); Wideband transmission systems; Wideband transmission equipment operating in the 2,4 GHz ISM band and using wideband modulation techniques"
[40] Recommendation ITU-R M.1732 - Characteristics of systems operating in the amateur and amateur-satellite services for use in sharing
[41] Recommendation T/R 13-01 [42] ETSI EN 302 217 - Overview and system-independent common characteristics [43] ERC/REC 70-03 – Short Range Devices [44] ERC/DEC/(01)08 – Harmonised frequencies, technical characteristics and exemption from individual
licensing of Short Range Devices used for Movement Detection and Alert operating in the frequency band 2400 - 2483.5 MHz
[45] ECC/DEC/(07)03 – Reserving the National Numbering Range beginning with '116' for Harmonised Numbers for Harmonised Services of Social Value
[46] ECC/DEC/(07)04 – Free circulation and use of mobile satellite terminals operating in the Mobile-Satellite Service allocations in the frequency range 1-3 GHz
[47] ECC/DEC/(07)05 – Exemption from individual licensing of land mobile satellite terminals operating in the Mobile-Satellite Service allocations in the frequency range 1-3 GHz
[48] ETSI EN 300 440 - Radio equipment to be used in the 1 GHz to 40 GHz frequency range [49] ETSI EN 300 761 - Automatic Vehicle Identification (AVI) for railways [50] ECC/DEC/(09)02 - Harmonisation of the bands 1610-1626.5 MHz and 2483.5-2500 MHz for use by
systems in the Mobile-Satellite Service