ecd in latin america and the caribbean: the evidence norbert schady sector economic adviser...
TRANSCRIPT

ECD in Latin America and the Caribbean: The evidence
Norbert SchadySector Economic Adviser
Inter-American Development Bank

Outline of presentation1. Child health and development
• Nutritional status• Language and cognitive development• Other dimensions of development
2. Coverage and quality of services
3. Impact of interventions on outcomes• Preschool • Community-based care (“hogares comunitarios”)• Parenting interventions• Health interventions• Cash transfers (often conditional)

Child health and development
Source: PAHO (2009) & ECLAC (2011)
020
4060
%
ChileCub
a
Argen
tina
Surina
me
Domini
can
Repub
lic
Venez
uelaBra
zil
Guyan
a
Parag
uay
Mex
ico
Colom
bia
El Salv
ador
Belize
Nicara
gua
Ecuad
orPer
uHait
i
Hondu
ras
Bolivia
Guate
mala
Prevalence of stunting in LAC
Stunting (low height for age) is high in many countries in the region…

Child health and development
Source: PAHO, 2009
Kilometers
0 500
NALow Prevalence of stunting ~ 11.7
High prevalence of stunting ~ 60.1
Peru
Prevalence of stunting
Stunting and SES in Peru
Wealth Q1 47.6
Q2 33.5
Q3 14.4
Q4 4.4
Q5 4.8
Mother education None 54.3
Only primary 39.1
Only secondary 13.7
Tertiary 3.4
Source: Pareja (2008)
… and there are big differences by place of residence and socioeconomic status
Child health and development
Chile Colombia Ecuador Nicaragua Peru60
65
70
75
80
85
90
95
100
105
110
First (richest) quartile
Fourth (poorest) quartile
Ave
rage
TVI
P Sc
ore
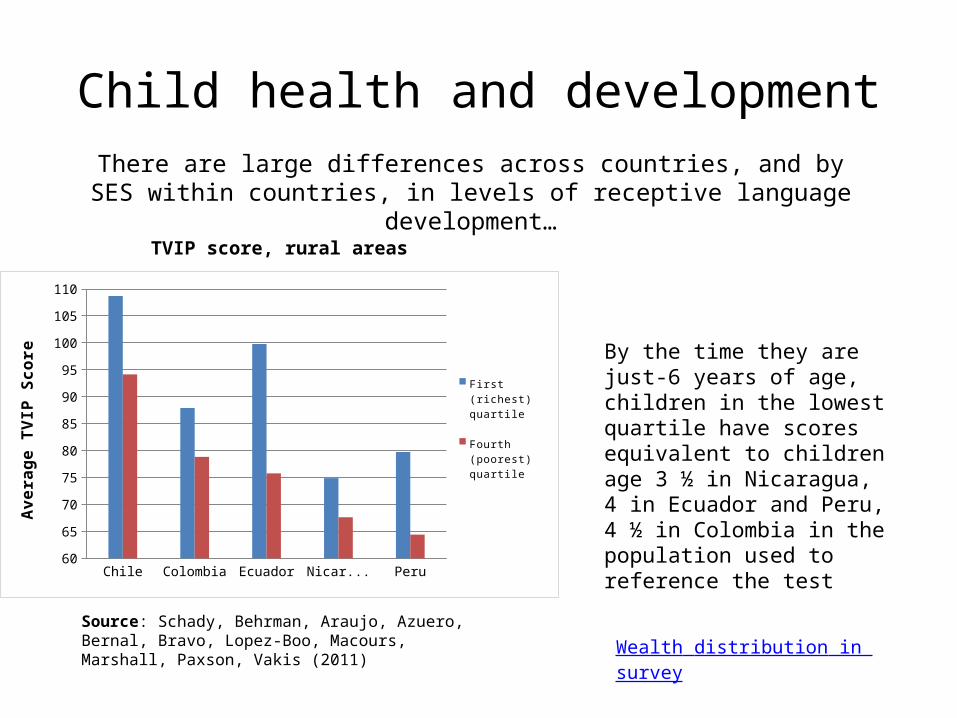
TVIP score, rural areas
Source: Schady, Behrman, Araujo, Azuero, Bernal, Bravo, Lopez-Boo, Macours, Marshall, Paxson, Vakis (2011)
There are large differences across countries, and by SES within countries, in levels of receptive language development…
By the time they are just-6 years of age, children in the lowest quartile have scores equivalent to children age 3 ½ in Nicaragua, 4 in Ecuador and Peru, 4 ½ in Colombia in the population used to reference the test
Wealth distribution in survey

-1
-.8
-.6
-.4
-.2
0
.2
.4
.6
.8
1
36 39 42 45 48 51 54 57 60 63 66 69 72age in months
1st (poorest) quartile 95% CI4th (richest) quartile 95% CI
Peru
-1
-.5
0
.5
1
36 42 48 54 60 66 72age in months
Baseline
-1
-.5
0
.5
1
54 60 66 72 78 84age in months
First follow-up
-1
-.5
0
.5
1
82 88 94 100 106 112 118age in months
Second follow-up
Ecuador-Rural
-1
-.5
0
.5
1
36 42 48 54 60 66 72age in months
Baseline
-1
-.5
0
.5
1
54 60 66 72 78 84age in months
First follow-up
-1
-.5
0
.5
1
82 88 94 100 106 112 118age in months
Second follow-up
Nicaragua-Rural
-1
-.5
0
.5
1
36 42 48 54 60 66 72age in months
Baseline
-1
-.5
0
.5
1
36 42 48 54 60 66 72age in months
Baseline
-1
-.5
0
.5
1
82 88 94 100 106 112 118age in months
First follow-up
Peru-Rural
-1
-.5
0
.5
1
36 42 48 54 60 66 72age in months
Baseline
-1
-.5
0
.5
1
36 42 48 54 60 66 72age in months
Baseline
-1
-.5
0
.5
1
82 88 94 100 106 112 118age in months
First follow-up
Peru-Urban
Child health and development
In language development, SES gradients grow until ~ age 6
In rural areas of Ecuador:• At age 12-23 months: difference of 0.12 sds on Macarthur test between poorest and richest
wealth quartile• At age 24-35 months: difference of 0.29 sds
-1
-.8
-.6
-.4
-.2
0
.2
.4
.6
.8
1
36 39 42 45 48 51 54 57 60 63 66 69 72age in months
1st (poorest) quartile 95% CI4th (richest) quartile 95% CI
Peru

Child health and development
1. Early deficits are strongly predictive of school performance– In Ecuador, a 1 sd increase in the TVIP when children are 3-5 years old is associated
with a 6.6 percentage point reduction in the probability that a child is behind in grade attainment 4 years later (either because of late entry into school or grade repetition), and a 0.32 sd increase in scores on tests of letters and words and basic math (Schady, AJPH 2011)
2. Deficits and gradients are also apparent in (some) other measures of child development
• In Ecuador, children in the poorest wealth quartile have scores that place them at the 13th percentile and 5th percentile of tests of associative memory and visual integration, respectively, while children in the richest quartile have scores that place them at the 22nd and 13th percentiles, respectively
• In Nicaragua and Ecuador– There do not appear to be substantial delays in gross and fine motor skills– Gradients in gross and fine motor skills, as well as in behavior problems (as measured
by the BPI) are small to nonexistent

Outline of presentation1. Child health and development
• Nutritional status• Language and cognitive development• Other dimensions of development
2. Coverage and quality of services
3. Impact of interventions on outcomes• Preschool • Community-based care (“hogares comunitarios”)• Parenting interventions• Health interventions• Cash transfers (often conditional)

Coverage of center-based care
Argentina 60.75% 51.88% 67.14% 15.26% 1998 85.84% 78.03% 93.38% 15.36% 2009Bolivia 24.42% 19.40% 34.14% 14.74% 1999 NA NA NA NABrazil 55.48% 45.74% 84.80% 39.06% 2001 73.06% 64.48% 91.63% 27.14% 2008Chile 51.99% 41.12% 69.07% 27.95% 1998 79.12% 71.93% 91.51% 19.58% 2009Colombia 73.24% 54.24% 94.30% 40.06% 2001 80.50% 73.49% 89.58% 16.09% 2008Costa Rica 38.09% 29.08% 49.50% 20.42% 1998 50.00% 43.12% 57.03% 13.91% 2009Dominican Republic 54.20% 38.35% 78.26% 39.91% 2000 64.47% 56.94% 81.97% 25.04% 2008Ecuador NA NA NA NA 84.95% 73.37% 96.93% 23.56% 2007Honduras 34.58% 27.15% 57.27% 30.12% 1999 44.20% 36.71% 56.04% 19.33% 2008Mexico 37.06% 29.44% 51.41% 21.97% 1998 88.65% 81.09% 97.66% 16.57% 2008Nicaragua 46.28% 30.85% 59.28% 28.43% 1998 48.91% 38.02% 64.82% 26.80% 2005Panama 59.91% 37.87% 92.89% 55.02% 1998 74.91% 67.35% 92.95% 25.60% 2007Paraguay NA NA NA NA 31.56% 18.77% 39.48% 20.71% 2008Peru 63.95% 52.17% 80.26% 28.09% 1998 65.47% 52.04% 77.54% 25.50% 2009El Salvador 37.65% 21.00% 72.65% 51.64% 1999 44.15% 31.00% 78.91% 47.90% 2008Uruguay 78.98% 68.36% 92.25% 23.89% 1999 92.12% 89.06% 97.25% 8.19% 2009Venezuela 70.74% 59.22% 87.01% 27.79% 1999 80.46% 69.96% 92.69% 22.73% 2007
CountryGap between
Q5 and Q1Year of survey
Year of survey
Gap between Q5 and Q1
Q5Q1Average
Late 90's Late 2000's
Q5Q1Average
Source: IDB Staff calculations, based on household survey data
Preschool attendance rates, children 4-5 years of age

Quality of center-based care• Application of ITERS and ECERS in sample of crèches and preschools in six
cities in Brazil (Verdisco and Pérez Alfaro 2010)• Score modified to be 1-10
• “Interaction” sub-scale: 5.6 and 5.7 on ITER and ECER, respectively• “Activities” sub-scale, 2.2 and 2.3 on ITER and ECER, respectively
• Quality of care provided by the Hogares Comunitarios de Bienestar Familiar (HCBF) program in Colombia (Bernal and Camacho 2011)
• HCBF provide care in the home of a “madre comunitaria” (community mother)• Data collected on the Family Day Care Environment Rating Scale (FDCRS) and an
abbreviated form of the Knowledge of Infant Development Inventory (KIDI) scale in a random sample of 400 centers
• Scores very low: • 2.4 on quality of infrastructure, 3.3 on quality of processes (on 1-7 FDCRS scale)• Community mothers answer only 40 percent of questions on KIDI correctly
• Work underway collecting data on CLASS in ~500 kindergarten classrooms in Ecuador

Quality of center-based care.
Distribution of CLASS scores, Ecuador, 2012 Emotional support Classroom management Instructional support
0.1
.2.3
.4.5
1 2 3 4 5 6
0.1
.2.3
0 2 4 6 8
0.5
11
.5
1 2 3 4 5

Outline of presentation1. Child health and development
• Nutritional status• Language and cognitive development• Other dimensions of development
2. Coverage and quality of services
3. Impact of interventions on outcomes• Preschool • Community-based care (“hogares comunitarios”)• Parenting interventions• Health interventions• Cash transfers (often conditional)

Preschool & other center-based care• Effect of attending preschool on test scores and classroom behavior in 3rd grade in
Argentina and years of schooling in early adolescence in Uruguay• Staggered phase-in of preschool in both countries allows for credible identification of
causal effects (differences-in-differences, fixed effects)Uruguay (Berlinski et al., JPubE 2008)• Attending preschool leads to ~0.8 additional years of completed schooling by age 15• Benefit-cost ratios of preschool of 3.2 using a discount rate of 10 percent• Conditional on attending preschool at age 5, preschool attendance at ages 3 or 4 has no
discernible benefits—at least, in terms of the years of schooling completedArgentina (Berlinski et al., JPubE 2009)• Children in cohorts and regions exposed to the construction program have test scores
that are significantly higher than children in other cohorts and regions• Every year of preschool increases test scores in language and mathematics in third
grade by approximately 0.23 standard deviations.• Preschool participants also have fewer behavior problems, are more likely to pay
attention in class, and are more likely to participate, as reported by their third-grade teachers

Community-based care• In many countries in the Region, including Colombia, Guatemala, Mexico, and Peru, a
substantial fraction of ECD services are provided in “community homes”• Involves refurbishing the home of a mother in the community, providing her with some
training, and offering child care for a group of children in the refurbished home• Frequently, food meant to cover a substantial fraction of children’s caloric intake is
also provided• Often, very large programs:
• The HCBF in Colombia has approximately 58,000 Hogares in the country, providing care to 800,000 children
• The Programa de Estancias Infantiles para Apoyar a Madres Trabajadoras in Mexico provided services to approximately 667,000 mothers in 2010
• Evaluations of PIDI in Bolivia (Behrman et al., ReStat 2004) and HCBF in Colombia (Bernal et al., unpublished 2009)• Both programs find some positive effects, although these are modest (Bolivia), or
apparent for some outcomes but not others (Colombia)• Both evaluations assume no selection on unobservables into duration of program
exposure

Parenting & early stimulationThe Jamaican study
Home visiting based on a structured curriculum
Curriculum promotes cognitive stimulation based on mother-child interactions
Weekly visits by health paraprofessionals for 24 months
Very small sample sizes (n=129) (efficacy trial) but very long follow-up
In the most recent follow-up (Walker et al. 2011), children who received stimulation had higher IQ (about 0.6 standard deviations), better performance on tests of mathematics and reading, higher levels of completed schooling (about one-third more years), lower levels of depression, and lower levels of involvement in violent criminal activity
Source: Walker, Grantham-McGregor and co-authors, various years

Parenting & early stimulation• Rosero and Oosterbeek (2012) compare the impact of center-based care and home
visits in Ecuador using a sharp RDD• Proposals ranked by score, funding from best to worst until funding exhausted• Children 2-3 years at baseline, follow-up collected ~ 2 years after beginning of treatment
• Home visits (once a week, for an hour, at a cost of US $ 109 per child per year) have very large, positive effects of home visits on child outcomes:
• .40 sds on receptive language, .56 to .84 sds on measures of cognitive development, 17 percentage point reduction in anemia
• Home visits reduce mother labor market participation, improve mother mental health, increase responsiveness of parental behaviors
• Center-based care (full time, 5 days a week, for 8 hours, at a cost of US $ 488 per child per year) increases mother labor participation & income, but worsens mothers’ mental health, worsens the responsiveness of parenting, and has no effect on child outcomes
Parenting & early stimulation
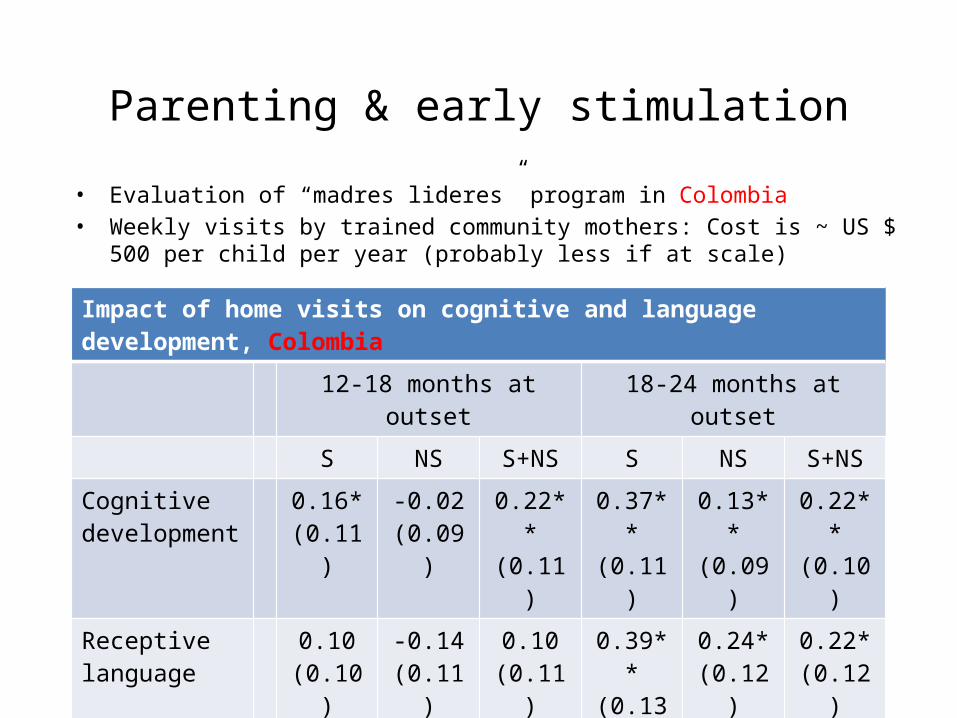
• Evaluation of “madres lideres” program in Colombia• Weekly visits by trained community mothers: Cost is ~ US $ 500 per child per year
(probably less if at scale)
Impact of home visits on cognitive and language development, Colombia
12-18 months at outset 18-24 months at outset
S NS S+NS S NS S+NS
Cognitive development
0.16*(0.11)
-0.02(0.09)
0.22**(0.11)
0.37**(0.11)
0.13**(0.09)
0.22**(0.10)
Receptive language
0.10(0.10)
-0.14(0.11)
0.10(0.11)
0.39**(0.13)
0.24*(0.12)
0.22*(0.12)
Expressive language
-0.04(0.11)
-0.07(0.13)
-0.08(0.12)
0.28**(0.11)
0.23**(0.11)
0.21**(0.11)
Source: Attanasio et al. (2012). S=stimulation, NS=nutritional supplement

Health and nutrition interventions
• Lots of evidence from the medical literature on negative effects on poor health and nutrition, including micronutrient deficiencies, in early childhood (summarized in Lancet 2007, 2011)
• An influential, long-term longitudinal study on the effect of nutritional supplementation in early childhood on outcomes in childhood, adolescence and adulthood in a sample of 4 villages in rural Guatemala
• “Atole” versus “fresca”• Pregnant women and children under the age of 7 were eligible• Supplementation provided from March 1969 through February 1977• Very long follow-up: At most recent follow-up, in 2002-04, individuals who had been exposed
to the two supplements before they were 7 years of age were now 24-42 years old• At age 3, children exposed to atole had lower rates of chronic malnutrition (Martorell 1992;
Habicht et al. 1992; Schroeder et al. 1995)• Adults exposed to atole when they were less than 24 months of age completed 0.4 more years
of schooling, on average (Maluccio et al. 2009), and had higher performance in tests of reading comprehension (an effect size of 0.27 standard deviations), and on the Ravens Progressive Matrices (an effect size of 0.35 standard deviations) (Stein et al. 2008)
• Men also earn significantly higher wages (Hoddinott et al. 2008)• Most important shortcoming is very small sample sizes (2 atole, 2 fresca villages)

Cash transfers (often, conditional)
• Virtually every country in Latin America has one or multiple programs which transfer cash to poor households
• The largest of these programs (in Brazil, Colombia, Ecuador, Mexico) cover millions of households, make transfers that account for as much as 50 percent of the income of the poorest recipients, and have a budget ~ 0.5 percent of GDP
• Two recent evaluations of impact of cash transfers in Ecuador and Nicaragua• Ecuador: random assignment in roll-out of BDH program (Fernald and Hidrobo,
Social Science & Medicine 2011; Paxson and Schady, EDCC 2010)• Program resulted in an improvement of about 0.18 standard deviations in measures of cognitive and
socio-emotional development among the poorest quartile of children, with no effects among somewhat less poor children
• Effects are larger among older children, about 0.24 standard deviations
• Nicaragua: random assignment in Atención a Crisis pilot (Macours et al., AEJ: Applied 2012)
• Program improved the health, cognitive and social development of children 0-6 years of age by 0.10 standard deviations
• Among children aged 36 months and older, program effects are about twice as large, 0.19 standard deviations
• Effects are not larger among households randomly assigned to receive more cash• No fade-out of program effects 2 years later

ConclusionsThe knowledge base on ECD in Latin America and the Caribbean is still thinChild outcomes• Stunting is widespread in much of Central America and in the Andean countries• The evidence that is available on one measure of cognitive development suggests
substantial delays and steep SES gradients for children age 36-72 months in 5 countries in the region
• Many of these delays in language & cognition probably apparent earlier
Coverage and quality of services• The coverage of preschool for children age 4-5 has increased substantially,
especially among the poor• But there continue to be SES differences in access
• Very little is known about differences in the quality of preschool, and even less about the quality of services for children 0-3 years of age
• What little data are available (Brazil, Colombia, Ecuador) suggest that poor quality is a very serious concern
• The coverage of preschool for children ages 4 (and especially) 5 has grown dramatically in the past decade

ConclusionsImpact of interventions• Preschool appears to confer substantial benefits
– But good evidence to date limited to wealthier southern cone countries– Not much evidence on impact of center-based care for children 0-3
• Evaluations of community-based care that are available have methodological limitations• Growing evidence on impact of parenting & home-based early stimulation interventions
– Jamaican study suggests substantial potential– Colombian study finds positive effects, especially among somewhat older children– Ecuador study also finds benefits from at-scale program
• Lots of evidence from medical literature on importance of early health and nutritional status on child development, but surprisingly little evidence from the region on impact of large-scale programs
• Cash transfers appear to have some benefits– Changes in outcomes do not appear to be driven primarily by the cash, but we do not have a good
understanding why some programs appear to change behaviors
• In many cases, the impact of interventions is larger among somewhat older children• What do we learn from efficacy trials (like the Jamaica early stimulation research), pilots
(like the Nicaragua cash transfer) and evaluations of at-scale programs (like the evaluations of preschool in Argentina and Uruguay)?
Lots of exciting work under way!• Work underway to collect data on nationally representative samples of
children and multiple outcomes in Costa Rica, Ecuador, Nicaragua, Paraguay, Peru
• Impact of higher-quality kindergarten teachers on child learning in Ecuador
• Evaluation of pilot to provide early stimulation and parenting (either mothers or mothers + fathers) in Nicaragua
• Random assignment of slots in crèches in Rio, Brazil (follow-up 3-4 years later)
• Effects of preschool in Guatemala• Evaluation of Estancias Infantiles in Mexico• Application of Tools of the Mind in Chile


-1
-.8
-.6
-.4
-.2
0
.2
.4
.6
.8
1
39 42 45 48 51 54 57 60 63 66 69age in months
Ecuador
-1
-.8
-.6
-.4
-.2
0
.2
.4
.6
.8
1
39 42 45 48 51 54 57 60 63 66 69age in months
Colombia
-1
-.8
-.6
-.4
-.2
0
.2
.4
.6
.8
1
39 42 45 48 51 54 57 60 63 66 69age in months
Chile
-1
-.8
-.6
-.4
-.2
0
.2
.4
.6
.8
1
39 42 45 48 51 54 57 60 63 66 69age in months
Peru
-1
-.8
-.6
-.4
-.2
0
.2
.4
.6
.8
1
39 42 45 48 51 54 57 60 63 66 69age in months
Nicaragua
Rural areas
4th (poorest) quartile 1st (richest) quartile
-1
-.8
-.6
-.4
-.2
0
.2
.4
.6
.8
1
39 42 45 48 51 54 57 60 63 66 69age in months
Ecuador
-1
-.8
-.6
-.4
-.2
0
.2
.4
.6
.8
1
39 42 45 48 51 54 57 60 63 66 69age in months
Colombia
-1
-.8
-.6
-.4
-.2
0
.2
.4
.6
.8
1
39 42 45 48 51 54 57 60 63 66 69age in months
Chile
-1
-.8
-.6
-.4
-.2
0
.2
.4
.6
.8
1
39 42 45 48 51 54 57 60 63 66 69age in months
Peru
-1
-.8
-.6
-.4
-.2
0
.2
.4
.6
.8
1
39 42 45 48 51 54 57 60 63 66 69age in months
Nicaragua
Rural areas
4th (poorest) quartile 1st (richest) quartile
-1
-.8
-.6
-.4
-.2
0
.2
.4
.6
.8
1
39 42 45 48 51 54 57 60 63 66 69age in m onths
Ecuador
-1
-.8
-.6
-.4
-.2
0
.2
.4
.6
.8
1
39 42 45 48 51 54 57 60 63 66 69age in m onths
Colombia
-1
-.8
-.6
-.4
-.2
0
.2
.4
.6
.8
1
39 42 45 48 51 54 57 60 63 66 69age in m onths
Chile
-1
-.8
-.6
-.4
-.2
0
.2
.4
.6
.8
1
39 42 45 48 51 54 57 60 63 66 69age in m onths
Peru
-1
-.8
-.6
-.4
-.2
0
.2
.4
.6
.8
1
39 42 45 48 51 54 57 60 63 66 69age in m onths
Nicaragua
Rural areas
4th (poorest) quartile 1st (richest) quartile
-1
-.8
-.6
-.4
-.2
0
.2
.4
.6
.8
1
39 42 45 48 51 54 57 60 63 66 69age in months
Ecuador
-1
-.8
-.6
-.4
-.2
0
.2
.4
.6
.8
1
39 42 45 48 51 54 57 60 63 66 69age in months
Colombia
-1
-.8
-.6
-.4
-.2
0
.2
.4
.6
.8
1
39 42 45 48 51 54 57 60 63 66 69age in months
Chile
-1
-.8
-.6
-.4
-.2
0
.2
.4
.6
.8
1
39 42 45 48 51 54 57 60 63 66 69age in months
Peru
-1
-.8
-.6
-.4
-.2
0
.2
.4
.6
.8
1
39 42 45 48 51 54 57 60 63 66 69age in months
Nicaragua
Rural areas
4th (poorest) quartile 1st (richest) quartile
-1
-.8
-.6
-.4
-.2
0
.2
.4
.6
.8
1
39 42 45 48 51 54 57 60 63 66 69age in months
Ecuador
-1
-.8
-.6
-.4
-.2
0
.2
.4
.6
.8
1
39 42 45 48 51 54 57 60 63 66 69age in months
Colombia
-1
-.8
-.6
-.4
-.2
0
.2
.4
.6
.8
1
39 42 45 48 51 54 57 60 63 66 69age in months
Chile
-1
-.8
-.6
-.4
-.2
0
.2
.4
.6
.8
1
39 42 45 48 51 54 57 60 63 66 69age in months
Peru
Urban areas
4th (poorest) quartile 1st (richest) quartile
-1
-.8
-.6
-.4
-.2
0
.2
.4
.6
.8
1
39 42 45 48 51 54 57 60 63 66 69age in months
4th (poorest) quartile 1st (richest) quartile
Ecuador
-1
-.5
0
.5
1
39 42 45 48 51 54 57 60 63 66 69 72age in months
1st (poorest) quartile 95% CI
4th (richest) quartile 95% CI
1st Follow-up
-1
-.5
0
.5
1
39 42 45 48 51 54 57 60 63 66 69age in months
Baseline
-1
-.5
0
.5
1
89 92 95 98 101 104 107 110 113 116age in months
1st (poorest) quartile 95% CI
4th (richest) quartile 95% CI
2nd Follow-up
Perú
0.1
.2.3
-4 -2 0 2 4
Chile
0.1
.2.3
.4
-4 -2 0 2 4
Ecuador
0.1
.2.3
.4
-4 -2 0 2 4
Colombia
0.1
.2.3
.4
-4 -2 0 2 4
Peru
Kernel density estimates
Household survey sample TVIP sample
0.1
.2.3
-4 -2 0 2 4
Chile
0.1
.2.3
.4
-4 -2 0 2 4
Ecuador
0.1
.2.3
.4
-4 -2 0 2 4
Colombia
0.1
.2.3
.4
-4 -2 0 2 4
Peru
Kernel density estimates
Household survey sample TVIP sample
0.1
.2.3
-4 -2 0 2 4
Chile
0.1
.2.3
.4
-4 -2 0 2 4
Ecuador
0.1
.2.3
.4
-4 -2 0 2 4
Colombia
0.1
.2.3
.4
-4 -2 0 2 4
Peru
Kernel density estimates
Household survey sample TVIP sample
0.1
.2.3
-4 -2 0 2 4
Chile
0.1
.2.3
.4
-4 -2 0 2 4
Ecuador
0.1
.2.3
.4
-4 -2 0 2 4
Colombia
0.1
.2.3
.4
-4 -2 0 2 4
Peru
Kernel density estimates
Household survey sample TVIP sample
0.1
.2
.3
-4 -2 0 2 4
Chile
0.1.2.3.4
-4 -2 0 2 4
Ecuador
0.1
.2
.3
.4
-4 -2 0 2 4
Colombia
0.1
.2
.3
.4
-4 -2 0 2 4
Peru
Kernel density estimates
Household survey sample TVIP sample
0.1
.2
.3
.4
-4 -2 0 2 4
Chile
0.1
.2
.3
.4
-4 -2 0 2 4
Colombia
0.1
.2
.3
.4
-4 -2 0 2 4
Ecuador
0.1
.2
.3
.4
.5
-4 -2 0 2 4
Nicaragua
0.2
.4
.6
.8
-4 -2 0 2 4
Peru
Kernel density estimates
Household survey sample TVIP sample
0.1
.2.3
.4
-4 -2 0 2 4
Chile
0.1
.2.3
.4
-4 -2 0 2 4
Colombia
0.1
.2.3
.4
-4 -2 0 2 4
Ecuador
0.1
.2.3
.4.5
-4 -2 0 2 4
Nicaragua
0.2
.4.6
.8
-4 -2 0 2 4
Peru
Kernel density estimates
Household survey sample TVIP sample
-1
-.8
-.6
-.4
-.2
0
.2
.4
.6
.8
1
39 42 45 48 51 54 57 60 63 66 69age in months
Ecuador
-1
-.8
-.6
-.4
-.2
0
.2
.4
.6
.8
1
39 42 45 48 51 54 57 60 63 66 69age in months
Colombia
-1
-.8
-.6
-.4
-.2
0
.2
.4
.6
.8
1
39 42 45 48 51 54 57 60 63 66 69age in months
Chile
-1
-.8
-.6
-.4
-.2
0
.2
.4
.6
.8
1
39 42 45 48 51 54 57 60 63 66 69age in months
Peru
-1
-.8
-.6
-.4
-.2
0
.2
.4
.6
.8
1
39 42 45 48 51 54 57 60 63 66 69age in months
Nicaragua
Rural areas
4th (poorest) quartile 1st (richest) quartile
-1
-.8
-.6
-.4
-.2
0
.2
.4
.6
.8
1
39 42 45 48 51 54 57 60 63 66 69age in months
Ecuador
-1
-.8
-.6
-.4
-.2
0
.2
.4
.6
.8
1
39 42 45 48 51 54 57 60 63 66 69age in months
Colombia
-1
-.8
-.6
-.4
-.2
0
.2
.4
.6
.8
1
39 42 45 48 51 54 57 60 63 66 69age in months
Chile
-1
-.8
-.6
-.4
-.2
0
.2
.4
.6
.8
1
39 42 45 48 51 54 57 60 63 66 69age in months
Peru
-1
-.8
-.6
-.4
-.2
0
.2
.4
.6
.8
1
39 42 45 48 51 54 57 60 63 66 69age in months
Nicaragua
Rural areas
4th (poorest) quartile 1st (richest) quartile
-1
-.8
-.6
-.4
-.2
0
.2
.4
.6
.8
1
39 42 45 48 51 54 57 60 63 66 69age in m onths
Ecuador
-1
-.8
-.6
-.4
-.2
0
.2
.4
.6
.8
1
39 42 45 48 51 54 57 60 63 66 69age in m onths
Colombia
-1
-.8
-.6
-.4
-.2
0
.2
.4
.6
.8
1
39 42 45 48 51 54 57 60 63 66 69age in m onths
Chile
-1
-.8
-.6
-.4
-.2
0
.2
.4
.6
.8
1
39 42 45 48 51 54 57 60 63 66 69age in m onths
Peru
-1
-.8
-.6
-.4
-.2
0
.2
.4
.6
.8
1
39 42 45 48 51 54 57 60 63 66 69age in m onths
Nicaragua
Rural areas
4th (poorest) quartile 1st (richest) quartile
-1
-.8
-.6
-.4
-.2
0
.2
.4
.6
.8
1
39 42 45 48 51 54 57 60 63 66 69age in months
Ecuador
-1
-.8
-.6
-.4
-.2
0
.2
.4
.6
.8
1
39 42 45 48 51 54 57 60 63 66 69age in months
Colombia
-1
-.8
-.6
-.4
-.2
0
.2
.4
.6
.8
1
39 42 45 48 51 54 57 60 63 66 69age in months
Chile
-1
-.8
-.6
-.4
-.2
0
.2
.4
.6
.8
1
39 42 45 48 51 54 57 60 63 66 69age in months
Peru
-1
-.8
-.6
-.4
-.2
0
.2
.4
.6
.8
1
39 42 45 48 51 54 57 60 63 66 69age in months
Nicaragua
Rural areas
4th (poorest) quartile 1st (richest) quartile
-1
-.8
-.6
-.4
-.2
0
.2
.4
.6
.8
1
39 42 45 48 51 54 57 60 63 66 69age in months
Ecuador
-1
-.8
-.6
-.4
-.2
0
.2
.4
.6
.8
1
39 42 45 48 51 54 57 60 63 66 69age in months
Colombia
-1
-.8
-.6
-.4
-.2
0
.2
.4
.6
.8
1
39 42 45 48 51 54 57 60 63 66 69age in months
Chile
-1
-.8
-.6
-.4
-.2
0
.2
.4
.6
.8
1
39 42 45 48 51 54 57 60 63 66 69age in months
Peru
Urban areas
4th (poorest) quartile 1st (richest) quartile
-1
-.8
-.6
-.4
-.2
0
.2
.4
.6
.8
1
39 42 45 48 51 54 57 60 63 66 69age in months
4th (poorest) quartile 1st (richest) quartile
Ecuador
-1
-.5
0
.5
1
39 42 45 48 51 54 57 60 63 66 69 72age in months
1st (poorest) quartile 95% CI
4th (richest) quartile 95% CI
1st Follow-up
-1
-.5
0
.5
1
39 42 45 48 51 54 57 60 63 66 69age in months
Baseline
-1
-.5
0
.5
1
89 92 95 98 101 104 107 110 113 116age in months
1st (poorest) quartile 95% CI
4th (richest) quartile 95% CI
2nd Follow-up
Perú
0.1
.2.3
-4 -2 0 2 4
Chile
0.1
.2.3
.4
-4 -2 0 2 4
Ecuador
0.1
.2.3
.4
-4 -2 0 2 4
Colombia
0.1
.2.3
.4
-4 -2 0 2 4
Peru
Kernel density estimates
Household survey sample TVIP sample
0.1
.2.3
-4 -2 0 2 4
Chile
0.1
.2.3
.4
-4 -2 0 2 4
Ecuador
0.1
.2.3
.4
-4 -2 0 2 4
Colombia
0.1
.2.3
.4
-4 -2 0 2 4
Peru
Kernel density estimates
Household survey sample TVIP sample
0.1
.2.3
-4 -2 0 2 4
Chile
0.1
.2.3
.4
-4 -2 0 2 4
Ecuador
0.1
.2.3
.4
-4 -2 0 2 4
Colombia
0.1
.2.3
.4-4 -2 0 2 4
Peru
Kernel density estimates
Household survey sample TVIP sample
0.1
.2.3
-4 -2 0 2 4
Chile
0.1
.2.3
.4
-4 -2 0 2 4
Ecuador
0.1
.2.3
.4
-4 -2 0 2 4
Colombia
0.1
.2.3
.4
-4 -2 0 2 4
Peru
Kernel density estimates
Household survey sample TVIP sample
0.1
.2
.3
-4 -2 0 2 4
Chile
0.1.2.3.4
-4 -2 0 2 4
Ecuador
0.1
.2
.3
.4
-4 -2 0 2 4
Colombia
0.1
.2
.3
.4
-4 -2 0 2 4
Peru
Kernel density estimates
Household survey sample TVIP sample
0.1
.2
.3
.4
-4 -2 0 2 4
Chile
0.1
.2
.3
.4
-4 -2 0 2 4
Colombia
0.1
.2
.3
.4
-4 -2 0 2 4
Ecuador
0.1
.2
.3
.4
.5
-4 -2 0 2 4
Nicaragua
0.2
.4
.6
.8
-4 -2 0 2 4
Peru
Kernel density estimates
Household survey sample TVIP sample
0.1
.2.3
.4
-4 -2 0 2 4
Chile
0.1
.2.3
.4
-4 -2 0 2 4
Colombia
0.1
.2.3
.4
-4 -2 0 2 4
Ecuador
0.1
.2.3
.4.5
-4 -2 0 2 4
Nicaragua
0.2
.4.6
.8
-4 -2 0 2 4
Peru
Kernel density estimates
Household survey sample TVIP sample
Distribution of wealth in survey used to calculate TVIP scores and nationally-representative surveys
Child health and development
Back