ece 4710: lecture #3 1 signals & noise received waveform contains the desired signal and the...
TRANSCRIPT
ECE 4710: Lecture #3 1
Signals & Noise
Received waveform contains the desired signal and the undesired noise
We will use deterministic waveforms (not random) to mathematically model signals
Important signal and noise properties DC and RMS levels Average Power Bandwidth Magnitude and Phase Spectrums Power Spectral Density (PSD)
ECE 4710: Lecture #3 2
Signal Properties
Received waveform is an electrical signal and is either a time-varying voltage, v(t), or current, i(t)
Book uses general notation of w(t) to represent either voltage or current
Properties of physically realizable waveforms: Significant amplitudes over finite time interval
» Real signals and systems exist for finite amount of time Significant spectral amplitudes over finite frequency
interval» Any channel (coax, wireless, etc.) has finite BW
ECE 4710: Lecture #3 3
Signal Properties
Properties of physically realizable waveforms: Waveform is continuous function of time Waveform has finite peak values
» Physical devices destroyed with infinite peak values Waveform has only real values
» Complex math used to represent signal properties such as phase
Math models that violate some of these conditions can and will be used Simplifies analysis and yields correct results if done
properly
ECE 4710: Lecture #3 4
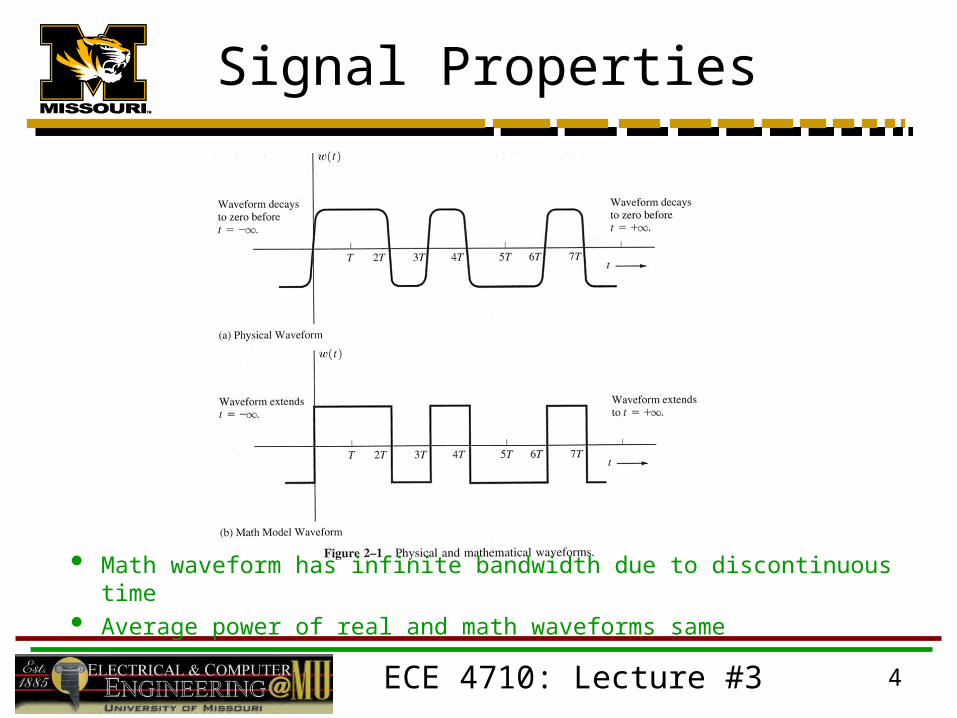
Math waveform has infinite bandwidth due to discontinuous time Average power of real and math waveforms same
Signal Properties

ECE 4710: Lecture #3 5
Time Averages
Time average operator, , is
Power and Energy Signals Power: periodic signals from - to + with infinite energy
» Not physically realizable but useful model over finite time intervals
Energy: non-periodic (aperiodic) signals with finite energy» Use power signals over finite time to model
dtT
T
TT
2/
2/
1lim
ECE 4710: Lecture #3 6
Time Averages
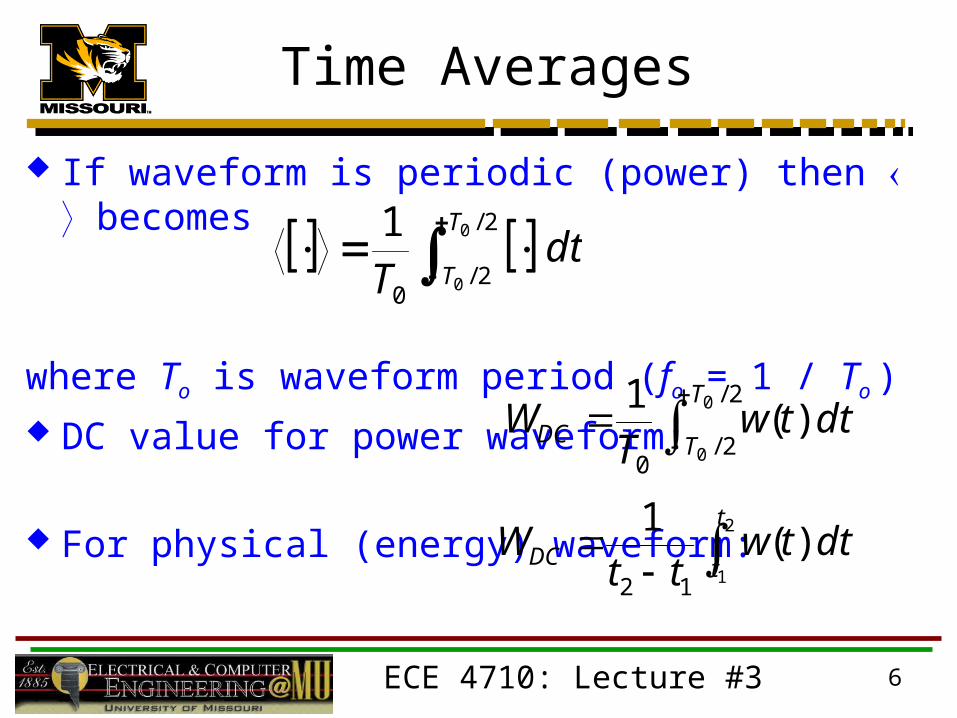
If waveform is periodic (power) then becomes
where To is waveform period (fo = 1 / To ) DC value for power waveform:
For physical (energy) waveform:
dtT
T
T
2/
2/0
0
0
1
dttwT
WT
TDC
2/
2/0
0
0
)(1
dttwtt
Wt
tDC 2
1
)(1
12
ECE 4710: Lecture #3 7
Power
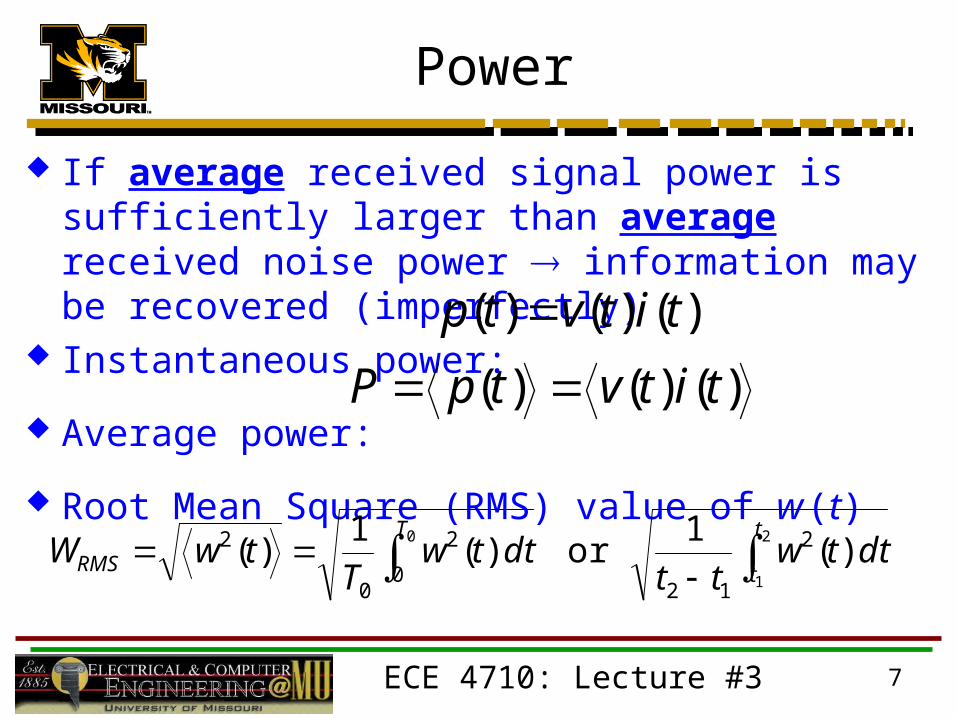
If average received signal power is sufficiently larger than average received noise power information may be recovered (imperfectly)
Instantaneous power:
Average power:
Root Mean Square (RMS) value of w (t)
)()()( titvtp
)()()( titvtpP
dttwtt
dttwT
twWt
t
T
RMS 2
1
0)(
1or)(
1)( 2
120
2
0
2
ECE 4710: Lecture #3 8
Power & Energy
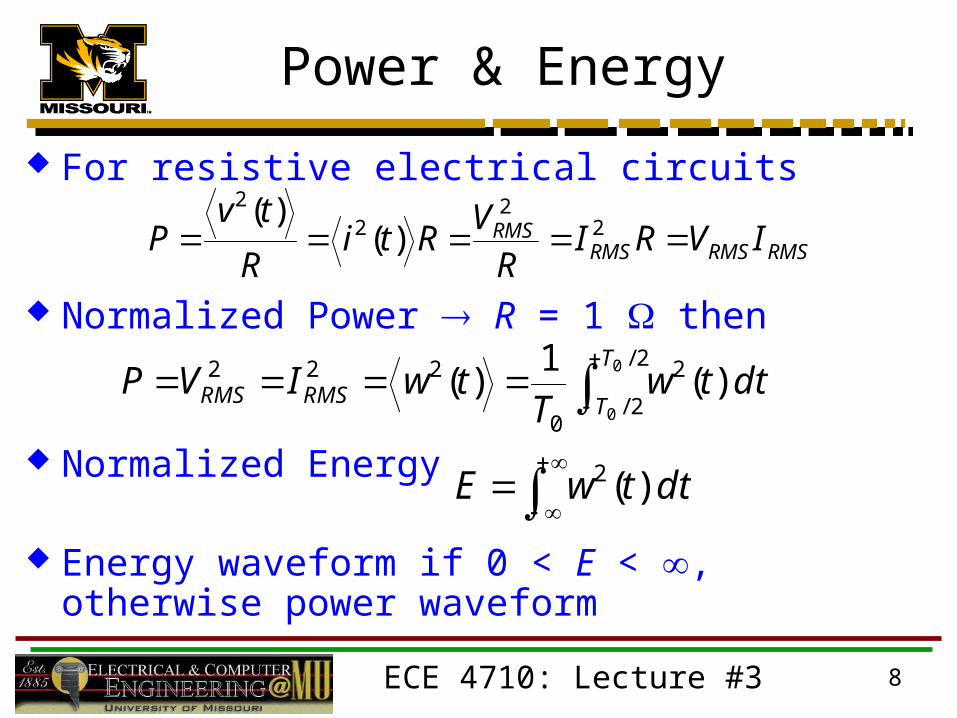
For resistive electrical circuits
Normalized Power R = 1 then
Normalized Energy
Energy waveform if 0 < E < , otherwise power waveform
RMSRMSRMSRMS IVRIR
VRti
R
tvP 2
22
2
)()(
dttwT
twIVPT
TRMSRMS
2/
2/
2
0
222 0
0
)(1
)(
dttwE
)(2
ECE 4710: Lecture #3 9
Example
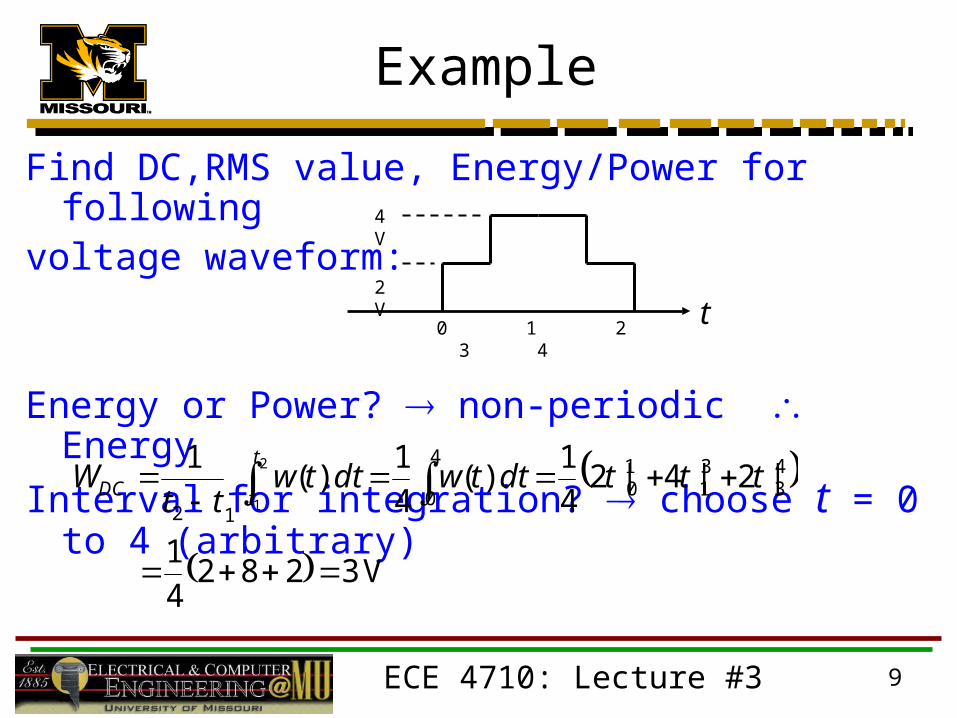
Find DC,RMS value, Energy/Power for followingvoltage waveform:
Energy or Power? non-periodic Energy
Interval for integration? choose t = 0 to 4 (arbitrary)
V32824
1
|2|4|24
1)(
4
1)(
1 43
31
10
4
012
2
1
tttdttwdttwtt
Wt
tDC
0 1 2 3 4 t
4 V
2 V
ECE 4710: Lecture #3 10
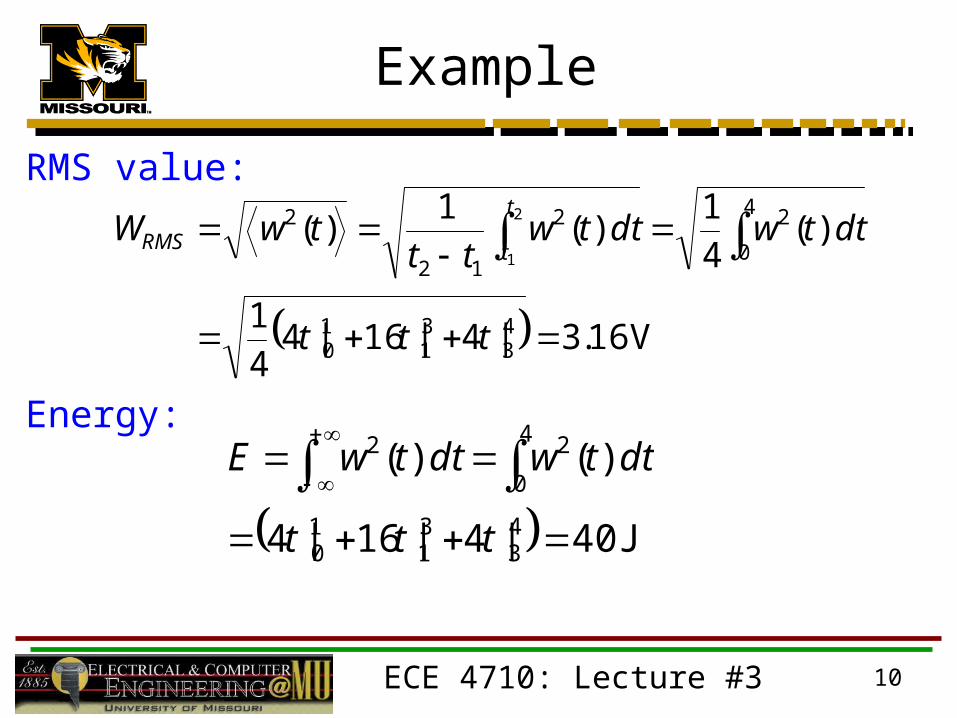
Example
RMS value:
Energy:
V16.3|4|16|44
1
)(4
1)(
1)(
43
31
10
4
0
22
12
2 2
1
ttt
dttwdttwtt
twWt
tRMS
J40|4|16|4
)()(
43
31
10
4
0
22
ttt
dttwdttwE
ECE 4710: Lecture #3 11
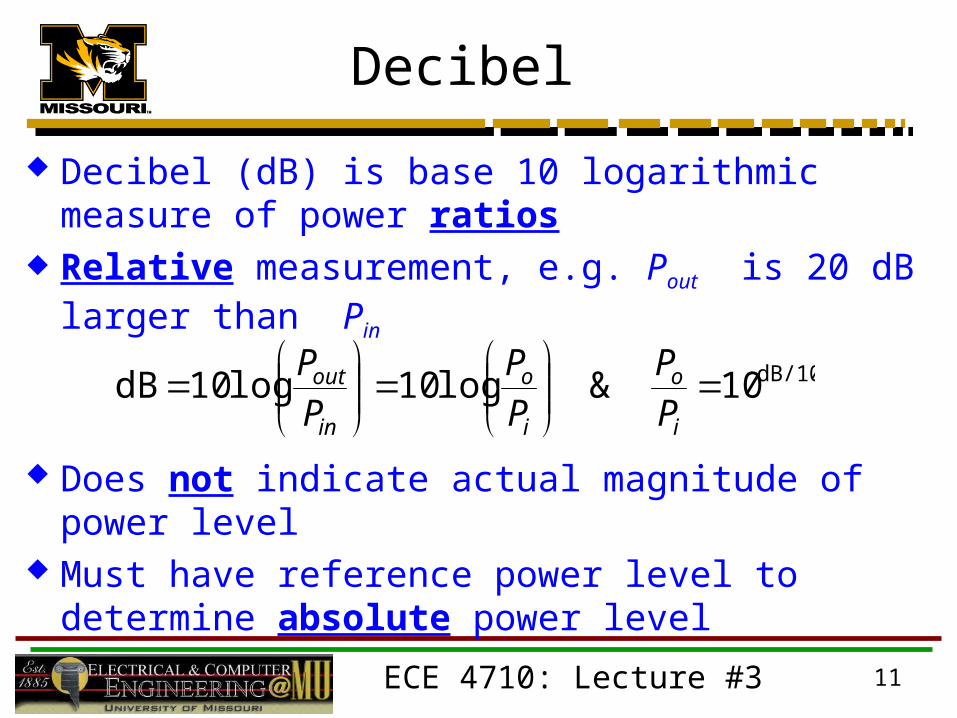
Decibel
Decibel (dB) is base 10 logarithmic measure of power ratios
Relative measurement, e.g. Pout is 20 dB larger than Pin
Does not indicate actual magnitude of power level Must have reference power level to determine absolute power level
dB/1010&log10log10dB
i
o
i
o
in
out
P
P
P
P
P
P
ECE 4710: Lecture #3 12
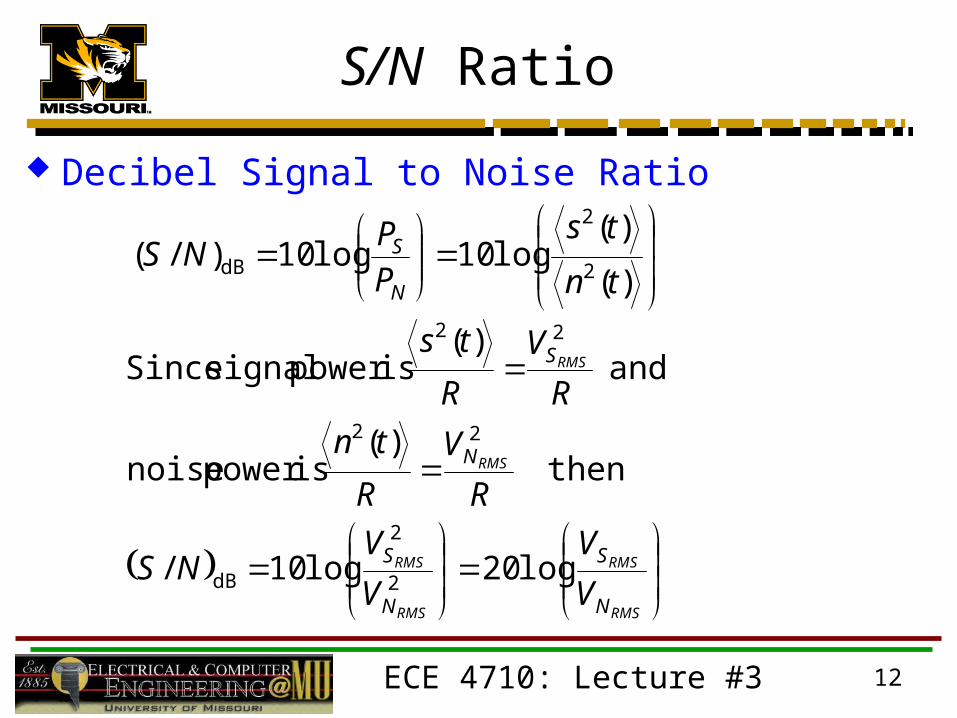
S/N Ratio
Decibel Signal to Noise Ratio
)(
)(log10log10)/(
2
2
dBtn
ts
P
PNS
N
S
RMS
RMS
RMS
RMS
RMS
RMS
N
S
N
S
N
S
V
V
V
VNS
R
V
R
tn
R
V
R
ts
log20log10/
then)(
ispower noise
and )(
ispower signal Since
2
2
dB
22
22
ECE 4710: Lecture #3 13
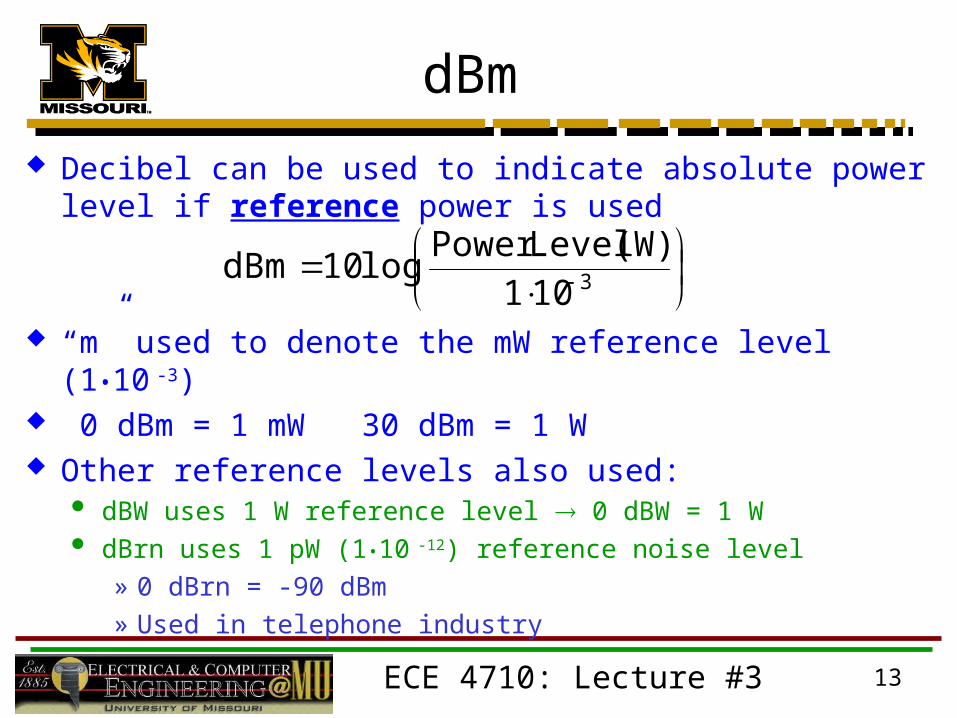
dBm
Decibel can be used to indicate absolute power level if reference power is used
“m” used to denote the mW reference level (1•10 -3)
0 dBm = 1 mW 30 dBm = 1 W Other reference levels also used:
dBW uses 1 W reference level 0 dBW = 1 W dBrn uses 1 pW (1•10
-12) reference noise level » 0 dBrn = -90 dBm » Used in telephone industry
3101
(W) LevelPower log10dBm
ECE 4710: Lecture #3 14
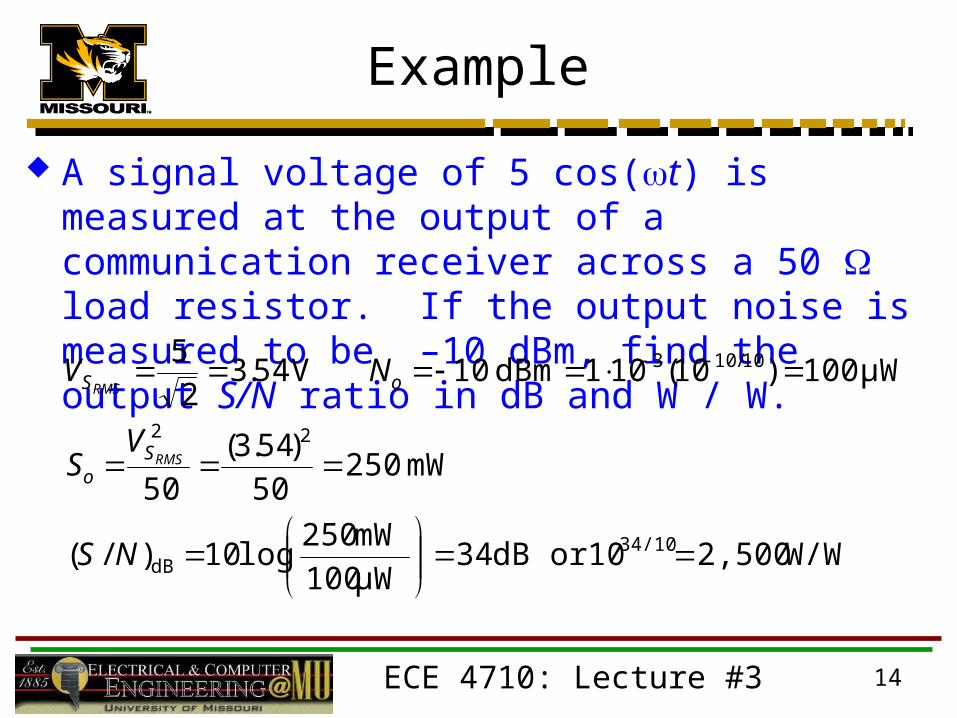
Example
A signal voltage of 5 cos(t) is measured at the output of a communication receiver across a 50 load resistor. If the output noise is measured to be –10 dBm, find the output S/N ratio in dB and W / W.
W/W2,50010or dB 34μW100
mW 250log10)/(
mW 25050
)54.3(
50
μW100)10(101dBm10 V54.32
5
34/10dB
22
10/103
NS
VS
NV
RMS
RMS
So
oS
ECE 4710: Lecture #3 15
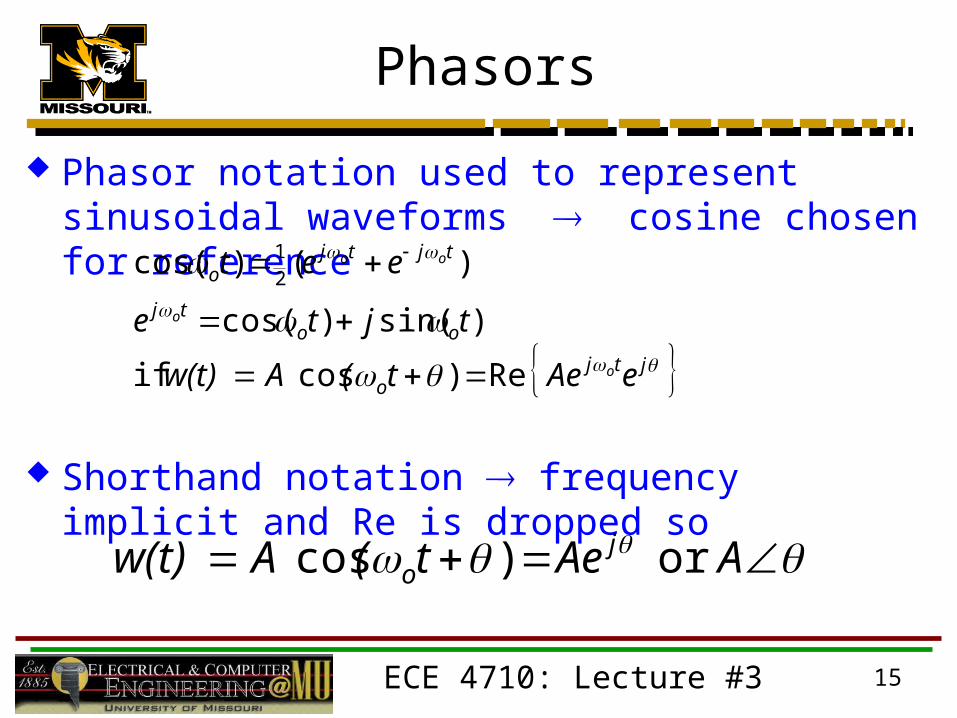
Phasors
Phasor notation used to represent sinusoidal waveforms cosine chosen for reference
Shorthand notation frequency implicit and Re is dropped so
jtjo
ootj
tjtjo
eAet( A w(t)
tjte
eet
o
o
oo
Re)cos if
)sin()cos(
)()cos(21
AAet( A w(t) jo or )cos