ecen 615 methods of electric power systems analysis...
TRANSCRIPT

Lecture 15: August 14, 2003 Blackout
ECEN 615Methods of Electric Power Systems Analysis
Prof. Tom Overbye
Dept. of Electrical and Computer Engineering
Texas A&M University
Announcements
• Read Chapter 7 (the term reliability is now used instead
of security)
• Midterm exam is Oct 18 in class
• Off campus students should work with Iyke to get their exam
proctoring setup
• Closed book, closed notes, but calculators and one 8.5 by 11
inch note sheet allowed
• Exam covers up to the end of today’s lecture
• Book material is intended to be supplementary; nothing from
the book not covered in class or homework will be on the exam
2

Blackouts
• Blackouts are costly, with
some estimates of costs above
$100 billion per year.
• But blackouts are not created
equal. Some are unavoidable due
to large scale system damage
(hurricanes, tornados and ice
storms). Most are local,
distribution issues.
3

Avoidable Transmission Level Blackouts
• Many major blackouts can be prevented.
• Time frames of the blackouts, minutes to hours,
allow for human intervention
• Tokyo 1987 (20 minutes), WECC 1996 (six minutes),
Eastern Interconnect 2003 (about an hour), Italy 2003 (25
minutes)
• And of course many are prevented, and hence do
not make the news. For example, near voltage
collapse in Delmarva Peninsula, 1999.
4

Going Back in Time
• The August 14th 2003 blackout is rapidly moving from
being a “recent event” into history; yet it still has much
to teach us.
• This talk is about the past and the future: what can we
learn from the past to help us prepare for the future
• But not so much about what are the immediate lessons from
the Blackout since many recommendations have already been
put into practice.
• The blackout final report is very readable and available
by googling “August 14 2003 Blackout Report”
5

6
In contrasting
numbers, the
August 14 2003
Blackout hit about
50 million people,
while Hurricane
Irene caused
power outages
affecting perhaps
seven or
eight million.

August 14, 2003 Hoax Image
7
This image was
widely circulated
immediately after
the blackout, even
appearing for a
time on a DOE
website. It was
quickly shown
to be a hoax.
What might
immediately give it
away?

Actual Before and After Images
8

Causes of the Blackout
• Blackout Final Report listed four causes
• FirstEnergy (FE) did not understand inadequacies of their
system, particularly with respect to voltage instability.
• Inadequate situational awareness by FE
• FE failed to adequately manage their tree growth
• Failure of the grid reliability organizations (primarily
MISO) to provide effective diagnostic support
• Human/cyber interactions played a key role
9

We’ve Come Quite a Ways Since 2003
• Report included 46 recommendations, many of which
have dramatically changed the operation of the
interconnected power grid
• Thirteen were focused on physical and cyber security
• Focus of talk is what can 8/14/03 teach us to help
with the grid in 2013
• Need to keep in mind economic impact of 8/14/03
was above $5 billion; yearly impact of blackouts
could be above $100 billion
10

First Energy Control Center, Recent (late 2000’s)
11Photo source: http://blog.cleveland.com/business/2008/12/firstenergy_corp_rejects_puco.html

My Involvement in Blackout Investigation
• I spend a lot of time talking to reporters on 8/14 to
8/16, before I knew what happened
• Tasked by DOE to do onsite visit to FE on 8/19 to
8/21 with Doug Wiegmann; did similar visit to MISO
the next week.
• Did return visit in Oct
• Many folks played far
larger roles; I was only
involved extensively early
on
12

Footprints of Reliability Coordinators in Midwest
13

August 13, 2003
• It is important to realize that immediately before the
blackout few people thought the system was on the
verge of a catastrophe.
• NERC 2003 Summer
Assessment did not
list Ohio as an area
of particular concern
14NERC 2003 Summer Assessement is available at http://www.nerc.com/files/summer2003.pdf

August 14, 2003: Pre-blackout (before 14:30 EDT)
• It had mostly been a normal summer day at First
Energy
• Most generation was available though the 883 MW Davis-
Besse Nuclear unit was on a long-term outage
• At 13:31 EDT the Eastlake 5 unit (a 597 MW plant on Lake
Erie) tripped when the operator tried to up is reactive output,
but this was not seen as a severe event
• It had been a busy day at MISO, with their reliability
coordinators dealing with a relatively small outage in
Indiana around noon
• Their state estimator failed at 1215 EDT but no one know this
15

Cinergy Bedford-Columbus 345 kV Line Tree Contact at 12:08 EDT
16

Trees were Finally “Trimmed” Two Months Later
17

At 14:27 EDT Star-South Canton 345 kV Line Trips and Recloses
• Star-South Canton is a tie between AEP & FE
• FE missed seeing this event since their alarms had
hung several minutes earlier (14:14)• Line was back in service so it appeared normal in SCADA
• FE IT folks knew about computer problems
• AEP called FE at 14:32 to check on event; FE says
they saw nothing. A repeat call by AEP to FE at
15:19 also discusses event indicating ground current
was detected.
18

Estimated High Level Voltage Profile at 15:00 EDT
19

Estimated Flows in Northeast Ohio at 15:00 EDT on August 14th 2003
20
Chamberlin-
Harding
345 kV Line
trips at 15:05,
an event
that was
missed by
both FE and
MISO

Chamberlin-Harding was NOT on the ECAR Map (but was on FE’s Maps)
21Transmission maps are available at www.eia.gov/state/maps.php

Estimated Flows in Northeast Ohio at 15:06 EDT
22

Line Outage Distribution Factors (LODFs)
• LODFs are used to approximate the change in the flow
on one line caused by the outage of a second line
• typically they are only used to determine the change in the
MW flow
• LODFs are used extensively in real-time operations
• LODFs are state-independent (calculated using dc power
flow approximations) but do dependent on the assumed
network topology
• Below value tells change of real power flow on line for the
assumed outage of line k; ƒk0 is (obviously) pre-contingent
23
0,k kf d f

Flowgates
• The real-time loading of the power grid is accessed
via “flowgates”
• A flowgate “flow” is the real power flow on one or
more transmission element for either base case
conditions or a single contingency
• contingent flows are determined using LODFs
• Flowgates are used as proxies for other types of
limits, such as voltage or stability limits
• Flowgates are calculated using a spreadsheet
24

Flowgate #2265
• Flowgate 2265 monitors the flow on FE’s Star-
Juniper 345 kV line for contingent loss of the
Hanna-Juniper 345 Line
• normally the LODF for this flowgate is 0.361
• flowgate has a limit of 1080 MW
• at 15:05 EDT the flow as 517 MW on Star-Juniper, 1004
MW on Hanna-Juniper, giving a flowgate value of
520+0.361*1007=884 (82%)
• Chamberlin-Harding 345 opened at 15:05; FE and MISO
all missed seeing this
25

The Bad LODF that Maybe Blacked Out the Northeast
• At 15:06 EDT (after loss of Chamberlin-Harding
345) #2265 has an incorrect value because its
LODF was not automatically updated.
• Value should be 633+0.463*1174=1176 (109%)
• Value was 633 + 0.361*1174=1057 (98%)
• At 15:32 the flowgate’s contingent line opened,
causing the flowgate to again show the correct
value, about 107%
26

Flows at 15:33 EDT
27

Northeast Ohio 138 kV Voltage Contour: 15:33 EDT
28

IT Issues
• MISO RCs had gotten many hundreds of “alarms”
• Contingency analysis results were giving pages of
violations.
• SE would fail because of severe system stress
• Inadequate procedures for dealing with SE failure.
• FE control center would get “many phone calls;”
information was not effectively shared.
29

Flows in Northeast Ohio at 15:46 EDT on August 14th 2003
30
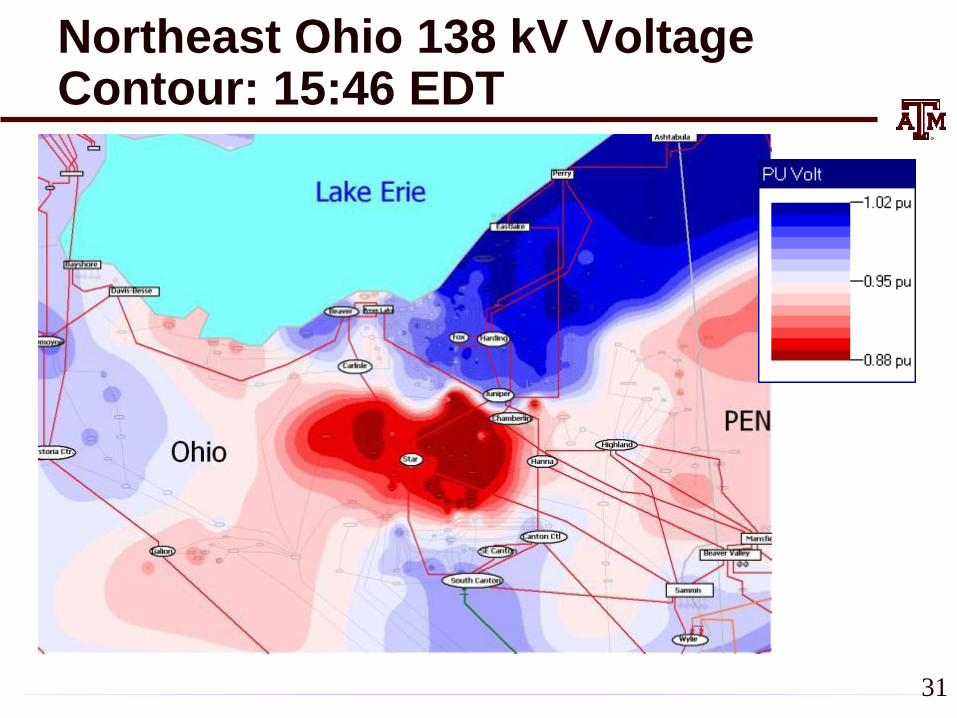
Northeast Ohio 138 kV Voltage Contour: 15:46 EDT
31

What Could Have Been Done?Sammis-Star Flow Sensitivities
32
DOE/NERC
report said
about
1500 MW
of load
shed were
needed

Flows in Northeast Ohio at 16:05 EDT on August 14th 2003
33

Northeast Ohio 138 kV Voltage Contour: 16:05 EDT
34

Path to Cleveland Blocked after Loss of Sammis-Star 16:05:57
35
Remaining
Paths

345 kV Lines Trip Across Ohio to West at 16:09
36
ONTARIO
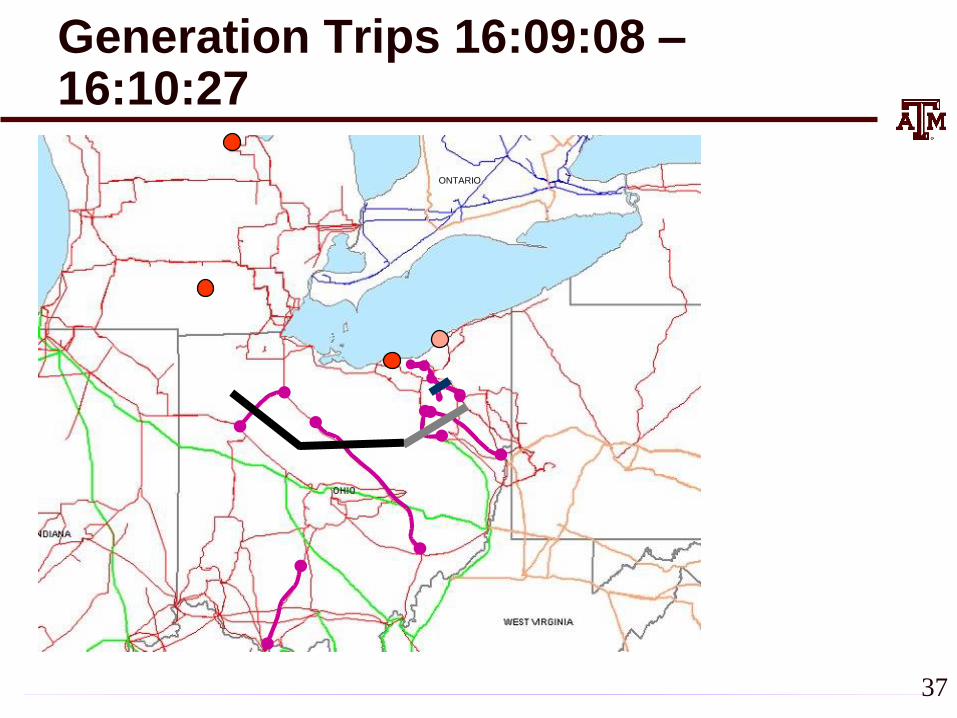
Generation Trips 16:09:08 –16:10:27
37
ONTARIO

Parts of Ohio/Michigan Served Only from Ontario after 16:10:37
38

Major Power Reversal: 16:10:38
39

Ontario/Michigan Interface Flows and Voltage
40

Ties from PJM to New York Open: 16:10:44 (North Ohio Black)
41

System Islands Break Up and Collapse: 16:10-16:13
42
Areas Affected by the Blackout
Service maintained
in some area
Some Local Load
Interrupted

Are DC LODFs Accurate?August 14th Crash Test
• Here are some results from August 14th
43
Time Contingency Element LODF MW (pred) MW (act)
15:05 Chamberlin-
Harding 345
Hanna-Juniper
345
0.362 179 176
15:32 Hanna-Juniper 345 Star-Juniper
345
0.465 545 527
15:46 CantonCentral-
Cloverdale 138
Sammis-Star
345
0.164 48 54
15:46 same Cloverdale-Star
138
0.234 68 64
16:06 Sammis-Star 345
Star-Urban 138
W.Canton-Dale 138
Star-Juniper
345
numerous 517 676
16:06 same Ashtabula-
Perry 345
numerous 319 408

The Results are Actually Quite Good!
• The initial LODF values were accurate to within
a few percent
• Even after more than a dozen contingencies, with
many voltages well below 0.9 pu, the purely DC
LODF analysis was giving fairly good (with
25%) results
44
What Could Have Occurred on August 14th?
• With 20/20 Hindsight the blackout probably could
have been prevented. A smarter grid might have
provided the necessary situational awareness, and/or
provided the dynamic load reduction necessary to keep
the system from cascading.
• But key issues are 1) which grid improvement costs are
cost justified, and 2) what are we missing?
45

How Could a Smart Grid Help?
• Under frequency and under voltage relays can provide
quick reduction in the load, but they need to be smart
enough to make the right decision
• Dynamic pricing (LMPs) can help customers make
economic decisions, but they depend upon a variety of
“advanced applications” in order to calculate the
LMPs: state estimation converging to provide the
model for the SCOPF
46

Some Thoughts on Current Needs
• The data used in the models for interconnect wide
studies still have significant problems
• In US we have 90GW of wind resources, but do not
always have adequate models for transient stability
studies; there are also potential low voltage ride
through issues with solar
• Power grid is rapidly changing which can result in
some operational “surprises”
• High impact, low frequency events are a concertn
• We need people with a deep knowledge of power
systems and (fill in the blank)!47