ecg signal denoising by using least-mean-square and ...using matlab®. these noisesare then added to...
TRANSCRIPT

ISSN No: 2348-4845
Volume No: 2 (2015), Issue No: 7 (July) July 2015 www.ijmetmr.com Page 640
International Journal & Magazine of Engineering, Technology, Management and Research
A Peer Reviewed Open Access International Journal
These noise and interference makesthe incorrect diag-nosis of the ECG signal [1-3]. So, theremoval of these noise and interference from the ECG signalhas become very crucial. Different types of digital filters (FIRand IIR) have been used to solve the problem [3-5]. However,it is difficult to apply these filters with fixed coefficients toreduce different types of noises, because the ECG sig-nal isknown as a non-stationary signal. Recently, adap-tive filteringhas Become effective and popular methods for processing andanalysis of the ECG signal [6-8]. It is well known thatadaptive filters with least mean square (LMS) algorithm showgood performance for process-ing and analysis of signal whichare non-stationary [1]. And in this study, we have usedadaptive LMS and nor-malized least mean square (NLMS)filter to denoise the ECG signal. We also have evaluated theirperformance. But it is shown that NLMS filter removes allspecified noise (mentioned above) more significantly.
II. MATERIALS AND METHODS:
The original ECG signal is taken from the MIT-BIHar-rhythmia database [9]. The different types of noise sig-nal aregenerated by using MATLAB®. The noise signal is then addedwith the real ECG signal. To remove the different types ofnoises, the noisy ECG signal is then pass through two adaptivefilter algorithms (e.g., LMS and NLMS). However, the basicblock diagram for un-derstanding the overall adaptive filteringprocess is de-picted in Fig. 1.
Figure1. Principle of adaptive filter[7].
Abstract:
Electrocardiogram (ECG) is a method of measuringthe electrical activities of heart. Every portion of ECG is veryessential for the diagnosis of different cardiac problems. But theamplitude and duration of ECG signal is usually corrupted bydifferent noises. In this paper we have done a broader study fordenoising every types of noise involved with real ECG signal.Two adaptive filters, such as, least-mean-square (LMS) andnormalized-least-mean-square (NLMS) are applied to remove thenoises. For better clarification simulation results are compared interms of different performance parameters such as, powerspectral density (PSD), spectrogram, frequency spectrum andconvergence. SNR, %PRD and MSE perfor-mance parameter arealso estimated. Signal Processing Toolbox built in MATLAB® isused for simulation, and, the simulation result clarifies thatadaptive NLMS filter is an excellent method for denoising theECG signal.
I. INTRODUCTION:
ECG is generated by the heart muscle and measured on theskin surface of the body. When the electrical abnor-malities ofthe heart occur, the heart cannot pump and supply enoughblood to the body and brain. As ECG is a graphical recordingof electrical impulses generated by heart, it is needed to bedone when chest pain oc-curred such as heart attack, shortnessof breath, faster heartbeats, high blood pressure, highcholesterol and to check the heart’s electrical activity. AnECG is very sensitive, different types of noise and interference-can corrupt the ECG signal as the real amplitude and durationof the signal can be changed. ECG signals are mostly affected by white noise, colored noise, elec-trode movement noise,muscle artifact noise, baseline wander, composite noise andpower line interference.
R.KarthikaVijay Rural Engineering College,
Nizamabad.
K.Narender, M.Tech Vijay Rural Engineering College,
Nizamabad.
Dr.B.R.VikramM.E, Ph.D, MIEEE, LMISTE,
Vijay Rural Engineering College,Nizamabad.
ECG Signal Denoising by Using Least-Mean-Square and Normalised-Least-Mean-Square Algorithm Based
Adaptive Filter

ISSN No: 2348-4845 ISSN No: 2348-4845
Volume No: 2 (2015), Issue No: 7 (July) July 2015 www.ijmetmr.com Page 641
International Journal & Magazine of Engineering, Technology, Management and Research
A Peer Reviewed Open Access International Journal
III. RESULTS AND DISCUSSION:
The 13 beat real ECG signal is taken from the MIT-BI-Harrhythmia database [9] whose sampling number is 4000 andamplitude is 1 mV. The different types of nois-es such as whitenoise, colored noise, muscle artifact, base line wander,electrode movement noise, compos-ite noise and power lineinterference are generated by using MATLAB®. These noisesare then added to the real ECG signal to get the desired mixedsignal. Finally, the noise is removed using two differentadaptive fil-ters based on LMS and NLMS algorithm. Theresults are shown in Fig. 2. If the amplitude of thereconstructed signal increases,(e)
The block diagram indicates that, if the value of N(n) isknown, then after subtracting this from the mixed signal d(n),the original signal X(n) is obtained. But it is difficult due tothe harmonics of noise signal. For this reason an estimatednoise signal N´(n) is calculated through some filters andmeasureable noise source S(n). If N´(n) is more close to N(n),then the estimated desired signal is X´(n) more close to theOriginal signal X(n).Mathematically the output is given bye = X + N – y (1) (b) The power or energy of this signal is computed by squaring it
The LMS algorithm produces the least mean square of theerror signal by changing the filter tap weight, who-secoefficient updating equation is
Where, μ is an appropriate step size to be chosen as 0 < μ <0.2 for the convergence. The larger steps sizes make thecoefficients to fluctuate widely and the LMS algorithmexperiences a problem with gradient noise amplification,which can be solved by the normalization of the step size. Thisvariant of the MS algorithm, with normalization of the stepsize, is called Normalized LMS (NLMS) algorithm, whosecoefficient updating equa-tion is
Volume No: 2 (2015), Issue No: 7 (July) July 2015 www.ijmetmr.com Page 642
International Journal & Magazine of Engineering, Technology, Management and Research
A Peer Reviewed Open Access International Journal
Figure2. Graphical representation of LMS filtering sig-nal forμ=0.007 and NLMS filtering signal for μ=1 after removing (a)White Gaussian noise, (b) Colored noise, (c) Real muscle artifactnoise, (d) Real electrode move-ment noise, (e) Real baseline wandernoise, (f) Com-posite noise, and (g) Power line interference.
Then there will be high distortion and vice versa. When thevalue of μ equal to 0.007, then we see that some noise alsoappear on the signal peak compared with the value of μ equalto 0.001.But when the value of μ is 0.001, then thereconstructed signal amplitude is less than the original signalas well as all other measuring values, such as, the SNR,%PRD decreases with low dis-tortion. So we can say that the SNR for step size μ of 0.007 is better but exhibits somedistortion.
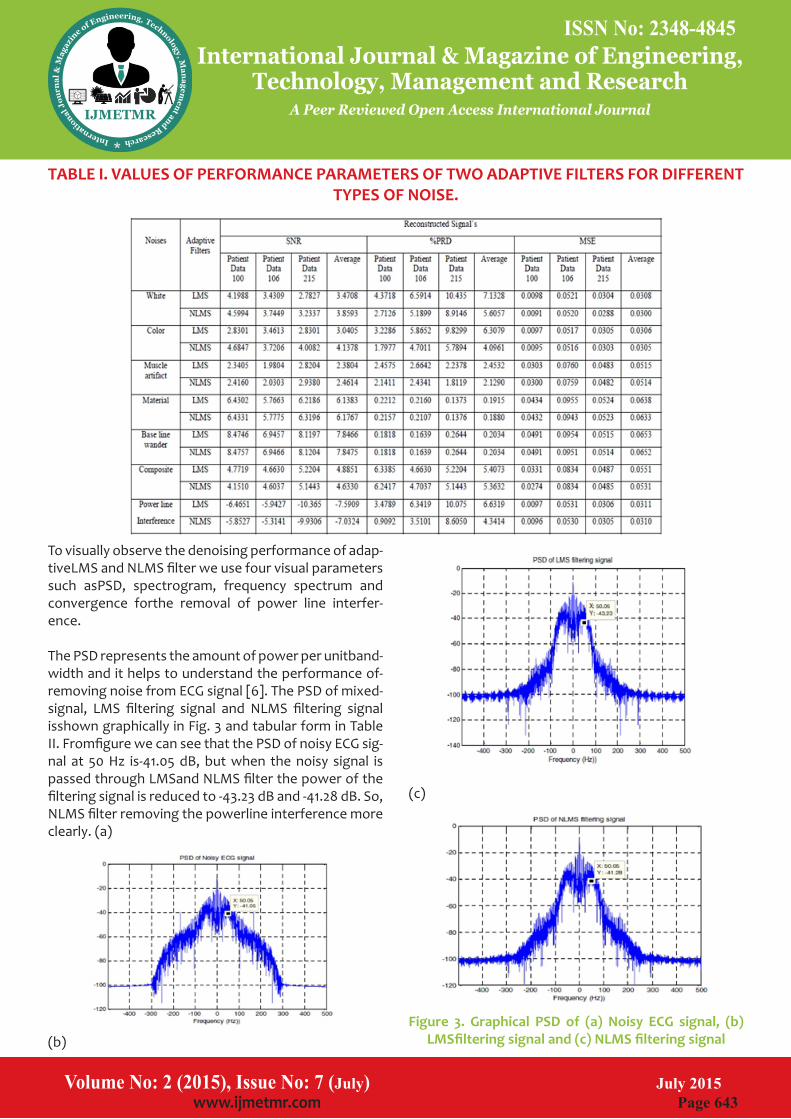
Table I shows the SNR, %PRD and MSE of LMS and NLMSfilter for different types of noise in the case of record no. 100,record no 106 and record no. 215 re-spectively. The tabularanalysis indicate that the recon-structed ECG signal obtainedfrom the adaptive NLMS filter has high SNR, low %PRD andMSE than the LMS adaptive filter for all type of noises.

ISSN No: 2348-4845 ISSN No: 2348-4845
Volume No: 2 (2015), Issue No: 7 (July) July 2015 www.ijmetmr.com Page 641
International Journal & Magazine of Engineering, Technology, Management and Research
A Peer Reviewed Open Access International Journal
III. RESULTS AND DISCUSSION:
The 13 beat real ECG signal is taken from the MIT-BI-Harrhythmia database [9] whose sampling number is 4000 andamplitude is 1 mV. The different types of nois-es such as whitenoise, colored noise, muscle artifact, base line wander,electrode movement noise, compos-ite noise and power lineinterference are generated by using MATLAB®. These noisesare then added to the real ECG signal to get the desired mixedsignal. Finally, the noise is removed using two differentadaptive fil-ters based on LMS and NLMS algorithm. Theresults are shown in Fig. 2. If the amplitude of thereconstructed signal increases,(e)
The block diagram indicates that, if the value of N(n) isknown, then after subtracting this from the mixed signal d(n),the original signal X(n) is obtained. But it is difficult due tothe harmonics of noise signal. For this reason an estimatednoise signal N´(n) is calculated through some filters andmeasureable noise source S(n). If N´(n) is more close to N(n),then the estimated desired signal is X´(n) more close to theOriginal signal X(n).Mathematically the output is given bye = X + N – y (1) (b) The power or energy of this signal is computed by squaring it
The LMS algorithm produces the least mean square of theerror signal by changing the filter tap weight, who-secoefficient updating equation is
Where, μ is an appropriate step size to be chosen as 0 < μ <0.2 for the convergence. The larger steps sizes make thecoefficients to fluctuate widely and the LMS algorithmexperiences a problem with gradient noise amplification,which can be solved by the normalization of the step size. Thisvariant of the MS algorithm, with normalization of the stepsize, is called Normalized LMS (NLMS) algorithm, whosecoefficient updating equa-tion is
Volume No: 2 (2015), Issue No: 7 (July) July 2015 www.ijmetmr.com Page 642
International Journal & Magazine of Engineering, Technology, Management and Research
A Peer Reviewed Open Access International Journal
Figure2. Graphical representation of LMS filtering sig-nal forμ=0.007 and NLMS filtering signal for μ=1 after removing (a)White Gaussian noise, (b) Colored noise, (c) Real muscle artifactnoise, (d) Real electrode move-ment noise, (e) Real baseline wandernoise, (f) Com-posite noise, and (g) Power line interference.
Then there will be high distortion and vice versa. When thevalue of μ equal to 0.007, then we see that some noise alsoappear on the signal peak compared with the value of μ equalto 0.001.But when the value of μ is 0.001, then thereconstructed signal amplitude is less than the original signalas well as all other measuring values, such as, the SNR,%PRD decreases with low dis-tortion. So we can say that the SNR for step size μ of 0.007 is better but exhibits somedistortion.
Table I shows the SNR, %PRD and MSE of LMS and NLMSfilter for different types of noise in the case of record no. 100,record no 106 and record no. 215 re-spectively. The tabularanalysis indicate that the recon-structed ECG signal obtainedfrom the adaptive NLMS filter has high SNR, low %PRD andMSE than the LMS adaptive filter for all type of noises.
ISSN No: 2348-4845 ISSN No: 2348-4845
Volume No: 2 (2015), Issue No: 7 (July) July 2015 www.ijmetmr.com Page 643
International Journal & Magazine of Engineering, Technology, Management and Research
A Peer Reviewed Open Access International Journal
(c)
Figure 3. Graphical PSD of (a) Noisy ECG signal, (b)
LMSfiltering signal and (c) NLMS filtering signal
To visually observe the denoising performance of adap-tiveLMS and NLMS filter we use four visual parameters such asPSD, spectrogram, frequency spectrum and convergence forthe removal of power line interfer-ence.
The PSD represents the amount of power per unitband-width and it helps to understand the performance of-removing noise from ECG signal [6]. The PSD of mixed-signal, LMS filtering signal and NLMS filtering signal isshown graphically in Fig. 3 and tabular form in Table II. Fromfigure we can see that the PSD of noisy ECG sig-nal at 50 Hz is-41.05 dB, but when the noisy signal is passed through LMSand NLMS filter the power of the filtering signal is reduced to -43.23 dB and -41.28 dB. So, NLMS filter removing the powerline interference more clearly. (a)
(b)
Volume No: 2 (2015), Issue No: 7 (July) July 2015 www.ijmetmr.com Page 644
International Journal & Magazine of Engineering, Technology, Management and Research
A Peer Reviewed Open Access International Journal
Figure4. Spectrogram of (a) Noisy ECG signal, (b) LMS-filtering signal and (c) NLMS filtering signal.
Frequency spectrum is a frequency domain spectral-analysis [6]. The frequency spectrum of 50 Hz noisy ECGsignal, LMS filtering signal and NLMS filtering sig-nal isshown in Fig. 5. In noisy signal frequency spec-trum, there is aspike at 50 Hz position. But the noise spike is disappearedafter filtering by LMS and NLMS fil-ter, where NLMS filtershows better performance than LMS filter for removing PLI.
Figure 5. Frequency spectrum of (a) Noisy ECGsignal, (b) LMSfiltering signal and (c) NLMS filtering signal.
TABL II. VALUES OF PSD FOR TWO ADAPTIVE FILTER:
Spectrogram shows how the spectral density of differ-entsignal changes with respect to time, so it is a time varyingspectral analysis [6]. Fig. 4 shows the spectro-gram of noisyECG signal, LMS filtering signal and NLMS filtering signal. Inspectrogram of noisy ECG signal has a black shade line in 50Hz position. After applying LMS and NLMS filtering theshaded line is removed such that there is a noticeable change ofspectral density of the filtering signal, where NLMS filtershows better perfor-mance than the LMS filter.
TABLE I. VALUES OF PERFORMANCE PARAMETERS OF TWO ADAPTIVE FILTERS FOR DIFFERENT TYPES OF NOISE.

ISSN No: 2348-4845 ISSN No: 2348-4845
Volume No: 2 (2015), Issue No: 7 (July) July 2015 www.ijmetmr.com Page 643
International Journal & Magazine of Engineering, Technology, Management and Research
A Peer Reviewed Open Access International Journal
(c)
Figure 3. Graphical PSD of (a) Noisy ECG signal, (b)
LMSfiltering signal and (c) NLMS filtering signal
To visually observe the denoising performance of adap-tiveLMS and NLMS filter we use four visual parameters such asPSD, spectrogram, frequency spectrum and convergence forthe removal of power line interfer-ence.
The PSD represents the amount of power per unitband-width and it helps to understand the performance of-removing noise from ECG signal [6]. The PSD of mixed-signal, LMS filtering signal and NLMS filtering signal isshown graphically in Fig. 3 and tabular form in Table II. Fromfigure we can see that the PSD of noisy ECG sig-nal at 50 Hz is-41.05 dB, but when the noisy signal is passed through LMSand NLMS filter the power of the filtering signal is reduced to -43.23 dB and -41.28 dB. So, NLMS filter removing the powerline interference more clearly. (a)
(b)
Volume No: 2 (2015), Issue No: 7 (July) July 2015 www.ijmetmr.com Page 644
International Journal & Magazine of Engineering, Technology, Management and Research
A Peer Reviewed Open Access International Journal
Figure4. Spectrogram of (a) Noisy ECG signal, (b) LMS-filtering signal and (c) NLMS filtering signal.
Frequency spectrum is a frequency domain spectral-analysis [6]. The frequency spectrum of 50 Hz noisy ECGsignal, LMS filtering signal and NLMS filtering sig-nal isshown in Fig. 5. In noisy signal frequency spec-trum, there is aspike at 50 Hz position. But the noise spike is disappearedafter filtering by LMS and NLMS fil-ter, where NLMS filtershows better performance than LMS filter for removing PLI.
Figure 5. Frequency spectrum of (a) Noisy ECGsignal, (b) LMSfiltering signal and (c) NLMS filtering signal.
TABL II. VALUES OF PSD FOR TWO ADAPTIVE FILTER:
Spectrogram shows how the spectral density of differ-entsignal changes with respect to time, so it is a time varyingspectral analysis [6]. Fig. 4 shows the spectro-gram of noisyECG signal, LMS filtering signal and NLMS filtering signal. Inspectrogram of noisy ECG signal has a black shade line in 50Hz position. After applying LMS and NLMS filtering theshaded line is removed such that there is a noticeable change ofspectral density of the filtering signal, where NLMS filtershows better perfor-mance than the LMS filter.

ISSN No: 2348-4845 ISSN No: 2348-4845
Volume No: 2 (2015), Issue No: 7 (July) July 2015 www.ijmetmr.com Page 645
International Journal & Magazine of Engineering, Technology, Management and Research
A Peer Reviewed Open Access International Journal
IV. CONCLUSION:
Analysis of ECG signal, both of noisy ECG signal andfil-tered signal reveals that adaptive NLMS and LMS filter bothreduces the white noise, colored noise, muscle ar-tifact noise,electrode movement noise, baseline wan-der noise, compositenoise and power line interference properly. But the differentperformance parameters SNR, %PRD, MSE and also visualparameters PSD, fre-quency spectrum and convergence revealsthat adap-tive NLMS filter is more appreciable for removingvari-ous types of noises from ECG signal.
REFERENCES:
1] E. T. Gar, C. Thomas and M. Friesen, “Comparison of Noise Sensitivityof QRS Detection Algorithms,” IEEE Tran. Biomed. Eng., vol. 37, no.1,pp. 85-98, January 1990.
[2] C. Chandrakar and M.K. Kowar,“Denoising ECG signals usingAdaptive Filter Algorithm,” Int. J. of Soft Computing and Engineering(IJSCE), vol. 2, no. 1, pp. 120-123, March 2012.
[3] M. Kaur and B. Singh, “Power Line Interference Re-duction in ECGUsing Combination of MA Method and IIR Notch Filter,” Int. J. ofRecent Trends in Eng., vol. 2, no. 6, pp. 125-129, November 2009.
[4] Y. Kumar and G. K. Malik, “Performance Analysis of different Filtersfor Power Line Interface Reduction in ECG Signal,” Int. J. of ComputerApplications (0975 – 8887), vol. 3, no.7, pp. 1-6, June 2010.
[5] M. S. Chavan, R. Agarwala, M. D. Uplane, and M. S. Gaikwad, “Designof ECG Instrumentation and Implementation of Digital Filter for NoiseReduc-tion,” World Scientific and Engineering Academy and Society(WSEAS), Stevens Point, Wisconsin, USA, vol. 1, no. 157-474, pp. 47-50, January 2004.
[6] D. V. R. K. Reddy, M. Z. U. Rahman, Y. Sangeetha, and N. S. Sudha,“Base Line Wander and Power Line Interference Elimination fromCardiac Signals Using a Novel LMS Algorithm Based On DifferentialInputs and Errors,” Int. J. of Advanced Eng. & Appl., pp. 187-191,January 2011.
The convergence criterion shows that, the fast adap-tion offiltering signal with the original signal. The con-vergence ofLMS and NLMS filtering reconstructed signal is depicted inFig. 6. We can see that, the NLMS filtering signal adapts in farless iteration to original sig-nal than the LMS filtering signal.
Figure 6.Convergence of LMS filtering signal and NLMS filteringsignal.
In this study, we find that adaptive NLMS filter shows-better performance compare to adaptive LMS filter. However,it is reported that adaptive LMS filter is better than adaptivesigned regress or LMS (SRLMS), adaptive sign LMS (SLMS)and adaptive sign sign LMS (SSLMS) filter in terms ofcalculated SNR for denoising power line interference, baselinewander, muscle artifacts and motion artifacts [10]. Anotherpaper reported that adaptive NLMS filter shows the betterperformance than the adaptive LMS and adaptive signed LMS(SLMS) filter in terms of SNR for removing the power lineinter-ference [11].
In one of our previous studies, we haveshown that the adaptive NLMS filter denoises the power lineinterfer-ence from ECG signal exceptionally better than the-other LMS algorithm based adaptive filter [12], in terms ofSNR, PRD and MSE. For better clarification, we have done abroader study for denoising every types of noise involved withreal ECG signal in this paper. From the simulation results, wealso see that in terms of differ-ent performance parameters theadaptive NLMS filter shows the superior performance thanadaptive LMS filter. So, NLMS based adaptive noise cancellermay be used in all practical application.
Volume No: 2 (2015), Issue No: 7 (July) July 2015 www.ijmetmr.com Page 646
International Journal & Magazine of Engineering, Technology, Management and Research
A Peer Reviewed Open Access International Journal
[10] M. Z. U. Rahman, R. A. Shaik and D. V. R. K. Reddy, “NoiseCancellation in ECG Signals using Computation-ally SimplifiedAdaptive Filtering Techniques: Applica-tion to Biotelemetry,” An Int. J.(SPIJ,) vol. 3, pp.120-131, 2009.
[11] G. Sundeep and U. V. R. Kumari, “Reduction of Power LineInterference by Using Adaptive Filtering Techniques inElectrocardiogram,” Int. J. of Innovative Technology and ExploringEngineering (IJITEE), vol.1, pp. 83-86, October 2012 .
[12] M. Maniruzzaman, K. M. S. Billah, U. Biswas, and B. Gain, “Least mean-square algorithm based adaptive filters for removing power lineinterference from ECG signal,” in Proc.ICIEV’12, paper 410, pp. 737-740, May 18-19, 2012.
[7] A. B. Sankar, D. Kumar and K. Seetha Lakshmi, “Per-formance Study ofVarious Adaptive Filter Algorithms for Noise Cancellation inRespiratory Signals,” An In-ternational Journal(SPIJ), vol. 4, no. 5, pp.267-278, De-cember 2010.
[8] L. Sornmo, “Time-Varying Filtering for Removal of Baseline Wander inExercise ECGs,” Computers in Car-diology, IEEE Computer Soc. Press,pp.145-148, Septem-ber 23-26, 1991.
[9]http://www.physionet.org/physiobank/database/mitdb/ MIT-BIHArrhythmia Database Website. Avail-able [Online]: (viewed at10.10.2013 at 10.15 PM).