eco consumer+prefrences+and+choice
TRANSCRIPT
7/31/2019 Eco Consumer+Prefrences+and+Choice
http://slidepdf.com/reader/full/eco-consumerprefrencesandchoice 1/29
1
Consumer preferences and choices

7/31/2019 Eco Consumer+Prefrences+and+Choice
http://slidepdf.com/reader/full/eco-consumerprefrencesandchoice 2/29
2
Lecture plan
Objectives
Consumer Choice
Cardinal Utility Analysis
Marginal Utility and Demand Curve
Ordinal Utility Analysis
Diminishing Marginal Rate of Substitution
Consumer’s Equilibrium
Revealed Preference Theory
Consumer Surplus
7/31/2019 Eco Consumer+Prefrences+and+Choice
http://slidepdf.com/reader/full/eco-consumerprefrencesandchoice 3/29
3
Objectives
To introduce the crux of consumer behaviour,choices and preferences.
To explain the nuances of utility analysis, marginal
utility, total utility and law of diminishing marginal
utility.
To explain the difference between cardinal and
ordinal utility analyses of consumer behaviour.
To discuss how consumer equilibrium is attainedsubject to budget constraint.
To illustrate the concept of consumer surplus and
its application in decision making.
7/31/2019 Eco Consumer+Prefrences+and+Choice
http://slidepdf.com/reader/full/eco-consumerprefrencesandchoice 4/29
4
Consumer Choice
Given the prices of different commodities,consumers decide on the quantities of thesecommodities according to their paying capacity, andtastes and preferences.
Consumers’ choices, tastes and preferences restson the following assumptions:
Completeness: A consumer would be able to state ownpreference or indifference between two distinct baskets ofgoods.
Transitivity: An individual consumer’s preferences arealways consistent.
Non-satiation: A consumer is never satiated permanently.More is always wanted; if “some” is good, “more” of thegood is better.
7/31/2019 Eco Consumer+Prefrences+and+Choice
http://slidepdf.com/reader/full/eco-consumerprefrencesandchoice 5/29
5
Consumer Choice
Commodities are desired because of their utility
Utility is the attribute of a commodity to satisfy or satiate
a consumer’s wants
Utility is the satisfaction a consumer derives from
consumption of a commodity
Mathematically: utility is the function of the
quantities of different commodities consumed:
U= f(m1, n1, r1)

7/31/2019 Eco Consumer+Prefrences+and+Choice
http://slidepdf.com/reader/full/eco-consumerprefrencesandchoice 6/29
6
Features
Utility is subjective Utility is relative
Utility is not essentially useful
Utility is independent of morality

7/31/2019 Eco Consumer+Prefrences+and+Choice
http://slidepdf.com/reader/full/eco-consumerprefrencesandchoice 7/297
Cardinal Utility Analysis
Marshall and Jevons opined that Utility is a cardinalconcept and is measurable (in utils) like any otherphysical commodity
Total Utility (TU)
Sum total of utility levels out of each unit of a commodityconsumed within a given period of time
Marginal Utility (MU)
Change in total utility due to a unit change in the commodityconsumed within a given period of time.
MU=TUn -TUn-1 or MU=dQ
dTU

7/31/2019 Eco Consumer+Prefrences+and+Choice
http://slidepdf.com/reader/full/eco-consumerprefrencesandchoice 8/298
Assumptions
Utility can be measured in the cardinal numbers. Marginal utility of money remains constant.
Utility of one commodity is independent of the other.
Every unit of the commodity being used is of same
quality and size.
There is a continuous consumption of the commodity.
Commodity is consumed in some standard units.
Consumer is a rational person.
7/31/2019 Eco Consumer+Prefrences+and+Choice
http://slidepdf.com/reader/full/eco-consumerprefrencesandchoice 9/299
Cardinal Utility Analysis
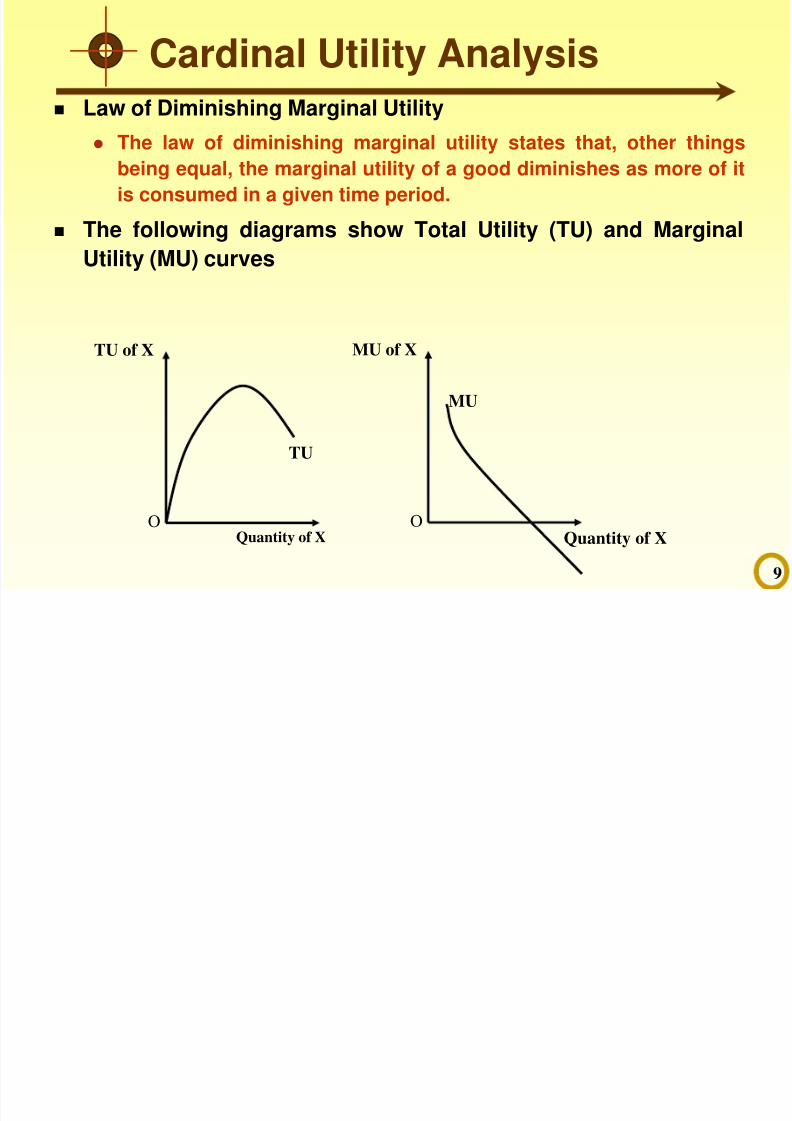
Law of Diminishing Marginal Utility
The law of diminishing marginal utility states that, other thingsbeing equal, the marginal utility of a good diminishes as more of it
is consumed in a given time period.
The following diagrams show Total Utility (TU) and Marginal
Utility (MU) curves
Quantity of X
TU of X
O
TU
Quantity of X
MU of X
O
MU

7/31/2019 Eco Consumer+Prefrences+and+Choice
http://slidepdf.com/reader/full/eco-consumerprefrencesandchoice 10/29
Cont….
The Law of Diminishing Marginal Utility
Marginal utility refers to the change in satisfaction which results when a little more
or little less of that good is consumed. For example, when a thirsty person takes five
bottles of cold drink continuously, the consumption of first bottle gives him utility,
second bottle gives him lesser utility than first but his total utility increases. Third
bottle gives him still less utility but increases total utility. The utility from fourth bottlemay be zero as he is no more thirsty. But the fifth bottle may cause uneasiness and
thus give negative utility, i.e., the total utility may now actually go down.Bottle consumed Total Utility (Units) Marginal Utility (Units)
0 0 –
1 14 14
2 23 9
3 27 4
4 27 0
5 24 –3
6 18 –6
7/31/2019 Eco Consumer+Prefrences+and+Choice
http://slidepdf.com/reader/full/eco-consumerprefrencesandchoice 11/2911
Causes of its application
Commodities are imperfect substitute Alternative uses
Satiability of particular wants

7/31/2019 Eco Consumer+Prefrences+and+Choice
http://slidepdf.com/reader/full/eco-consumerprefrencesandchoice 12/2912
Exceptions
Curious & Rare things Misers
Good books & Poems
Drunkards etc.

7/31/2019 Eco Consumer+Prefrences+and+Choice
http://slidepdf.com/reader/full/eco-consumerprefrencesandchoice 13/2913
Cardinal Utility Analysis
Law of Equimarginal Utility
Marginal utilities of all commodities should be equal
The consumer has to distribute his/her income on
different commodities so that utility derived from lastunit of each commodity is equal for all other
commodities in the consumption basket.
Mathematically: I
N
N
M
M MU
P
MU
P
MU ...

7/31/2019 Eco Consumer+Prefrences+and+Choice
http://slidepdf.com/reader/full/eco-consumerprefrencesandchoice 14/2914
Edgeworth, Fisher and others negate the physicalmeasurement of utility.
A consumer is able to rank different combinations of the
commodities in order of preference or indifference.
Utility is not additive but comparative.
Indifference Curve Analysis (J.R. Hicks and R.G.D. Allen )
Indifference curve: Locus of points which show the different
combinations of two commodities among which the
consumer is indifferent, i.e. derives same utility.
Since all these points render equal utility to the consumer, an
indifference curve is also known as an isoutility (“iso” meaning
equal) curve.
Indifference map: group of indifference curves
Ordinal Utility Analysis
7/31/2019 Eco Consumer+Prefrences+and+Choice
http://slidepdf.com/reader/full/eco-consumerprefrencesandchoice 15/29
Cont….
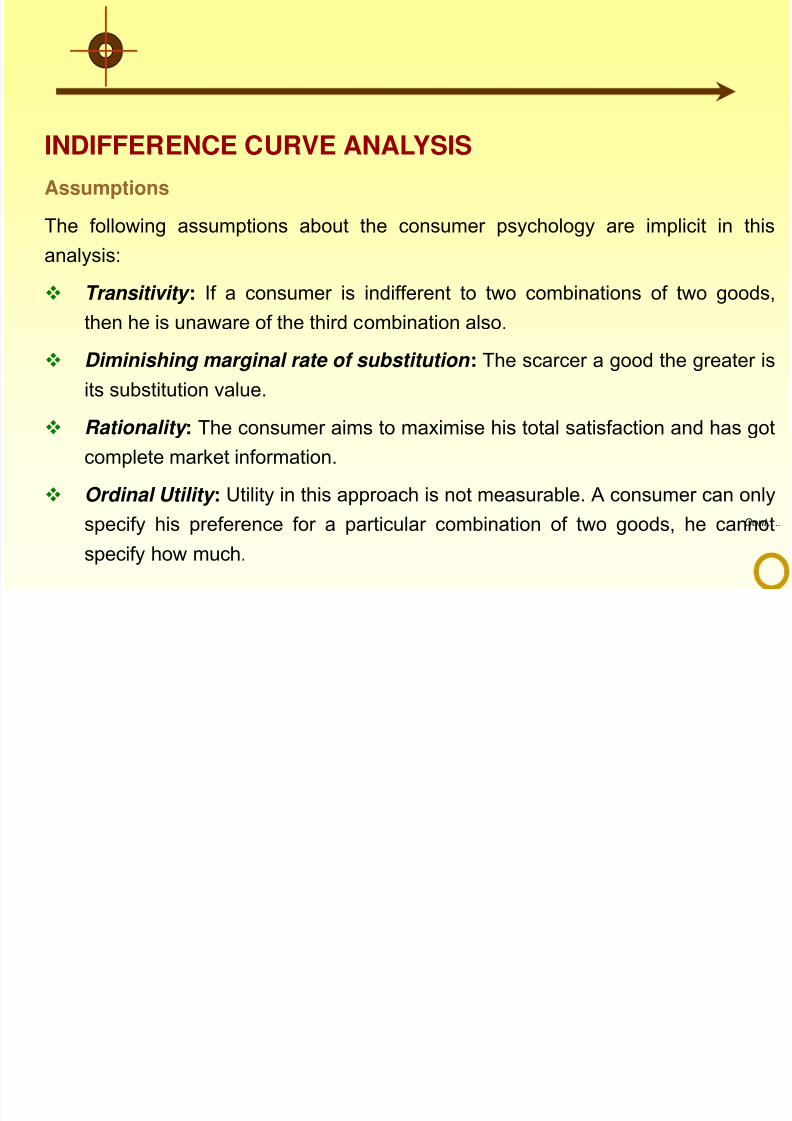
INDIFFERENCE CURVE ANALYSIS
Assumptions
The following assumptions about the consumer psychology are implicit in this
analysis:
Transitivity : If a consumer is indifferent to two combinations of two goods,
then he is unaware of the third combination also.
Diminishing marginal rate of substitution : The scarcer a good the greater is
its substitution value.
Rationality : The consumer aims to maximise his total satisfaction and has got
complete market information.
Ordinal Utility : Utility in this approach is not measurable. A consumer can only
specify his preference for a particular combination of two goods, he cannot
specify how much.
7/31/2019 Eco Consumer+Prefrences+and+Choice
http://slidepdf.com/reader/full/eco-consumerprefrencesandchoice 16/29
Cont….
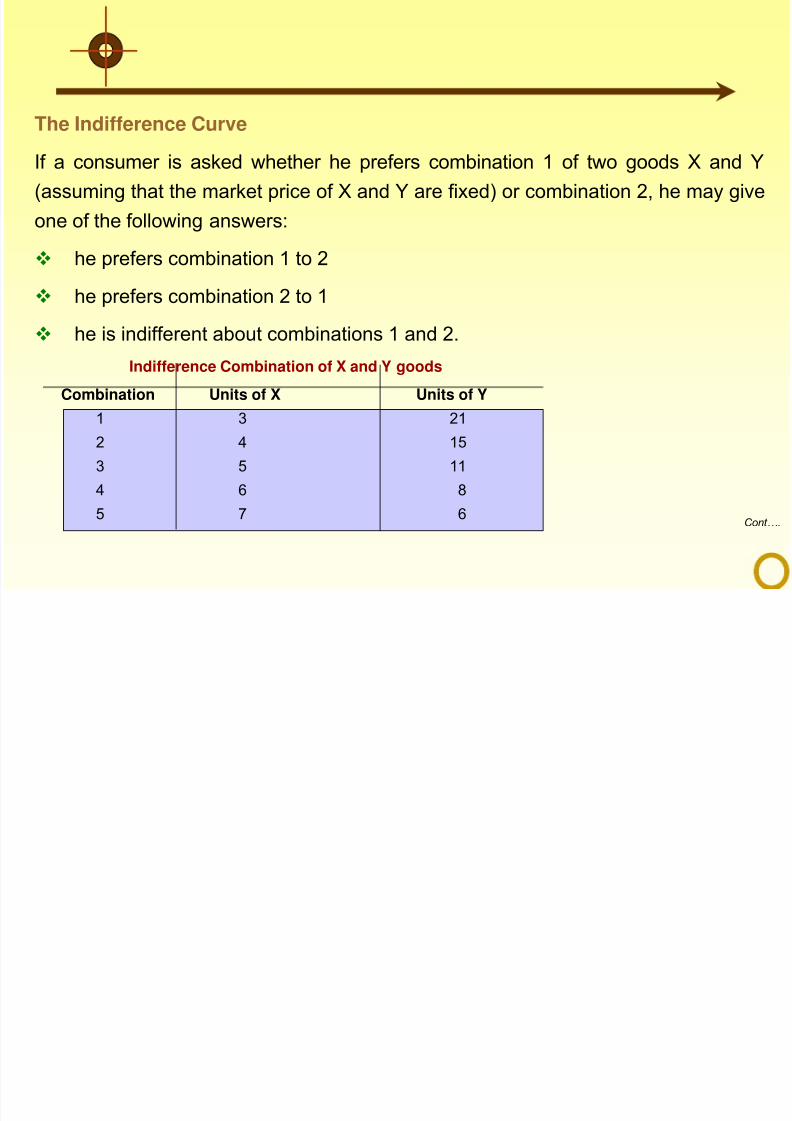
The Indifference Curve
If a consumer is asked whether he prefers combination 1 of two goods X and Y
(assuming that the market price of X and Y are fixed) or combination 2, he may give
one of the following answers:
he prefers combination 1 to 2
he prefers combination 2 to 1
he is indifferent about combinations 1 and 2.
Combination Units of X Units of Y
1 3 21
2 4 15
3 5 11
4 6 8
5 7 6
Indifference Combination of X and Y goods

7/31/2019 Eco Consumer+Prefrences+and+Choice
http://slidepdf.com/reader/full/eco-consumerprefrencesandchoice 17/29
Cont….
The Indifference Curve
7/31/2019 Eco Consumer+Prefrences+and+Choice
http://slidepdf.com/reader/full/eco-consumerprefrencesandchoice 18/29
18
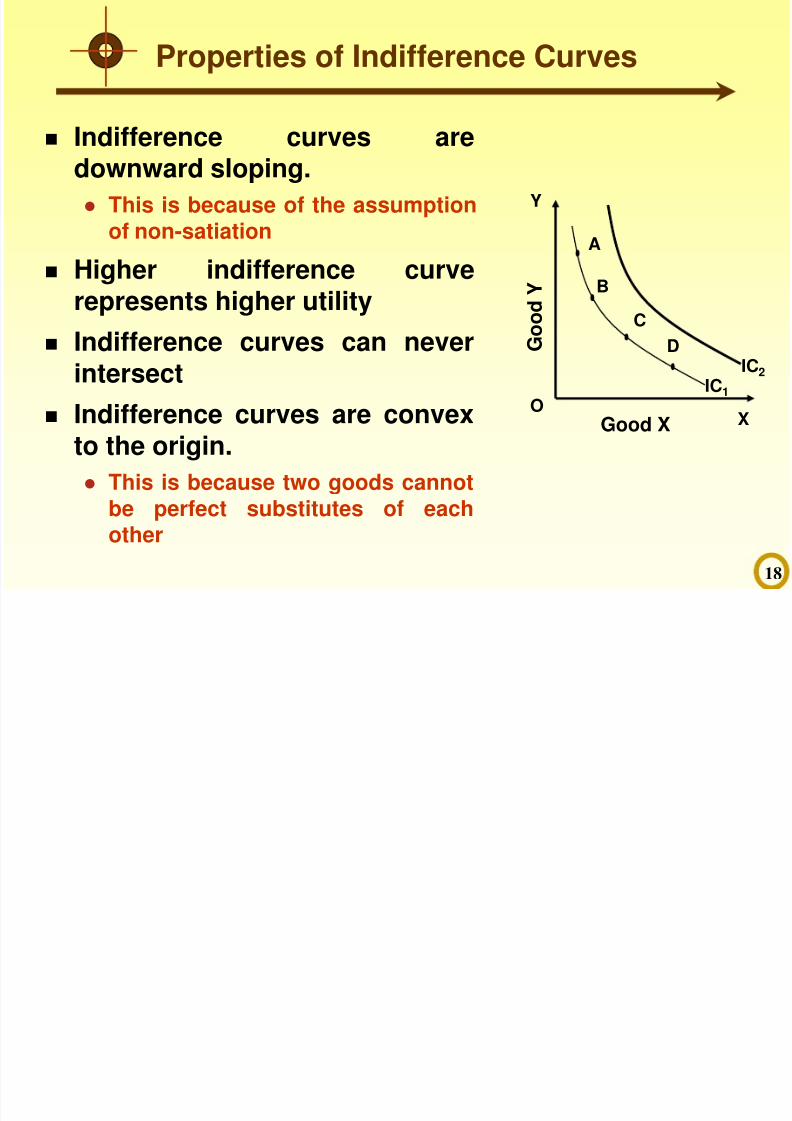
Properties of Indifference Curves
Indifference curves aredownward sloping.
This is because of the assumptionof non-satiation
Higher indifference curverepresents higher utility
Indifference curves can neverintersect
Indifference curves are convexto the origin.
This is because two goods cannotbe perfect substitutes of eachother
X
Y
D
A
B
O
C
Good X
G o o d Y
IC2
IC1
7/31/2019 Eco Consumer+Prefrences+and+Choice
http://slidepdf.com/reader/full/eco-consumerprefrencesandchoice 19/29
19
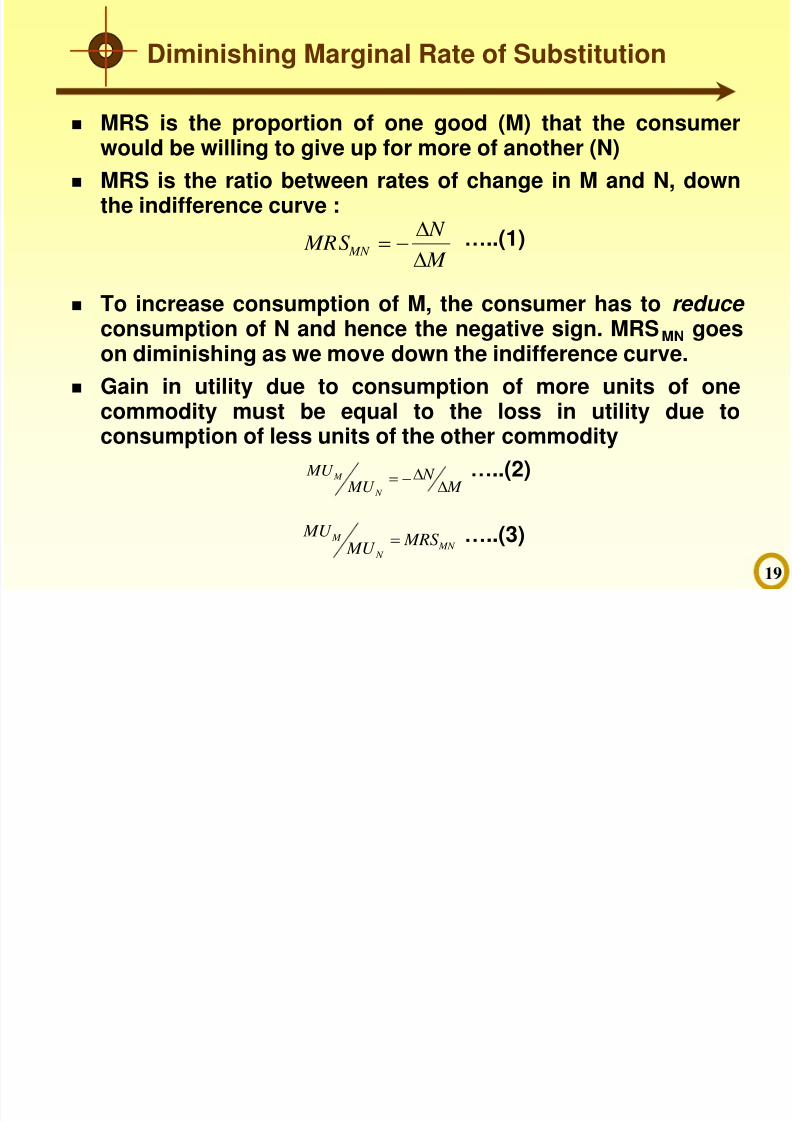
MRS is the proportion of one good (M) that the consumer
would be willing to give up for more of another (N)
MRS is the ratio between rates of change in M and N, downthe indifference curve :
…..(1)
To increase consumption of M, the consumer has to reduce consumption of N and hence the negative sign. MRSMN goeson diminishing as we move down the indifference curve.
Gain in utility due to consumption of more units of one
commodity must be equal to the loss in utility due toconsumption of less units of the other commodity
…..(2)
…..(3)
Diminishing Marginal Rate of Substitution
M
N MRS
MN
MN
N
M MRS MU
MU
M N
MU
MU
N
M

7/31/2019 Eco Consumer+Prefrences+and+Choice
http://slidepdf.com/reader/full/eco-consumerprefrencesandchoice 20/29
Cont….
The Budget Line
The budget line is also known as the
price line, the consumption possibility
line or the price opportunity line. It
represents different combinations of two
goods X and Y which the consumer can
buy by spending all his income.
Example
A consumer having Rs 1200 as income can
buy 600 units of Y at Rs 2 per unit or 300
units of X at Rs 4 per unit as shown in Figure
12. The straight line joining the two points A
and B is called the budget line.
At any point on AB, the consumer spends all
his income but point C is unattainable. At
point D or any other point in DOAB he does
not spend all his income.
7/31/2019 Eco Consumer+Prefrences+and+Choice
http://slidepdf.com/reader/full/eco-consumerprefrencesandchoice 21/29
21
Consumer’s Equilibrium
Conditions for consumer’s equilibrium:
Consumer spends all income in buying the two commodities; hence
point of equilibrium will always lie on the budget line.
Point of equilibrium will always be on the highest possible
indifference curve the consumer can reach with the given budget line.
Consumer is able to maximize utility at a point where the budget line is
tangent to an indifference curve
This is the highest possible curve attainable by the consumer,
subject to budget constraint.
Budget line may shift either upwards or downwards due to any change in income of
the consumer while price of the commodities remaining same
Swivel at one point when price of one of the commodities changes,
while income and price of other commodity remain same.
7/31/2019 Eco Consumer+Prefrences+and+Choice
http://slidepdf.com/reader/full/eco-consumerprefrencesandchoice 22/29
22
Consumer’s Equilibrium
Quantity of M
Quantity of N
O QM
QN
A
B
E
IC4
IC3
IC1
IC2
C
D
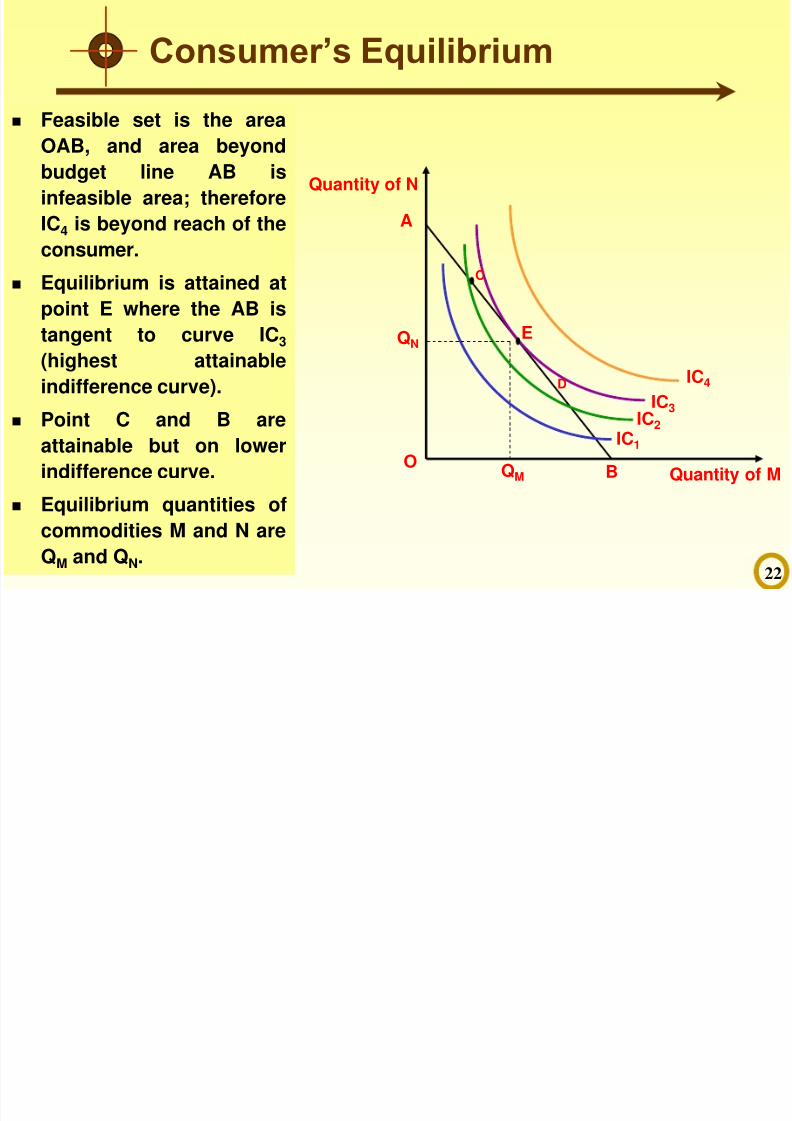
Feasible set is the area
OAB, and area beyondbudget line AB is
infeasible area; therefore
IC4 is beyond reach of the
consumer.
Equilibrium is attained atpoint E where the AB is
tangent to curve IC3
(highest attainable
indifference curve).
Point C and B areattainable but on lower
indifference curve.
Equilibrium quantities of
commodities M and N are
QM and QN.
7/31/2019 Eco Consumer+Prefrences+and+Choice
http://slidepdf.com/reader/full/eco-consumerprefrencesandchoice 23/29
Price of Related Goods
Almost all the goods that a consumer purchases in a market are "related goods"
either by way of complementarity or substitutability. X and Y are compliments if the
rise in demand of X increases the demand for Y, e.g., pen and ink, bread and butter,
etc. X and Y are substitutes, if the rise in demand for x reduces the demand for Y,e.g., tea and coffee.
Breaking up the Price Effect into Income and Substitution Effect: Hicksian
Approach
The price effect can be broken up into two parts: income effect and substitution
effect. Income effect occurs due to increase (decrease) in real income resulting from
a decrease (increase) in the price of a commodity. Substitution effect occurs due to
the consumer's inherent tendency to substitute cheaper goods for relatively
expensive ones.

7/31/2019 Eco Consumer+Prefrences+and+Choice
http://slidepdf.com/reader/full/eco-consumerprefrencesandchoice 24/29
24
Consumer Surplus
The difference between the price consumers are
willing to pay and what they actually pay is called
consumer surplus.
Individual consumer surplus measures the gain that
a consumer makes by purchasing a product at a
price lower than what he/she had expected to pay.
In a market the total consumer surplus measures thegain to the society due to the existence of a market
transaction.

7/31/2019 Eco Consumer+Prefrences+and+Choice
http://slidepdf.com/reader/full/eco-consumerprefrencesandchoice 25/29
25
Consumer Surplus
Equilibrium market price and
quantity are at (P*, Q*)
If there is a customer who is
willing to pay as high as P1 but
actually pays only P*, the
difference between the twoprices (P1 – P*) represents the
surplus of the first consumer.
If a second consumer is willing
to pay P2 and actually pays P*
gains a surplus of (P2 – P*).
Total consumer surplus in the
economy is given by the
triangular area P*DE
S
S
P2
Price
D
D
O
B
A P1
P*
Q1 Q2 Q* Quantity
E
Consumer
Surplus

7/31/2019 Eco Consumer+Prefrences+and+Choice
http://slidepdf.com/reader/full/eco-consumerprefrencesandchoice 26/29
26
Summary
Utility is the measure of satisfaction a consumer derives fromconsumption of a commodity; it is an attribute of a commodity to
satisfy a consumer’s needs. According to cardinal school, utility is
measurable like any other physical commodity.
As per law of diminishing marginal utility, as you one consumes
more and more units of a commodity, total utility would goes on
increasing, but at a diminishing rate.
As per law of equimarginal utility, a consumer will maximize utilitywhen the marginal utility of the last unit of money spent on each
commodity is equal to the marginal utility of the last unit of money
spent on any other commodity.

7/31/2019 Eco Consumer+Prefrences+and+Choice
http://slidepdf.com/reader/full/eco-consumerprefrencesandchoice 27/29
27
Summary
According to ordinal school, utility cannot be
measured in physical units; it is possible to rank utility
derived from various commodities.
Indifference curves are downward sloping and convexto the origin; a higher indifference curve would
represent higher utility and two indifference curves do
not intersect each other.
Marginal Rate of Substitution (MRS) shows the amount
of a good that a consumer would be willing to give up
for an additional unit of another commodity.

7/31/2019 Eco Consumer+Prefrences+and+Choice
http://slidepdf.com/reader/full/eco-consumerprefrencesandchoice 28/29
28
Summary
Budget constraint to the consumer includes income of the
consumer and prices of the commodities in the consumptionbasket. A change in any of these constraints would lead to a shiftin the budget line. Such a shift can be of three types: upwards,
downwards and swivelling.
The consumer will be at equilibrium at a point where the budgetline is tangent to the highest attainable indifference curve.
According to the theory of revealed preferences, demand for a
commodity by a consumer can be ascertained by observing thebuying pattern of the consumer.
Consumer surplus is equal to the difference between the price aconsumer is willing to pay and the price he/she actually pays for
a commodity.

7/31/2019 Eco Consumer+Prefrences+and+Choice
http://slidepdf.com/reader/full/eco-consumerprefrencesandchoice 29/29