eco-friendly value addition of cheese through …
TRANSCRIPT

1
ECO-FRIENDLY VALUE ADDITION OF CHEESE
THROUGH PROBIOTICS
A THESIS SUBMITTED TO
UNIVERSITY OF THE PUNJAB
FOR THE DEGREE OF
DOCTOR OF PHILOSOPHY
2014
BY
Amara Hassan C.E.E.S
University of the Punjab, Lahore

2
IN THE NAME OF ALLAH THE MOST MERCIFUL
AND COMPASSIONATE THE MOST GRACIOUS
AND BENEFICIENT

i
DDEEDDIICCAATTIIOONN
I dedicate this thesis to my loving Mother, who sacrifices her inclinations,
who gave me enthusiastic and everlasting gusto to make my own
headway in my life.

ii
DDEECCLLAARRAATTIIOONN CCEERRTTIIFFIICCAATTEE
The thesis being submitted for the degree of Ph.D. in the University of the Punjab
does not contain any material which has been submitted for the award of Ph.D.
degree in any university and to the best of my knowledge and belief, neither does
this thesis contain any material published or written previously by another person,
except when due reference is made to the source in the text of the thesis.
Amara Hassan

iii
CERTIFICATE OF APPROVAL
I hereby certified that this research work is based on the results of experimental work
carried out by Miss Amara Hassan under my supervision. I have personally gone
through all data/ results/materials reported in the manuscript and certify their
correctness/ authenticity. I further certify that the materials included in this thesis
have not been used in part or full in the manuscript already submitted or in the
process of submission in partial/ complete fulfillment for the award of any other
degree from any other institution. Miss Amara Hassan has fulfilled all conditions
established by the University of the Punjab for the submission of Ph.D. degree
through the official procedure of the university.
Dr. Muhammad Nawaz Ch. Dr. Barbara Rasco
(Supervisor) (Supervisor)
Professor Emeritus Professor
College of Earth and Environmental Sciences School of Food Science,
University of the Punjab, Lahore Washington State University,
PAKISTAN USA

iv
ACKNOWLEDGEMENTS
All acclamations and appreciations are for Almighty Allah, the Omnipotent,
the Omnipresent, the Merciful, the Beneficent, who blessed me with such a lucid
intelligence as I could endeavor my services towards this manuscript and who gave
me an opportunity to add a drop in the wide ocean of knowledge.
I am deeply indebted to my supervisors Prof. Dr. M. Nawaz Chaudhry and
Prof. Dr. Barbara Rasco whose help, stimulating suggestions and encouragement
helped me during research and in writing of this thesis.
I want to thank all staff of the College of Earth & Environmental Sciences, and
Centre of Excellence of Molecular Biology, University of the Punjab, Haleeb foods
Pvt Limited, The Children care Hospital, and University of Health Sciences for their
support during this research work. I, furthermore, want to acknowledge the Pakistan
Council of Scientific & Industrial Research (PCSIR) Lahore for encouraging me to go
ahead with my thesis. I am bound to thank Dr. Aadila Batool (Assistant Professor,
University of the Punjab) for her great help in completing such a dynamic project. I
also acknowledge my colleagues for their help in completing this manuscript.
Especially, I would like to pay my deepest gratitude to my beloved mother for
teaching me to take the right paths and for her love which enabled me to complete
this research. Here my acknowledgement will be incomplete if I don’t mention the
unconditional help of my sister, Asma Waqas, and brothers, Adnan Hassan and
Kamran Hassan, who guided, prayed and always encouraged me to complete this
draft.
Lastly, I offer my regards and blessings to all those who supported me in any
respect during the completion of this project.
May Allah bless them all (Ameen).
Amara Hassan

v
ABBREVIATIONS
ATCC American Type Culture Collection
CFU Colony Forming Unit
BOD Biochemical Oxygen Demand
COD Chemical Oxygen Demand
LCA Life Cycle Assessment
LCIA Life Cycle Impact Assessment
ISO International Organization for Standardization
IgG Immunoglobulin G
IBD Inflammatory Bowel Disease
DNA Deoxyribo Nucleic Acid
SDS Sodium Dodecyl Sulfate
PAGE Polyacrylamide Gel Electrophoresis
DGGE Denaturing Gradient Gel Electrophoresis
PCR Polymerase Chain Reaction
GIT Gastro Intestinal Tract
MRSA de Man, Rogosa and Sharpe Agar
AOAC Association of Official Analytical Chemists
SGJ Stimulated Gastric Juice
SIJ Stimulated Intestinal Juice
LDPE Low Density Polyethylene
GWP Global Warming Potential
WHO World Health Organization
FAO Food and Agriculture Organization
FDA Food and Drug Administration

vi
TABLE OF CONTENTS
Dedication i
Certification ii
Approval certificate iii
Acknowledgements iv
Abbreviations v
Contents vi
List of tables xii
List of figures xiii
Abstract xv
Chapter 1 INTRODUCTION 1
Chapter 2 LITERATURE REVIEW
2.1 Value added functional foods and their potential use 6
2.1.1 Probiotics and their role in the value added functional
products
7
2.1.2 Health benefits of probiotics- particularly in prevention and
Treatment of diarrhea
9
2.1.3 Use of cheese as a probiotic carrier 16
2.1.4 Combined effects of probiotics and prebiotics in value added
functional foods
28
2.1.5 Technical aspects of probiotic based value added foods in
respect of survival in the human gastrointestinal tract
29
2.2 Nutritional value of colostrum for immunoglobulin G 34
2.3 Cheese whey: Nutritional importance and processing 36
2.3.1 Nutritional composition and major types of cheese whey 36
2.3.2 Health benefits of eco-friendly processing of whey 39
2.3.3 Drying technique for the whey processing 41
2.4 Life cycle assessment 42
2.4.1 Life cycle assessment methodology 44
2.4.2 Framework of LCA 45
2.4.3 Impact categories in LCA 46
2.4.4 Life Cycle Assessment in dairy sector 48

vii
Project Aims 52
Chapter 3 MATERIALS AND METHODS
3.1 Materials
3.1.1 Bacterial strains 53
3.1.2 Instruments 54
3.1.3 Media, chemicals and reagents 54
3.2 Isolation, identification, and characterization of Probiotics
3.2.1 Sample sources for strains isolation and enrichment 56
3.2.2 Culture dependent isolation of probiotic strains 57
3.2.3 Preliminary identification of the isolated colonies 58
3.2.3.1 Sugar fermentation Profile 58
3.2.3.2 Gelatinase activity 58
3.2.3.3 Haemolytic activity 58
3.2.4 Culture independent identification of isolates 59
3.2.4.1 SDS-PAGE 59
3.2.4.2 DNA extraction 59
3.2.4.3 Polymerase chain reaction 60
3.2.4.4 DGGE analysis 60
3.3 Probiotic characterization of selected indigenous
probiotics
3.3.1 Resistance to antibiotics 61
3.3.2 In vitro antagonistic activity 61
3.4 Microencapsulation: survival and functional attributes of
indigenous probiotic isolates
3.4.1 Preparation of cell suspension for encapsulation 62
3.4.2 Microencapsulation 62
3.4.3 Survival evaluation in simulated gastric juice (SGI) 63
3.4.4 Survival evaluation in simulated intestinal juice (SIJ) 64
3.5 In vitro adherence studies of potential probiotics
3.5.1 Cell surface hydrophobicity 64
3.5.2 Cell aggregation 65
3.5.3 Adhesion assay 65
3.6 Isolation of heat resistant probiotic starins and 66

viii
preservation
3.7 Manufacturing and value addition of cheese through
probiotics
3.7.1 Collection of milk for cheese processing 67
3.7.2 Quality testing of raw buffalo milk samples 68
3.7.2.1 Microbiological testing 68
3.7.2.2 Physicochemical testing 68
3.7.3 Milk pre-treatment 69
3.7.4 Cheese processing and value addition 72
3.7.4.1 Manufacturing of chemically acidified cheese 73
3.7.4.2 Manufacturing of biologically acidified cheese 74
3.7.4.2.1 Bacterial strains and culture conditions 74
3.7.4.2.2 Cheese making 74
3.7.5 Cheese analysis
3.7.5.1 Physicochemical analysis 76
3.7.5.1.1 Moisture content 76
3.7.5.1.2 Protein content 77
3.7.5.1.3 Fat content 77
3.7.5.1.4 Ash 78
3.7.5.1.5 Acidity 78
3.7.5.1.6 Salt content 78
3.7.5.1.7 pH 79
3.7.5.1.8 Calcium content 79
3.7.5.2 Rheological and functional characterization
3.7.5.2.1 Melt time 79
3.7.5.2.2 Flowability 80
3.7.5.2.3 Firmness 80
3.7.5.3 Microbiological analysis 80
3.7.5.4 Sensory evaluation 81
3.7.5.5 Survival evaluation of induced bacterial cultures 81
3.7.5.5.1 Bacterial enumeration 81
3.7.5.5.2 Evaluation in stimulated gastric juice 82
3.7.5.5.3 Evaluation in stimulated intestinal juice 82

ix
3.8 Extraction of IgG from colostrum for supplement
3.8.1 Sampling for colostrum 83
3.8.2 Extraction of IgG 83
3.8.3 Analytical studies 83
3.8.4 Activity assay 84
3.9 Whey processing 84
3.9.1 Formation of whey powder 85
3.9.2 Whey powder analysis 86
3.9.2.1 Moisture content 86
3.9.2.2 WPNI determination 86
3.9.2.3 Spore forming bacterial count 87
3.9.2.4 Scanning electron microscopy 87
3.9.2.5 Nutritional evaluation 89
3.9.2.6 Sensory evaluation 89
3.9.2.7 pH 89
3.9.3 Formation of probiotic-whey based anti-diarrheal spplement 89
3.9.3.1 Nutritional evaluation 89
3.9.3.2 Microbiological evaluation 89
3.9.3.3 Physicochemical evaluation 90
3.9.3.4 Feed trials 90
3.10 Life cycle assessment of value added cheese and whey
processing
3.10.1 Goals and scope 91
3.10.2 Functional unit 91
3.10.3 Development of baseline scenario and system boundaries 92
Chapter 4 RESULTS AND DISCUSSION
4.1 Isolation, identification and characterization of probiotics
4.1.1 Culture dependent isolation of probiotics 98
4.1.2 Culture independent isolation of probiotics 105
4.2 Potential studies of selected probiotic isolates
4.2.1 Antibiotic resistance 109
4.2.2 In vitro antagonistic activity 111
4.3 Microencapsulation: survival and functional attributes

x
of indigenous probiotic isolates 115
4.3.1 Stimulated Gastric Juice 117
4.3.2 Stimulated Intestinal Juice 121
4.4 In vitro adherence studies of potential probiotics
4.4.1 Cell surface hydrophobicity 124
4.4.2 Cell aggregation 126
4.4.3 Cells adhesion assay 127
4.5 Quality testing and pre-treatment of cheese milk
4.5.1 Microbiological analysis of cheese milk 128
4.5.2 Physicochemical analysis of cheese milk 128
4.6 Cheese manufacturing and analysis during storage 130
4.6.1 Physicochemical analysis of manufactured cheeses
4.6.1.1 Moisture content 131
4.6.1.2 Protein content 133
4.6.1.3 Fat content 136
4.6.1.4 Ash content 137
4.6.1.5 Acidity percentage 139
4.6.1.6 Salt content 141
4.6.1.7 pH 142
4.6.1.8 Calcium content 144
4.6.2 Rheological and functional characterization of cheeses
4.6.2.1 Melt time 147
4.6.2.2 Flowability 148
4.6.2.3 Firmness 151
4.6.3 Microbiological analysis of manufactured cheeses 152
4.6.4 Sensory evaluation of manufactured cheeses 157
4.6.5 Survival evaluation of bacterial cultures cheeses
4.6.5.1 Survival evaluation in stimulated gastric juice 160
4.6.5.2 Survival evaluation in stimulated intestinal juice 161
4.7 Extraction of IgG from colostrum for supplement 161
4.8 Whey processing and analysis 164
4.8.1 Compositional analysis of whey powder 165
4.8.2 WPNI determination 166

xi
4.8.3 Spore forming bacterial count 166
4.8.4 Scanning electron microscopy 166
4.9 Formation and characterization of probiotic-whey
supplement
4.9.1 Nutritional, microbiological, sensory evaluation 168
4.9.2 Feed trials 170
4.10 LCA of cheese and whey processing 174
Conclusion and recommendations 184
Chapter 5 References 187
Annexure I Sensory evaluation form 199
Annexure II Publications from this project 200

xii
LIST OF TABLES
Table 1 Composition of typical cheese whey 37
Table 2 Sample collection for isolation of probiotic strains 57
Table 3 Media used for microbiological analysis 68
Table 4 Physiological and biochemical characterization of isolates 101
Table 5 Carbohydrate fermentation of isolates 104
Table 6 Antibiotic resistance of selected isolates 110
Table 7 In vitro antagonistic activity 114
Table 8 Probiotic count for free, single and double encapsulated bacteria 116
Table 9 Cell surface hydrophobicity, aggregation, and cell adhesion evaluation
126
Table 10 Microbiological analysis of cheese milk 128
Table 11 Physicochemical analysis of cheese milk 129
Table 12 Moisture contents of cheeses during storage 131
Table 13 Protein contents of cheeses during storage 134
Table 14 Fat contents of cheeses during storage 136
Table 15 Ash contents of cheeses during storage 138
Table 16 Acidity percentage of cheeses during storage 140
Table 17 Salt contents of cheeses during storage 141
Table 18 pH of cheeses during storage 143
Table 19 Calcium contents of cheeses during storage 145
Table 20 Melt time of cheeses during storage 148
Table 21 Flowability of cheeses during storage 149
Table 22 Firmness of cheeses during storage 152
Table 23 Microbiological count of cheeses during storage 154
Table 24 Sensory evaluation of cheeses 159
Table 25 Mean loss in bacterial count in manufactured cheeses 160
Table 26 Compositional analysis of whey powder 165
Table 27 Nutritional, microbiological and sensory characterization of supplement
169
Table 28 Features of the 96 patients at enrollment and during follow-up 171
Table 29 Impact Categories and their units 174
Table 30 Life Cycle Impact Assessment for the existing Scenario 176
Table 31 Life Cycle Impact Assessment for the Scenario 1 176
Table 32 Life Cycle Impact Assessment for the Scenario 2 177
Table 33 Life Cycle Impact Assessment for the Scenario 3 178

xiii
LIST OF FIGURES
Figure 1 Overview of whey processing 41
Figure 2 Overview of LCA 43
Figure 3 Phases of a life cycle assessment study 45
Figure 4 Flowchart of adopted double microencapsulation
technique
63
Figure 5 Flowchart of milk reception 67
Figure 6 Milko scan 70
Figure 7 Pasteurization section 70
Figure 8 Centrifuge for milk clarification 71
Figure 9 Homogenizer 71
Figure 10 Milk pre-treatment 71
Figure 11 Scheme adopted for the types of cheeses manufacturing 73
Figure 12 Scheme adopted for cheese and whey processing 76
Figure 13 Flowchart for adopted whey processing technique 85
Figure 14 Scanning electron microscope 88
Figure 15 Flowchart of existing scenario 93
Figure 16 Flowchart of scenario 1 95
Figure 17 Flowchart of scenario 2 96
Figure 18 Flowchart of scenario 3 97
Figure 19 Colony morphology of isolates from raw milk MRS agar 99
Figure 20 Colony morphology of isolates from faecal samples 99
Figure 21 Colony morphology of isolates from commercial products 99
Figure 22 Gram positive rods under microscope 100
Figure 23 DGGE gel analysis for selected bifidobacterium strains 106
Figure 24 DGGE analysis for selected lactobacillus strains 107
Figure 25 Bands of DGGE gel of commercial products 108
Figure 26 Zones of inhibition of some isolates 112
Figure 27 Mean loss in Lactobacillus count in SGJ-A 118
Figure 28 Mean loss in Lactobacillus count in SGJ-B 119
Figure 29 Mean loss in bifidobacterium count in SGJ-A 120
Figure 30 Mean loss in bifidobacterium count in SGJ-B 121

xiv
Figure 31 Mean loss in lactobacillus isolates in SIJ 122
Figure 32 Mean loss in bifidobacterium in SIJ 123
Figure 33 Cheese blocks 130
Figure 34 Cheese vats 131
Figure 35 Moisture content in manufactured cheeses during storage 133
Figure 36 Protein content in manufactured cheeses during storage 135
Figure 37 Fat content in manufactured cheeses during storage 137
Figure 38 Ash content in manufactured cheeses during storage 139
Figure 39 Acidity percentage in manufactured cheeses during
storage
140
Figure 40 Salt content in manufactured cheeses during storage 142
Figure 41 pH in manufactured cheeses during storage 143
Figure 42 Calcium content in manufactured cheeses during storage 145
Figure 43 Melt time in manufactured cheeses during storage 147
Figure 44 Flowability in manufactured cheeses during storage 150
Figure 45 Firmness in manufactured cheeses during storage 151
Figure 46 Probiotic bacterial count at 22°C during storage 155
Figure 47 Lactic acid bacterial count at 45°C during storage 155
Figure 48 Total aerobic count during storage 156
Figure 49 SDS-PAGE profile of the colostral whey 162
Figure 50 Double gel diffusion assay for immunoglobulin G 163
Figure 51 Whey processing steps 164
Figure 52 Collection of whey fluid 165
Figure 53 SEM images 167
Figure 54 Drainage system of dairy industry for whey 175
Figure 55 LCIA results for different scenarios 180
Figure 56 Comparison between different scenarios 182

xv
ABSTRACT
Probiotics are live microbes added as nutritional supplements for digestive
system health. The demand for probiotic foods is increasing in Europe, Japan and
the U.S. which reflects the awareness about the importance of probiotics to health.
Neighboring countries such as India, are hosting many international companies like
Yakult and Dannone which are engaged in developing and selling probiotic dairy
products. Pakistan, in contrast, despite of ranking fifth in global milk production, has
a relatively nascent and unregulated indigenous probiotic dairy industry. The market
demand is currently being catered by multinational giants like Nestle.
The objective of this research was to produce an eco-friendly probiotic cheese
with indigenously isolated probiotic strains. A double encapsulation technique was
adopted to increase the survival of these isolates in the gastrointestinal tract. No
significant difference was observed in the hydrophobicity percentage, aggregation
and adhesion ratio for the lactobacillus and Bifidobacterium. The isolates were
selected for their ability to acidify buffalo milk during cheese production. Three
sources were selected for the isolation of probiotic cultures; raw milk, commercial
products (including two freeze-dried products, seven dairy products and one fruit
drink) and human feces. Both the culture dependent and culture independent DGGE
analysis was performed for identification. The isolates selected for further efficiency
studies showed negative results of mobility, catalase, indole, oxidase, and nitrate
reductase. The milk coagulation test was performed to check the coagulating
potential of the isolates. All the isolates gave negative results for gelatins and
haemolytic activity. Carbohydrate fermentation was carried out to identify species. Of
the 20 isolates tested, 80% were resistant to gentamycin, 65% to ceprofloxicin,
55% to kanamycin, 50% to streptomycin, 45% to ciprofloxacin, 40% to neomycin,
30% to vancomycin, and 20% to ampicillin, and 5% to erythromycin, tetracycline and
penicillin. In vitro antagonistic activity of all isolates showed great potential against
Staphylococcus aureus, Listeria monocytogenes, Vibrio cholera, Enterococcus
faecalis, Escherichia coli (E.coli), Salmonella typhi, Pseudomonas aeruginosa,
Klebsiella pneumoniae and Candida difficile.
Five types of mozzarella cheeses were produced using different acidification
protocols: citric acid (CA cheese), commercial starter culture cheese (SC cheese),

xvi
Lactobacillus culture (LB cheese), Bifidobacterium culture (BF cheese) and mixed
probiotic culture (MP cheese). No significant difference was found in the
microbiological properties on storage of 180 days, but the physicochemical, sensory
evaluation and rheological characteristics showed significant effect of pre-
acidification type. The cheese with mixed probiotic culture showed highest overall
acceptance by the end of storage period. The synergistic effect of Lactobacillus and
Bifidobacterium was also indicated by the data obtained during the survival studies in
the stimulated gastric juice and stimulated intestinal juice.
Additionally, in this study the cheese whey was collected after cheese curdling
and spray dried to whey powder. Extracted IgG from bovine colostrum and isolated
indigenous probiotic strains were added together to form a probiotic-based anti-
diarrheal infant supplement and findings of feed trials supported the potential studies
of probiotics as the synergistic probiotic culture in whey supplement which
significantly reduced the duration (1-2 days) and severity of diarrhea in infants up to
12 months age.
An environmental assessment was carried out to quantify the environmentally
significant consequences of the complete life cycle analysis of mature probiotic
cheese from cradle to grave perspective and to identify the environmental hotspots.
There are two major issues that the cheese manufacturers have to face in Pakistan;
handling of whey, which is the by-product of the dairy industry and import of starter
cultures for acidification. The general practice is to drain the whey off into nearby
water bodies. This LCA study was focused on five impact categories; Global
Warming Potential (GWP), eutrophication, acidification, ecotoxicity (water chronic
and acute, ecotoxicity soil chronic), and human toxicity (air, water, and soil). The
assessment revealed that Global Warming Potential (GWP) was mainly associated
with electricity, heat and fuel consumption showing: for existing scenario (965g CO2
equivalent), S1 (probiotics used) (791 g,), S2 (whey utilization as a fertilizer) (1013g)
and S3 (whey utilization as a supplement) (1487g) with the lowest value achieved in
scenario 1 for the use of probiotics. As far as consumption of electricity is concerned,
the lowest was for current practice while in scenario 2 it is highest, maybe because
of freeze drying technology used in the formation of whey powder. The impact
categories of eutrophication and acidification were highly influenced by the treatment
of whey. A Life Cycle Impact Assessment showed that production of 1 ton of cheese
contributes: in current practice (10.57 g), S1 (8.4g), S2 (-41 g) and S3 (5g) to

xvii
eutrophication. The saving found in the S2 scenario is due to the saving of whey
from discharge as waste. Scenario 3 gives little compensation due to the use of
whey on land. But both are an improvement over the existing practice that has a high
rate of eutrophication (58% ) from whey disposal. In scenario 2 by utilization of this
waste savings of more than 80% in eutrophication and 40 % for acidification can be
achieved.

1
Chapter 1
INTRODUCTION
Pakistan is the fifth top milk producing country in the world. Annually, 42.199 million
tons milk is produced. Out of the total milk production, buffaloes contribute 68 per
cent of milk, cows 27 per cent, and remaining 5.0 per cent is contributed by sheep,
goats and camels 1. The Food and Agriculture Organization (FAO) has stated that
buffalo is an "under-valued asset" of the dairy sector. Globally, milk and milk
products are the dietary staples, because of their nutritional values such as protein,
carbohydrate, fat, vitamins, and minerals, especially of the buffalo milk that contains
higher amount of protein, lipids, lactose and minerals. Different technologies are
applied to preserve milk in other forms of dairy products such as ice creams, butter,
and cheese.
Although the milk production is high in Pakistan, yet there is an urgent need to
introduce the value added dairy products that are absent due to lack of knowledge
and expertise in dairy sector, especially in cheese production. No serious efforts
have been made to convert the milk into value added cheese or other products.
However, small units have been established for cheese manufacturing to meet the
market demand for cheese. Furthermore, to promote the dairy market, there should
be the value addition of milk; especially by processing it into the cheese. Cheese is
the most interesting, challenging and diverse product of the dairy industry. Globally,
more than 900 varieties of cheeses are being produced 2 which are classified on the
basis of chemical composition, overall formation, manufacturing, and ripening 3. The
demand for Cheese, especially the mozzarella cheese, is increasing as it is widely
used in fast food corners, hotels, restaurants, airlines, shipping lines and
households. In Pakistan, the food sector is growing annually by about 10% to 15%4.
This demand is fuelled by popularity of western-cuisine, growing urbanization,
increasing per capita income, and flourishing two-income family system. That is why,

2
the local demand for cheese has increased rapidly in such a way that local cheese
manufacturers cannot meet the demand of the market, for this reason cheese is
being imported. Hence, there is an urgent need to capture market share by
producing value added imported quality cheese at a reasonable price.
The Mozzarella cheese can be manufactured by different sources of milk such as
cow, buffalo, goat, and camel 5. Traditionally buffalo milk's Mozzarella cheese is
preferred due to its characteristic flavor and texture. The fresh Mozzarella is moist,
soft, quick in melt and delicate but this freshness lasts for 12-24 hours 6. Mozzarella
cheese is widely used in the pizza industry due to its extraordinary meltability,
stretchability and elasticity 7. The functionality of Mozzarella cheese is important
characteristic which is effected by factors such as the chemical composition
including fat percentage, moisture content, pH, acidity, starter culture, coagulating
enzymes, cooking and stretching, salt percentage, and ripening period or storage 8.
The pre-acidification process also influences the final properties of cheese 9.
Microorganisms play a vital role in the making of cheese 10, the type of starter culture
is key for acid production and final texture and flavor in high-fat as well as low-fat
cheeses11. Commonly, Streptococcus thermophilus and Lactobacillus delbrueckii
ssp bulgaricus or Lactobacillus helveticus are the starter cultures which are used in
mozzarella cheese production 12.
Today, the consumer is conscious about diet and health. Therefore, there is great
potential and need for production of value added and novel low fat cheeses with
good health benefits in the market 13. Globally, the trend for the production of low
moisture and low fat Mozzarella cheese is increasing for pizza industry because of
its desirable functionality 14.
Our country has highest birth rate, which ultimately drives the growth of the health
care sector. But health and environmental conditions are deteriorating, which has led
to increased the outbreaks of disease. An awareness of self-medication has
increased due to an increase in literacy. Recent investigations have highlighted the
beneficial use of probiotics in promotion of gut health as well as in prevention
therapy which has brought probiotic and value added foods in the global limelight 15.
Scientific evidence points out that the ability of probiotics largely depends on the

3
particular strain being used. Pakistan is one of the few countries in the world where
the incidence of diarrhea related deaths in children is very high. Probiotics are ideally
placed as economic public health strategy to prevent diarrhea. However, at national
level, probiotics remain a scientific curiosity to the public and clinicians. The major
share of the probiotics based functionality and value added market is held by
multinationals such as Nestle, which has launched global brand Neslac in India. In
Pakistani markets, it has been introduced as Nestle Honey. The South Asian market
relies on probiotics developed in western countries such as Denmark. Recently,
India has become the biggest market of probiotics in the region (more than $20m). In
Pakistan, the probiotics based functional and value added market is even more
rudimentary and dominated by foreign companies. Probiotics have not been studied
in any comprehensive way in Pakistan, so far.
Data on the new and promising probiotic strains from the local milieu is sparse and
superficial. With a distinct socioeconomic milieu, immunity and gut microbial profiles
of the native populace are distinctly different from the western/Caucasian
counterpart. Therefore, it is reasonable to assume that isolation, identification and
characterizations of probiotics from the Pakistani environment will yield the safest
and most effective strains in tune with the local needs. Besides lacking proper
development capacity, Pakistan lacks in the regulatory framework to certify or check
the probiotic based functional products in the market. Thus, in the absence of
defined rules, there is a high chance for spurious products to be marketed with false
claims. It is therefore critical, for the sake of the public good that such products pass
some essential quality and safety conditions in order to be labelled as a “Probiotic
Product”.
It is critical that in time where probiotics are being used for medical therapy, strain
level identification with a comprehensive analysis of their health benefits and safety
status should constitute a standard operating procedure 16. In spite of their probiotic
promise, certain technological bottlenecks should be surmounted before the
probiotics make their mark on global health market. The data about the probiotics is
limited because of their sensitivity to adverse environmental conditions such as low
pH and oxygen availability 17. The bifidobacterium used in commercial dairy products
have been found to be physiologically distinct from their parent strain present in

4
ATTC18. This problem was further compounded by the fact that unlike clinically
significant bacteria, there were and still are no standardized protocols and
susceptibility data, thus rendering any comparative assessment unreliable 17. The
most problematic of the hurdles is that the scientific data on these probiotics has a
pronounced Western bias. The developing world has scanty data, if any, on the
subject and the concept remains untested and underused. There is a need to
reevaluate the results of western probiotics in the context of local conditions and to
see if the probiotics confer similar benefits. There is strong evidence that the South
Asian Human gut and the microbiome, because of heavy pathogenic stress it
encounters on a daily basis, is believed to be a substantially different environment
from its western, Caucasian counterpart 19. In Pakistan, as well as the South Asian
subcontinent as a whole, the probiotic industry is expected to grow in the coming
years. In the absence of any standardized regulatory protocols, the products would
be invariable and possibly unsafe. Hence it is important that such probiotic products
are standardized and studies conducted to ensure the efficacy of existing and
upcoming probiotics. In Pakistan, there is a lack of value added dairy products as
well as their accessibility, and a large amount of milk is being wasted due to lack of
appetite of consumers. Meanwhile, serious issues of malnutrition exist at high
percentage 20. Due to these reasons, it is beneficial for dairy marketing to convert
milk into value added products, which could be more desirable and healthy for the
consumer.
But whey is produced as a by-product during the cheese manufacturing and
represents the major source of pollution. The development of alternative products
from drained whey is a classical Cleaner Production processing. This wastewater
load can be reduced as well as certain income can be generated from selling the
innovative whey based product. Out of 10 liters raw or processed milk, one kilogram
of cheese is produced and 9 liters of whey are obtained as a by-product. Because of
its high nutritional contents, whey is considered a problematic liquid ‘waste’. It has
been estimated that one liter of drained whey can cause a BOD load of approx.
40’000 mg/l, and COD of approx. 60’000 mg/l 21 which is calculated as 100 times
higher than the effluent load generated by household. This is the reason, the
developed as well as developing countries have set restrictions concerning whey
drained to the sewage system. To avoid water pollution, the whey can be used as

5
fertilizer on agricultural farmland especially for the alkaline soil and land where
groundwater is deep enough or it can be used as animal feed. No doubt, these
methods may reduce the liquid waste burden, but they can not deliver economic
benefits of the product 22. Today big industries dry the whey or treat it with ultra-
filtration and produce whey powders, pure lactose or other products which later can
be used as additives for ice creams, soups, bread and other food stuffs. The ultra-
filtered whey can be used in cosmetics or pharmaceuticals. This leads to develop
whey a higher value added product than using it as animal feed 23.
The dairy industry has its triangular connection among agriculture, dairy farm and
dairy factory 24. Due to the high rate of cheese production, as its demand is high in
the market, it becomes important to assess environmental effects derived from the
cheese industry. LCA is considered a useful tool to identify “hot spots” in the life
cycle of production and can introduce opportunities and alternatives for reducing
environmental impacts and ultimately improving overall efficiency and profitability
related to the process 25. This cradle-to-grave study of cheese production can focus
on the energy demand, consumption of water and other resources and emissions in
air, water, and land. The LCA requires to assess significant impacts of the cheese
production on resource depletion, climate change, and human and environmental
health 26,27. Thus, the investigation and measurements of environmental impacts
should be encouraged.
Life Cycle Assessment (LCA) is an internationally standardised procedure (ISO
14040) which allows the investigation of the environmental consequences of the
finished product by evaluating the potential environmental impacts throughout its life
cycle 28. This environmental methodology has paid special attention to the dairy
sector particularly at dairy farms 26,29,30. Liquid milk 24,31, semi-hard cheese 32 and
milk powder 33 production were assessed in detail. The potential environmental
impacts of a product or process can be assessed by Life cycle assessment (LCA)
technique. The data of LCA is available on the food packaging especially about milk
packaging 34 but no knowledge regarding cheese packaging as well as data from
retail to consumer has been identified. No environmental information is available
about cheese production as LCA is not in practice in the dairy industries of Pakistan.

6
Chapter 2
LITERATURE REVIEW
2.1 Value added Functional foods and their potential use
The notion of 'functional food' was started from Japan in the 1980s; the food
products were fortified with special ingredients which had certain advantageous
physiological effects 35,36. These functional foods are generally used for preventing
disease or other health-promotions as today food is not only used to satisfy hunger
but also to provide essential nutrients for body to improve physical and mental health
of the consumers 37. In order to make the 'functional foods', the fermented milk ,
yogurt, baby foods, sugar -free confectionery, sports drinks, and chewing gum are
generally added with vitamins, minerals, probiotics, and prebiotics 38.
Undoubtedly, the Japanese interest in the value added functional foods has brought
the market of the world, especially in the United States and Europe, towards the
health beneficial foods. Experts have started to realize the importance of economics
and health potential of such value added functional products. In Japan, the
functional foods are grouped in a distinct class which needs a 'FOSHU' (Food For
Specified Health Uses) symbol on the label while concept of functional food in USA
and Europe is to add functionality or value addition in the existing products 39 .
The early developments in functional foods dealt with the addition of minerals or/ and
vitamins such as iron, zinc, calcium, vitamin C, vitamin E, and folic acid 40. Later the
fortification shifted to micronutrients such as soluble fibres, omega-3 fatty acid, and
phytosterol but today the food companies are taking further steps to develop a single
food product that could deliver multiple positive health effects on consumption 41.

7
Recently the global market is dominated by gut health promoting value added
functional foods, particularly in probiotics 16,42. Probiotics is “live microorganisms,
which consumed in adequate numbers confer a health benefit on the host” 36,43.
Generally, two types of probiotic bacteria are widely studied to employ in the
functional foods; Lactic acid bacteria (LAB) and bifidobacteria. These probiotic
bacteria are known to be a component of intestinal microbiota of human and animals
and are traditionally safe for food industry 44.
2.1.1 Probiotics and their role in Value added functional Products
Probiotics are single or mixed bacterial cultures which are given in adequate amount
to animals or humans to confer health benefits by improving the properties of the
indigenous intestinal micro flora 45. These are non pathogenic heterogeneous group
of bacteria 46 that has a number of health benefits such as stimulation of immune
systems, anti-mutagenic effects, improvement in lactose metabolism, reduction in
serum cholesterol, anti inflammatory effects and anticarcinogenic properties.
Because of these health beneficial effects, the probiotics are increasingly being
incorporated into a number of food products especially in dairy foods. In addition,
fermented functional foods based on bioactive peptides have been introduced in the
market which are mainly incorporated by probiotic microorganisms 47.
The basic criteria employed to select potential probiotics are mainly related to
tolerance against bile juice and acid, production of certain antimicrobial agents,
metabolism of cholesterol, production of useful enzymes and safety for food and
clinical use 48. Lactic acid bacteria have been consistently demonstrated to be
responsible for the spontaneous lactic acid fermentation of home made dairy
products in Cameroon, where three genera have previously been identified:
Lactobacillus, Enterococcus and Lactococcus 49. Sieladie found strains of
Lactobacillus plantarum as a dominant species of lactobacilli generally presented
with dairy products. A study was conducted by Morelli et al. in which they identified
107 isolates which belonged to facultative hetero-fermentative group and stated that
the Lactobacilli has more potential to be used as probiotics 50.

8
The selection of type of probiotic strain is a major issue in manufacturing value
added functional foods since cultures can vary considerably in their performance in
cheese and intestinal environments. Research has revealed that cheese is the most
suitable food as a potential probiotic 'functional food' which has certain advantages
over yogurt and fermented milk, which is used as a delivery system for some
probiotic strains 51.
Probiotic bacteria are marketed mainly in fermented dairy foods. No doubt, dairy
products play a predominant role as carriers of probiotic bacterial cultures 52.
According to Heller, these probiotic foods are most suitable for promoting the
positive health image of probiotics for several reasons beside healthy interactions
with the food matrix and the starter culture, the reasons are:
Fermented foods, especially milk products, already have a positive health
image in public;
Consumers already know the compositional fact of fermented product that it
contains live microorganisms (bacteria)
Probiotics are used as starter organisms which combine the positive images
of fermentation and probiotics.
While marketing the probiotic fermented products, several factors must be
considered such as survival of probiotics in the product as well as in the
gastrointestinal passage of the host. The main factors are;
The physiologic state of the probiotic strains added (whether the cells are
from the logarithmic or the stationary growth phase),
The physical conditions of product storage period (such as temperature),
The chemical composition of the product to which the probiotics are added
(e.g., total acidity, carbohydrate, nitrogen, mineral, oxygen and water
contents), and
Possible links between probiotics and the starter cultures (such as the
production of bacteriocins, their antagonistic and synergistic effects).
Recent studies have provided evidence that intake of probiotics is an effective tool in
microbial balance and gut homeostasis 53. Most probiotics are categorized into lactic
acid-producing bacteria which are consumed in the form of dairy products mainly

9
yogurt. The published beneficial effects of lactic acid bacteria consumption include;
improving health of the intestine, enhancing the immune system, enhancing the
bioavailability of essential nutrients, reducing lactose intolerance associated
symptoms, decreasing the prevalence of allergy and reducing risk of certain types of
cancers 54.
A variety of factors have been reported which affects the viability of probiotic bacteria
in functional dairy products, including pH, titratable acidity, hydrogen peroxide
(H2O2), processing and storage temperatures, dissolved oxygen content, added
species and strains, concentration of acetic and lactic acids and even concentration
of whey protein in milk 55-57. However, the mechanisms for the action of probiotics
are unknown, but reports reveal that they modify gut pH, produce antimicrobial
components to antagonize pathogens, compete for available nutrients, growth
factors and pathogen binding and receptor sites, stimulate immunomodulatory cells,
and produce the lactase enzyme in the body. Recent research has supported the
health beneficial role of probiotics as a diet for human as well as for animals and
regard it to provide a safe and cost effective approach against microbial infection 54.
Souza et al. investigated in vitro properties of four strains of bifidobacteria, including
B. longum, B. breve, B. pseudolongum and B. bifidum, which was isolated from
faeces of children. Growth rate, aerotolerance, antagonistic activity, antimicrobial
susceptibility and cell wall hydrophobicity were tested. They concluded that B.
longum shows the best potential for probiotic based on above parameters showing
the greatest sensitivity to antimicrobials, the highest capacity of antagonistic
substances production and the best growth rate 58.
2.1.2 Health Benefits of Probiotics- particularly in prevention and treatment of
diarrhea
Probiotics, being health beneficial bacteria, favourably promote the intestinal
microflora, inhibit the growth of pathogens, enhance good digestion, boost immune
systems and increase host's resistance to infection 59. Other physiological benefits
of probiotics include removal of carcinogens, lowering of cholesterol,

10
immunostimulating and allergy lowering effect, synthesis and enhancing the
bioavailability of nutrients and alleviation of lactose intolerance 54.
A potential therapeutic role of probiotics has been reported such as cholesterol
lowering, improving lactose tolerance, nutritional value addition and preventing role
in cancers and antibiotic associated diarrhea 60.
Recent studies have highlighted that health benefits of probiotic bacteria are totally
associated with their capability of colonizing intestinal tracts. This necessity
disqualifies majority of strains of Lactobacillus and Bifidobacterium used generally in
fermented products especially in dairy industry 61. The major reason behind the
potential health benefits of probiotics may be due to the acid production, and/ or
prevention in adherence of pathogens to intestine by competition, bacteriocins
production and improvement in the immune system 62.
Multi-strain probiotics emerge to be more effectual than single culture against an
extensive range of diseases including irritable bowel syndromes, diarrhea,
modulation in gut microflora, inflammatory bowel disease (IBD), atopic disease,
respiratory tract infections and immune function 63. However, it is still unclear
whether the efficacy is due to synergistic combinations or is the result of high
probiotic dose.
The human gut harbors a diverse microflora representing hundreds of different
species, this colonization starts soon after birth 64. Bifidobacterium predominates to
level of 1010 to 1011 CFU/g in the breastfed infants between 4-7 days while
Lactobacillus is found in adult faeces 65. The disturbance in the gastrointestinal tract
is found because of reduction or disappearance of bifidobacterium and increase in
the level of aerobes such as enterobacteriaceae and streptococci 66.
The gut microbiota is also known to be involved in aging as it declines the immune
system. Toward investigated that in population above 60 years the count of
Bifidobacterium markedly decreases which leads to a reduction in the natural
inhibition of the growth of some pathogens and ultimately increase the susceptibility
to infections. Research has found that this decline can be reversed by the use of

11
both the probiotics and prebiotics. Both approaches help in the reduction of
immunosenescence by altering microbiota profiles beneficially. Probiotics reduces
the colonisation of pathogens and counteract chronic inflammation 67. Lahtinen et al.
have highlighted the anti-aging potential of probiotics. According to latest research
the alterations in the intestinal microbiota and immunosenescence are the main
cause of aging which can be prevented by use of probiotics 68. Probiotics can also be
beneficial to elderly consumers because they have ability to modify the intestinal
microflora beside improving immunological functions. Lahtinen at al. conducted
randomized-controlled clinical trial to assess the probiotic cheese containing L.
rhamnosus and L. acidophilus on the intestinal microbiota of 31 elderly volunteers
and used cheese as a carrier of probiotics. The probiotic cheese flourishes the
growth of L. rhamnosus and L. acidophilus, which highlights the survival of the
particular strains in the gastrointestinal tract. Importantly, it has been suggested that
the use of probiotic-cheese is linked to reduction in number of Clostridium difficile
when compared with the plain cheese 69.
Diarrhea is known to be the second pre-eminent cause of death, especially in
children. under 5 years of age which kills around 1.5 million children every year .No
doubt, the rehydration reduces the death risk but it is not effective in shortening the
duration of the disease70. The main cause of diarrhea, in more than 30% of the
patients, is mild to severe disturbance of gastrointestinal flora due to the use of
antibiotics 71. Clostridium difficile infections and antibiotic associated diarrhea (AAD)
are the most common among patients 72.
Probiotics, the live microorganisms, are intended to have an anti-diarrheal health
benefit when consumed. Prebiotics are combined with the probiotics to enhance the
health effects of preparations; these preparations are referred as 'synbiotic
preparations'. In fact, prebiotics are non-digestible food ingredients which may
stimulate the bacteria in the colon of host. Probiotics help in maintenance of gut
microbiota during or after antibiotic treatment. The mechanism of action of probiotic
bacteria may be through receptor and nutrition competition with pathogens,
prevention in epithelial and mucosal adherence of pathogens, lowering of colonic pH
inhibiting the growth of pathogenic species, stimulate host immunity, or production of
antimicrobial substances 73.

12
With the passage of time, the interest in the use as well as the evidence of probiotic
bacteria to be effective in the prevention and medication of antibiotic associated
diarrhea is increasing 74. Two meta-analysis, conducted in 2006, suggested the
reduced risk of the associated diarrhea by the use of probiotics 75. In 2011, Johnston
suggested a safe association of probiotics use in preventing antibiotic associated
diarrhea in children as well 76.
Hempel et al. evaluated broadly the available scientific data about probiotics and
their symbiotic interventions among Bacillus, fungus such as Saccharomyces,
Lactobacillus, Bifidobacterium, Streptococcus spp, and Enterococcus, single as well
as in combination, for the prevention and medication of antibiotic associated
diarrhea. They conducted research using randomized 82 controlled trials (RCTs),
and revealed that the majority used Lactobacillus based interventions, single as
wells as in combination with other probiotics. The pool of 63 RCTs, included 11811
patients, indicated a statistically significant relation of probiotics administration with
reduction in antibiotic associated diarrhea (AAD) 77 . The pooled evidence verified
that probiotics are associated with a scaling down the symptoms of AAD but more
scientific research is required to determine which type of probiotics are associated
with the greatest effectiveness and for which type of antibiotics.
The meta-analysis of Salari et al. showed that probiotics decrease significantly the
duration of diarrhea and fever in children while no significant results were found for
the duration of hospitalization, vomiting and number of stools per day. They
concluded that probiotic treatment does not support the adult's Clostridium difficile-
associated diarrhea, amebiasis, diarrhea in HIV positive patients, diarrhea induced
by radiation, and chemotherapy-induced diarrhea. They suggested the researchers
to agree on definition of termination of diarrhea in order to harmonize the designs
and outcomes of studies 70. Although no adverse effects of probiotics have been
communicated but some investigators had concerns about the risk of fungaemia by
S. boulardii especially in HIV or critically ill patients 78.
It is notable that diarrhea can prove to be a symptom of an undiagnosed
inflammatory bowel disease so the efficacy or effectiveness of probiotic bacteria in

13
such cases return to their potential in regulating immune status of host intestine 70.
Having the preventive as well as curative effects, the probiotics effect several types
of diarrhea of different etiologies. Prevention and therapy by probiotics for diarrhea
have been successfully investigated by a number of investigators but assessment of
probiotics efficacy in vivo models is largely missing 79 .
In developed countries, the recommended treatments for community-acquired acute
diarrhea are oral rehydration salts (ORS) with zinc, and continued feeding in
children. However, globally, the popularity of probiotics is increasing for the
treatment of acute diarrhea. Applegate et al. systematically reviewed the randomized
controlled trials to evaluate the effectiveness of probiotics for the treatment of
community-acquired acute diarrhea in children. They measured the efficacy of
probiotic treatment in addition to recommended rehydration. It was found that
probiotic bacteria reduced diarrhea duration by 14.0% and stool frequency on the
second day of treatment by 13.1%. They concluded that probiotics have the ability to
reduce diarrhea duration and stool frequency. Meanwhile they recommended more
scientific research in developing countries to understand the effect of probiotics as a
treatment therapy for diarrhea among children. The cause of different diet habits and
therapies, as , in developing countries, zinc is not included in the treatment of
diarrhea 80.
Jeannie et al. determined the virtue of probiotics in the reduction of duration of stool
in children <5 years old suffering with acute diarrhea. They meta-analyzed 18 eligible
studies dealing with co-administration of probiotics with rehydration therapy shows a
decrease in duration of diarrhea by ∼1 day. In their subsequent analyses they limited
their study to hospitalized children and evaluated lactobacilli as a probiotic strain.
They concluded that probiotic therapy with strain of lactobacilli, undoubtedly,
shortens the duration of acute diarrheal episodes in children in approximately 24
hours 81.
The molecular investigations have verified the species diversity and metabolic
complexity of the human gut microbiota. It has also been revealed that the human
gut microflora plays a pivotal role in host health. Human gut is the source of infection
as well as provides protection against disease and maintenance of gut functionality.

14
However, very little research has been conducted on the health impacts of the
dominant groups of gut microflora. It is generally accepted that there are two
important components; bifidobacteria and lactobacilli which are termed as the
beneficial gut microbes. In the last few decades, the management tools for
probiotics, prebiotics and synbiotics have been investigated and commercialized
rapidly 82.
Some evidence suggests that probiotics play a vital role in reducing the threat of
rotavirus-induced diarrhea and colon cancer. The combination of probiotics with
prebiotics in the symbiosis has not been calculated. This amalgam with prebiotics
and non-digestible food ingredients , might improve the multiplication and survival of
the probiotic bacteria in the gastrointestinal tract, thereby enhancing the probiotic
effects in the large intestinal bowel that can even be synergistic. Research on
prebiotics is limited, only information about insulin-type fructans is available which
brings the functional food ingredients in limelight 83.
Generally, strains of lactobacilli, bifidobacteria, streptococci, and enterococci have
been used to prevent traveller's diarrhea caused by enterotoxigenic E coli. But
neither L acidophilus nor Enterococcus faecium showed probiotic effect on Austrian
tourists84. However, reduction in diarrheal incidence was observed from 71% to 43%
in tourists of Egypt who were ingested with S. thermophilus, L. bulgaricus,
Lactobacillus acidophilus and Bifidobacterium bifidum 85.
The colonic microflora normally resists the invading foreign organisms, but
pathogens are often able to colonize when normal microbiota is impaired by any
stress, illness, antibiotic treatment, changes in diet, or physiological alterations in the
gut. Bifidobacteria plays major role in resisting the colonisation of pathogens in the
large bowel 86. Feeding of B. breve to children suffering with enteritis eradicated
Campylobacter jejuni. This was confirmed by observing their stools 87. While the
supplementation with B bifidum and Streptococcus thermophilus reduced rotavirus
shedding and episodes of diarrhea in children 88.
Research on lactobacillus GG showed successful eradication of Clostridium difficile
in patients with relapsing colitis 89. Lactobacillus GG had shown to colonise the gut
with the secretion of antimicrobial product that was effective against C. difficile and a

15
range of other pathogens 89. However, research shows that not all lactobacilli are
effective in combating enteric pathogens. Twenty three healthy volunteers were
given a commercial product containing Lacidophilus and L bulgaricus and were then
challenged with enterotoxigenic Escherichia coli under same controlled conditions of
attack rate, incubation period, and duration of illness. The yeast Saccharomyces
boulardii has also been used as a probiotic for the prevention and cure of diarrhea
associated with C difficile. The researchers concluded that prophylactic use of the
probiotic reduced the incidence of diarrhea associated with C difficile infection,
although S. boulardii did not prevent acquisition of the pathogen 90.
Gorbach et al. studied Lactobacillus casei, in adults and children and found that it
colonizes the human gastrointestinal tract in majority of cases for 1-3 days and up to
7 days in 30% of subjects studied. LGG showed improvement in the cases of
traveller's diarrhea, antibiotic-associated diarrhea, and deteriorate Clostridium
difficile colitis as well as reduction in severity in duration of infantile diarrhea beside
increasing level of IgA and other immunoglobulin in the human intestinal mucosa and
releasing local interferon 61.
Certain probiotics have shown promise in certain clinical areas but the progress
demands optimization of the probiotic strain, doses and formulations of products,
including matches of these formulations with choosing responsive subpopulations as
well as identifying ways to change diet to alter bacterial profiles and metabolism 91.
Persistent diarrhea is a diarrheal episode that starts acutely and lasts for 14 days or
more, and ultimately becomes a major cause of morbidity and mortality in children
under five years particularly in developing countries. The unknown cause of
persistent diarrhea is not completely understood which make management of the
condition difficult. Probiotics and yeasts that are similar to the normal flora found in a
healthy gut, so called friendly bacteria have been used in clinical research to treat
acute infectious diarrhea with satisfying results. Two studies with a combined total of
324 patients, showed that probiotics shorten the duration as well as frequency of
diarrhea on day-5. One study of 235 children suggested that probiotics reduce the
hospitalization period. Reports of three out of four trials showed no adverse events
92. However, there is a need for more trials with large number of participants to make

16
a reliable estimate of probiotics' effect on health. Undoubtedly, Bifidobacterium are
colonized in human gut with a large variety of other bacteria which are beneficial for
human physiology and pathology. FEnglanduda et al found that acetate produced
by bifidobacteria provide intestinal defence to epithelial cells and also protects from
lethal infection 93.
The probiotic products have an excellent safety profile, as none of the study have
revealed any serious adverse results. The probiotics treatment have been used in a
vast variety of patients including diarrheal patients as it is a global problem. Since,
the efficacy of probiotics is strain and disease specific 94, therefore, the future
research should confirm the present research and expand exploration of newer
probiotic strains.
2.1.3 Use of Cheese as a Probiotic carrier
Cheese, a dairy product, has a great potential for delivery of the probiotics into the
human intestine because of its distinct chemical and physical features. Cheeses
have a high pH, lower titrable acidity, higher buffering capacity, greater fat
percentage, higher nutrient availability, lower oxygen value, and denser matrix of the
texture as compared to other fermented milks. In addition to these characteristics,
there are a large variety of cheese types consumed all over the world. Cheese is a
long-term diet. The nutritional value and therapeutic properties have increased
regular market growth for probiotic cheeses. In order to obtain probiotic health
benefits, these bacteria must remain viable in food products above a threshold level
of 106 CFU/ g until consumption, without adverse sensory attributes. Large number
of publications relate to the use of probiotics into different types of cheese matrices,
studying the effects of different compositional and process factors which can affect
the viability of probiotics in food products as well as their sensory properties. Karimi
has categorized the following overall factors which can influence the stability of
probiotics in cheese 95;
Formulation factors (strains, microbial interactions, pH, titrable acidity,
hydrogen peroxide, molecular oxygen, growth promoters, food additives, salt,
microencapsulation, and ripening).

17
Process factors (incubation temperature, heat treatment, inoculum types, and
storage temperature)
Packaging factor (materials and systems).
Because of growing public diet-related health awareness, the demand for
probiotic foods like milk and yogurt has increased. Generally lactobacilli and
bifidobacteria are associated with a plethora of health benefits which range
from symptoms alleviation of lactose intolerance, treatment of diarrhea,
reduction of blood cholesterol to cancer suppression 51.
Now a days, keeping in view the high quality nutritional image of cheese,
research efforts are devoted to the investigation of probiotic cheese
containing an effective viable count of Lactobacillus and Bifidobacterium with
demonstrated health promoting properties. These efforts have pushed the
cheese into the category of 'functional foods'. No doubt the viability and
functionality of probiotics during processing as well as during shelf-life are the
big challenges for the researchers. Cheese, in contrast to yogurt and
fermented milk have long ripening times of up to two years, so, during this
time, the added probiotics would need to grow and/or survive to sufficient
numbers to deliver the probiotic effect in the gastrointestinal tract of consumer
51.
Hayes also supported the cheese as a captivating food-based delivery
channel for probiotic bacterial cultures as well as other biogenic peptides and
other materials such as conjugated linoleic acid (CLA) 96. They reasoned that
cheese, when compared to other numerous fermented foods, has a relatively
high solid consistency, pH and fat content with higher buffering capacity. In
fact, the combination of these features probably improves the protection of
probiotic activity during processing, storage and consumer's gastrointestinal
tract. However, the research requires that probiotics and biogenics must be
technologically compatible with the cheese production. Therefore, there is a
need to assess attributes of probiotic bacteria and biogenics while
considering cheese as the delivery channel for probiotics. Moreover, the
delivery and production of bioactive compounds in cheeses must not disturb

18
the cheese microflora by meddling in ripening and flavor development of
cheese. Moreover, cheese itself is a natural wellspring of bioactive peptides
which head from the proteolysis of lactic acid bacteria (LAB) on proteins of
milk during cheese processing and storage period 96.
Gomes and Malcata manufactured probiotic semi-hard goat cheese and optimized
the method by different amounts of starter inoculum, salting, the addition of a protein
hydrolysate, the ripening time to improve the microbiological, biochemical, and
sensory properties of the cheese. They used Bifidobacterium lactis and Lactobacillus
acidophilus as starter cultures. The production of acid continued throughout the
manufacturing process while the growth capacity varied for both strains depending
on the physicochemical characteristics of the cheese. They observed that the
viability of the probiotic strains increased and reached to a level above the accepted
threshold (106 cfu/g) for a probiotic health effect. The RSM (response surface
methodology) indicated the optimization of goat cheese making by adding 0.30%
(vol/wt) milk hydrolysate, 3 × 10⁷ count of B. lactis and 7 × 10⁶ of L. acidophilus
cells/ml of milk, respectively, 3.50% (wt/wt) salt, and ripening for 70 days 97.
Daigle et al produced probiotic cheeses with microfiltered milk standardized with
cream enriched with native Phospho-caseinate retentate using Bifidobacterium
infantis. During the manufacture and storage of cheeses, the viability of the
bifidobacteria was determined. Biochemical changes such as proteolysis, sugar
metabolism, and organic acid production were estimated. No bifidobacteria growth
was observed during cheese-making steps. Bifidobacteria survived very well with
cheeses packed in vacuum sealed bags kept at 4°C for 84 d and remained above 3
x 106 cfu/g of cheese. No significant difference was perceived between cheeses
produced with or without bifidobacteria for fat, protein, moisture, salt, ash, or pH.
After 12 weeks of storage, more than 56% of the as1-CN was hydrolyzed in cheeses
that were produced with bifidobacteria and inoculated at 108 cfu/g in the cream, and
>45% of hydrolysis was observed in the control cheese. However, no significant
differences in the electrophoretic sodium dodecyl sulfate-PAGE patterns were
observed in cheeses at any period of storage. On the first day after manufacture,
lactose was completely hydrolyzed in cheeses made with bifidobacteria, which
suggested high galactosidase activity by B. infantis. Small quantities of acetic acid

19
were detected in bifidus cheeses. consequently, the study revealed that B. infantis
introduced into hard pressed cheese exhibited excellent viability during storage for
12 weeks 98.
Medici et al found the Probiotic Fresh Cheese (PFC) as a suitable channel for the
oral intake of Lactococcus lactis, Streptococcus thermophilus, Lactococcus lactis
Bifidobacterium bifidum, Lactobacillus acidophilus and L. paracasei. PFC showed
the viability of the probiotic bacteria up to 60 days after production. Such type of
cheese also protects from the development of acidity. They also noticed that the
PFC microflora was present as bacterial antigens in Peyer's patches, immune cells,
small intestine, in the nodules and crypts of the mice's large intestine using
fluorescein isothiocianate (FITC) -labelled probiotic bacteria. By adopting the
histological techniques, a significant increase in the phagocytic activity was found
with number of IgA+ and CD4+/CD8+ ratio after 5 days of medication with PFC. But
no significant results were found in the control group. B. bifidum and L. Paracasei
were observed in the small intestine while L. acidophilus was residing in the large
intestine99. They endorsed that PFC is a fermented dairy product which develops the
capacity of Lactobacillus acidophilus, Bifidobacterium bifidum, and L. paracasei to
exert consequential immunomodulating outcomes in the gastrointestinal passage.
Mäkeläinen et al studied the probiotics Lactobacillus acidophilus NCFM and
Lactobacillus rhamnosus HN001 in cheese using models simulating the human
gastrointestinal tract with the aim of investigating whether the cheese matrix affected
the survival and metabolic properties of these probiotics. Probiotics in cheese
survived in the simulated gastrointestinal conditions, and numbers of L. acidophilus,
L. rhamnosus and total lactobacilli were increased in the colonic fermentation
simulations of the probiotic cheese when compared with the non-probiotic cheese
used as a control. This cheese beneficially affected cyclooxygenase-gene
expression of colonocytes in a cell culture model. Freeze-dried probiotics, which
were also analysed in the colonic simulator, showed similar changes in Lactobacillus
numbers, although they gave a stronger increase and also affected other microbial
groups. These results recommended that the probiotic microbes in cheese survive in
the gastrointestinal tract and that the cheese matrix does not seem to affect the
probiotic survival 100.

20
The activity of probiotic cheese is mainly dependent on the temperature; during
processing as well as in storage period. Vinderorla et al. studied the impact of
temperature on the growth capacity of probiotic cheeses made by starters
Lactobacillus paracasei A13, Bifidobacterium bifidum A1 and L. acidophilus A3
during its manufacture and storage at 5 °C and 12 °C for 60 days. They found a
negative impact on sensorial characteristics when cheeses were stored at 12 °C for
60 days. Over the nine years of study, they investigated that there was variation in
the total colony counts in the commercial product but counts for each probiotic
bacteria were always above the minimum value. Growth capacity of L. paracasei
A13 was found low in cheese during manufacturing and storage, mainly in retail
display cabinets in supermarkets (12 °C or more). This study highlights the
importance of storage temperature for the sensorial characteristics and shelf life of
commercial cheese101.
Extensive safety testing has proved that probiotics have no pathogenic effects in
humans as well as in animals 61. The two genera, Lactobacillus and Bifidobacterium,
have been extensively investigated and are incorporated in fermented foods as
probiotics due to widely known beneficial effects 102. GRAS status has been awarded
to genera Lactobacillus spp., Bifidobacterium spp. and Lactococcus spp. for their
probiotics potential 103; among them Lactobacilli species have evidence to be of
great potential to bring health virtues to the consumer 104.
Globally, the popularity and use of probiotics has continuously been increasing and a
variety of functional products have been marketed 105. The rapid increase in the price
of pharmaceutical preparations and overuse of antibiotics for treatment of various
diseases has led to finding a more powerful alternative for health of the gut
microflora. Market has turned towards food items which deliver the health benefits,
known as 'functional' foods 106 instead of early approaches involving vitamins and
mineral supplements.
Since the 1920s, the foods containing probiotics have been marketed in Japan for
human consumption 107. Lactobacillus acidophilus and L. casei were the first
bacteria used in fermented milk products 108. Food sources are considered as an
ideal vehicle for delivering probiotics to the human gastrointestinal tract (GIT)

21
particularly the dairy products 109. The dairy products when used as a carrier may
enhance bacterial survival in human gastric juice due to high buffering or protective
nature51.
At present, globally, the probiotic cultures are mainly incorporated into dairy
products such as ice creams, fermented milks, milk powders, yogurt, cheese,
chocolate products and frozen desserts 110. Probiotics have been supplemented in
foods for about a century, mainly in milk and yogurts. Selected probiotics have also
been incorporated in cheese which has been proved to be a better carrier for
probiotics and can deliver them in controlled numbers. The food matrix is of great
concern for the survival of probiotics in the consumer's intestine. Since survival of
significant number is a precondition for the health beneficial effects of probiotic
bacteria.
A recent study has shown that consumption of probiotic based cheese (15 g or 109
CFU/day) enhances immunity by increasing both natural killer cell and phagocytic
activity. This verifies earlier investigations L. rhamnosus HN001 in fat-free milk,
showing that cheese can be a suitable carrier for probiotics 111. In the last few years,
a modern trend has emerged to use the probiotic cultures in the dairy industry. The
main reason is to enhance nutrition and health of consumer and better organoleptic
properties of dairy or food products. Probiotics can facilitate protection against
pathogens in the gut reducing the severity of certain diarrhea as well as atopic
eczema in more susceptible infants. These bacteria also help in the development of
the immune system, by improving human nutrition and colonic health. This has led to
a greater acceptance by the consumers 112.
Cheese is a potent carrier of probiotics, and daily probiotic consumption enhances
innate immunity in elderly people. The ingestion of the probiotic cheese remarkably
increases the cytotoxicity of NK cells as well as the phagocytosis113. Mäkeläinen et
al. studied different models for the investigation of cheese matrix in relation to
survival and metabolic properties of probiotics Lactobacillus acidophilus NCFM and
Lactobacillus rhamnosus HN001. They found that probiotics survived in the
simulated gastrointestinal tract and count of L. acidophilus, L. rhamnosus and total
lactobacilli increased in the colonic fermentation simulations as compared to non-

22
probiotic cheese which was used as a control model. The probiotic-cheese matrix
showed positive effect on cyclooxygenase-gene expression of colonocytes culture
model. Freeze-dried probiotics, showed similar results in the colonic simulator. Their
results proved that the probiotic bacteria in cheese survive in the gastrointestinal
tract (GIT) without interrupting the cheese matrix 100.
Recent studies limelight the various factors which directly affect the manufacturing of
Multistrain Probiotic cheese such as oxygen level, type and time of inoculation of
probiotic bacterial cultures, starter culture addition and salting in curds and whey. As
probiotic bacteria, being oxygen-sensitive, grew a little during fermentation,
especially Bifidobacterium longum. Mostly, up to 29-92% of probiotics are found in
curds. The overall bacterial distribution between curds and whey is influenced by
strain, time of inoculation and salting. Inoculation of probiotics in milk before
renneting reduces the bacterial cells to almost half as compared with addition before
cheese and probiotics improves their subsequent stability by 1 log over a 20-day
storage. As far as salting is concerned, about 13% loss of probiotics occur during
processing and in a 3 log cfu g−1 greater loss of B. longum just after 3 days of
storage 114.
According to Gomes et al., there are some technological hurdles in the production
and sustainability of probiotic cheeses. Firstly, lack of scientific data on the capacity
of cheese as a probiotic carrier and secondly, questions about the viability and
feasibility of probiotic cultures during processing and storage. In addition, the
maintenance of the excellence of such products using physicochemical parameters
must be measured in order to target the optimization of the whole process115.
Functional microorganisms and health benefits represent a combination with great
potential for fermented functional foods116. Several health benefits are claimed for
foods containing probiotic microorganisms, especially Lactobacilli and
Bifidobacteria117. Recent reports highlight benefits and limitations under various
medical and health-related areas: (1) control of intestinal inflammation and
therapeutic role in gastroenterology 118; (2) maintenance of remission in Cohn
disease119; (3) improvement of human health and control of antibiotic-related
diarrhea120; (4) control of infections during pregnancy and prevention of urinary tract

23
infections121; (5) management of allergic diseases 122; and (6) several other medical
applications123.
A wide range of microorganisms have been used as probiotics. The most commonly
used organisms in probiotic preparations are lactic acid producing bacteria such as
lactobacilli, streptococci, Bifidobacteria, Bacillus spp. and fungi like Sacharomyces
cerevisiae, Sacharomyces boulardii and Aspergillus oryzae124. No doubt, lactic acid
bacteria (LAB) have gained major attention for probiotic activity and have generally
been considered as good probiotic organisms 125.Among lactic acid bacteria,
lactobacilli are the most important 126 especially in poultry, the ileum flora are mainly
composed of lactobacilli 127.
Many lactobacillus strains isolated from various sources are being used as probiotic
agents and it is unlikely that each species/strain possesses all of the desired
characters that will make it a suitable probiotic 128. Lactic acid bacteria (LAB),
especially lactobacilli, are normal inhabitants of intestinal tract of humans and
animals and are also found in milk and milk products66. The use of LAB for their
potential use as probiotics in animals is increasing129. Among lactic acid bacteria,
Lactobacillus genus is expected to be dominant in the crop flora of chicken as well
as in conventional yogurt because in this study, 3 (out of 4) species were isolated
from the crop region, one from the ileum and 3 from yogurt. API-50 CHL tests also
showed that species of Lactobacillus variation in their ability of fermenting different
carbohydrates and acidifying activity. On the basis of API-50 CHL identification,
Lactobacillus acidophilus, Lactobacillus delbrucekii ssp bulgaricus, Lactobacillus
paracasei ssp paracasei, Lactobacillus rhamnosus and Lactobacillus salivarius were
evaluated for their probiotic properties 130.
Ong et al. researched the survival and impact of Lactococcus, Lactobacillus
acidophilus, Lb. casei, Bifidobacterium longum, Lb. acidophilus, Lb. paracasei, B.
lactis on the properties of cheese. All strains survived during cheese processing and
maintained their number to >7.5 log10 cfu/ g at the end of ripening. No significant
change was observed in fat, protein, salt and moisture contents of cheese except the
increase of acetic acid concentration. Moreover, low proteolysis activity was noticed

24
in all batches of cheeses which endorsed that cheeses can be effectively used as a
channel or carrier for delivery of probiotics 131.
The popularity of functional foods is increasing in the consumer market to fulfil two
major targets; consumer desire of flavorful food and to fulfil their health needs.
Probiotics have exerted positive impact on the marketing of these functional
products. Probiotics directly and indirectly effect the overall health of consumer
especially the composition of gut microflora. However, the live and active bacterial
culture is the essential part of such products in order to be beneficial for the
consumer 132.
The food products would be excellent vehicles to deliver the probiotic health effects if
the values of viable probiotic bacteria of all dairy and non-dairy foods are between
107 and 109 CFU/g at end of the shelf-life 132. Ranadheera supported the use of food
as a carrier for the dispatch of probiotics to the human gut since the food material
helps to buffer the probiotics through the consumer's gastrointestinal tract, regulate
their colonization, contain functional bioactive ingredients and ultimately interact with
probiotics to alter their functionality and efficacy. Moreover, the physicochemical
properties of food carriers directly affect the growth and survival of probiotic cultures
in the gastric transit of consumer. The functional and technological properties of
probiotics change with the food ingredients as they effect the overall adherence to
gastrointestinal epithelium, acid production, and tolerance to gastric juice and bile
110.
Researchers have investigated the different combinations of Lactobacillus and
Bifidobacterium such as Bifidobacterium bifidum, Bifidobacterium longum,
Lactobacillus acidophilus, and Lactobacillus casei in cheese and have evaluated the
suitability of probiotic cheese as a food carrier of probiotics. It has been revealed that
majority of probiotic cheeses with different combinations of bifidobacteria and L.
acidophilus had a satisfactory viability during storage period 133. But in the
development and stability of probiotic cheeses, researchers have to face some
technological hurdles; firstly, the potential of cheese itself as a carrier as compared
to yogurts or other milk products. Secondly, the issues concerning the viability of
probiotics in these cheeses. The overall matter of concern is that the probiotic
cheese production should face lowest changes when compared to other traditional

25
products. Thirdly, the physicochemical factors that influence the quality of these
functional products must be considered and optimized 115.
Kourkoutas et al. immobilized the Probiotic strain Lactobacillus casei and used it in
probiotic cheese making, a free L. casei cheese was prepared to deal as a control.
They ripened cheeses at 4 to 6°C and investigated for the effect of salting and
ripening time on lactose, lactic acid, ethanol percentage, pH, and viable count of
lactic acid bacteria. They observed the percentages of fat, protein, and moisture
contents and found them in the range of usual levels of commercially available
cheeses whereas no significant differences were observed in cheese flavor by the
panel between cheese containing free L. casei and rennet cheese 134.
The composition, ripening time and sensory attributes were determined by
Kasımoğlu 135 in Probiotic white cheese inocculated with Lactobacillus acidophilus.
They studied the proliferation of L. acidophilus during storage period in the vacuum
or in brine. They made two kinds of white cheeses, one traditional cheese which was
used as control and produced by Lactococcus lactis ssp. lactis and Lactococcus
lactis ssp. cremoris) and the other probiotic cheese using L. acidophilus,
Lactococcus lactis ssp. lactis, and Lactococcus lactis ssp. cremoris. All samples
were stored in vacuum pack or in brine at temperature of 4°C for 90 days and later
assessed for the compositional and microbiological analysis, proteolysis, and
sensory evaluation. At the end of storage period, the vacuum packed L. acidophilus
should be >107 cfu/ g, which is the necessary count for positive health effects. They
found significantly different results in compositional properties such as protein,
percentage of lactic acid, dry matter, and salt content in the vacuum-packed than
brine-salted probiotic cheeses and found high levels of proteolysis and sensory
scores of all cheeses. Consequently, they recommended the use of probiotic strain
L. acidophilus in the production of probiotic white cheese and also recommended
the vacuum packaging for shortening the ripening period.
Ryhänen 136 developed a new type of low fat cheese. The cheese was made using
cheese traditional starter cultures in addition to Lactobacillus acidophilus and
bifidobacteria. They studied the growth and viability of L. acidophilus and
bifidobacteria in the cheeses during ripening for 13 weeks and storage of 4 months.
Optimization of temperature and ripening time yielded a new, low-fat cheese with a

26
strongly acceptable flavor and taste. The reduction in fat content of approximately
11% proved no adverse effect on organoleptic quality of cheeses. Consequently, on
the basis of investigations during this study, they suggested that the new cheese
may have a beneficial impact on health.
De Souza investigated the sensory acceptance of different formulations of probiotic
Minas fresh cheese. Cheese samples were supplemented with Lactobacillus
acidophilus (T1), Lactobacillus acidophilus + Streptococcus thermophilus (T2) and
control with no starter culture (T3). Sensory evaluation was performed at 5 °C at the
interval of 7 and 14 days using a 9-point hedonic scale. No distinct difference was
found among cheeses T1, T2 and T3 but cheeses T1 and T2 indicated high level of
acceptance as compared to T3 137.
Hatakka et al. studied the potential of probiotic bacteria to inhibit the growth of
pathogens. Overgrowth of oral yeast is a common problem among the elderly. They
tested the hypothesis that probiotic based cheese can reduce the prevalence of oral
Candida. They conducted a randomized, double-blind, placebo-controlled 16-week,
study on 276 people who were allowed to intake 50 g of probiotic cheese. The
primary outcome of the study was the prevalence of a high yeast count (≥ 104 cfu/ml)
analyzed using the Dentocult® method. The prevalence decreased in the probiotic
group by 32% while increased in the control from 28% to 34%. Overall the probiotic
intervention reduced the risk of high yeast counts by 75% (p = 0.004) with the risk
reduction of hyposalivation by 56%( p = 0.05). Consequently, researchers supported
the idea that probiotic bacteria can be effective in controlling oral Candida and
hyposalivation in the elderly 138.
Gardiner evaluated cheese as a food carrier for the delivery of viable probiotic
Enterococcus faecium in the gastrointestinal (GI) tract and observed the high
survival of this probiotic strain in cheese during ripening at 8°C for 15 months (4 ×
108 cfu/g) while in yogurt during storage at 4°C for 21 d (4 × 10⁷ cfu/g). Their in vitro
model system supported the cheese as a carrier of culture having more protective
effect than yogurt to porcine gastric juice at pH 2. They used a feeding trial involving
8 pigs per group and fed for 21 days at a mean daily intake of 1.3 × 10¹⁰ cfu/d from
cheese or 3.7 × 10⁹ cfu/d from yogurt. They observed, during the feeding period,
cheese yielded a significantly higher mean faecal probiotic count (2 × 10⁶ cfu/g of

27
feces) than did yogurt (5.2 × 10⁵ cfu/g of feces). These data indicate that mature
cheese compares very favorably with fresh yogurt as a delivery system for viable
probiotic microorganisms to the gastrointestinal tract 139.
Latha Sabikhi et al. studied the probiotic Edam cheese with 107 viable cells of
Bifidobacterium bifidum for 3 months ripening period. Lactose contents in cheeses
depleted within 15 days. Moisture decreased to 42.46 % while pH increased from
5.20 to 5.45. The free fatty acids increased from 2.31 % to 2.83 % after 3 months.
The of total volatile fatty acids on 0-day and 3-month showed values ~2.30 and
~2.95 ml NaOH (0.1 N), respectively for 10g cheese. The soluble protein increased
from 15.00 and 14.96 % after 3 months of storage while more α-casein degraded
than β-casein in 3 months of storage. Their study verified that Edam cheese can be
a suitable vehicle for delivering probiotics especially bifidobacteria 140.
2.1.4 Combined effects of Probiotics and Prebiotics in value added functional
foods
Mainly there are two approaches; one is the use of live microorganisms, known as
probiotics, in the products and the other one is use of food components, known as
prebiotics. The combination of these two approaches can induce good health
benefits in consumers by the microflora already present in the gut of human or
animal106. The combination of Probiotics and prebiotics have a major influence on
gastrointestinal microflora. The great relationship has been found between the type
of microflora composition and health benefits particularly in children. Despite vast
research, there is no one clear indication of the use of prebiotics and probiotics in
pediatric disorders such as acute gastroenteritis, inflammatory bowel disease,
antibiotic associated diarrhea (AAD), traveler's diarrhea, irritable bowel syndrome,
Helicobacter pylori, constipation, necrotizing enterocolitis, allergy and atopic
dermatitis, colic and extra-intestinal infections. The leading evidence has been
provided in the case of acute gastroenteritis and in prevention of antibiotic
associated diarrhea. However, it has been observed that there are mild occurrences
of AAD in children and average duration reduces within 24 hours. But there are weak
evidences for the clinical benefits in all other cases such as constipation,
inflammatory bowel disease, irritable bowel syndrome, and allergy. The research has

28
revealed that the use of selected probiotic cultures during late pregnancy and early
infancy can help in the reduced atopic dermatitis. There are very few evidences
regarding adverse effects. Thus, the combination or the individual use of prebiotics
and probiotics can prove to be helpful in the prevention and medication of some
disorders in children especially, although there is little research on the clinical
benefits. The best example of clinical benefits is the employment of lactobacilli
strains and Saccharomyces boulardii in the medication of acute diarrhea 141.
Selection of suitable delivery system is a vital factor in developing functional probiotic
foods. The food ingredients containing prebiotics encourage the growth and survival
of probiotics. However an appropriate combination of prebiotics and probiotics
enforce the higher synergistic potential. Originally, only the dairy products were
considered as a carrier of probiotics but nowadays, utraceutical sources, such as in
capsules are also used as vehicle for probiotics 110 .
In different countries, the research and investigation on buffalo milk is increasing due
to its attractive compositional and nutritional values. Research has been conducted
to identify the new components in milk which have health beneficial effects on
human including the biological activity. Marian et al has highlighted the useful
contributions of buffalo milk for the human functional diet and has compared the fatty
acids, protein contents, retinol and tocopherol concentration percent from raw buffalo
and cow milk. They revealed that buffalo milk has a higher percent of protein (44
μg/100 g) than cow as well as has large contents of short chained fatty acids ( C10
– C14), especially oleic acid with high percentage of tocoferoli and sphingomieline
142.
2.1.5 Technical aspects of Probiotic based value added foods in respect of
survival in Human Gastrointestinal Tract
The administration of probiotics in value added functional products has rapidly
expanded, especially in recent years. Keeping in view such a high rate a global
market worth $32.6 billion is predicted by 2014. However, all the health upgrading
claims are assigned to probiotic bacteria which mainly depend on the viability as well
as to the count in the gastrointestinal tract. It has been estimated that the oral
administration of these bacteria results in a great viability loss with their passage

29
through the digestive system, where the acid and bile salt concentrations are high.
This loss of probiotic viability significantly lowers the effectiveness of the supplement.
The preparation of microcapsules is an emerging technique in formulating these
probiotic products to minimize the cell death during gastrointestinal passage with
opportunity of controlled release of these probiotic cells across the tract. Generally,
the principle of this technology is to immobilize the bacterial cells into a polymer
matrix. This immobilization maintains its specifications in the stomach, before the
intestinal degradation and dissolution, unlike the diffusion based delivery 143.
Microencapsulation is a technology using protective membranes particles of fine
solids, liquid droplets or gasses for packaging in small capsules controlled release of
their contents for long periods under the specific conditions 144. The material for
encapsulation of core is referred as coating or shell 145. Ortakci et al. investigated the
effect of this microencapsulation on the viability and growth of Lactobacillus
acidophilus ATCC 4356. This strain was induced in yogurt and tested in stimulating
gastric digestion. Strain added to yogurt in free form as well as cells encapsulated
with calcium alginate. They also highlighted the sensorial features of yogurt because
of this induction. The artificial stimulated gastric solution of 0.08N HCl of pH 1.5 with
0.2% NaCl and artificial bile juice containing 1.2% bile salts was used and stability
was determined using de Man, Rogosa, and Sharpe (MRS) broth. They observed
that the two hours incubation in artificial gastric juice killed the free ATCC 4356 strain
(count was more than 7 log cfu/g) while greater survival with reduction rate of only 3
log cfu/g in encapsulated bacteria was noted. No significant affect on the survival of
both the free or encapsulated strain was observed after incubation of 6 hours in bile
juice. Moreover, significant reductions (1 log cfu/g) of both control and encapsulated
bacterial cells were observed after refrigeration of yogurts for the period of 4 weeks.
They did not notice any significant change in appearance or flavor of the yogurts.
However, significant deficiency was found in texture of yogurts containing
encapsulated strain of ATCC 4356 146.
The probiotic strains such as Lactobacillus acidophilus, Bifidobacterium bifidum, and
Lactobacillus casei were encapsulated by Krasaekoopt et al. in calcium alginate
beads and the same beads were coated with three more materials; chitosan, sodium
alginate, and poly-l-lysine and combined with alginate. The overall thickness of the

30
beads increased but no difference was found in strength by texture or in the
thickness of the beads with other coating materials when analyzed in transmission
electron microscopy (TEM). The survival evaluation was determined for probiotic
cells in 0.6% bile salt and simulated gastric juice (pH 1.55) then incubated in
simulated intestinal juice and found that Chitosan-coated alginate beads provided
best protective coating to L. acidophilus and L. casei in all conditions while strain of
B. bifidum, even though encapsulated, did not survive in stimulated gastric
conditions 147.
Researchers have to face many challenges in the development of functional foods
through adding bioactive compounds. No doubt, the microencapsulation is a useful
tool in improving the controlled delivery of bioactive compounds such as probiotics,
prebiotics, minerals, vitamins, fatty acids, phytosterols, lutein, lycopene and
antioxidants incorporated in foods. Several microencapsulation technologies have
been investigated for functional foods and show promising response in successful
delivery of bioactive compounds in the gastrointestinal tract 148. Therefore, future
research is focused on controlled delivery and the potential use of co-encapsulation
methodologies with synergistic effects.
According to Kaila Kailasapathy many reports had indicated the poor survival of
probiotics in food products. Furthermore, the survival of these lactic acid bacteria is
questionable particularly in the human gastrointestinal tract. In order to provide a
physical barrier to these bacteria against adverse environmental conditions, the
technology of microencapsulation is adopted which is basically evolved from the
immobilized cell culture technology of biotechnology. Several methods have been
reported for microencapsulation of probiotics including spray drying, phase
separation, extrusion technique and emulsion. But, none of these have proven to be
satisfactory. Mostly, microencapsulation with calcium-alginate is used. Presently, no
equipment is available to generate uniform capsules, so there is an urgent need for
such an equipment. The food products are yoghurt, cheese, ice cream and
mayonnaise, which are commonly used as vehicles for delivery of encapsulated
probiotics. Therefore, further research should be conducted for the efficacy studies
of microencapsulated probiotics to deliver in controlled or targeted release in the
gastrointestinal tract 55.

31
Ding et al. studied eight strains of probiotics; Bifidobacterium longum, Lactobacillus
rhamnosus, L. salivarius, L. acidophilus, L. plantarum, L. paracasei, and B. lactis in
relation to their tolerance against acid, bile, and heat. Microencapsulation with
alginate matrix is used to enhance viability of the probiotics. The acid tolerance of
probiotics was analyzed with HCl in over 2-hours of incubation while bile tolerance
with oxgall and taurocholic acid was studied for 8-h incubation. Heat tolerance was
tested at 65 °C for 1 h. They concluded that overall microencapsulated probiotic
bacteria survived more than the free cells. The exposure of oxgall to free probiotic
bacteria reduced survival by 6.51-log CFUmL-1, whereas only 3.36-log CFUmL-1 was
lost in microencapsulated probiotic bacterial cells. In heat tolerance test,
microencapsulated probiotics survived with loss of only 4.17-log CFU/ml while 6.74-
log CFU/ml free cells were lost. However, after 1 hour of heating similar losses in
the count of probiotic cells were noted. Overall probiotic microencapsulation
improved the survival when exposed to acid, bile, and mild heat 149.
The gelling, stabilizing, thickening, and suspending or dispersing agents, such as
xanthum gum was used to improve the texture of frozen food products. Another
polysaccharide, chitosan, which is a natural biopolymer derived from chitin, has
recently replaced previously used polysaccharides. Various researches have been
conducted on non-starch polysaccharides and their effects on rheological and
sensory characteristics as well as their resistance to harsh and unfavourable
environment 150.
Anal el al. highlighted the mingling of probiotics in dairy products such as yoghurts,
all types of cheeses, ice cream, milk powders and frozen desserts. However, even
now researchers have to face several problems related to low viability of probiotics in
dairy foods. They focused the techniques used in the microencapsulation
of probiotics during fermentation, processing and utilization in food products.
Microencapsulated probiotics can be used to increase the viability during food
processing as well as the targeted controlled delivery during gastrointestinal passage
56.
The survival of probiotics in human gastrointestinal tract is of paramount importance
for their beneficial effects. The bacterial cells must remain alive until they reach the

32
site of action. The sensory characteristics of the food should not be affected by these
bacteria in any perceptible way. They must be stable throughout processing and
storage of the product beside their resistance in the gastrointestinal conditions. The
dosage level and viability determines the efficiency of probiotic bacteria added in the
product which must be maintained throughout the processing, storage, shelf-life and
in the consumer gut 151. Therefore, the survivability of probiotics is critically
important in probiotic-based functional products. Researchers have reported
Lactobacillus acidophilus and its behavoiur after microencapsulation on the
processing and simulated gastrointestinal conditions. The microencapsulated
bacteria survived better at high temperatures (72, 85, and 90 °C) and at high salt
concentrations (1%, 1.5%, and 2%). The free cells were destroyed at 90 °C whereas
the microencapsulated probioics were reduced by 4.14 logs. The log cycle reduction
was 5.67 in free while 2.30 in encapsulated bacteria, when incubated for 3 h with 2%
(w/v) NaCl. They observed that homogenization did not affect the viability of the cells
but disturbed encapsulating material used around the cells. As far as the release of
the microencapsulated bacteria is concerned, it required 2.5 hours. Their studies
suggested the microencapsulation of probiotics in sodium alginate is an effective
technique of protection against extreme processing conditions and under simulated
gastrointestinal passage 105.
Investigators have adopted various approaches to improve the resistance of
probiotics against adverse conditions like use of micronutrients such as peptides and
amino acids, and microencapsulation. Providing probiotic living cells with a physical
barrier against adverse conditions is an approach currently being hotly pursued152.
The technology designed to improve delivery of probiotic bacteria into the human
gastrointestinal tract by providing protection to the sensitive bacterial
microorganisms may be referred to as microencapsulation. It is currently receiving a
considerable interest for improving the viability of probiotic bacteria in dairy based
probiotic foods. Microencapsulation is considered a useful technique for improving
the delivery of bioactive agents in foods especially the probiotics 148.
Microencapsulation is used to protect the bacterial cells from an adverse
environment with a controlled release. Microencapsulation is providing a shield or
covering to the cells which are released at a controlled and required rate. In other
words, it is a technique by which live cells are packaged in a shell like material,

33
which give protection from direct exposure to harsh and unfavourable environment,
but it allows the movement of nutrients, thus supporting the survival of the encased
cells 153. This tool not only enhances the survival but also the sensory profile of the
product especially in the fermented dairy foods like yoghurt. Electron microscopy is
an effective tool to observe the survival and growth of probiotics in encapsulated
covering 154. These capsules can develop a lowering mouth-feel if capsule has
diameter >100 μm, it eliminates the sense of coarseness while taking milk, yogurt or
other dairy products155. A large number of biopolymers are available for
encapsulating the probiotic cells such as chitosan, alginate, gelatin, cellulose acetate
and carrageenan 154.
Microencapsulation of materials is resorted to ensure that the encapsulated material
reaches the area of action without being adversely affected by the environment
through which it passes 156. Among the principal reasons for encapsulation are;
increased probiotics viability while through passing acidic-enzymatic-bile conditions
of GIT, production of bacterial starter cultures with higher viability, improved viability
of probiotic microorganisms due to its protective effects against detrimental
environmental factors such as poisoning compounds, high value of acidity, low pH,
oxygen, enzymes, hydrogen peroxide, short chain fatty acids and bacteriophages
during processing155.
2.2 Nutritional value of Colostrum for Immunoglobulin G
Immunoglobulins G (IgGs) are the antibody isotypes which are found in blood. The
main function of IgG is to prevent the binding of pathogenic bacteria and ultimately
control the infection in the body. IgGs bind with the pathogenic microbes and
immobilize them by the process of agglutination and the coating is called
Opsonization. IgG also has the ability to neutralize the toxin by biding with it157.
Colostrum, especially the bovine colostrum has high percentage of IgG as compared
to others158.
In fact, the milk secreted by glands of mammals in the weeks before giving birth is
known as colostrum which is taken by newborns until the production of actual milk
starts. Colostrum contains high amount of antibodies, enzymes, proteins and

34
hormones like insulin and cortisol, which are transfered into the newborns until they
start to produce their own159. Colostrum and early postpartum milk contain high
quantity of IgGs. Studies have provided evidence that colostrum contains high level
of antibodies which have great clinical importance especially in combating infections
160. Such researches have encouraged the manufacturers to develop the
Immunoglobulin based dairy products. However, the manufacturer must be aware of
safety requirements as well as ethical considerations while utilizing the bovine
products before and after marketing161.
The supplementation of colostrum in the products can boost the immunity of
consumers and can develop the lean body muscles. It speeds up the recovery rate
from illness as well as increases stamina. Some researchers believe that colostrum
contains anti-aging factors. Colostrum has high protein contents and also is rich in
immunoglobulins which provide protection against infections. The notable
components of Colostrum are immunoglobulins, lactoferrin, vitamins, enzymes and
sulphur 162. Research has revealed that hyperimmune nature of colostrum may be
helpful in the treatment of diarrhea 163.
Sport supplements are supported by colostrum as it has growth factors. But there
are inconsistent findings164. In early days, people used milk to treat ulcers but found
it ineffective in many cases. Research revealed that colostrum (although not milk)
can protect the stomach lining from damage159,165 ,and regenerates the stomach129,
treating bowel syndrome166. A study also claims that colostrum can be helpful in
upper respiratory infections167. But a double-blind, placebo-controlled study proved
that colostrum failed to treat sore throat 168. Studies have shown that preparation of
Immunoglobulin concentrated from colostrum containing high antibacterial antibody
titers offer clinical benefit in combating some bacterial infections 168. These studies
should encourage the development of marketable Immunoglobulin -containing dairy
foods.
The development of homologous (human-derived) antibodies into an effective
treatment for enteric pathogens has subsequently received considerably less
commercial attention than the utilization of antibodies from the milk of heterogonous
species, particularly ruminants. Since last three decades, there is increase in

35
research regarding milk preparation containing the immunity, especially based on
bovine antibodies which are generally extracted from the milk or colostrum of cows.
These preparations can be used in the treatment of enteropathogenic diseases in
human and animals 166,167,169.
2.3 Cheese Whey: Nutritional Importance and processing
Whey is a by-product of the cheese manufacturing in the dairy industries. For a long
time, it was thought to be an insignificant product. Even today, some companies use
it as an animal feed while the majority disposes it as a waste. But the disposal of
whey is problematic for several reasons as it has a high BOD (biological oxygen
demand) of about 50–85mg O2/litre. It has been estimated that annual global
production of whey is 4500000 tons. That is why, researchers are engaged in
developing novel methods to utilize whey 170.
Whey is becoming imperative to the human nutritional diet which is a leading cause
of whey processing. This is not only helpful in solving the dumping problem, reducing
the environmental pollution and also assisting in the production of value-added
products in the fields of food, pharmaceutical and other biomedical applications 171.
Over the last few decades, a large number of studies have been carried out on the
nutritional value and important properties of whey ingredients. Today, scientists
believe that the main content of whey is composed of proteins which have
antioxidant, antimicrobial and antiviral properties and can be used as a protective
and preventive measure against cancer, heart diseases, and gastrointestinal
infections. Moreover, whey proteins help in the boosting of host's immune system.
The rich nutritional value of whey makes it an interesting product which can be used
as an alternate of traditional food products 172.
2.3.1 Nutritional Composition and major types of cheese whey

36
Whey represents 80 to 90% of the transformed milk which is greenish-yellow
coloured liquid which is generally drained off during cheese processing 170. Whey
gives sours off-flavors with rapidly oxidizing capacity 173. It has been estimated that
half of milk solids are found in the whey such as fats, proteins, lactose and minerals
174. There are various types of whey depending upon the type of cheese produced.
Sweet and acid whey are the most common. Sweet whey, which has pH greater
than 5.8, is the by-product of cheese manufactured by enzyme such as and Edam
cheeses; this whey is called the 'cheese whey'. While cheese produced by caseinate
(rennet) is known as 'rennet casein whey' . Acid whey, pH less than 5.0, is obtained
during manufacturing of fresh acid cheeses such as Quarg and cottage cheeses
while acid casein whey is obtained after the manufacturing of acid casein during
acidification of skim milk. Some types of fresh acid cheeses also give by-products in
the form of medium acid whey having pH 5.0 to 5.8 such as Blanco, Danbo, and
blanco 175. The typical composition of cheese whey is presented in the following
Table 1.
Table 1: Composition of typical cheese whey176
Components Percentage (%)
Dry content 6.0%
Lactose 4.5%
Protein 0.7%
Fat 0.1%
Ash 0.5%
Calcium 350 mg/l
Magnesium 90 mg/l
Sodium 450 mg/l
Potassium 1400 mg/l
Phosphor 450 mg/l
Chloride 1000 mg/l
Lactic acid 900 mg/l
Citric acid 1400 mg/l
Both types of whey, sweet and acid, are prepared by drying of freshly obtained whey
during cheese manufacturing 177. Acid whey is formed when milk is acidified to

37
obtain casein coagulates at pH 4.6. It has higher mineral contents than sweet whey,
especially calcium phosphate, but have the same protein percentage ranging from
11 to 14.5%. The acid cheese has 0.5-1.0 % less fats than sweet cheese while
lactose contents are greater in sweet cheese (63 to 75%).This acid whey is mainly
used in salad dressings, frozen foods and in snacks 178. Sweet whey is off-white to
creamy coloured product obtained from manufacturing of rennet cheese 179 which is
the most common type of cheese used in food sector with pH of 5.8 to 6.3 and 0.1
titratable acidity 180.
Other types of whey, such as demineralized and reduced lactose or lactose free
whey, are also produced. Various techniques of ion exchange are used to remove
the minerals of whey from pasteurized whey in order to make it demnineralized
whey, but the ash content must not be less than 7% 178. The mineral concentrated
whey is also known as reduced-lactose or lactose free whey in which some portion
or all contents of lactose is removed using physical separation techniques of
filteration, precipitation, or dialysis 181 with minimum dry weight of 60% 178.
Tariq et al. has highlighted the leading attributes of whey protein such as high
nutritional quality, great biological potential and distinctive functional features, for the
sustainable use not only in the food industry but also in the biomedical and
pharmaceutical fields 171. The composition of whey proteins depends on the milk
source, production method, type of cheese produced, and production specifications
23. Current advancements in dairy technology have enabled researchers to divide
and purify different types of whey proteins, as whey proteins have higher biological
value than any other food source 182. It is a globular protein used as gelling,
emulsifying and forming agent in various food products. Naturally, whey is composed
of whey protein 0.7%, casein protein 0%,ash 0.7%, fat 0.05 %, lactose 4.9%, and
6.35% total solids 170. The whey proteins concentrate (WPC) is produced by spray-
drying. The main component of spray dried WPC is the ß – lactoglobulin 183, other
than the predominant protein, α-lactalbumin 184, and traces of lysozymes, lactoferrin,
glycomacropeptides, immunoglobulins, bovine serum albumin, and lactoperoxidase
170,185. Around 20-25% of whey protein is α-lactalbumin which forms a compact
globular protein with a structure having 123 amino acids and four disulfide bridges
186. Tryptophan is prominent amino acid in α-lactalbumin. This essential amino acid

38
is found naturally in human breast milk and has the ability to bind calcium and make
it essential to be delivered to fetus and infants 184.
Another protein, ß-Lactoglobulin makes up more than 50 to 55% of the whey
proteins. It has capability to bind fat-soluble vitamins and increases their availability
in the body. This protein is mainly considered as obligatory against liver conditions
called as Cirrhosis and in muscle breakdown. In infant supplements, hydrolyzed ß-
lactoglobulin is frequently used to lower its probable allergic reactions 187. Whey
proteins have 15 to 20% Glycomacropeptide (GMP) 188 of sweet whey only, which is
produced by the reaction of chymosin rennet with κ-casein glycomacropeptide during
the renneted cheeses manufacturing 182. It is totally absent in acid whey as there is
isoelectric precipitation of casein rather than rennet hydrolysis 189. It is bilogically
active protein which regulates digestive system by masking the feeling of thirst. The
excretion of glycomacropeptide is controlled by a pancreatic hormone,
cholecystokinin 173. In dentistry, glycomacropeptide plays an affirmative role as it
prevents the formation of dental cavities and plaque 171.
Immunoglobulins (Ig) ranges from 10 to 15% of the total whey protein. Naturally, it is
present in colostrum 23 which is a yellowish fluid, secreted during parturition by the
mammary glands, and ultimately is converted into true milk. Basically there are three
bovine Immunoglobulins; Immunoglobulins A, Immunoglobulins G, and
Immunoglobulins M. Igs are heat sensitive may be due to their interaction with thiol
group 186. Approximately 5-10% of the whey protein is composed of Bovine serum
albumin (BSA), which has precious fat binding characteristics 171 with a structure
having 17 intramolecular disulfide bonds, one free sulfhydryl group, and 582 amino
acids, have an ability of reversibly denaturing by adding acid or heating at 40-50°C
186. Whey Protein has 1 to 2 % Lactoferrin. It has no pI’s (isoelectric point) unlike all
other whey proteins hence it can be extracted easily from whey liquid by cation-
exchange methods. Lactoferrin can be used as a protective agent against free
radicals, moreover, it is used for the promotion of cell growth, antioxidant actions and
stimulates the bifidobacterial growth in the body 171.

39
2.3.2 Health Benefits of eco-friendly processing of whey
Today, whey proteins are becoming a major component of the diet and are
considered an important part of human nutrition. Whey and whey based products are
proved to be an excellent sources of various essential vitamins like riboflavin,
thiamin, pantothenic acid, vitamin B6 and B12 190. The optimal performance and
functional reality of whey proteins based products ranges from mineral, fat and
proteins to ensure enrichment in nutritional diet which acts as nutritional repayment
in the products. Potassium, sodium, magnesium, chloride ions, phosphate and
citrate, help in functional improvements of whey proteins 171. The high protein level of
WPC make it a good source of sulfur-containing amino acids which have great role
in the regulation of antioxidants in the body 182. The ß-lactoglobulin of whey is an
excellent reservoir of essential and branched chain amino acids to cope with liver
abnormalities. The patients of cirrhosis may be benefitted and feel a positive effect
after consuming whey products.
An infant formula containing whey proteins has proved to be involved in the
reduction of infant allergic problems 178. Essential amino acids more than 60% are
available in the form of whey proteins that is why they are known as wholesome
protein concentrate 182. The Protein Digestibility Corrected Amino Acid (PDCAAS),
sanctioned by the USDA, is a well known method to determine the protein quality,
based on the requirements of amino acids. It deals with the essential amino acid
profile, true digestibility and nitrogen composition. According to PDCAAS, the ideal
level for essential amino acids in the body is the value of 1.0 while the whey proteins
have score of 1.14 182 whereas the score for soy protein is 0.99, Whole egg and milk
casein 1.0, and wheat gluten 0.25 23.
Health professionals, especially nutritional therapy practitioners, also use whey as a
gastrointestinal supporter. Researchers verification about its mucosal protective
features has highlighted its use in GSH-stimulating products 191. In addition to its
role in GSH synthesis, the amino acid glutamate may play an important role as it is
converted to glutamine, and utilised as a fuel by intestinal mucosa 192 and it is

40
verified that cancer patients undergoing chemotherapy may also benefit, as anti-
cancer therapies influence nutrient intake and absorption.193
Previously, cheese whey was treated as a pollutant because it has high biological
oxygen demand and chemical oxygen demand. The whey drainage into water bodies
like lakes and rivers was mainly adopted by dairy industries in order to remove the
economic burden of whey treatment 194. But later on, The Environmental Protection
Act (EPA) implemented some limitations on whey and whey products disposal into
water bodies directly 195.
2.3.3 Drying Technique for the whey processing Commonly, spray drying is used for making whey powder concentrate of liquid
whey. After that, the composition of whey powder can be specified into the whey
components. Whey is used in human foods as it contains a high concentration of
protein and, meanwhile, there is little return from whey utilization as an animal feed
to the industries 170.
Researchers have studied a variety of aspects of whey, especially its main proteins
such as α-Lactalbumin, β-lactoglobulin and albumin. The structural, chemical,
physical, and biological characterization of these proteins were studied but still there
is room for further research, especially on the proteins that are in a small percentage
but have great biological value. The recent innovations in technology as well as the
increasing demand for these whey proteins give the researchers an optimistic aspect
for further study on whey compounds. The nutritional value of whey and expanding
knowledge for utilization of whey in useful and healthy products is diverted from
disposal in waterways or on land. Beside the economical advantage of whey
utilization there are the ecological aspects as well. But the application of whey is not
an easy task, it needs a series of purification and separation steps before being used
as a useful and healthy product 172,196. The overview of processing steps of whey in
cheese production before any further processing is given in following figure 1.

41
Figure 1: Overview of processing steps of whey in cheese production 197 Fang et al. investigated the effect of spray-drying on the resulting properties and
functionality of milk protein concentrate (MPC), using the special mono-dispersed
particles of MPC. The milk protein concentrate was generated at different inlet air
temperatures (77 °C, 107 °C, 155 °C and 178 °C). A focused beam reflectance and
polyacrylamide gel electrophoresis (PAGE) were used to determine the solubility and
protein denaturation rate. They found a direct relationship between temperatures
used in spray drying and the results of particle functionality. The spherical
morphology was obtained at lower inlet air temperature while deflated at higher inlet
temperature. The FBR measurements indicated deterioration of solubility with the
increase of temperature. The results of SDS-PAGE suggested that the insoluble
material were the particles of casein not the heat sensitive whey protein 198. These
researches can establish an understanding about a good relationship between
conditions of freeze-spray drying and whey protein concentrates (WPC).
Because of above compositional facts, the popularity of whey is increasing as a
nutritional ingredient in various products such as milk products, infants supplements,
diet foods, baked foods, meat products, powdered beverages, sauces, and others
178.
2.4 Life Cycle Assessment
The fundamentals of life cycle assessment (LCA) is the measure of environmental
burdens which are linked with the product or service; from raw materials to the waste
removal 199. Undoubtedly, LCA is used as a comprehensive methodology to evaluate
sustainability of production of products. This methodology can quantify all resources

42
consumed and emissions produced as well as the health and environmental impacts
throughout the processing 200.
According to Roy et al. Life cycle assessment (LCA) is a tool which can be used to
assess the environmental burden of a product, process, or activity from the start to
end. Today, LCA is the combination of man power from multiple disciplines who are
interested in evaluating their products or processes during their life cycle. Recent
advances in the study of LCA has made possible the life cycle assessment in
agricultural and food products. The literature has indicated that LCA can highlight the
hotspots in agricultural production and can identify more sustainable options. Due to
the recent advances in LCA methodologies on global and national level, the use of
LCA is rapidly increasing in agricultural as well as in industrial food sector. If LCA is
joined with other technical aspects, it can provide more reliable data about
sustainable environment and production which can be beneficial for policy makers,
producers/manufacturers as well as for the consumers. However, there is a need for
improvement in LCA methodology and standardization 201.
Harvey and Clarke also recommended LCA as a comprehensive analysis for the
potential environmental impacts assessment of any proposed project or complex
productions or development 202. Food production invariably imparts negative
environmental impacts and Life cycle assessment (LCA) is a comprehensive and
standardised procedure to evaluate the environmental impacts and costs of
manufactured products as the food production is directly related to biosphere. So it is
essential to properly standardize the boundaries and systems for LCA in food
production in relation to environment impacts. They discussed the various ways of
choosing the production system and boundaries as well as the functional units. They
recommended LCA as a valuable tool in evaluating environmental impact of food
products, but also highlighted the need of further developments in the techniques for
food-specific functions like nutrient content. It is the need of hour to compare
different products and description of system boundary as well as functional units; by
adopting this strategy various problems can be resolved 203.

43
Figure 2: Overview of LCA204
Schau and Fet highlighted the design of life cycle assessment (LCA) in the
generation of information on the decision's consequences. They presented
comprehensive presentation of on the consequential approach about the data
selection, system boundaries and allocations which were based on SETAC-Europe
working group for LCA. They summarized and refined the consequential
methodology and made general conclusions and recommended LCA as an ideal
assessment of activities inside and outside the life cycle which can bring any
change. Their model of consequential life cycle inventory (LCI) also suggested the
alternative use of constrained production factors, supply and market demands 205.
2.4.1 Life cycle assessment Methodology
Life-cycle assessment (LCA) methodology is used to conduct a comprehensive
study of the environmental issues and potential impacts of a product. A product is
evaluated thoroughly with the consideration that all its stages depend on one
another. Life Cycle Assessment analysis covers all environmental impacts related to
the raw material, its processing or manufacturing, transportation of processed
products and usage and its disposal.
The general categories of Life cycle assessment require complete knowledge about
the resources used during processing of product, and concerns about human
health, and ecology. Life Cycle Assessment is one of many tools for evaluating
environmental impacts. These tools are Environmental Impact Assessment (EIA),
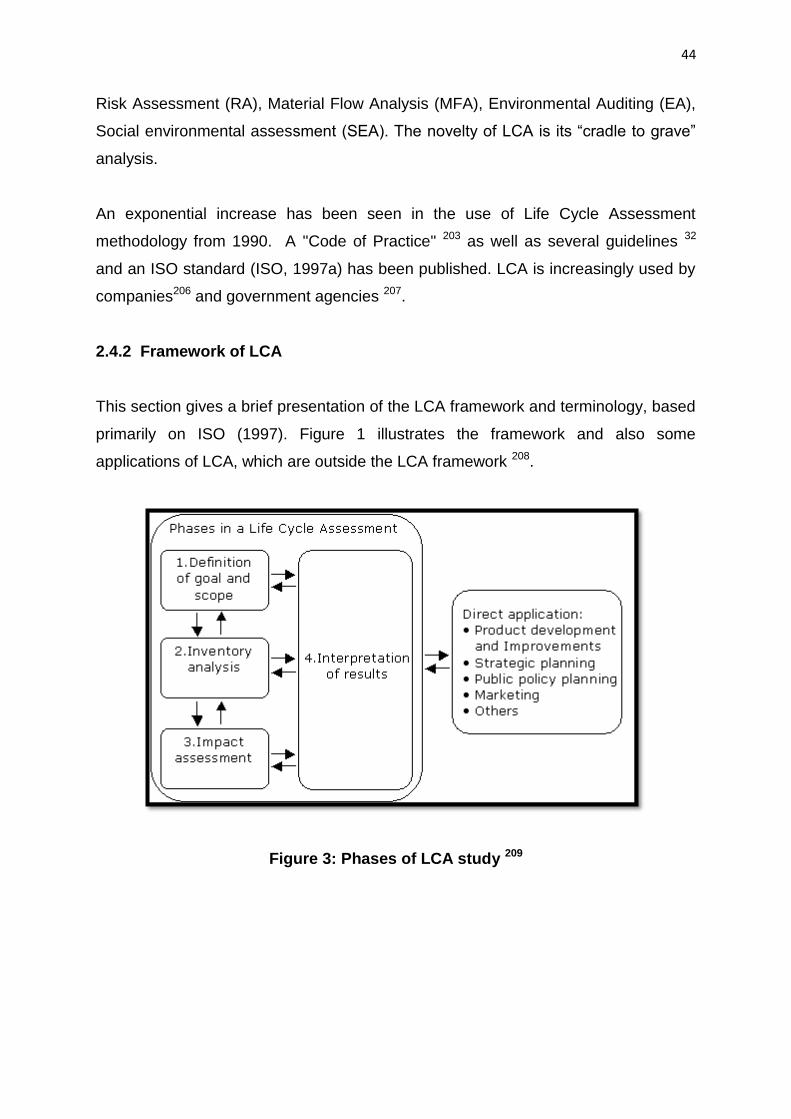
44
Risk Assessment (RA), Material Flow Analysis (MFA), Environmental Auditing (EA),
Social environmental assessment (SEA). The novelty of LCA is its “cradle to grave”
analysis.
An exponential increase has been seen in the use of Life Cycle Assessment
methodology from 1990. A "Code of Practice" 203 as well as several guidelines 32
and an ISO standard (ISO, 1997a) has been published. LCA is increasingly used by
companies206 and government agencies 207.
2.4.2 Framework of LCA
This section gives a brief presentation of the LCA framework and terminology, based
primarily on ISO (1997). Figure 1 illustrates the framework and also some
applications of LCA, which are outside the LCA framework 208.
Figure 3: Phases of LCA study 209

45
A life-cycle assessment includes four phases (ISO 14040, 2006):
1. Goal and scope definition
In this stage of LCA, the system and its boundaries, the functional unit, and
the procedure for the study are determined. It deals with the aims of study as well as
the future aspects of the results 204.
2. Life Cycle Inventory
Inputs and outputs are quantified and compiled for the life cycle of a specific
product under consideration. The emission and material (outputs) and resources etc.
(inputs of a stem are entered in a large table as inventory analysis results 208.
3. Life-cycle impact assessment
The LCIA evaluates and interprets the significance as well as the magnitude
of the environmental impacts of a product (ISO, 1997a). The LCIA may encompass
the following elements 210.
3.1. Classification (all relevant inputs an outputs are related to impact categories on
the basis of environmental impact types).
3.2. Characterization (on the basis of the contribution of every input and output-
towards assigned categories).
4. Interpretation (the findings of inventory analysis or/and the impact assessment).
2.4.3 Impact categories in Life cycle assessment
The following Impact categories were addressed during this LCA study 204.
1. Global Warming Potential
2. Acidification
3. Eutrophication
4. Ecotoxicity via water (acute)
5. Ecotoxicity via water (chronic)
6. Ecotoxicity via soil (chronic)
7. Human Toxicity via soil

46
8. Human Toxicity via water
9. Human Toxicity via air
Global Warming Potential
Global Warming Potential is a measure of heat trapped by green house gases
relative to CO2 in our atmosphere. It is not a single number but depends on one’s
time frame. The time frame would be of 20, 100 or 500 years. The common gases
included in GWP are CH4, N2O, CFC, HCFC and hydrofluorocarbon (HFC). Global
Warming Potential is calculated by considering the CO2 as equivalent
characterization factor (GWP =1). For hundred year life time span methane traps 23
times more heat that CO2 and N2O will trap 298 times more heat 27.
Acidification
It was generally agreed to by experts from many countries of the world that almost
95% of the acidifying emissions are due to NOx, SO3 and SO2. These emissions are
dispersed, changed to aerosols and deposited mainly as dry acid precipitates over
terrestrial and aquatic ecosystems. These substances, depending on their inherent
aerodynamic properties and prevalent weather conditions may travel for many
hundred to several thousand kilometres. The dry acid deposition decreases the pH
of water as well as soil 211.
Weathering of rocks containing acid susceptible minerals can reduce or neutralise
acidity, while at the sametime releasing cations which may lead to nutrient
imbalance. However when the pH drops below a critical level aluminium is mobilised
and harms both plants and animals specially fish 206.
Eutrophication
The influx of sewage and fertilizers into water bodies introduces phosphate and
nitrate nutrients which leads to phytoplankton blooms. The bloom induces hypoxia
which reduces or eliminates fish and other aquatic animal population 27.
Ecotoxicity
Ecotoxicity results from emissions into the environment of toxic chemicals. Because
of large number of toxicants involved, the life cycle impact assessement regards
ecotoxicity as a composite category and therefore includes all toxicants that have a

47
direct or indirect impact on ecosystem. Substances included in this category are
much more abundant than other environmental impacts considered. A substance is
regarded as ecotoxic if it has toxic impacts on some organism. Ecotoxicity also
depends on the dose, on its ability to bioaccumulate and target sensitive domains
212.
Human Toxicity
Human beings are vulnerable to atmospheric pollutants by three ways a) air, b)
water or food, and c) skin. It can be seen that human beings are exposed to the
contaminants by more than one way at a same time. This is called multi exposure.
The exposure of human beings to emissions in air is very strong and direct through
inhalation. Inhalation of atmospheric pollutants is most harmful. Ingestion through
water and food and resulting toxicity depends on dose and period of exposure 204,213.
2.4.4 Life Cycle Assessment in dairy Sector
Milk has great consumer demand as it is considered a healthy food item and Life
cycle assessment (LCA) is an excellent approach of environmental management.
LCA provides a wide knowledge on the environmental burdens linked with the
product as well as by the human activity. Hospido et al studied a simplified method
for LCA to analyse the production of milk in Spain. They obtained a high quality
inventory data in representative fodder factories, farms and dairies. The analysis of
two years by LCA permitted to evaluate the potential environmental impacts
connected to milk production and also determined different improvement approaches
to reduce the adverse effects such as the most suitable cattle feed formulation and
the treatment systems for water and air emission's implementation and proved that
these steps can lead to a reduction of 22% of the global impact 24.
Berlin also suggested LCA to investigate all the actions that can contribute
environmental impacts during cheese manufacturing throughout its life cycle starting
from raw material to waste disposal. The greatest environmental impact has been
identified during milk production at the farm which is followed by cheese making at
the dairy industry as well as in the plastic packaging. But these environmental impact
could be reduced by managing waste of milk and cheese throughout the processing
or life cycle, without any detrimental effects on the quality of the cheese 32.

48
González-García et al studied the cheese production, which is the second most
consumed dairy product in Spain. In Spain more than 100 different cheeses are
available in the market but only 26 types have symbol of Protected Designation of
Origin(PDO). They used an environmental Life Cycle Assessment (LCA) performed
to identify and quantify the environmental impacts derived from the San Simon da
Costa cheese manufacturing. They identified the most critical point of life cycle and
assessed that milk production at the dairy farm is the major environmental hot-spot
that contributed 63% to 89%. They suggested the cheese processing should also be
considered with the smoking, the heating system and wastewater management.
They highlighted that majority of dairy industries do not implement any system for
whey recovery. Therefore, whey is mixed with the effluent so the whey valorisation
into whey powder is an alternate for improvement. Using this alternative, reduction
can be achieved in adverse environmental impacts such as 15% reduction in
eutrophication but there is need to pay attention to problems of electricity and
heating requirements for whey processing 214.
Life Cycle Assessment (LCA) for milk production was studied by MH Eide. They
extended their study from the zero point of inputs taken from agriculture to the end
point of consumer and dealt with the waste as well as packaging. They researched
on three Norwegian dairies and found "hot spots" in the milk life cycle. The focused
the influence of transport, dairy size and degree of automation. Again like previous
results, they also found agriculture as a major hot spot but the environmental effects
by dairy products processing, products packaging, consumer level effects and waste
management of these products after consumption cannot be ignored. At the
consumer level, photooxidant formation and eutrophication aspects are of key
impacts. They concluded that small sized dairy has a greater impacts on
environment than the middle and large dairies while transport did not have any major
impact on environment 25.
Kim et al conducted a life cycle assessment to investigate a baseline for
environmental impacts of cheddar and mozzarella cheese. They included the waste,
transport and storage under the typical cheese manufacturing plants. They used
SimaPro© 7.3 and 17 cheese manufacturing plant's operational data was collected,
which represents 24 % of mozzarella and 38 % of cheddar manufacturing in the
49
USA. They found that cheddar's carbon footprint is 8.60 kg CO2e/kg of cheese using
the IPCC 2007 factors with a 95 % confidence interval of 5.86–12.2 kg CO2e/kg. For
mozzarella cheese, the carbon footprint was 7.28 kg CO2e/kg of mozzarella with a
95 % confidence interval of 5.13–9.89 kg CO2e/kg. The results indicated that nutrient
emissions from farm and as well as manufacturing facility represent the most
significant impacts and raw milk is the major source of contribution. They concluded
that in the farm, methane, phosphorus, manure management and nitrogen runoff, as
well as the pesticides can reduce impacts. They suggested that the water
conservation techniques and practices should be assessed and manufacturers
should use the water efficient system as well as whey-processing waste
management. These steps can make improvements in practicing good management
of phosphorous and nitrogen 215.
Various assessments have been conducted and have verified that the food sector
especially dairy is one of the major contributors to environmental pollution
30,31,33,216,217. It was reported by Nguyen et al. 218 that production of many food items
like beef, ham, poultry, milk and cheese contribute approximately 14% to global
warming Potential. In ENGLAND food sector is responsible for 22% green house gas
emissions 219. Many studies have been conducted to evaluate the environmental
burdens associated with milk and sub products for example González-García 217
calculated environmental issues related to dairy industry. Many researchers evaluate
the environmental burdens related with milk production by using cradle to grave
methodology 24,31,207,215,220. Berlin 32 conducted studies for semi hard cheese in while
González-García et al. 217 identified the environmental hotspots for cheese
production as many research has quantified the energy consumption during cheese
production 201,221.
The products that are evaluated and compared in the present life cycle assessment
case study are Cheese and Whey. The main purpose of this case study is to
calculate and to compare the total environmental effects of conventional production
of Cheese and alternative suggested method. The environmental impacts of whey
production will also be included. A secondary purpose of the study is to show how
LCA could help in the identification of which phases in the life cycle of a product
cause the main environmental impacts. This aim is being achieved by presenting

50
some of the results by life cycle subsystem or stage. One of the most momentous
steps of the LCA procedure is the definition of system boundaries. This definition,
which is necessary in order to calculate the total environmental consequences, must
be as clear as possible. After system boundaries are determined, the system should
be divided into subsystems. Each one of these subsystems requires input of
materials and energy and has outputs of products (co-products, by-products,
intermediate materials etc), atmospheric emissions, waterborne releases, solid
waste and other releases. Every broad-based LCA system begins with raw materials
acquisition and continues with manufacturing (materials manufacture, product
fabrication, packaging etc) use, reuse and maintenance through final disposition
26,222.
Simapro model was used to conduct this study. The Ecoinvent databases were used
for calculations. Danish LCA Food database 223 has been used for different phases.
The process of classification and characterization was included for LCIA. The
procedures of Normalization and weighting were not conducted due to lack of data.

51
Project Aims
The aims of the present study were;
To isolate the probiotic cultures of Lactobacillus and bifidobacteria from
indigenous sources and to study their potential, resistance and survival in
harsh conditions of the gastrointestinal tract.
To develop an encapsulated and potentially active Lactobacillus and
bifidobacterium cultures collection bank for innovative and value added
probiotic developments.
To produce environmental friendly value added Probiotic cheese and its
evaluation as a probiotic carrier.
Whey processing and its conversion into infant's anti-diarrheal supplement
with the addition of probiotics and Immunoglobulin G.
Life cycle assessment to quantify the environmental impacts of cheese and
whey processing.

52
Chapter 3 MATERIALS AND METHODS
3.1 Materials
3.1.1 Bacterial strains
Pathogens were obtained from the sources listed: Listeria monocytogenes ATCC
33090, Staphylococcus aureus ATCC 25923, Enterococcus faecalis ATCC10541,
Escherichia coli ATCC 13706, Salmonella typhi ATCC 6539, Pseudomonas
aeruginosa ATCC 20027, vibrio cholera (clinical isolate) Klebsiella pneumoniae
(clinical isolate) and Candida difficile (clinical isolate).
Isolated and identified probiotic cultures of Lactococcus lactis AH-1, Lactobacillus
delbrueckii subsp. Bulgaricus AH-2, Lactobacillus acidophilus AH-3, Lactobacillus
rhamnosus AH-4, Lactobacillus casei AH-5, Lactobacillus plantarum AH-6,
Lactobacillus paracasei AH-7, Lactobacillus brevis AH8 , Lactobacillus plantarum
AH9, Lactobacillus salivarium AH10 and bifidobacterium cultures: Bifidobacterium
bifidum AH001, Bifidobacterium longum AH002, Bifidobacterium adolescents AH003,
Bifidobacterium animalis AH004 and Bifidobacterium pseudocatenulatum AH005,
and commercial starter culture was obtained from Chr. Hansen, Horsholm, Denmark.
3.1.2 Instruments
The following instruments were used in these experiments for microbial growth and
evaluation: Incubator (Sanyo MIR 253, Osaka, Japan), autoclave ( Hirayama HG-
113, Nagasaki, Japan), centrifuge (Kokusan H-1500FR, Tokyo, Japan), stomacher
(Seaward stomacher 3500, Durham, ENGLAND ) pH meter ( Jenway 3510, Essex,
ENGLAND), anaerobic jar (Oxoid HP0011, Hampshire, ENGLAND), gel
electrophoresis apparatus (JUNYI JY-TD331 , Beijing, China ), spectrophotometer

53
(Labomed UVS-2800, Los Angeles, USA), densitometer (model SLR-ID/2D, Biomed
Instruments Inc., CA), PCR (Bio-Rad T100, California, USA), scanning electron
microscope (JEOL JSM-7800F, Peabody, USA), light microscope (Meiji MT5300H,
Japan), atomic absorption spectrophotometer (AAnalyst 400, Perkin Elmer,
Massachusetts, USA), ultra-lower temperature freezer (Sanyo MDF-U4086S, Osaka,
Japan), refrigerator, thermometer.
Equipment for milk testing, cheese and whey production: Milko Scanner (FOSS
S50, Hillerod, Denmark), cheese vat (DIMA CVS020, Modena, Italy), cream
separators (MecKey MKS-1, Tianjin, China), milk storage silo (MecKey MKSL-1,
Tianjin, China), freeze dryer (GEA Niro Atlas RAY 250, Søborg, Denmark), oven
(Panasonic MOV-212S, Leicestershire, ENGLAND), UV light, Integrated Filter Dryer
(GEA Niro IFD, Søborg, Denmark), and Homogenizer (CHANGGUAN GJB, Jiangsu
China), Flame photometer (Sherwood 410, ENGLAND), Texture Profile analyzer
(Stable Micro Systems, TA-XT2, England).
3.1.3 Media, Chemicals and Reagents
Reagents were analytical grade and obtained from different sources. Microbiological
media was obtained from Oxoid, Hampshire, England) and included the following
materials: MRS (deMan, Rogosa and Sharpe) broth medium, MRS agar medium, l-
cysteine, Slanetz and Bartley agar, M17 agar, violet red bile lactose agar nutrient
gelatin agar (Oxoid), blood agar, Mueller Hinton Agar slant, Dulbecco's modified
Eagle's minimal essential medium (DMEM), Lactose broth, Tetrathionate Broth (TTB
), Helton Enteric Agar (HEA), XLD Medium, Bismith sulfite Agar (BSA), Potato
dextrose Agar(PDA), Lauryl tryptose broth (LT Broth), Trypton broth, EC broth,
Brilliant green bile broth (BGBB), Baird Parker agar( BPA), Plate count agar (PCA) ,
Nutient gelatin agar and Coagulate Plasma kit.
For encapsulation and potential studies of isolates, carbohydrates including glucose,
lactose, xylose, sucrose, fructose, maltose, galactose, ribose, Sorbitol, trehalose,
arabinose, and mannitol, ammonium sulfate, Ca-alginate, corn oil, Tween-80, CaCl2,
prebiotics (FOS, MOS, GOS and Insulin, NaCl, pepsin, HCl, H3PO4, pancreatin, le
salts, phosphate urea magnesium (PUM) buffer's chemicals, n-hexadecane, sodium

54
citrate, methylene blue, Trypsin-EDTA solution were of Sigma-Aldrich, Seelze,
Germany. For resistance activity of probiotic isolated the antibiotics penicillin G (10
units), ampicillin (10μg), amoxicillin (10μg), erythromycin (15μg), tetracycline (30μg),
chloramphenicol (30μg), Doxycycline (25μg), cotrimoxazole (25μg) and
ciprofloxacine (5μg) were used that were manufactured by Sigma-Aldrich, Seelze,
Germany. For cheese acidification citric acid (Sigma-Aldrich, Seelze, Germany), and
rennet (Chr. Hansen, Horsholm, Denmark) were used.
For molecular analysis the products of Fisher Scientific, Pittsburgh PA, USA United
States were used including polyacrylamide, methanol/deionized water (78:22, vol/
vol) containing 2 mM tetrabutylammonium bromide, mercaptoethanol, bromophenol
blue, glycerol, sodium dodecylsulfatepolyacrylamide, Comassie Blue, pepton, IgG,
BSA, lactoferrin, α-lactalbumin, and β-lactoglobulin, (0.1% w/v pepton (Oxoid,
England), 0.85% w/v NaCl, Tris-Cl, RNase, bovine serum albumin, dNTP
(deoxynucleoside triphosphate), sucrose, agarose, Tris base, ethidium bromide, Taq
polymerase kit, while 100-bp molecular ruler, forward and reverse primers of
BioRad,Hercules, Canada were used.

55
3.2 Isolation, Identification, and characterization of Probiotics
3.2.1 Sample Sources for Strains Isolation and enrichment
Three sources, summarized in Table 2, were selected for the isolation of probiotic
strains of Lactobacillus and Bifobacterium; raw milk, commercial products, and
human faeces. Nine raw milk samples of cow, twelve of buffalo, four of goats, and
three of camels were collected from the Milk Collection Centre, Haleebfoods Pvt Ltd,
Lahore. All the raw milk samples were allowed to ferment naturally at room
temperature for seven days without adding any additives.
Ten commercially available probiotic products were collected from the local market
of Lahore, Pakistan which included two freeze-dried products, seven dairy products
and one fruit drink. Forty faecal samples were collected from different volunteers’
human groups which included male and female adult group, male and female
children under 5 year group, male and female children from 6 to 15 years old, Male
and female breast feeding infants (up to 1 year) and five pregnant women. The
samples were collected randomly from different locations of the Punjab, Pakistan for
each group. For each sample, 1 gram of freshly voided feces was collected,
homogenized in sterile saline solution (0.85% NaCl w/v) and stirred for 10 minutes.
The enrichment of all the collected samples was carried out by adding 10 mL of
sample in 90 mL MRS (deMan, Rogosa and Sharpe) broth medium. The enriched
samples were incubated anaerobically at 35 °C for 72 hours in static conditions. The
enrichment process was conducted in triplicate and repeated on a weekly basis for
four weeks.

56
Table 2: Sample Collection for Isolation of Probiotic strains
Source Type No. of samples Location
Raw milk
Cow Buffalo Goat Camel
09 12 04 03
Haleebfoods Milk Collection Centre, Bhai Pheru, Lahore
Local commercial products
Nestle Nido Nestle Yogurt Haleeb Yogurt Haleeb Flavored Yogurt Haleeb Cheese Haleeb Laban Xtra Energy Drink Freeze Dried Capsules Freeze Dried Culture Sachet Nestle Fruit Yogurt
10 Local departmental store, Lahore.
Human feces
Male and female adult group (16-32 years) Male and female children's group (under 5 years) Male and female breast feeding infants (up to 1 year) Male and female children's group (6-15 years old) Pregnant women's group
05
11
10
09
05
Collected randomly from different locations of the Punjab, Pakistan
3.2.2 Culture Dependent Isolation of Probiotics
For the isolation of Lactobacillus species the samples were activated in Man-
Rogosa-Sharpe (MRS) broth at 35°C for 48-72 h in order to obtain enriched cultures.
These cultures were streaked on MRS agar medium and incubated under anaerobic
condition using a candle extinction anaerobic jar with a moistened filter paper to
provide a CO2-enriched, water-vapor saturated atmosphere at 35°C for 72h. Single
colonies picked off the plates were sub cultured in MRS broth at 35°C for 48 h before
microscopic examination.
For the isolation of Bifidobacterium species all the collected enriched samples were
plated in triplicate on MRS medium supplemented with L-cysteine (0.5 g/liter) (MRS-
Cys) agar plates, and incubated anaerobically at 35°C for 72 h. The isolates from
each sample were randomly selected, grown in MRS-Cys broth, and Single colonies
picked off the plates were sub cultured in MRS broth at 35°C for 48 h before
microscopic examination.

57
3.2.3 Preliminary Identification of the Isolated colonies
The Genus level identification was carried out for the selected isolates using
morphological and biochemical methods, following the criteria of Sharpe et al. 224. To
determine their morphology the gram staining was performed 225. Additionally, they
were analysed for indole, mobility, oxidase, nitrate reductase, catalase, and milk
coagulation tests 224.
3.2.3.1 Sugar fermentation Profile
All selected colonies were tested for carbohydrates utilization such as Glu (Glucose);
Lac (Lactose), Suc (Scurose), Xyl (Xylose), Fru (Fructose); Mal (Maltose), Gal
(Galactose); Rib (Ribose); Tre (Trehalose); Sor ( Sorbitol), Ara (Arabinose); and Man
(Mannitol)l according to the method of Forouhandeh et al. 226.
3.2.3.2 Gelatinase activity
Gelatinase activity was investigated for the selected isolates using 6h old cultures.
The 2μl of culture was spot-inoculated into nutrient gelatin agar. The plates were
incubated for 48h at 35°C, anaerobically, later flooded with solution of ammonium
sulfate and observed the clear zones around colonies. A Staphylococcus aureus was
used as positive control 227.
3.2.3.3 Haemolysis activity
Only the gelatinase negative isolates were tested for the haemolysis activity
following the method of Gerhardt et al. 228. The 6 hours old culture (2μl) was spot-
inoculated into sterile blood agar plates. The 7% sheep-blood, preserved in
ethylenediaminetetraacetic acid (EDTA), was used in blood agar. Plates were
incubated at 35°C for 48h, anaerobically, and clear zones surrounding colonies
were observed which gives positive results for beta haemolysis. The Staphylococcus
aureus was used as positive control.

58
3.2.4 Culture Independent Identification of Isolates
SDS-PAGE separation technique and PCR-DGGE analysis was performed for the
molecular Identification of the selected isolates 229.
3.2.4.1 SDS-PAGE
One dimensional sodium dodecylsulfatepolyacrylamide gel electro-phoresis (SDS-
PAGE ) was carried out 230. Ten percent of resolving slab gels were used. Samples
were prepared for electrophoresis by mixing 10 μl of extracted cells, 2.5 μl of 2-
mercaptoethanol, and 7.5 μl of 0.002% bromophenol blue in 0.0625 M tris-HC1 (pH
6.8), containing 10% glycerol and 2% SDS. All protein stainings were performed with
Comassie Blue 231. To verify the reliability of procedure of the DNA extraction, the
DGGE analysis was performed and the cell suspensions of each strain were made,
by fresh growing on MRSA, and suspended in 10 ml of pepton solution.
3.2.4.2 DNA extraction
Extraction of probiotic bacterial DNA was followed as described by Pitcher 232 with
few modifications. For the commercial products except fruit drink and capsules, raw
milk and faecal samples, 1 ml of each sample was centrifuged at 13,000 rpm in
centrifuge for 10 min; while removing supernatant, the pellet resuspended in 1 ml of
Tris-EDTA buffer except the fruit drink. For fruit drink, 50 ml of sample was
centrifuged for 2 min at 1,000 rpm, after centrifugation, 1 ml of supernatant was
removed and again centrifuged for 10 min at 13,000 rpm. After removing the
supernatant, the pellet was dissolved in TE buffer (1 ml). In the case of the probiotic
capsules, 100 mg of each capsule was dissolved in 10 ml of sterile Pepton solution
with soft shaking for homogeneous suspension. One ml of this suspension was
again centrifuged at 13,000 rpm for 10 min, and again pellet was suspended in TE
buffer (1 ml) overnight, while removing supernatant. After pellet centrifugation, RNA-
digesting process was performed by RNase solution(35 μl). Next, the DNA solution
(8 μl) was added with loading dye (2µl) containing sucrose (4 g) and bromophenol
blue (2.5 mg) mixed in TE buffer (6 ml) and run on a 1% agarose gel in 1 μL TAE
buffer using 100 V for 30 min. The DNA extraction was quantified and verified by
spectrophotometer at 234, 260, and 280nm 229.

59
3.2.4.3 Polymerase chain reaction
Polymerase chain reaction (PCR) was performed with a Taq polymerase kit. The
primers used were those described by Muyzer et al.233, which amplify the V3 region
of 16S rDNA with forward primer F357-GC having a GC clamp (5'-
CGCCCGCCGCGCGCGGCGGGCGGGGCGGGGGCACGGGGG-3’) with 5’-GC
clamp-TACGGGAGGCAGCAG-3’ and sequence of Reverse primer was 5’-
ATTACCGCGGCTGCTGG-3’ 229. The PCR mixtures was made with 10 μl PCR
buffer containing 15 mM MgCl2, bovine serum albumin (2.5 μl), dNTP
(deoxynucleoside triphosphate) (2.5 μl ), each forward and reverse primer (2 μl), Taq
polymerase (0.25 μl of 5 U/μl ), and volume of 50ul was made by adding sterile
distilled water (33.75 μl) and DNA solution (1 μl). The PCR program used in this
study was with the initial denaturation for 5 min at 94°C; 30 cycles of denaturation at
94°C for 20 seconds, annealing was performed at 55°C for 45 second and extension
program was performed at 72°C for 1 min; while the final extension at 72°C for 7
min, and cooling was performed at 4°C. Later, the PCR product was verified by
adding 8 μl of product with loading dye (2 μl)and run on a 2% agarose gel at 100 V
for the time of 30 min.
3.2.4.4 DGGE analysis
Muyzer protocol was adopted with some modifications for analysis of PCR products
on DGGE gels 233: The polyacrylamide gels (160 × 160) consisted of 8%
polyacrylamide in 1 μl TAE buffer. In the present study, the 35 to 70% gradient was
used. The 24ml gradient gel was cast with a pump, at speed of 5 ml/min. The gels
were polymerized for 3-4 hours and 5-ml of stacking gel was poured on top with
comb.
After 1 hour, the samples of PCR were loaded into the wells and electrophored at 70
V at a constant temperature of 60°C for 16 hours. The gel was stained for 1 hour
with ethidium bromide (50μl of ethidium bromide dissolved in 500 ml of TAE buffer)
followed by visualization of DGGE bands under UV light.

60
3.3 Potential Studies of Selected Indigenous Probiotic Isolate
3.3.1 Antibiotics Resistance
The antibiotic susceptibility of selected isolates was determined using a modification
of the agar overlay diffusion methods 234 against eleven antibiotics, namely, penicillin
G (10 units), ampicillin (10μg), erythromycin (15μg), tetracycline (30μg), neomycin
(30μg), vancomycin (25μg), streptomycin (25μg), ceprofloxicin (25μg), kanamycin
(10μg), gentamycin (10μg), and ciprofloxacine (5μg). Diameters of inhibition zones
were measured and results were expressed in terms of resistance (R), intermediate
susceptibility (I), and susceptibility (S), according to cut off levels proposed by Vlkova
et al. 235.
3.3.2 In vitro antagonistic activity Antimicrobial activity of the selected probiotic isolates was checked using the agar-
spot test 236. Isolates were screened for production of antimicrobial against Listeria
monocytogenes ATCC 33090, Staphylococcus aureus ATCC 25923, Enterococcus
faecalis ATCC10541, Escherichia coli ATCC 13706, Salmonella typhi ATCC 6539,
Pseudomonas aeruginosa ATCC 20027, vibrio cholera (clinical isolate) Klebsiella
pneumoniae (clinical isolate) and Candida difficile (clinical isolate) as the indicator
microorganisms. An aliquot of 2μl of a 6h old probiotic isolate culture was spotted on
MRS agar and plates were incubated anaerobically at 35°C for 48h to allow
exhibition of antimicrobial compounds.
Cell suspensions of the indicator microorganisms were prepared as follows: each
24h old culture of the indicator strain on Mueller Hinton Agar slant was suspended in
sterile physiological saline solution (NaCl 0.9%) and the turbidity was compared to
0.5 Mc Farland (corresponding to 108cfu.ml-1). 50μl of the cell suspension was
inoculated in 5ml of Plate Count Soft Agar and overlaid on colonies of producer
isolates. After incubation at 35°C for 24h, plates were checked for zones of inhibition,
which were recorded as positive if the width of the clear zone was 2mm or larger.
The agar well diffusion technique was also used to discriminate antimicrobial activity
of the selected probiotic isolates237. The isolates are cultured overnight before

61
assay. Bacterial cultures were prepared into cell supernatant pH 7.0. 50μl sterilized
free-cell neutralized supernatant was filled in the well against target microorganisms.
After 24h of incubation time, the diameter of the inhibition zone was measured and
scored. The inhibition zone larger than 2mm was scored positive.
3.4 Microencapsulation: Survival and functional attributes of Indigenous
Probiotic isolates
3.4.1 Preparation of cell suspension for encapsulation
All the Isolated and identified Probiotic isolates were prepared from frozen stocks
stored at −80°C by sequential transfer twice into MRS broth, in which the cultures
were incubated anaerobically at 35°C for 18 h. After incubation, the media containing
cells were centrifuged at 4,250 × g for 10 min at 4°C, the supernatant was removed
and the cells were further washed twice (4,250 × g for 10 min at 4°C) with sterile
0.1% (w/v) pepton water.
3.4.2 Microencapsulation
For the single encapsulation, the bacterial cells were microencapsulated in Ca-
alginate by the emulsion method of Ortakci 146. Briefly, 200 mL of cell suspension
(~1010 cfu/ mL) was mixed with 800 g of a 25 g/kg Ca-alginate solution with
continuous stirring at 400 rpm for 10 min to entrap bacteria. The alginate-culture
mixture was then added dropwise through a 50-mL sterile syringe fitted with a needle
into 5 kg of corn oil containing 0.2% (wt/vol) Tween-80 and glycerol with stirring
(~500 rpm). When the oil-alginate mixture formed an emulsion, as was evident from
the increasing turbidity, a sterile 0.2 M CaCl2 solution was added immediately to
polymerize the alginate and break the emulsion. After 30 min, the Ca-alginate
microcapsules were collected by vacuum filtration through Whatman #4 filter paper
(Whatman International, Maidston, ENGLAND), washed twice in 0.2 M CaCl2, and
then stored in pepton-saline solution at 4°C until use. Later, the alginate -
encapsulated probiotic cells were coated with the mixture of prebiotics, containing

62
FOS, MOS, GOS and Insulin. The overall adopted technique for microencapsulation
is shown in Figure 4.
Figure 4: Flow chart of Adopted Microencapsulation Technique
3.4.3 Survival Evaluation In Simulated Gastric Juice (SGJ)
To investigate the influence of pH on the survival of encapsulated probiotic bacteria,
the isolated probiotic cells were treated for 120 min with sterile filtered stimulated
Gastric Juice -A (SGJ -A) as described by Mainville et al. 238 containing 2.0 g/kg of
NaCl and 0.3 g/kg of pepsin was prepared using 0.1 M HCl (~pH 1.4) and sterile
filtered stimulated Gastric Juice- B (SGJ -B) containing 0.9 M H3PO4 of pH 2.0

63
instead of HCl. The non-encapsulated (free) probiotic bacterial cells were used as
control.
3.4.4 Survival Evaluation In Simulated Intestinal Juice (SIJ)
After treatment for 60 min in 0.1 M HCl, the mixture was converted to simulated
intestinal juice 239,240 by adding to 36 mL of the mixture 1 mg/ mL pancreatin and 4.5
g/mL of bile salts suspended in phosphate buffer, and then adjusting to pH 7.4 with
0.1 M NaOH. The mixtures were then incubated for 4 h at 35°C with periodic
shaking. The non-encapsulated (free) probiotic bacterial cells were used as control.
3.5 In vitro Adherence studies of potential indigenous probiotic strains
3.5.1 Cell Surface Hydrophobicity
To determine the probiotics adhesion the method of Rosenberg et al.241 was used
with slight modification 242. All selected probiotic indigenous cultures were grown in
MRS broth at 35°C for 24 hours and centrifuged. The pellets were washed with
phosphate urea magnesium (PUM) buffer and resuspended in PUM buffer. The
absorbance was adjusted to ~0.7 optical density (OD) at 600 nm. Then the Probiotic
cell suspensions (3.0 ml) were added in n-hexadecane (1.0 ml) were mixed well
using vertex and incubated at 35°C for 15 min. Again vortexed and incubated at
35°C for 1 h then again absorbance of the aqueous phase was taken at 600 nm and
surface hydrophobicity (%) was calculated in triplicate as percent decrease
(ΔAbs×100) in the absorbance of suspension (A Initial) and after phase separations
(A final) as follows :

64
3.5.2 Cell Aggregation
The freshly grown probiotic bacterial cells in MRS broth at 35°C for 24 h were
harvested (1) and the cell pellet washed with PBS and resuspended in PBS. An
absorbance of ~0.5 at 600 nm (A initial) was taken. Then suspension was centrifuged
and the pellet was resuspended in equal volume of removed broth (in 1). The
mixture was kept at 35°C for 2 h after that 1.0 ml of the top suspension was taken to
measure the absorbance (A final), and broth was used as reference 243,244. The
estimation was performed in triplicate. To calculate cellular autoaggregation index,
the difference in percentage between the initial and final absorbance was recorded
as follows:
3.5.3 Caco-2 Cells Adhesion Assay
Adhesion of probiotic isolates was estimated using the method of Jacobsen et al.245.
Caco-2 cells (105) were seeded in each well of plate. The Dulbecco's modified
Eagle's minimal essential medium (DMEM) was supplemented with 10% (v/v) fetal
bovine serum (heat-inactivated at 56°C for 30 min), streptomycin (100 µg/ml) and
penicillin (100 U/ml) 242. On alternate day the medium was replaced with fresh
medium and estimation was performed after 20 days. The bacterial cells were
washed twice with phosphate-saline buffer pH 7.4 (3 ml), then 2 ml of DMEM,
without serum and antibiotics, was added in each well and incubated at 35°C for 30
min. A suspension of 109 cfu/ml bacterial culture was made in 1.0 ml DMEM
medium (without serum and antibiotics) and dropped in wells and plates were
incubated at 35°C for 2 h in 5% CO2. Later monolayer was washed with PBS and
trypsinization was performed for detaching cell using 1.0 ml of 0.25% Trypsin-EDTA
solution and added to each well. Then incubated at room temperature for 15
minutes. The serial dilution was made to the cell suspension and platted on MRS
agar for the determination of adherent. The plate was incubated for 24–48 h at 35°C
and colonies counted. Initially added bacterial cells were also counted. The results of
the adhesion estimation were measured in percentage, as the ratio between

65
adherent probiotic bacteria and added probiotic bacteria per well. The estimation
was performed in triplicate.
3.6 Isolation of heat resistant probiotic isolates and their Preservation
Probiotic selected isolates were cultivated in MRS broth at the optimum temperature
until they reached the stationary phase of growth (18 h; optical density at 620nm =
2.45). Cells were harvested by centrifugation at 9,000 × g for 10 min at 4°C, washed
twice with 50 mM, sterile potassium phosphate buffer (pH 7.0), and resuspended in
sterile distilled water at an optical density at 620 nm of 2.45 (corresponding to 9.4
log10 cfu/g). Suspensions were centrifuged (9,000 × g for 10 min at 4°C) and the
cells resuspended in reconstituted skim milk (Oxoid) to a final cell density of 9.4
log10 cfu/g. Samples (0.5 ml) were transferred to capillary glass tubes and heated in
a water bath at 55 or 65°C for 10 min. After heat treatment, all samples were chilled
for 5 min on ice, serial diluted, plated on MRS agar, finally incubated at 35°C for 48
to 96 h 246. Each experiment was performed in triplicate. The average and standard
deviation of experiments were calculated. All the isolated and identified bacterial
strains were preserved using the method of Feltham 247 with some modifications.
The 0.85 ml of bacterial culture was added in 0.15 ml of sterile glycerol to make final
15% v/v glycerol concentration, after mixing the cultures were transferred to labeled
screw capped storage tubes and kept in the Ultra low refrigerator at -80±1.0°C.

66
3.7 Manufacturing and value addition of cheese through Probiotics
3.7.1 Collection of milk for cheese processing The fresh buffalo milk samples were collected from milk collection centers of the
Haleebfoods (Pvt) Limited, 64km Multan Road, Lahore. The milk of Bhai Pheru,
Jhang, Arif wala, Bhowana, Pattoki, Chishtian, Haweli, Michanabad, and Ranala
khurd were selected for further processing after quality testing of milk samples. All
quality tests were performed at Milk Reception Laboratory of Haleebfoods (Pvt)
Limited.
Figure 5: Flow chart of milk reception
Milk Collection Centre Bhai
Pheru
Jhang
Arif wala
Bhowana
Chishtian
Pattoki
Hawelli
Mchanabad
Ranala Khurd
Quality testing of raw milk samples

67
3.7.2 Quality Testing of Raw buffalo milk samples To check the quality of raw milk, each sample was analyzed for microbiological and
physicochemical aspects:
3.7.2.1 Microbiological testing
Total viable aerobic bacterial count, Staphylococcus aureus, Salmonella spp., yeast
and mould count, total coliforms, faecal coliforms, and E.coli count of the milk
samples was determined as described by Food and agriculture organization 248.
Each of the samples was diluted five folds in sterile normal saline. One ml sample
from dilution tubes was transferred to respective media on suitable temperature,
details are given in Table 3.
Table 3: Media used for Microbiological analysis
Microorganisms tested Media used Incubation Temperature and Time
Total viable count Plate count agar 35°C,48h
Staphylococcus aureus count (coagulase +ve)
Braid parker agar Coagulate Plasma kit
35°C,48h 35°C,6h
Total Coliforms Lauryl tryptose broth BGB broth
35°C,48h 35°C,48h
Faecal Coliforms Lauryl tryptose broth, EC broth
35°C,48h 45°C,48h
E.coli Lauryl tryptose broth Trypton broth
35°C,48h 45°C,24h
Mold count Potato dextrose Agar 25°C,120h
Yeast count Potato dextrose Agar 25°C,120h
Salmonella spp. Lactose broth Tetrathionate Broth Hektoen enteric Agar XLD medium Bismith Sulphite Agar
35°C,24h 35°C,24h 35°C,24-48h 35°C,48h 35°C,48h
3.7.2.2 Physicochemical testing
The physicochemical analysis of all milk samples was performed according to AOAC
2005 249. The temperature was checked by thermometer, pH measurement was
made using a digital pH-meter, Titratable acidity was measured by titrimetric method,
lactose, protein and water contents were estimated by the Milko scanner, total fat

68
content of sample was measured by Gerber butyrometer, Salt as NaCl and whey
proteins using method as described in Pearson's Food Analysis & Dairy Hand book
250, Solids non fat (SNF) (1) and total solids (TS) (2) were calculated by the following
equations:
%SNF = (LR/4)+(0.22XFat)+0.72 (1)
%Total Solids = SNF Percentage + Fat Percentage (2)
To determine the hygiene status of collected milk, methylene blue reduction test was
performed following the method of Muhammad 251. One ml of methylene blue
solution (1:25000) was transferred to sterilize 20 ml screw caped test tube containing
10 ml of each of the samples. Each of the tube was incubated at 37°C and examined
after every 2 hours up to 8 hours. The time taken by the methylene blue in milk to
become colorless was recorded.
3.7.3 Milk Pre-treatment
Raw milk samples were HTST-pasteurized at 80oC for 16 sec then cooled to 37 to
39°C. During standardization, the fat content was adjusted to 0.10 % by separating
fat. The fat percentage was determined by Milko Scan.

69
Figure 6: Milko Scan
Figure 7: Pasteurization section

70
Figure 8: Centrifuge for Milk clarification Figure 9: Homogenizer
Later, the skim milk was homogenized and stored at 4°C in 10,000-L closed vats.
The overall process for milk pre-treatment is given in Figure 10.
Figure 10: Milk Pre-treatment
Standardization separation Pasteurization Homogenization Storage

71
3.7.4 Cheese processing and value addition Five types of cheeses were produced which were mainly divided into two categories
(shown in Figure 11); chemically acidified and biologically acidified cheeses. In
chemical acidified cheese, citric acid (CA cheese) was used, a conventional
method, while the biologically acidified cheeses were again divided into further four
categories; commercial starter culture cheese (SC cheese) obtained from Chr.
Hansen, Lactobacillus cheese (LB cheese), Bifidobacterium cheese (BF cheese) and
mixed probiotic cheese (MP cheese).

72
Figure 11: Scheme adopted for the types of cheeses manufacturing 3.7.4.1 Manufacturing of chemically acidified cheese The low fat milk was pre-acidified with 1.45 g/L (w/v) citric acid and adjusted the pH
of milk to the appropriate level of 5.35 then rennet was added and 60-min ripening
time was given to milk. To control the pH, salt was added in the pre-acidified milk. A
30-min period for rennet coagulation was used. The shorter coagulation time was
used (i.e., time from rennet addition to cut) because of the rapid firming of the
coagulum in the pre-acidified milk. The stirring was performed for 30 minutes and
whey was drained at pH 6.2. After manufacturing of cheese, it was cooled in an ice
bath and stored at 4°C, as described by Metzger 14.

73
3.7.4.2 Manufacturing of biologically acidified cheese 3.7.4.2.1 Bacterial strains and culture conditions For the manufacturing of commercial starter culture (SC) cheese, commercially
available cultures from Chr. Hansen (Denmark) in freeze-dried form were used and
these strains were activated by growing overnight at 30oC on 12% (w/v) sterile
reconstituted skim milk (RSM) containing 2% (w/v) glucose and 1.2% (w/v) yeast
extract. All probiotic strains Lactobacillus lactis, Lactobacillus paracasei,
Lactobacillus bulgaricus, Lactobacillus fermentum, Lactobacillus rhamnosus,
Lactobacillus acidophilus, Lactobacillus plantarum, Lactobacillus casei, and
Lactobacillus brevis, as well as all probiotic strains of bifidobacterium;
Bifidobacterium lactis, Bifidobacterium infantis, Bifidobacterium bifidum, and
Bifidobacterium longu, that were isolated in this study, were subcultured. All
Lactobacillus strains were subcultured in 12 % (w/v) sterile RSM incubated at 37oC
for 24 hours while the Bifidobacteria were subcultured in sterile RSM supplemented
with 0.05% L-cysteine hydrochloride.
3.7.4.2.2 Cheese Making Five types of cheeses were manufactured in three different batches in different time
periods to obtain more reliable results. Each time the cheese was made by
pasteurized low fat ( 0.10%) buffalo milk into five different cheese vats using
mozzarella manufacturing procedure as described by Barbano et al. 252. The
pasteurized milk was equally divided into five parts; first for chemically acidified
cheese (CAC), second for starter culture cheese (SCC), third of selected heat
resistant lactobacillus cheese (LC), fourth of selected heat resistant bifidobacterium
cheese(BC) and fifth for the mixed culture cheese (MCC); containing both the
lactobacillus and bifidobacterium cultures and each vat was labelled as Vat I, Vat II,
Vat III, Vat IV and Vat V respectively. Prior to manufacturing pre-acidification
treatment was performed. For the chemical acidification, 1.5 g/L (wt/vol) citric acid
was added in vat I, commercial STI starter culture (Chr. Hansen, Denmark) in vat II,
1.5% (wt/vol) selected probiotic lactobacillus strains in vat III, 1.5% (wt/vol) selected
probiotic bifidobacterium strains in vat IV, and 1.5% (wt/vol) mixed cultures of
Lactobacillus and bifidobacterium (1:1) were added in vat V. After pre-treatment of

74
milk, it was tempered to 31°C then inoculated with respective commercial starter
culture or probiotic bacterial cultures. The milk was left to ripen for 45 min before the
addition of single strength rennet (Chr. Hansen) at the rate of 0.2 mL per liter of milk.
The milk coagulated after about 45 min and the resulted curd was cut with a cheese
wire knife to 8mm cubes. The curds were cooked to 38°C by heating slowly at the
rate of 1°C rise per 5 min with agitation until the pH dropped to 6.1-6.2. The whey
was drained and curds were milled and salted (2% w/w) before putting into cheese
moulds and pressed by placing a weight of 2.46 kg per 100 cm2 overnight. The fresh
cheese was removed from the mould, sterilize packed and heat sealed with a
vacuum packaging and ripened at 4°C for 6 months. Each vat experiment was
performed in triplicate; first batch was started in march 2011, second batch was
conducted in June 2011, third in December 2011, each time the five types of cheese
were manufactured in five respective vats and each time all analytical testing was
performed (in triplicate). The means and standard deviations were recorded. Overall
scheme for cheese and whey processing is given in Figure 12.

75
Figure 12: Scheme adopted for cheese and whey processing
3.7.5 Cheese analysis 3.7.5.1 Physicochemical analysis Compositional analysis of all types of cheeses was performed for moisture, protein,
fat, ash, pH, acidity and salt (NaCl) after every 15 days interval during 180 days/ six
months of ripening period. All analysis was performed in duplicate and mean ±
standard deviation were recorded.
3.7.5.1.1 Moisture content
The moisture content of all five types of cheeses were determined by the oven
drying method at 102 ± 2 °C according to AOAC 253. First sufficient amount of sand

76
was placed in five separate dishes and placed in the oven at 102°C for one hour,
after removal from oven, dishes were placed in desiccator, cooled, weighed and
recorded as W1. After this step, 2g of each cheese sample (recorded as W2) was
mixed with sand and again placed on oven at 102 °C for more than 5 hours. Then
removed, cooled and recorded as W3. The percentage of moisture was calculated
by using the following expression;
Moisture % = W2 -W3 ÷ W2 - W3 × 100
3.7.5.1.2 Protein Percentage
Total protein content in each cheese sample was estimated by Kjeldahl method 254.
1g of each cheese sample was digested with concentrated sulfuric acid and
digestion tablets in Kjeldhal digestion flask until a clear solution was obtained in each
case. Then titrated against 0.5 N hydrochloric acid to determine the concentration of
Nitrogen. The total Protein content in each cheese sample was determined by
multiplying N% with a factor of 6.38. Nitrogen percentage (%) and total protein
(%)can be calculated by following equations;
and
Total Protein % = N (%) 6.38
3.7.5.1.3 Fat content
Gerber method 255 was used to determine the percentage of fat in each type of
cheese. 10 mL of sulphuric acid and 3mL distilled water was added into butyrometer
at 60°C. Then 3g of each cheese sample was inserted to butyrometer and added
again 5 mL of distilled water at 60°C and 1 mL of amyl alcohol. The butyrometer
was shaken well to dissolve cheese particles and centrifuged at 1300 rpm for 5
minutes. Then butyrometer was placed in water bath at 65°C for 3 minutes and
recorded the percentage of fat by measuring fat column.

77
3.7.5.1.4 Ash
Ash content of each type of cheese was determined by igniting the cheese samples
using method of AOAC 253 .5 g of each cheese sample was weighed and ignited in
a china dish on flame and then placed in muffle furnace at 550°C until the constant
weight of white ash was obtained.
3.7.5.1.5 Acidity Percentage
Acidity in each cheese was estimated by titration method of AOAC 253. In each case,
the shredded cheese sample of 1.0 g was mixed with 10 mL of warm water, mixed
well and filtered. The filtrate was titrated with 0.1N NaOH and phenolphthalein was
used as indicator. Acidity percentage (%) as Lactic acid is;
3.7.5.1.6 Salt content The salt contents in each cheese sample was determined by Volhard method of
AOAC 253. Two g of shredded cheese sample was added in 20 mL warm water to
make a slurry. This slurry was transferred to 250 mL Erlenmeyer flask and 25 mL of
0.1N silver nitrate, 10 mL of nitric acid and 50mL of water was added in it and placed
on a hot plate for boiling in a hood. After boiling, potassium permanganate was
added in 5 mL portions until the solution turned brown and remained brown for at
least 5 minutes and heating process was continued until the brown color
disappeared and resulted in a clear solution. There was white curd like particles in
the solution indicating the silver chloride aggregates. Then the hot solution was
filtered and washed with hot water. The solution was cooled and 2 ml ferric
ammonium sulfate was added as an indicator. The excess silver nitrate was titrated
with 0.1N potassium thiocyanate (KSCN) to the first pale reddish brown color that
lasted for 30 seconds. The volume of 0.1N potassium thiocyanate was used for

78
titration against the sample and blank was recorded and the salt (sodium chloride)
content was calculated by the following formula:
3.7.5.1.7 pH
The pH of each cheese sample was measured by direct insertion of an electrode of
pH meter in cheese slurry (20g of shredded cheese in 12 mL water), after calibrating
it with fresh pH 7.0 and 4.0 standard buffers.
3.7.5.1.8 Calcium content
The calcium content was determined using flame photometer as described by Kirk
and Sawyer 250. 1 g of each cheese sample was added in 10 ml of concentrated
nitric acid and heated till it discoloured. Then 5 mL perchloric acid was added and
heated till 1-2 mL solution remained, filterated the solution and deionized water was
used to make the volume of 100 mL. Standard solutions were prepared and run on
flame photometer followed by the test samples. The standard curves were obtained
by plotting absorbance values of standards against appropriate concentrations of
sample.
3.7.5.2 Rheological and Functional Characterization of Manufactured Cheeses
3.7.5.2.1 Melt time
All the cheeses were tested for melt time by the method of Guinee et al. 256 and the
fixed amount of cheese (1.73 kg /m2) was taken atfter every 30 days, then allowed
to melt down and fuse into a molten mass during 180 days of ripening period.

79
3.7.5.2.2 Flowability
The flowability of all five cheese types were determined according to the method
described by Guinee et al. 257 after every 30 days interval during 180 days of
ripening. For measuring the flowability the cheese disc of specified dimension was
cut and then placed for 4 minutes in oven at 280°C and expressed as percent
increase in the diameter of a cheese disc.
3.7.5.2.3 Firmness
All five types of cheeses were determined for firmness as described by the Guinee et
al.13. The cheese samples were cut at prescribed time period and stored at 8°C in
sealed plastic bags for twelve hours. Then these cubes were compressed on a
texture profile analyzer at the rate of 60 mm/min. The result was recorded as the
force used to compress the cheese sample to 30% of its original height and reported
as cheese firmness.
3.7.5.3 Microbiological analysis
All microbiological analysis was performed according to the standard procedures of
FAO 248. Twenty grams of each cheese sample, on an interval of 30 days during the
storgae of six months, was diluted in sodium citrate (2%, w/v) solution (180 mL) and
homogenized with a Stomacher. Serial dilutions of homogenated samples were
made in Ringer’s solution and plated on the MRS agar for lactic acid bacteria and
incubated at 22°C and 45°C for 48 h under anaerobic conditions, respectively.
The coagulase positive staphylococcus aureus were enumerated using Braid parker
agar and coagulase test. The Lauryl Tryptose(LT) broth was used for the preliminary
testing of total, faecal coliforms and E.coli and their presence was confirmed by the
Brilliant green bile broth, EC broth and indole test respectively using 15 tubes Most
probable number (MPN) method.

80
The detection of Salmonella species was performed after the pre-enrichment in
lactose broth and enrichment in Tetrathionate broth with iodine and further selective
media (HEA agar, BSA agar, and XLD agar) and were used for the confirmation.
Plate Count Agar (PCA) was used for Total Aerobic Count (TAC) and incubated at
30°C for 24-48 h, Pseudomonas Agar Base (PAB) with CFC selective supplement
was used for the count of Pseudomonas spp. and Potato Dextrose Agar (PDA) was
used for yeast and mould count and incubated at 25°C for 5 days.
3.7.5.4 Sensory Evaluation of manufactured cheeses
The sensory analysis of manufactured cheeses was carried out using the descriptive
model of Coppola et al. 12 with a few modifications 258. Before the sensory analysis, a
panel consisting of 30 judges was preliminarily briefed on the use of the sensory
attributes on a 5-point hedonic scale (1–5) and a developed scorecard 12. The
anchors were appearance (creamy, watery, off white, sparking white, shiny, dull),
flavour (cooked, sweet, salty, sour, bitter, rancid), body and texture (crumby,
firmness, moist, rubbery, grainy, mouthcaoting). Scores were classified as preferable
(5), and least or not acceptable (1) for each parameter. The cheeses were taken out
of the refrigerator 1 h before serving, cut into slices (approximately 2.5 × 2.5 cm),
and placed in plastic cups. The cheeses were randomized to avoid positional bias.
Triplicate trays of samples were presented in 10-min intervals to the panel.The
means and standard deviations were calculated.
3.7.5.5 Survival evaluation of Induced bacterial cultures 3.7.5.5.1 Bacterial enumeration
For the determination of survival of bacteria, the initial count of probiotic bacteria
were enumerated from all types of manufactured cheeses except the Vat I cheese as
it was acidified with citric acid instead of bacterial cultures. Each cheese sample (25
g) was mixed in 225 mL of 0.1% pepton water and centrifuged at 230 rpm for 10 min.
MRS agar was used for enumeration of LAB using pour-plate method and incubated
anaerobically at 35°C for 72 h.

81
3.7.5.5.2 Evaluation in Stimulated Gastric Juice (SGJ)
To investigate the survival of probiotic bacteria in the cheese in gastrointestinal tract
(GIT) of consumer, sterile filtered SGJ containing 2.0 g/kg of NaCl and 0.3 g/kg of
pepsin was prepared using HCl as described by Mainville 238. To provide pH of the
SGJ-cheese mixture similar to the physiological pH of the human stomach (~pH 1.4),
SGJ-A was made using 0.1 M HCl with a cheese:SGJ ratio of 1:6. For SGJ-B, the pH
was increased to 2.0, the rest of conditions remained the same as SGJ-A. Each type
of cheese was tested for both juices; SGJ-A and SGJ-B, after making this cheese-
SIJ mixture, it was incubated for 4 h at 35°C with periodic shaking.
3.7.5.5.3 Evaluation in Stimulated Intestinal Juice (SIJ)
To make simulated intestinal juice (SIJ) , 36 mL of panceatin-bile solution (1 mg/ mL
pancreatin and 4.5 g/mL of bile salts in phosphate buffer) was added in 0.1 M HCl
(SGJ-A). The pH was adjusted at 7.4 with 0.1 M NaOH. The cheese-SIJ mixture was
then incubated for 4 h at 35°C with periodic shaking.

82
3.8 Extraction of Immunoglobulin G from colostrum for supplement
3.8.1 Sampling for Colostrum
Bovine colostrum, obtained from a pool of different cows raised on a local dairy farm,
was centrifuged at 4000 ×g at 4°C to remove fat. Colostral whey was then prepared
by adding 1 N HCl to the skim milk to adjust the pH to 4.6 at 30°C, and centrifuged at
10,000× g for 15 min to remove casein precipitate.
3.8.2 Extraction of IgGs
The phase-transfer experiments were carried out in tightly stoppered 20-ml vials. For
the model system study, 5 ml of standard protein solution in Phosphate buffers of
various pH containing (1 mg each) IgG, BSA, lactoferrin, α-lactalbumin, and β-
lactoglobulin, were mixed with an equal volume of micellar solution of 50 mM AOT in
isooctane. For the real system, 5 ml of the aqueous solutions were prepared by
adding various amounts of colostral whey (5.0 ml) to 50 mM sodium phosphate
buffer at various pH (7.0) and containing NaCl. The aqueous solutions were mixed
with 5 ml of the isooctane solutions containing 50 mM of AOT. The mixtures were
shaken at 200 rpm for 10 min at room temperature, and the two phases were
separated by centrifugation at 500×g for 30 min. The recovery of whey protein in the
reversed micellar phase (organic phase) or in the aqueous phase after extraction
was calculated as the ratio of protein concentration in the reversed micellar phase or
in the aqueous phase after extraction to the initial protein concentration in the
aqueous phase before extraction. The purity of the immunoglobulin G in the aqueous
phase after extraction was the ratio of IgG concentration to the total protein
concentration in the aqueous phase.
3.8.3 Analytical studies
SDS-PAGE was performed according to the methods of Laemmlli 230 after
modification. The 4.5% polyacrylamide was dissolved in 0.125 M Tris- HCl buffer at
pH 6.8 for stacking gel and 12.5% polyacrylamide for separation gel. Samples were
prepared in 0.06M Tris buffer (pH 6.8) containing 1% SDS and 2.5% β-
mercaptoethanol, then heated at 100°C for 2 min. Coomassie brilliant blue R-250
was used for staining. The protein bands were analyzed by scanning the gel with a
densitometer, and the protein concentrations were determined by using a calibration

83
curve obtained by running standard protein solutions through SDS-PAGE and
scanning with the densitometer.
3.8.4 Activity Assay
Double gel diffusion was performed on a glass slide. The slide was predicted with
0.5% agarose and overlaid by 2% agarose dissolved in 0.015M barbiton buffer ( pH
8.2). The central well was filled with 3 µl of the anti bovine IgG and the peripheral
wells were filled with the aqueous phase after reversed micellar extraction. The
precipitation reaction was preceded at 35°C for 12 h.
3.9 Whey processing
The whey processing includes classification and separation of liquid whey into three
main parts; cheese fines, whey cream and greenish-yellow colored liquid. This liquid
whey was again collected into a silo storage tank at spray drying unit, after it is
drained from the cheese vats. To slow the bacterial activity, the collected whey is
kept at temperature below 6°C. Furthermore, the so called cheese dust is removed
by clarification and excess of fat by centrifugation. The steps involved in the whey
processing are pasteurization, concentration, frozen- crystallization and spray-freeze
drying. The dryer, capacity of 1500 kg/ hour, was fitted with a twin fluid atomizer,
and a cyclone separator. The whey liquid was supplied using an atomizing air
pressure of 98 kPa, and feed temperature of 30°C. The temperature of inlet air was
set at 160°C and outlet air 60°C with hot air flow at the rate of 0.28 m3/ min as
recommended by Bhowmik et al. 259.

84
Figure 13: Flowchart for adopted whey processing technique
3.9.1 Formation of Whey Powder
Two vessels are used for spray freezing and freeze drying separately. Spray frozen
particles of whey concentrate are formed by spraying in the cooled spray chamber
which was purged with nitrogen gas from the cylinder before cooling. The
temperature of the chamber was adjusted on –85 ± 2 °C by regulating the ratio of
nitrogen. The atomization was achieved by a hydraulic nozzle, The feed tank
pressurized the liquid feed at 8 bar pressure. Only the nozzle tip was exposed to the
cold chamber while the rest of the nozzle was kept warm by circulating warm air in
order to avoid freezing of liquid feed in the nozzle. The frozen particles were
collected from the outlet of the chamber in a cooled expanded polystyrene box. After
that, the particles were loaded into the freeze-dryer, having polycarbonate cylinder in
a stainless steel vacuum vessel. The base of the polycarbonate cylinder had 2-mm
thick polyethylene sheet, this sheet acts as a distributing plate while the top of the
vessel was fitted with a fine mesh to allow a low temperature gas flow through the
particle bed whilst retaining the particles within the drying chamber. The resulting

85
spray-freeze-dried product was analyzed for morphology, moisture content, particle
size and the loss of solubility of the proteins.
3.9.2 Whey Powder Analysis The whey powder was evaluated for moisture contents, Whey Protein Nitrogen Index
(WPNI), spore forming bacterial count , scanning electron microscopy, pH, nutritional
and sensory evaluation. Each experiment was performed in triplicate and mean and
standard deviation was recorded.
3.9.2.1 Moisture content The average moisture content of the dried powder was measured gravimetrically. A
known mass of sample (approximately 0.5 g) was placed in an aluminium foil pan
and dried in a vacuum oven at 105 °C for 12 hours. After removing the sample, it
was weighed immediately to avoid water absorption from the surrounding. The initial
and final weights were then used to calculate the wet basis moisture content. The
experiments were carried out in triplicate and average and standard deviation values
calculated 260.
3.9.2.2 Whey Protein Nitrogen Index (WPNI) Determination
Whey Protein Nitrogen Index (WPNI) was determined, using method of Niro 260, 2.0
g of dry powder and reconstituted in 20.0 ml of deionized water in duplicate. After
mixing, 8.0 ± 0.1 g of NaCl was added and placed in a water bath at 37 ± 0.5°C for
30 min. Mixed the content for the complete saturation of milk with NaCl for more than
ten times and filtered. The first cloudy portion was re-filtered. The 5 ml of the filtrate
was collected and 1 ml used as a sample and one for a blank and these filtrates
diluted NaCl solution up to 10 ml. After mixing, 2 drops of HCl solution were added
only in the sample tube, not in blank and turbidity was observed. Mixed gently to
avoid foaming. The spectrophotometer was adjusted to 100% transmittance using
the blank at 420nm wavelength. Within 10 min HCl solution was added, mixed and
measured turbidity at 420nm wavelength. The results are measured in mg WPN/g.
The value of Whey Protein Nitrogen (WPN) obtained by a modified Kjeldahl analysis

86
on standard reference samples were corrected to a 2.2 % moisture content.
Therefore, measured WPNI values have to be corrected to the same content.
WPNI at 2.2 % water =
where A=% moisture in the sample 260.
3.9.2.3 Spore forming bacterial count
The 10 g of milk powder was diluted in 90 ml of sterilized pepton water to make
primary dilution of 10 -1, and serial dilution was made up to 10 -5.
Thermoduric and thermophilic count was enumerated 261 . Milk powder (10 g) was
re- constituted in pepton water diluents (90 ml) and heated (80°C) for 10 or 30
minutes to eliminate the vegetative cells. Heat treated sample (1 ml) of 10 -
1 , 10 -2 and /o r 10 -3 d i lu t ion was t rans fe r red in to pe t r i d ishes (in
duplicate) through sterile automatic pipette (1000 µl) and warmed (45±1°C) sterile
nutrient or milk starch agar medium (15 ml) was mixed with inoculums. After
solidification, the plates were at 55°C for 48 hours. The control plates were also
poured with medium to cheek sterility. After 48 hours colonies were counted.
3.9.2.4 Scanning Electron Microscopy Scanning Electron Microscope (SEM) images of the dried whey samples were
examined to get the information about the structure and shape of whey globules. The
whey powder was mixed with a drop of Glycerol and placed in a sample holder and
quickly frozen in liquid nitrogen, following with coating of 2.5nm platinum and 6.0nm
carbon at an angle of 45° and cryo-transferred into the SEM and imaged at -80°C.

87
Figure 14: Scanning Electron Microscope

88
3.9.2.5 Nutritional Evaluation of Whey powder
Nutritional analysis of whey powder was performed for determining the percentages
of protein, lactose, fat, and ash. All tests were performed in triplicate according to the
standard methods of American Public Health Association 261 and results were
recorded in mean ± standard deviation.
3.9.2.6 Sensory Evaluations of Whey powder
The whey powder was analyzed for color and flavor using methods of Drake et al.
262,
3.9.2.7 pH
The whey powder was also tested for pH using standard procedure of American
Public Health Association 261.
3.9.3 Formation of Probiotic-Whey based anti-diarrheal infant supplement
Three types of anti-diarrheal supplements were prepared by adding three different
combinations of probiotics which were previously isolated in this study. One type with
lactobacillus species (Lb formula), second with bifidobacterium species (Fd formula),
third with the mixed species of lactobacillus and bifidobacterium species (mixed
formula) in the whey powder containing 0.05 percent of Immunoglobulin G that was
extracted from the colostrum.
3.9.3.1 Nutritional Evaluation of Probiotic-Whey based anti-diarrheal infants
supplement
Nutritional analysis of probiotic-whey based supplement were performed for
protein, lactose, fat, ash and moisture. All tests were performed according to the
standard methods of American Public Health Association 261. and results are
reported in mean ± standard deviation.
3.9.3.2 Microbiological Evaluation of Probiotic-Whey based supplements
Typical microbiological analysis was performed for the supplement. The Standard
Plate Count, coliforms testing for total coliforms and faecal coliforms, E. coli,

89
Salmonella spp. Listeria monocytogenes, coagulase-positive Staphylococcus aureus
were tested according to the methods of Food and Drug Organization 248 and
American Public Health Association 261.
3.9.3.3 Physicochemical and Sensory Evaluation of Probiotic Whey based
supplement
Probiotic-whey based supplement was analyzed for colour, flavour, particle content
and Titratable acidity using standard procedures of American Public Health
Association 261.
3.9.3.4 Feed trials of whey based anti-diarrheal infant supplements
A double -blind Placebo-controlled study was conducted on the consecutive under
12 months aged 96 patients who were selected from four Children Care Hospitals of
Lahore. Children were excluded if, at enrollment, they had a history of
gastrointestinal disease or suspected malabsorption disorder. They were also
excluded if they were receiving antibiotics, or soy based formula. Diarrhea was
defined as the passage of unusually loose stool more than three times in 24 hours.
The consent form was obtained from both parents. The patients were randomly
divided into two main categories depending on their ages and further four groups
were formed in each category on the basis of types of supplement including three
supplement groups, one for lactobacillus- whey based supplement (Lb formula),
second bifidus- whey based supplement (Fd formula), third multistrain-whey based
supplement (mixed formula) and fourth was the control group. The supplement
groups were fed with probiotic-whey based supplement for four weeks while the
controlled group was on traditional treatment of antibiotics with no probiotic
supplement. The supplement groups consisted of 14 patients in Lb formula group, 12
patients in Fd formula group and 11 patients in a mixed formula group, while a
control group consisted of 11 patients in first under 6 months age category of infants,
the second category of patients had 08 patients in Lb formula group, 12 patients in
Fd formula group and 14 patients in mixed formula group while control group of 14
patients. If the patients discharged during four weeks of study, the clinical procedure
was not disturbed and inquired on a daily basis. The probiotic whey based
supplements were guaranteed of having live probiotic bacteria at 1012 CFU per gram

90
of powder in each type of formula. The level of bacteria was confirmed before and
after the study. The patients were evaluated daily for number of stools per day,
vomiting episodes, loss of weight during the study, and days taken to recover
completely from diarrhea, while the formula intake was kept constant on the daily
basis calculation of 1/4 teaspoon in single doses and twice a day was the
recommended dose. Number of episodes of regurgitation or vomiting were recorded
on a weekly basis after daily observation of patients in the seven days from the day
of enrollment.
3.10 Life Cycle assessment of value added cheese and whey processing
3.10.1 Goal and Scope
The main objective of this section of research was the assessment of environmental
impacts and energy balance derived from the manufacturing of conventional and
probiotic cheese from buffalo milk in a local dairy factory. The study intended to
identify the environmental hotspots under assessment during life cycle in order to
make improvements. The factory was selected for cradle-to-gate assessment which
was already engaged in a number of milk and milk products production. Moreover,
this factory is one of the cheese production leader industries in Pakistan. Thus, the
research was focussed from the milk collection and pre-treatment for cheese-making
in the treatment of waste generated by cheese processing in the dairy sector.
Furthermore, the liquid whey is a by-product of cheese making and co-produced
after the coagulation of milk and curd formation. The post-treatment as well as the
conversion of liquid whey into powder whey has also been considered in this study.
3.10.2 Functional Unit (FU) Two functional units (FU) were considered in this study;
1) One ton (1,000 kg) of cheese manufactured
(All types of cheeses are considered in this FU)
2) One ton of dry whey produced (dry weight).

91
3.10.3 Development of baseline Scenario and system boundaries under
The cheese-manufacturing under assessment is undoubtedly a typical system of
inputs to multiple outputs where milk is considered as the most significant input while
outputs not only include the cheese but also the whey as a by-product. ISO 14040
(2006) recommends the expansion of the system boundaries. In this study, the
system boundaries encompass a collection of raw milk, milk pre-treatment,
conventional and probiotic cheese manufacturing, packaging, production of whey
powder, and formation of whey anti-diarrheal supplement. The boundary for cheese
and whey processing does not include retail or consumption due to lack of data.
Although it is not a detailed engineering analysis of the manufacturing sector, but the
study is intended to deliver a comprehensive consideration of impacts resulting from
cheese and whey processing by including a specific energy requirement for milk
collection and pre-treatment, cheese-making vats, and starter culture operations.
The study is divided into four scenarios; existing scenario, scenario 1, scenario 2 and
scenario 3.
Existing Scenario
The first scenario (Figure 15) represents the existing situation of cheese production
in local dairy industry of Lahore, Pakistan. The milk is collected from different dairy
farms, stored and processed in a dairy factory. The conventional method is used
here for cheese production, which comprises the phases of milk pre treatment, vats
making, coagulum formation, cutting, moulding, salting of cheese, ripening and
packaging. The existing system does not deal with the whey that is produced during
coagulum and curd formation.

92
Figure 15: Flowchart of Existing Scenario
Scenario 1
The transportation of milk, which is the main input for the production of cheese is
included in the study, but the activities and processes for milk production on the farm
were not considered due to lack of data. It was considered that milk was received
from the dairy farms from different cities of Punjab and stored in collection centers/
dairy factory at 6 degree Celsius.
First of all the raw milk goes to pre-treatment plant and then to cheese making
process. It was considered that 10000 Kg of milk was required to make 1 ton of
cheese. The amount of water used in this production was 15m3. The electricity and
heat consumption was considered 180 KWH and 2800 MJ respectively. The oil
inventory includes all stages of oil extraction, crude oil production its transportation,
refining and distribution. The packaging of cheese required almost 7.9 kg of LDPE. It
was considered that this LDPE cannot be recycled. It was observed that during one
ton of cheese production approximately 7.8 tons of whey were produced.

93
The addition of citric acid was included in its transportation from England to Lahore,
Pakistan. The manufacturing of citric acid was not included. The packaging material,
Plastic LDPE was considered for this study. The stages after cheese production like
transportation of cheese, its market, and consumption etc. were not considered. It
represents a small change in 3rd phase of cheese production by adding the
probiotics instead of citric acid (shown in Figure 16). The other processes are same
like Baseline scenario. Probiotics are the live microorganisms which are used in
adequate amount to animals or humans to confer health benefits by improving the
properties of the indigenous intestinal micro flora 45. These are non pathogenic
heterogeneous group of bacteria that have a number of health benefits such as
stimulation of immune system, antimutagenic effects, improvement in lactose
metabolism, reduction in serum cholesterol, anti inflammatory effects and
anticarcinogenic properties46. Because of these health beneficial effects, the
probiotics are increasingly being incorporated into a number of food products
especially in dairy foods.

94
Figure 16: Flow chart of Scenario 1
Scenario 2
It consists of collection, transportation, pre-treatment of milk with probiotics, ripening
and packaging, but the only change is the utilization of whey instead of wasting it.
Whey is a sub product of cheese. It was observed that approximately 7.9 Ton of
whey was produced during 1 ton cheese production.

95
Figure 17: Flow chart of Scenario 2
The process of powdered whey production requires high amount of energy to
evaporate water, which is approximately 92% in liquid whey. It was assumed that 4.7
m3 of water, 354 KWh of electricity and 7155 MJ of electricity was required to make
whey powder (shown in Figure 17).
Scenario 3
It was noted that all over the world whey is used directly as livestock feed or
concentrated or dehydrated and used in human food and animal feed manufacturing.
It all depends on the geography and socioeconomic factors. It was seen through
literature that 20 to 100% of the whey produced is applied for beneficial effects on
soils, or is land applied as a disposal procedure.
So in this scenario whey was used as a replacement of chemical fertilizer. All other
processes are same as Scenario 2. The whey replaced 0.00175 tons of Fertilizer N,
0.00078 tons of fertilizer P and 0.00097 tons of fertilizer K. The inventory analysis

96
involves the production of chemical fertilizer P, N and K. The transportation of whey
to the fields was out of the boundaries for this study. The flow chart of Scenario 3 is
given in Figure 18.
Figure 18: Flowchart of Scenario 3

97
Chapter 4
RESULTS AND DISCUSSION
4.1 Isolation, Identification and characterization of Probiotics
Twenty strains were isolated and identified in the present study, including fourteen
strains of lactobacillus and six strains of bifidobacterium, using the culture dependent
and culture independent identification techniques. Later, nine lactobacillus and six
bifidobacterium strains were selected for further processing that were isolated from
indigenous sources. The results of the investigated parameters are discussed under
the following headings:
4.1.1 Culture- Dependent Isolation of Probiotics
The colony morphology and Gram reaction of all the isolates were examined. The
colony morphology was observed on MRS agar plates after 72 hours anaerobic
incubation at 35°C. The white and circular colonies of 1.0-2.2 mm size were found.
Some images of isolates, from raw milk, faecal samples and commercial products,
are shown in Figure 19, 20 and 21, respectively.
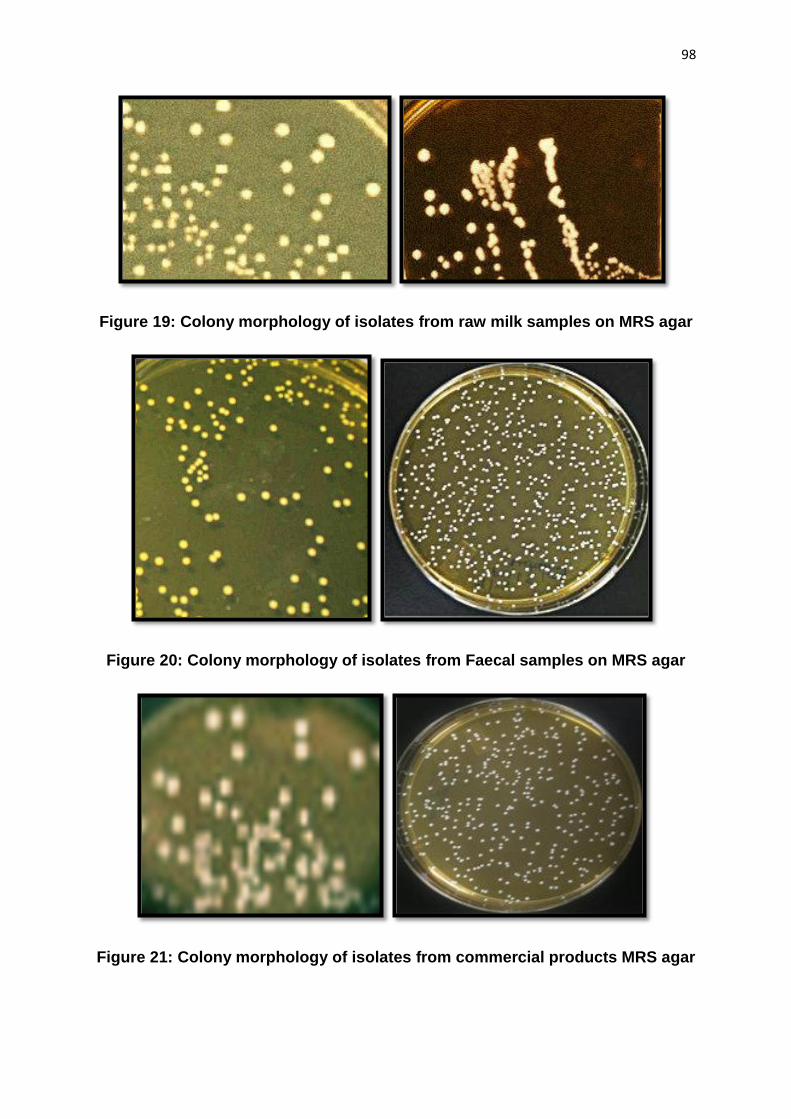
98
Figure 19: Colony morphology of isolates from raw milk samples on MRS agar
Figure 20: Colony morphology of isolates from Faecal samples on MRS agar
Figure 21: Colony morphology of isolates from commercial products MRS agar

99
All the isolates were examined under oil-immersion microscope after gram staining
using standard procedure. Purple coloured ( Gram-positive) rods were found with
variation of straight rods, irregular rods, rods with rounded ends, both in single as
well as in chains. Results of some isolates are shown in Figure 22.
Figure 22: Gram positive rods under microscope
After preliminary confirmation, the gram positive isolates from raw milk samples,
commercial products and human faeces were further characterized for their
physiological and biochemical analysis for further culture-dependent confirmations.
Table 4 summarizes the characterization of selected lactobacillus and
bifidobacterium isolates. The results of Gram staining showed that the isolates from
the raw milk samples, commercial products and human faeces were gram positive
rods with the characteristics of negative catalase, mobility, oxidase, indol, nitrate
reduction but positive for milk coagulation test.
Salminen et al. 263 also investigated that Lactic acid bacteria are positive gram
bacteria with both the rod and round shapes having characteristic of negative
catalase. All of the isolates in this study were gram positive as well as found catalase
negative. Jafari et al 264 also isolated lactobacillus species with preliminary
morphological and biochemical tests and found gram positive and catalase negative
bacteria.

100
Table 4: Physiological and biochemical characterization of Isolates
Origin of isolates
Isolates code
Mobility Catalase Indole Oxidase Milk coagulation
Nitrate Reduction
Gelatinase activity
Haemolytic activity
Raw Milk RM 01 - - - - + - - - RM 02 - - - - + - - - RM 09 - - - - + - - - RM 11 - - - - + - - - RM 14 - - - - + - - - Commercial Products
CP 07 - - - - + - - -
CP 12 - - - - + - - - CP 18 - - - - + - - - CP 21 - - - - + - - - CP 42 - - - - + - - - Human faeces F 04 - - - - + - - - F 09 - - - - + - - - F 12 - - - - + - - - F 19 - - - - + - - - F 41 - - - - + - - - F 68 - - - - + - - - F 73 - - - - + - - - F 07 - - - - + - - - F 10 - - - - + - - - F 13 - - - - + - - -

101
All the isolated strains were further confirmed by carbohydrates fermentation and the
results are presented in Table 5. These results indicate that all strains showed
positive fermentation reactions for glucose and lactose. The isolate RM 01from raw
milk gives positive reaction for xylose (Xly), fructose (Fru), ribose (Rib), sorbitol (Sor)
and mannitol (Man) while the results are negative for sucrose (Suc), maltose (Mal),
trehalose (tre) and arabinose (Ara).
The results for RM 02 indicate the positive reactions with lactose, glucose, sucrose,
maltose, galactose, and trehalose. RM 09 from raw milk gave all positive reactions
except with ribose, Xylose, and arabinose. The RM 11 of raw milk only showed
negative results for trehalose, sorbitol, and arabinose while all other results are
positive. The results of RM 14 indicate the positive reactions with lactose, glucose,
fructose, maltose, galactose, arabinose, and mannitol while weak and variable
results were observed in the fermentation of sucrose, ribose, and trehalose.
The isolate of commercial products CP 07 indicated positive results for Glucose,
lactose, sucrose, maltose, galactose, and trehalose only, while CP 12 gave negative
results for trehalose, sorbitol, and arabinose while all other results are positive. The
CP 18 showed positive reaction for xylose (Xly), fructose (Fru), ribose (Rib), sorbitol
(Sor) and mannitol (Man) while negative results for sucrose (Suc), maltose (Mal),
trehalose (tre) and arabinose (Ara). The CP 21 isolate 14 indicated positive reactions
with lactose, glucose, fructose, maltose, galactose, arabinose, and mannitol while
weak and variable results were observed in the fermentation of sucrose, ribose, and
trehalose and CP 42 isolate of commercial product gave all positive reactions except
with ribose, Xylose, and arabinose.
The RM 11 of raw milk only showed negative results for trehalose, sorbitol, and
arabinose. In the isolates from human faeces origin same trend was observed in the
case of glucose and lactose like isolates of raw milk and commercial products. Only
fructose and maltose fermentation was found positive other than glucose and lactose
in the F04 isolate. The F 09 isolate ribose, fructose and sucrose were found positive
results while negative reactions were in sucrose and mannitol in the case of F 12. In

102
the case of F19 only sorbitol was found with negative reaction while all other sugars
gave positive results. F41 showed negative results only for xylose and arabinose
while in the case of F68 all sugar fermentation tests gave positive results except
sorbitol and mannitol. No negative result was found in the case of F73 and F 13. All
positive reactions were found in F 07 except trehalose, sorbitol, and mannitol. F10
showed all positive reactions except only one sugar i.e. arabinose.
These results were found similar to the Bergey’s manual of determinative
bacteriology 265. Similar results of sugar test for lactobacillus were reported recently
by Felten et al 266, Hoque et al 267, Setyawardani et al 268, Khanafari et al 269, Jafari et
al 264, Ahmed and Kanwal 270, Sieladie et al 49, Bhardwaj et al271 and Nair and
Surendran 272. The present study also verifies the carbohydrate fermentation testing
for bifidobacterium which were previously reported by Leke et al 273, Wasilewska and
Bielecka 274, Shigwedha and Jia 275, and Zinedine & Faid 276.

103
Table 5: Carbohydrate Fermentation of Isolates
Origin of isolates Isolates code
Carbohydrates Fermentation
Glu Lac Suc Xyl Fru Mal Gal Rib Tre Sor Ara Man Raw Milk RM 01 + + - + + - +/- + - + - + RM 02 + + + - - + + +/- + - - - RM 09 + + + - + + + - + + - + RM 11 + + + + + + + + - - - + RM 14 + + +/- - + + + +/- +/- - + + Commercial Products
CP 07 + + + - - + + +/- + - - -
CP 12 + + + + + + + + - - - + CP 18 + + - + + - +/- + - + - + CP 21 + + +/- - + + + +/- +/- - + + CP 42 + + + - + + + - + + - + Human faeces F 04 + + +/- - + + - - - - - - F 09 + + + +/- + - - + - - - - F 12 + + + + + + + +/- + - + -
F 19 + + + + + + + + + - + +
F 41 + + + - + + + + +/- +/- - +/-
F 68 + + + + + + + + + - ? -
F 73 + + + +/- + + + + + + +/- +
F 07 + + + + + + +/- + - - + -
F 10 + + + + + + + + + + - +
F 13 + + + + + + + + + + + +
Glu (Glucose); Lac (Lactose), Suc (Sucrose), Xyl (Xylose), Fru (Fructose); Mal (Maltose), Gal (Galactose); Rib (Ribose); Tre (Trehalose); Sor (Sorbitol), Ara
(Arabinose); Man (Mannitol); + fermentation positive;- fermentation negative;+/- week/ variable fermentation,

104
4.1.2 Culture-Independent Isolation of Probiotics
For culture-independent analysis, the bacterial DNA was extracted directly from the
commercial products, milk samples and human faecal samples. This analysis was
done using lysozyme and series of centrifugation steps according to the methods of
Pitcher et al. 232. The PCR protocol used in this study amplified the V3 region of the
16S rDNA of all the samples. For each sample, PCR amplicons were loaded on 35
to 70% denaturant DGGE gel. Figure 23 shows the results of DGGE gel analysis of
selected bifidobacterium which were isolated from faecal samples, Figure 24 shows
the selected lactobacillus strains which were identified by culture- dependent
methods while selected commercial sample, after extracting DNA were run on
DGGE gel and results are shown in Figure 25. Identification of strains was
performed with the standard reference pattern and followed by comparison of the
bands with identified type strains of BN database. Then the identities were matched
by results of culture-dependent analysis.

105
Figure 23: DGGE gel analysis: Lane 1, Bifidobacterium reference pattern (a, B.bifidum; b, B.
infantis; c, B. longum; d,B. dentum; e, B. brevis; f, B. adolence); Lane 2, isolate F04; Lane 3, isolate
F09; Lane 4 isolate F09; Lane 5, isolate F12; Lane 6, isolate F19; Lane 7, isolate F41; Lane 8, isolate
F68.
The results of the culture-dependent analysis was confirmed by culture-independent
DGGE analytical method. The DGGE analysis was adopted to even identify the low
concentration of probiotic strains in the samples. But this culture-independent
analysis needs the performance of reliable DNA extraction as well as the PCR
analysis229. By using a reference pattern and the BN software, in this study it was
made possible to generate a database of all bands for probiotic type strains. Later
the strains were identified by comparing each band with the reference patterns and
matched with the results of culture-dependent analysis.
a
a
b
c
d
e
f
g

106
In this study no change in gradient was made, only the 35-70% gradient was used.
However, the change in the gradient, primer sequence or conditions for
electrophoresis could be more helpful in building a new database229.
Figure 24: DGGE analysis for selected Lactobacillus sp. Lane 1, Lactobacillus reference pattern;
( A, L. acidophilus; B, L. lactis; C,L.casei; D, L. rhamosus; E, L. brevis; F, L. plantum; G, L. reuteri; H,
L. gasseri; I, L. fermentus); Lane 2, isolate F10; Lane 3 isolate F07; Lane 4, isolate F73; Lane 5,
isolate RM14; Lane 6, isolate RM02; Lane 7, isolate RM11; Lane 8, isolate RM09; Lane 9, isolate
RM01; Lane 10, isolate F13
Temmerman 229 also supports the present study and has suggested that the DGGE
technique can be used in direct identification especially for probiotics. While Ercolini
et al.277 investigated the potential of DGGE for the cultures of whey in cheese
production but they suggested that sequencing of bands in the DGGE profile is a
necessary step that is why the combination of DGGE and culture dependent
procedures were used in this study. But still the culture-dependent methods have
importance in the detection of viable count in the sample which is the main drawback
of DGGE analysis.
A
B
C D
E
F
G
H
I

107
Figure 25: Bands of DGGE gel of commercial Products; Lanes 1 and 7 the reference pattern (A, L.
lactis; B, L. rhamosus; C, L.acidophilus; D, L.brevis, E, L.casei ); lane 2, Nestle Nido; lane 3, Nestle
yogurt; lane 4, Xtra energy milk; lane 5, Haleeb yogurt; lane 6, Haleeb Flavored yogurt; lane 8,
Haleeb cheddar cheese; lane 9, Freeze-dried product; lane 10, Freeze-dried culture; lane 11, Nestle
fruit yogurt, lane 12, Haleeb Labban
A
B
C
D
E

108
4.2 Potential studies of selected Indigenous Probiotic Isolates
To evaluate the potential of selected indigenous probiotic strains, two main
parameters were adopted; antibiotic resistance and the in vitro antagonistic activity
of isolated strains. The findings are discussed under the following headings:
4.2.1 Antibiotic Resistance
The scientific data about antibiotic resistance of probiotic strains is limited, the
reason behind this may be the existence of large variety of these strains and also the
variation in the resistance response. The investigations on the antibiotic resistance of
probiotic strains, also the findings of present study, have disposed the sensitivity of
these bacteria to antibiotics such as penicillin G, chloramphenicol, ampicillin,
erythromycin, and tetracycline. The resistance is only 10% according to Kastner et
al. 278, and Charteris et al. 279 but 26.2 % resistance was found by Zarazaga et al. 280
against penicillin.
In the present study, 80% of the isolates were found resistant to gentamycin, 55%
isolates to kanamycin, and 45% resistant to ciprofloxacin while Zarazaga et al.280
reported 60% of the LAB in the case of ciprofloxacin resistance. This study showed
65% resistance to ceprofloxicin, 5% resistance to erythromycin, tetracyclin and
penicillin; these results are also supported by Sieladie et al.49 who found 100%
sensitive strains against penicillin G, ampicillin, erythromycin and tetracycline, while
100% resistance was shown for ceprofloxicin. The 50% of resistance to antibiotics
was observed in the case of streptomycin, 30% resistance to vancomycin, 40% to
neomycin and 20% resistance to ampicillin. Hummel et al. 281 has highlighted two
main reasons for the limitations in antibiotic resistance studies for the probiotic
strains; one the limitations of selective media for growth of probiotic strains and other
one is the MIC breakpoint specifications.
Even the National Committee for Clinical Laboratory Standards 282 have no
standards for MIC breakpoints of probiotic strains. The results of antibiotic
resistance for the isolated indigenous strains are presented in Table 6.

109
Table 6: Antibiotic Resistance of selected isolates
Origin of isolates Isolates code Antibiotic Resistance
Gen Kan Cep Cip Ery Str Tet Van Pen Amp Neo
Raw Milk RM 01 R S S S S S S S S S S
RM 02 R R S S S R S S S S S
RM 09 R R R R S S S S S S R
RM 11 R S S S S R S R S S S
RM 14 S S S S S R S S S S S
Commercial Products CP 07 R R S S S R S S S S S
CP 12 R S S S S R S R S S S
CP 18 R S S S S S S S S S S
CP 21 S S S S S R S S S S S
CP 42 R R R R S S S R S R R
Human faeces F 04 R R R R S S S S S S R
F 09 R R S R S S S S S S R
F 12 R R S R S S S S S S R
F 19 R R R R S S S S S S R
F 41 S S S S S R S S S S S
F 68 R R R R S S S S S S R
F 73 R S S S R S S R S S S
F 07 S R S S S R R R R S S
F 10 R R R R S R S R S R R
F 13 R S S R S R S S S S S
R: Resistant; S: Sensitive; pen: penicillin G (10 units); amp: ampicillin (10μg), ery: erythromycin (15μg), tet: tetracycline (30μg), neo: neomycin (30μg), van: vancomycin (25μg), strep: streptomycin (25μg), cep: ceprofloxicin (25μg), kan: kanamycin (10μg), gan: gentamycin (10μg), and cip: ciprofloxacine (5μg)

110
4.2.2 In vitro Antagonistic activity
Results for antimicrobial activity of selected twenty indigenous probiotic isolates are
presented in Table 7. The data shows that all isolates inhibited the growth of all
tested pathogenic strains. Similar investigation was performed by sieladie et al.49.
Several previous investigations have reported antagonistic actions such as
competitive exclusion, modulation of immune response, micro-ecological alternation
in gut, inhibition of bacterial translocation of probiotic bacteria and antimicrobial
agents production283. These antimicrobial agents are known as ‘bacteriocins’ that
could be in the form of fatty acids, organic acids, hydrogen peroxide, and diacetyl,
aceton and the small, heat-stable inhibitory peptides which could be demonstrated in
vitro by the diffusion assay284 as adopted in this study.

111
Figure 26: Zones of Inhibition of some isolates

112
The significant antagonistic activity of Lactobacillus plantarum and L. lactis was
found by Yateem et al.285 found against E. coli and Salmonella typhi, the same was
indicated in this study. The present findings are also supported by Haddar et al.286
who studied the antimicrobial activity of the selected probiotics against Klebsiella, E.
coli, E. coli and Staphylococcus aureus.

113
Table 7: In vitro Antagonistic activity
Origin of isolates
Isolates code
E.coli S.typhi V.cholerae S.aureus P.aeroginosa K.pneumoniae E. Faecalis L.monocytogenes C.difficile
Raw Milk RM 01 + + + + + + + + +
RM 02 + + + + + + + + +
RM 09 + + + + + + + + +
RM 11 + + + + + + + + +
RM 14 + + + + + + + + +
Commercial Products
CP 07 + + + + + + + + +
CP 12 + + + + + + + + +
CP 18 + + + + + + + + +
CP 21 + + + + + + + + +
CP 42 + + + + + + + + +
Human faeces
F 04 + + + + + + + + +
F 09 + + + + + + + + +
F 12 + + + + + + + + +
F 19 + + + + + + + + +
F 41 + + + + + + + + +
F 68 + + + + + + + + +
F 73 + + + + + + + + +
F 07 + + + + + + + + +
F 10 + + + + + + + + +
F 13 + + + + + + + + +

114
4.3 Microencapsulation: Survival and functional attributes of Indigenous
Probiotic isolates
The mean and standard deviation of experiments conducted in triplicate for the free
(control), single and double microencapsulation are shown in Table 8. The reduction
rate was calculated on seven day interval during the storage of six weeks. The
following formula is used for the determination of the rate of reduction of probiotic
bacterial count (CFU/g).
All the individual cultures of Lactobacillus and Bifidobacterium as well as the mixed
culture of both, like the previous studies on the probiotic encapsulated with prebiotics
by Sultana et al151, Kailasapathy et al.55 Vivek et al. 287 and Chen et al288 , proved
that microencapsulation technique is a promising approach for improving the
survival and improvement of probiotic bacterial cells. The adopted double
encapsulation techniques in this study have significant effects (P< 0.05) on the
survival of bacterial cells during storage of six weeks. In the case of free (control)
bacterial cells, the reduction in the mean microbiological count (cfu/g) was observed
on 28th day, single encapsulated on 35th day while the double encapsulated
bacterial mixed cells were reduced from mean microbiological count of 3.84×10⁸ ,that
was observed on 35 day, to 3.83×10⁸ on 42th day.

115
Table 8: Probiotic bacterial count for Control, Single and Double Encapsulated
bacteria during storage
Time
(days)
Control
(Mean CFU×108/g)±SD
Single-encapsulated
(Mean CFU×108/g)±SD
Double-encapsulated
(Mean CFU×108/g)±SD
0 2.45±0.20
2.98±0.21 3.16±0.18
7 2.52±0.14 2.92±0.18 3.32±0.09
14 2.68±0.19 3.12±0.23 3.41±0.17
21 2.74±.0.27 3.29±0.40 3.68±0.23
28 2.63±0.23 3.36±0.23 3.73±0.71
35 1.91±0.20 3.29±0.16 3.84±0.20
42 0.71±0.19 3.14±0.14 3.83±0.20
The present study endorsed the findings of Yeo and Liong that a significant increase
in the growth for L. acidophillus FTDC 8033 and Lactobacillus sp. FTDC 2113 in soy
milk when supplemented with FOS and ultimately the probiotic growth exceeded 7-
log CFU/ml 289. According to the report of Ding and Shah, probiotic bacteria
encapsulated in alginate, xanthan gum, and carrageenan gum survived better (P <
0.05) than free probiotic bacteria, under acidic conditions 290; also justifies the
significance of present data. In fact, the Addition of prebiotics
(fructooligosaccharides, iso-maltooligosaccharides and lactulose) is an emerging
alternative that can further enhance probiotic activity since the building blocks and
structure of the oligosaccharides are different, the functionality of each prebiotic can
be different. Generally prebiotics enhance the growth of probiotics by providing
carbon and nitrogen sources for the growth of the LAB which will increase their
colonization of the gut 240.
However, the symbiotic effects of probiotics and prebiotics are strain-dependent.
Only certain probiotics grow when supplemented with prebiotic carbon source. Yeo
Siok reported different growth rates for six different strains of lactobacilli and
bifidobacteria supplemented with five different prebiotics. Lactobacillus spp. FTDC
2113 grew significantly when supplemented with FOS but did not grow when
supplemented with prebiotic, pectin 289. In the present study the mixture of
encapsulated bacterial mixture showed high growth in the presence of prebiotics.

116
Besides accommodating the size, microencapsulation also addresses other stresses
faced by probiotics such as the need to be maintained at high levels without
interacting with the food products on the shelf or altering the taste characteristics. It
may also help avoid over-acidification of the product by controlling the release of
lactic acid into the environment 291. The survival of double microencapsulated
bacterial cells not only proves the statement of Rabanel et al. that both the alginate
and prebiotics are compatible with probiotics 292 but also justifies the claim of Chen
Kun-Nan et al that the Survival rate of the co-encapsulated active probiotics
increases 1000× higher than for alginates alone 288. These double
microencapsulated bacterial cells can be used in food technology and production as
it provides a solution to the low viability of probiotics incorporated in dairy products.
Ideally it can maintain the level of the beneficial probiotic bacteria at the minimum
standard amount required 293.
4.3.1 Simulated Gastric Juice
The stimulated Gastric Juice (SGJ-A), containing 2.0 g/kg of NaCl and 0.3 g/kg of
pepsin by using 0.1 M HCl, showed the drastic effects on the free Lactobacillus cell
(Figure 27). Initial mean free Lactobacillus cell were 2.45×10⁸ cfu/g which had lost
1.09×10³ , 1.04×10⁴ , 2.01×10² , 2.74×101 , 2.56×10² , 1.76×101 and 1.99×10² for
L. lactis AH-1 (isolate RM02), Lactobacillus reuteri AH-2 (isolate F07), Lactobacillus
acidophilus AH-3 ( isolate RM01), Lactobacillus rhamnosus AH-4 (isolate RM11),
Lactobacillus casei AH-5 (isolate RM09), Lactobacillus plantarum AH-6 (isolate F73),
and Lactobacillus brevis AH-7 (isolate RM14), respectively.

117
Figure 27: Mean loss in Lactobacillus count (Log 10 cfu/g) for free (control),
Single encapsulated and Double Encapsulated bacteria in SGJ- A
Lactobacillus lactis AH-1 (isolate RM02), Lactobacillus reuteri AH-2 (isolate F07), Lactobacillus
acidophilus AH-3 ( isolate RM01), Lactobacillus rhamnosus AH-4 (isolate RM11), Lactobacillus casei
AH-5 (isolate RM09), Lactobacillus plantarum AH-6 (isolate F73), and Lactobacillus brevis AH-7
(isolate RM14)
The results of the survival evaluation of free (control), Single encapsulated and
double encapsulated Lactobacillus in stimulated Gastric Juice B, shown in Figure 28,
indicated that the pH 2.0 resulted in great loss of bacterial count for uncoated free
Lactobacillus while the coated cells, either single or double microencapsulated, had
a negligible loss in counting.
0
0.5
1
1.5
2
2.5
3
3.5
AH1 AH2 AH3 AH4 AH5 AH6 AH7
Loss
in m
icro
bio
logi
cal c
ou
nt
(L
og
10
cfu
/g)
Microorganisms
Mean loss in Lactobacillus count in Stimulated Gastric Juice-A
Control Single encapsulated Double encapsulated

118
Figure 28: Mean loss in Lactobacillus count (Log 10 cfu/g) for free (control),
Single encapsulated and Double Encapsulated bacteria in SGJ-B
L. lactis AH-1 (isolate RM02), Lactobacillus reuteri AH-2 (isolate F07), Lactobacillus acidophilus AH-3
( isolate RM01), Lactobacillus rhamnosus AH-4 (isolate RM11), Lactobacillus casei AH-5 (isolate
RM09), Lactobacillus plantarum AH-6 (isolate F73), and Lactobacillus brevis AH-7 (isolate RM14)
In the case of survival evaluation of single microencapsulated bacterial cells, the loss
was high Lactobacillus plantarum AH-6 and Lactobacillus brevis AH-7 i-e 2.29×10²
and 3.24×10² respectively. The bacterial loss was negligible in the case of double-
microencapsulated bacterial cells. The zero loss was found in the mean
microbiological count (cfu/g) of Lactobacillus reuteri AH-2 and Lactobacillus reuteri
AH-7 after the incubation of 2 hours in SGJ-A. The results of bifidobacterium
cultures are shown in Figure 29 for SGJ-A.
4.12
3.19 3.3
2.35
3.39
1.24 1.25
1.69 1.63
1.14 1.43 1.38
1.63 1.69
1.07
0 0
0.69
0 0 0
AH1 AH2 AH3 AH4 AH5 AH6 AH7
Mean loss in microbiological in Stimulated Gastric Juice-B
Control Single encapsulated Double Encapsulated

119
Figure 29: Mean loss in bifidobacterium and two lactobacillus strains count
(Log 10 cfu/g) for free (control), Single encapsulated and Double Encapsulated
bacteria in stimulated Gastric Juice B (120 min incubation)
B.infantis (Isolate F09), B. longum (Isolate F12), B. dentum (Isolate F19), B. adoles (Isolate F68), B.
brevis (Isolate F41), L. gasseri (Isolate F10), L. fermentum (Isolate F13)
This rapid die-off rate of free bacterial cells when incubated for 120 min in
stimulated Gastric Juice -A (SGJ-A) was the function of low pH and acid
concentration. As the final pH of the SGJ-A was 1.4, which is similar to the pH of the
human stomach before ingestion of food. In such a harsh environment, no protection
was provided by free bacterial cells that was the main reason of rapid die-off. The
single microencapsulated bacterial cells had showed better survival against harsh
condition of SGJ because of Ca- alginate coating. This agrees with the reports of
Hansen 294 and Krasaekoopt 295. The technique of double microencapsulation, both
with Ca- alginate and prebiotics (FOS and IMO) showed amazing results in the case
of Lactobacillus reuteri AH-2 and Lactobacillus brevis AH-7 while the negligible
loss of bacterial count was observed in the case of other probiotic isolates. It proves
the strength of double -microencapsulation. Under the double microencapsulated
bacterial cells, the survival of bacteria was far greater compared with that of free and
single- microencapsulated bacterial cells. This supports the notion that it is important
0
1
2
3
4
5
6
B.infantis B. Longum B. Dentum B. Adole B.brevis L. Gasseri L.fermentum
Mean Loss in Bifidobacterium count in Stimulated Gastric Juice-A
Stimulated Gastric Juice A Control
Stimulated Gastric Juice A Single encapsulated
Stimulated Gastric Juice A Double encapsulated

120
in such simulated testing that the SGJ match the proper physiological conditions
because bacterial survival is influenced by the pH 238,296 encountered by the probiotic
bacteria when ingested. This agrees with the report of Sharp 297 who observed a 3.8-
log reduction after a 2-h incubation in SGJ.
Again the great loss of free bacterial cells was found in the SGJ-B as compared to
single and double -microencapsulation. The in vitro test of gastric survival using
H3PO4 (SGJ-B) was useful to provide a buffering effect when the bacteria were
present in a free form, but it was not a good test for acid tolerance of the bacteria in
the Ca-alginate coated microcapsules. Some interaction between the H3PO4 and Ca-
alginate capsules possibly may have prevented penetration of acid into the capsules.
The results of SGJ-B for the bifidobacterium isolates are shown in Figure 30.
Figure 30: Mean loss in bifidobacterium and two lactobacillus strains count
(Log 10 cfu/g) for free (control), Single encapsulated and Double Encapsulated
bacteria in stimulated Gastric Juice B (120 min incubation)
B.infantis (Isolate F09), B. longum (Isolate F12), B. dentum (Isolate F19), B. adoles (Isolate F68), B.
brevis (Isolate F41), L. gasseri (Isolate F10), L. fermentum (Isolate F13)
0
1
2
3
4
5
6
B.infantis B. Longum B. Dentum B. Adole B.brevis L. Gasseri L.fermentum
Mean loss in Bifidobacterium count In Stimulated Gastric Juice-B
Stimulated Gastric Juice -B Control Stimulated Gastric Juice -B Single encapsulated
Stimulated Gastric Juice -B Double encapsulated

121
4.3.2 Simulated Intestinal Juice (SIJ)
The Mean loss in microbiological count (Log 10 cfu/g) for free (control), Single
Encapsulated and Double Encapsulated bacteria in stimulated Intestinal Juice (pH
7.4) are shown in Figure 31. A slight recovery of free and single encapsulated
bacterial strains was observed after the addition of bile and pancreatin. The acids of
the SGJ-A and SGJ-B both were unable to provide any significant protective effect
for the control bacteria as well as to some extent to single microencapsulated
bacterial cells. Due to addition of SGJ-A with bile and pancreatin, a slight increase
was observed in the free and single encapsulated bacteria probably because of
resuscitation of some cells that were sublethally injured during the 2-h incubation of
SGJ-A while the zero loss was found in the case of double microencapsulated
lactobacillus cells.
Figure 31: Mean loss in Lactobacillus isolates (Log 10 cfu/g) for free (control),
Single encapsulated and Double Encapsulated bacteria in SIJ
L. lactis AH-1 (isolate RM02), Lactobacillus reuteri AH-2 (isolate F07), Lactobacillus acidophilus AH-3
( isolate RM01), Lactobacillus rhamnosus AH-4 (isolate RM11), Lactobacillus casei AH-5 (isolate
RM09), Lactobacillus plantarum AH-6 (isolate F73), and Lactobacillus brevis AH-7 (isolate RM14)
Bifidobacterium breve and Bifidobacterium longum were encapsulated by Picot and
Lacroix who found results similar to the present study. They dispersed the fresh
cells in heat-treated whey protein suspension and followed by spray-drying and
1.22
2.09 2.36
1.09
2.17
1.09 0.91
1.3
0 0 0
1.04
0.48
1.02
0 0 0 0 0 0 0 AH1 AH2 AH3 AH4 AH5 AH6 AH7
Mean loss in lactobacillus isolates (Log 10 cfu/g) in Stimulated Intestinal Juice
Control Single-encapsulated Double-encapsulated

122
found the destructive rate of both strains. They concluded that this approach is
potentially useful for delivery of viable bacteria to the gastrointestinal tract of humans
via dairy products298 that is why cheese was selected for the delivery of
encapsulated bacterial cultures. Whorwell et al. also recommended that
encapsulated B. infantis 35624 can be used to relieve potentially from various
symptoms of IBS at a dosage level of 1 108 cfu299. In another study, the alginate-
coated gelatin was used to encapsulate the Bifidobacterium adolescentis to enhance
survival during exposure to the adverse conditions especially in the gastro-intestinal
tract and found significantly (P < 0.05) higher numbers of bacteria due to the
buffering effect. After incubation in simulated gastric (1 h) and intestinal juices (pH
7.4, 4 h), the number of probiotic B. adolescentis the surviving cells was found high
240 showing similarity with the present study. The results of SIJ for the
bifidobacterium and two lactobacillus isolates are shown in Figure 35.
Figure 32: Mean loss in bifidobacterium and two lactobacillus strains count
Log 10 cfu/g) for free (control), Single encapsulated and Double Encapsulated
bacteria in SIJ
In the nutshell, this study reveals that a double encapsulation technique using the
combination of calcium alginate and prebiotics amalgum for the microencapsulation
of probiotic bacteria is reported in this study. Incorporation of prebiotic mixture has
0
0.5
1
1.5
2
2.5
B.infantis B. Longum B. Dentum B. Adole B.brevis L. Gasseri L.fermentum
Mean loss in selected isolates in SIJ
Stimulated Intestinal Juice Control
Stimulated Intestinal Juice Single encapsulated
Stimulated Intestinal Juice Double encapsulated

123
improved the viability of viable bacteria as compared to when the bacteria were free
or encapsulated singly with calcium alginate. Inclusion of glycerol with alginate mix
increased the survival of bacteria when frozen at −20°C. The survival evaluation of
double encapsulated bacteria showed that the rate of loss in microbial count was
lower than that of free and single encapsulated cultures. The encapsulated bacteria,
however, did not demonstrate a significant increase in growth when subjected to in
vitro intestinal juice containing pancreatic and bile salt conditions. A preliminary
study was carried out in order to monitor the effects of encapsulation on the survival
over a period of 6 weeks.
This study showed significant advere effects on the survival of free cultures in both
SGJ-A and SGJ-B while the loss was higher in single microencapsulated
Lactobacillus plantarum AH-6 and Lactobacillus brevis AH-7 while negligible for
double- microencapsulated cells. The zero loss was found in the mean
microbiological count (cfu/g) of Lactobacillus reuteriAH-2 and Lactobacillus brevis
AH-7. While a slight revival was observed in the free and single encapsulated
bacteria in SIJ probably because of resuscitation of some injured cells because of
acidic conditions. The findings reveal that the combination of Ca-alginate and
prebiotics significantly improve the viability of bacterial cells in the harsh
gastrointestinal conditions and may be of use for the food and/or pharmaceutical
industries.
4.4 In vitro Adherence studies of Potential Indigenous Probiotics
4.4.1 Cell Surface Hydrophobicity
The research has revealed that the probiotic cell adhesion on the gut lining is
considered as an important requirement for delivering health benefits and the
estimation of surface hydrophobicity is the best way to determine this adherence
and colonization potential of probiotics242 . Therefore, it is important that the probiotic
isolates should be able to persist for an extended period in the host gut to deliver the
beneficial effects and the indigenous probiotic isolates reflects that they have the
features which are required to adapt and colonize in the host gut. The selected
probiotic isolates were also analysed for the adherence studies in this study. The

124
mean with standard deviation of triplicate experiments are presented in Table 9. It
has been found that there was no difference in the hydrophobicity of both solvents
used. All the recorded readings are more or less same as observed by Kaushik et al.
242 while studying their Lp9 isolate. Schillinger et al. also reported that the cell
surface hydrophobicity ranges from 2% to 95% for different probiotic bacteria300 with
enormous variation in the surface hydrophobicity301. In the present estimation, the
hydrophobicity was found with mixed trend in the Lactobacillus as well as
Bifidobacterium isolates. The indigenous isolate RM01 was found with highest cell
surface hydrophobicity ( 56.3 %) and lowest was found in isolate F07 (28.1 %).
Previous research has revealed that some lactobacillus strains show low cell surface
hydrophobicity to 2-5% 300,302 but neither of the isolated strain showed such a low
hydophobicity percentage. This great difference in the hydophobicity percentage
could be due to the difference in the cell surface protein expression; may be due to
the variation in environmental conditions 244,303. Some reasearch on hydrophobicity
of probiotics has also revealed that the formation of a complex between specific and
non-specific factors are also an important in the bacterial binding and persists in the
gut lining of host. Kaushik et al. 242 has clamied that hydrophobicity plays a vital role
in the cellular interaction.

125
Table 9: Cell Surface Hydrophobicity, aggregation, and Cell adhesion
evaluation of selected indigenous Probiotic Isolates
Isolates code
Hydrophobicity (%) Aggregation (%) Adhesion ratio (%)
n- hexadecane Xylene
RM 01 56.3±0.10 56.1±0.04 36.1±0.13 7.2±0.10
RM 02 49.1±0.06 49.3±0.08 34.9±0.14 8.3±0.09
RM 09 52.7±0.21 52.3±0.01 31.7±0.09 7±0.12
RM 11 47.3±0.14 47.3±0.09 41.3±0.98 8.1±016
RM 14 43.1±0.12 43.5±0.03 32.6±0.01 8.5±0.32
CP 07 37.5±0.19 37.6±0.13 40.9±0.12 7.9±0.63
CP 12 39.1±0.24 39.1±0.17 51.9±0.07 7.4±0.42
CP 18 34.9±0.14 34.1±0.74 37.9±0.07 7.1±0.31
CP 21 33.4±0.14 33.6±0.79 56.1±0.03 6.9±0.17
CP 42 36.7±0.18 36.2±0.18 48.0±0.04 8.6±0.78
F 04 29.1±0.21 29±0.06 49.2±0.08 8.2±0.91
F 09 39.7±0.17 39.1±0.08 32.9±0.06 7.9±0.19
F 12 51.3±0.78 51.6±0.07 32.5±0.02 8.1±0.17
F 19 46.7±0.98 46.7±0.17 33.3±0.07 7.6±0.63
F 41 31.5±0.15 31.3±0.04 31.8±0.03 7.3±0.71
F 68 38.4±0.18 38.1±0.09 40.7±0.07 7.1±0.44
F 73 36.6±0.24 36.1±0.13 49.6±0.05 7.2±0.19
F 07 28.1±0.27 28.6±0.19 31.9±0.03 6.1±0.13
F 10 35.5±0.17 35.5±0.19 35.1±0.10 6.9±0.22
F 13 39.6±0.12 39.6±0.27 31.7±0.09 7.5±0.26
4.4.2 Cell auto-aggregation
The research has highlighted the presence of four mucus-binding proteins genome
in L. plantarum inclding the longest gene, ORF lp_1643 containing six repeats, these
mucin-binding proteins helps in the adherence and the persistence of probiotic
bacteria in the host GI tract 304 305. It has also been found that after adherence, the
probiotics got the ability of aggregation and colonization in the gut for sustaining
health promoting benefits. Vandevoorde et al. has also stated that the cellular
aggregation not only facilitates the bacteria in transient colonization but also provide
a protective shield to the host system, by forming the biofilm over the tissues of the
host306 and form is important to promote the colonization of health promoting

126
probiotics in several ecological niches like the GI or urogenital tracts 307. In the
present study, the mean and standard deviation of percentages of triplicate
experiment for cell aggregation of all indigenous isolates were recorded and
presented in Table 9. The highest percentage was observed in CP 12 (51.9%)
followed by isolate CP 56 with the percentage of 56.1 while the least was found in
two isolates RM 09 and F13 with the similar value of 31.7 %. Similar study on cell
aggregation was concluded by Kaushik et al 242 but they did not find such a high
capability of self-aggregation in their indigenous isolate of Lactobacllus plantarum.
4.4.3 Cell adhesion assay
The mean and standard deviation of cell adhesion assay of selected indigenous
isolates are given in Table 9, the highest percentage was observed by CP 42 (8.6%)
followed by isolate RM 14 with the percentage of 8.5% while the least was found in
isolates F07 with the value of 6.1 %. The results of cell surface hydrophobicity, cell
auto-aggregation and cell adhesion assay for the selected indigenous probiotic
isolates suggests that these isolates have specific interaction and colonization
potential in the gut that is also indicated by good adhesion ratio while using Caco-2
cell lines, as matches the conclusions of Kaushik on lactobacillus strains 242.
4.5 Quality Testing and pre-treatment of cheese milk
The five types of Mozzarella cheeses were prepared with buffalo milk after
standardization of fat at 0.1%. Five different ways were used for pre-acidifications
using citric acid, commercial starter cultures, selected heat resistant lactobacillus,
selected heat resistant bifidobacterium and mixture of selected lactobacillus and
bifidobacterium cultures. The milk was standardized and analyzed for its quality and
composition before using it for cheeses preparation.
The microbiological analyses were conducted for total viable aerobic bacterial count,
Staphylococcus aureus, Salmonella spp., yeast and mould count, total , faecal
coliforms, and E.coli count and compositional analysis was performed for moisture
percentage, Fat content, total protein, whey protein percentage, lactose, acidity
percentage, Solid non fat (SNF) percentage, salt as NaCl percentage, casein

127
percentage, calcium content and pH. The results of all the investigated parameters
are discussed under the following headings;
4.5.1 Microbiological analysis of cheese milk
The microbiological analysis was performed for the total viable aerobic bacterial
count, of Staphylococcus aureus, and Salmonella spp., and for yeast and mould
count, total coliforms, faecal coliforms and E.coli count of the raw buffalo milk
samples. The results for microbiological testing are given in Table 10.
Table 10: Microbiological analysis of cheese milk
Tested Microorganisms Count
Total aerobic count/g 7.53±0.19×10³
Staph.aureus/g ND
Salmonella spp./25 g ND
Yeast count/g <10
Mould count /g <10
Total coliforms (MPN/g) <1
Faecal coliforms(MPN/g) <1
E.Coli (MPN/g) <1
The results of microbial analysis fulfilled the requirements of raw milk used for further
processing as recommended by Public Health Service and Food and Drug Admin308.
4.5.2 Physicochemical analysis of cheese Milk
Milk has no fixed values of its components as there are numerous factors which can
affect the composition of milk. The factors which influence it include locality and age
of the animal, genetics, environment, milk production process, lactation period,
diseases and season 309. Fat and protein are considered as the primary components
which have great influence on the composition and properties of cheese 13.
For the manufacturing of good quality of cheese the buffalo milk was procured from
antibiotic and disease free animals. The results for the physicochemical composition
of milk samples are given in Table 11.

128
Table 11: Physicochemical analysis of cheese milk
Parameters Buffalo Milk
Moisture% 85.04±0.94
Fat% 6.58±1.04
Total Protein % 3.73±0.93
Whey Protein % 17.548±.99
Lactose % 4.88±1.07
Acidity % 0.14±0.68
SNF % 7.973±1.07
Salt as NaCl % 0.22±1.09
Casein % 2.85±0.78
Calcium mg/100g 1132±0.98
pH 6.62±0.66
The mean percentage of moisture was found 85.04, the mean fat contents were
6.58, total protein 3.73 percent, lactose 4.88% while the whey protein was found
17.548 %. The results revealed 0.14 % acidity with pH 6.62. The NaCl salt
percentage was 0.22 in sampled buffalo milk with casein 2.85 % and calcium 1132
mg/100g of milk sample. The results of the present investigation also endorsed the
compositional findings of buffalo milk by various researchers 310.

129
4.6 Cheese manufacturing and analysis during storage
The standardized and pre-treated buffalo milk samples were used for the
manufacturing of all five types of Mozzarella cheeses (cheese blocks are shown in
Figure 33). During the designated storage period of 180 days all the cheese samples
were kept at a temperature of 6.0±0.5°C and humidity of 60±2 %. All three batches of
cheese manufacturing were subjected to physicochemical, functional, rheological
and microbiological analysis and the mean values with standard deviation are
presented and discussed here under the following headings:
Figure 33: Cheese blocks

130
Figure 34: Cheese Vats
4.6.1 Physicochemical analysis of Manufactured cheeses
4.6.1.1 Moisture content
The analysis of the moisture content is an important quality assessment of finished
cheese since it is considered a major component of cheese. It acts as a plasticizer
in the protein matrix and makes the cheese less elastic and more susceptible to
fracture when compressed 311. The variations in the moisture contents can affect the
textural characteristics of cheese during storage312.
The mean results ± standard deviation of the moisture content of different Mozzarella
cheeses are shown in Table 12. The interpretation of results exhibited that there is a
significant influence of different pre-acidification treatments, using citric acid,
commercial starter cultures, selected heat resistant lactobacillus, selected heat
resistant bifidobacterium and mixture of selected lactobacillus and bifidobacterium
cultures, on the moisture content of Mozzarella cheese during storage of 180 days.

131
Table 12: Moisture Contents (%) during Storage
The results revealed that the moisture contents of Vat I cheese (pre-acidified with
citric acid) decreased significantly from 58.48 % (0 day) to 55.94% (180 day), but no
significant difference was found after day 150 and day 180. While moisture of Vat II
(pre-acidified with commercial starter culture) decreased 2.66% during storage. In
the cheese (Vat III), pre-acidified with indigenously isolated lactobacillus culture,
significant reduction in moisture percentage was 2.35% during storage of 6 months.
In Vat IV, pre-acidified with indigenously isolated bifidobacterium culture, 3.70% of
moisture reduction was observed during 180 days of storage. The least
concentration of moisture of 46.12% on day 180 was recorded in the Vat V cheese,
pre-acidified with mixed probiotic cultures. The highest level of moisture content
reduction was found in the case of Vat V which was pre-acidified with mixed
probiotics culture i-e 4.11%, while the highest level of moisture was found in the Vat I
cheese on day 0 and the moisture reduction was lowest in this type of cheese.The
graphical presentation of moisture contents is given in Figure 35.
Storage Period (days)
Type of cheese
0 30 60 90 120 150 180
Vat I 58.48f 57.74e 57.12d 56.91c 56.14b 55.99a 55.94a
Vat II 49.57g 48.93f 48.43e 47.91d 47.53c 47.01b 46.91a
Vat III 50.47g 50.21f 49.46e 49.11d 48.81c 48.32b 48.12a
Vat IV 50.91g 50.24f 49.82e 49.12d 48.74c 48.61b 47.21a
Vat V 50.23g 49.63f 49.12e 48.24d 47.85c 46.81b 46.12a

132
Figure 35: Moisture Contents in Cheeses during Storage
The moisture percentage of Mozzarella cheeses found in present study are similar
to the previous findings of Sheehan et al. 313 and Ayesha 314 who reported the
decrease in the moisture content in their cheeses during storage period. The
reduction in moisture during the storage period is also supported by the findings of
Mallatou and Pappa 315 who found that moisture in non fat substance (MNFS)
decreases sharply during first 20 days of storage which may be due to reduction in
hydration of casein during initial stages of storage.
4.6.1.2 Protein content
The mean results ± standard deviation for protein contents of all types of cheese
vats are indicated in Table 13, which has shown that there is a significant effect of
different treatments of pre-acidification on protein contents during storage of 180
days.
0
10
20
30
40
50
60
70
0 30 60 90 120 150 180
Storage period (days)
Mean Moisture content (%)
Vat I Vat II Vat III Vat IV Vat V

133
Table 13: Protein contents during storage
Protein Contents (%) during Storage (days)
Type of cheese
0 30 60 90 120 150 180
Vat I 28.45a 28.97b 29.12c 29.89d 30.41e 30.98f 31.13g
Vat II 29.91a 29.99b 30.12c 30.96d 31.43e 32.09f 32.91g
Vat III 29.98a 30.12a 30.91b 31.38c 31.67cd 32.04e 32.48e
Vat IV 30.11a 30.89b 31.45c 31.97d 32.46e 32.94f 33.01f
Vat V 31.89a 32.13a 32.91b 33.09b 33.45bc 33.98cd 34.14d
The data elucidated in Table 13 and Figure 36 shows that the protein content in all
Mozzarella cheeses increased consistently during storage period. The protein
percentage significantly increased from 28.45% (day 0) to 31.13% (day 180) of Vat I
cheese that was pre-acidified with citric acid while the increase in Vat II cheese that
was pre-acidified with commercial starter culture increased from 29.91% to 32.91%.
In the cheese (Vat III), pre-acidified with indigenously isolated lactobacillus culture,
increase in protein percentage was 2.50% during storage of 6 months. In Vat IV, pre-
acidified with indigenously isolated bifidobacterium culture and in Vat V cheese pre-
acidified with mixed probiotics culture the increase was 2.9% and 3.04% in protein
contents respectively during 180 days of storage. The highest increased level of
protein was found in the case of Vat V i-e 3.04%, while the lowest level of protein
increase was found in the Vat III cheese.

134
Figure 36: Protein Content in manufactured cheeses during Storage
The results of protein content was different to the findings of Ayesha during her
studies on the effects of commercial and indigenous cultures on the cheese during
ripening time 314. Unlike present investigation, she found that cheese made by
commercial starter culture (28.39%) increases more protein during storage as
compared to the cheese made by indigenous cultures (28.06%). But the present
findings show similar results as investigated by Ali and Abdel-Razig316.
The report of Rudan et al. (1997) is in line with findings of present study in which
they reported the significant change in the protein percentage with reference to
different fat contents and found variations from 32.85% to 24.92% in protein contents
317. The variations in protein contents was also observed by Patrick et al while
studying the low fat milk which may be due to the changes in the protein to fat ratio
in the milk which ultimately effects the concentration of protein during storage 10. The
increase in protein concentration in the cheese was also found by Rudan et al. 11,
Fife et al. 318 and Guinee et al. 319 who found an increase in protein percentage with
decrease in fat percentage of cheese milk. But no valid literature was found on the
behaviour of protein contents in non-fat mozzarella cheese during the storage.
0
5
10
15
20
25
30
35
40
0 30 60 90 120 150 180
storage period (Days)
Mean Protein content (%)
Vat I Vat II Vat III Vat IV Vat V

135
4.6.1.3 Fat content
The fat contents were analyzed in this study as the fat performs important and
multifarious functions in the food especially in the cheese. It plays major role in the
development of taste, texture and appearance of cheese. It contributes by filling the
interstitial spaces in the structure of proteins and minerals 320,321 with great role in the
functionality of the cheese.
The fat percentage of all types of manufactured mozzarella cheeses are given in
Table 14. The mean results ± standard deviation for fat percentages showed that
there is a significant effect of different methods of pre-acidification on the fat
contents. The fat level decreased from 6.12% to 5.34 % during ripening from 0 to
180 days in the case of Vat I cheese, from 6.24% to 5.4% in the Vat II cheese, from
5.96% to 5.17% in the vat III cheese, from 5.78% to 5.09% in the Vat IV cheese
while from 5.42% to 4.89% in the vat V cheese. These results indicate that there is a
consistent decrease in the level of fat percentage during storage. The least rate of fat
reduction was observed in the Vat II cheese i-e 0.84%, while the maximum rate of
reduction in fat content was found in the Vat V cheese i-e 0.53%.
Table 14: Fat contents (%) during storage
Fat Contents (%) during Storage (days)
Type of cheese
0 30 60 90 120 150 180
Vat I 13.84e 13.76d 13.69c 13.57c 13.51b 13.49b 13.42a
Vat II 13.90f 13.86ef 13.81e 13.73d 13.65c 13.54b 13.45a
Vat III 13.88e 13.84e 13.76d 13.64c 13.58b 13.52b 13.44a
Vat IV 13.48e 13.42d 13.39c 13.31b 13.27ab 13.25a 13.24a
Vat V 13.66e 13.59d 13.51c 13.49c 13.41b 13.37ab 13.33a
The results in Figure 37 indicated that the starter cultures showed significant effects
on the fat content of all types of mozzarella cheeses. The fat content of cheese
manufactured by indigenous isolated bacterial cultures was relatively lower ( 5.96%,
5.78% and 5.42% in Vat III, Vat IV and Vat V respectively) than commercially
cultured cheese (6.24%) while cheese manufactured by citric acid contained 6.12%
fat on day 0. The results of fat contents in this study agree with Lopez et al. 322 who

136
found that the fat content in Emmental did not increase during ripening period. The
results also agree with the findings of Guinee et al. 13 who had reported fat content
of 7.2%, 17.2% and 21.9% in low fat, 50% fat and reduced fat mozzarella cheeses
respectively. The present findings are also supported by Rudan et al. who found 9.41
fat percentage in low fat milk (containing 0.81% fat)11.
Figure 37: Fat Content in manufactured cheeses during Storage
4.6.1.4 Ash content
The ash content represents the inorganic matter in the food which is left after the
burning of organic matters 323. The results for the estimation of ash contents are
shown in Figure 38 which shows that the ash contents are not affected significantly
(P<0.05) by different treatments of pre-acidifications.
0
1
2
3
4
5
6
7
0 30 60 90 120 150 180
Storage period (days)
Mean Fat Percentage (%)
Vat I Vat II Vat III Vat IV Vat V

137
Table 15: Ash Contents (%) during Storage
Fat Contents (%) during Storage (days)
Type of cheese
0 30 60 90 120 150 180
Vat I 3.33b 3.32ab 3.31 ab 3.29 ab 3.29 ab 3.29 ab 3.27a
Vat II 3.47b 3.45 ab 3.45 ab 3.44 ab 3.43 ab 3.41a 3.41a
Vat III 3.41c 3.4c 3.39bc 3.37 abc 3.36 abc 3.34ab 3.33a
Vat IV 3.44b 3.42 ab 3.41 ab 3.41 ab 3.39 ab 3.37a 3.37a
Vat V 3.48c 3.46bc 3.45abc 3.43abc 3.42 ab 3.41 ab 3.4a
The statistical data (shown in Table 15) elucidated that the ash contents in all
Mozzarella cheeses decreased consistently during storage period of 180 days. The
percentage decreased from 3.33% (day 0) to 3.27% (day 180) of Vat I cheese that
was pre-acidified with citric acid while the decrease in Vat II cheese that was pre-
acidified with commercial starter culture was from 3.47% to 3.41%. In the cheese
(Vat III), pre-acidified with indigenously isolated lactobacillus culture, decrease in ash
percentage was just 0.08% during storage of 6 months. In Vat IV, pre-acidified with
indigenously isolated bifidobacterium culture and in Vat V cheese pre-acidified with
mixed probiotics culture the decrease was 0.07% and 0.08% of ash contents
respectively during 180 days of storage (shown in Figure 38).

138
Figure 38: Ash Content in manufactured cheeses during Storage
The ash content observed in the present investigation was found in line with the
findings of Guo et al. 8 who reported that the ripening period did not affect the
mineral content in Mozzarella cheese and remained unaffected during storage of
cheese.
4.6.1.5 Acidity Percentage
Cheese, being a fermented dairy product, produces lactic and other acids from
lactose by the action of lactic acid bacteria (LAB) already present in the cheese. So,
this step is important in the manufacturing as well as in storage or ripening of
cheese. The LAB are added during the cheese production for the acidification of
milk. This acidification influences the coagulation during manufacturing and ripening
as well as inhibits the growth of spoilage bacteria. It helps in the solubilisation of the
colloidal calcium phosphate, and also affects the activity of enzymes during ripening
period 324. The acidity of cheese also affects the texture and flavour of cheese 324,325.
3.15
3.2
3.25
3.3
3.35
3.4
3.45
3.5
0 30 60 90 120 150 180
Storage period (days)
Mean Ash content (%)
Vat I Vat II Vat III Vat IV Vat V

139
fThe mean results ± standard deviation of acidity (Table 16 and Figure 39) shows
that pre-acidification treatments have significant (P<0.05) effect on the percentage of
acidity of different cheeses manufactured in this study.
Table 16: Acidity Percentage (%) during storage
Acidity Percentage (%) during Storage (days)
Type of cheese
0 30 60 90 120 150 180
Vat I 0.99a 1.01ab 1.03 ab 1.04 ab 1.05b 1.06b 1.06b
Vat II 0.95a 0.98 ab 1.01bc 1.05cd 1.06cd 1.08d 2.0e
Vat III 0.94a 0.96 ab 0.97 ab 0.98 ab 0.99 ab 1.0b 1.01b
Vat IV 0.95a 0.97 ab 0.99 abc 1.0 abc 1.01bc 1.02bc 1.03c
Vat V 0.91a 0.93a 0.94ab 0.96abc 0.99bcd 1.01cd 1.02d
A significant increase was found from 0.99% on day 0 to 1.06 % on day 180 in the
vat I while 0.9% to 1.01% in vat II. The acidity of the cheeses manufactured by
indigenous culture showed an increase of 0.07%, 0.08% and 0.13% in the vat III, vat
IV and vat V, respectively. The results of present study are supported by the findings
of Ramzan et al. 326, who found the increase in acidity of cheese during storage.
Figure 39: Acidity Percentage in manufactured cheeses during Storage
0.8
0.85
0.9
0.95
1
1.05
1.1
0 30 60 90 120 150 180
storage period (days)
Mean Acidity (%)
Vat I Vat II Vat III Vat IV Vat V

140
Unlike the investigation of Ayesha 314 , the higher rate of change in acidity
percentage was observed in the cheeses prepared from indigenous bacterial
cultures than the commercial starter culture used in this study. This indicated that
the indigenous mixed culture that was used in vat V cheese production was
relatively more active in converting lactose into lactic acid which is the primary
function of bacterial cultures in cheese 325.
4.6.1.6 Salt content
The salting is an integral part of the cheese production as it is a source of dietary
sodium, acts as a preservative and also affects the flavour of cheese. It controls the
water activity, redox potential, maintains pH, and prevents the growth of spoilage
bacteria. It also contributes in the cheese enzymatic activities, cheese overall
composition9, microbial growth and survival and other biochemical characterizations
such as lipolysis, para‐casein hydration, glycolysis, and proteolysis during cheese
storage and ultimately have a major influence on the flavor, aroma, rheological and
textural characteristics of cheese 9,327.
Table 17: Salt contents during storage
Storage period (days)
Type of cheese
0 30 60 90 120 150 180
Vat I 1.48a 1.5ab 1.51 ab 1.52abc 1.53abc 1.55bc 1.57c
Vat II 1.59a 1.61 ab 1.63 abc 1.65bcd 1.67cd 1.68cd 1.69d
Vat III 1.53a 1.55ab 1.57abc 1.59bcd 1.61cde 1.63de 1.65e
Vat IV 1.52a 1.54ab 1.56 abc 1.58 bcd 1.61 cde 1.623de 1.64e
Vat V 1.54 a 1.56 ab 1.58 abc 1.6 bcd 1.62 cde 1.63 de 1.64e
The statistical results of salt content are shown in Table 17 and graphical
presentation in Figure 40 which show that influence of different pre-acidification
treatments exert significant effect on the salt content of different types of cheeses
during the period of cheese storage. The salt level was increased from 1.48% to 1.57
% during ripening from 0 to 180 days in the case of Vat I cheese, from 1.59% to

141
1.67% in the Vat II cheese, from 1.53% to 1.65% in the vat III cheese, from 1.52% to
1.65% in the Vat IV cheese and from 1.54% to 1.64% in the vat V cheese. These
results indicated that there is a consistent increase in the level of fat percentage
during storage.
Figure 40: Salt Content in manufactured cheeses during Storage
The salt level in commercial starter cultured Mozzarella cheese (vat II cheese)
increased by 0.1% during the ripening period while the cheeses produced by
indigenous cultures showed variation of 0.12% in the case of Vat III and vat IV and
0.1% in vat V cheese as was observed in the vat II cheese but there was increase of
0.09% in the case of vat I cheese which showed the close relation with the findings
of Rudan et al. 11 and Guo et al. 8.
4.6.1.7 pH
The pH is a critical factor in the manufacturing and ripening process of cheese 328.
The observations regarding pH of different types of cheeses are presented in Figure
45. The data is evident for the significant affect of different pre-acidification
treatments in the cheese production on the pH of cheese during storage.
1.35
1.4
1.45
1.5
1.55
1.6
1.65
1.7
1.75
0 30 60 90 120 150 180
storage period (days)
Mean Salt content (%)
Vat I Vat II Vat III Vat IV Vat V

142
Table 18: pH during Storage
Storage period (days)
Type of cheese
0 30 60 90 120 150 180
Vat I 5.12b 5.11ab 5.1 ab 5.09 ab 5.09 ab 5.08 ab 5.06a
Vat II 5.32b 5.29 ab 5.25 ab 2.23 ab 5.22 ab 5.19 ab 5.12a
Vat III 5.34b 5.32 ab 5.3 ab 5.28 ab 5.22 ab 5.19 ab 5.11a
Vat IV 5.3b 5.25 ab 5.2 ab 5.18 ab 5.14 ab 5.13 ab 5.12a
Vat V 5.36b 5.32 ab 5.28 ab 5.25 ab 5.23 ab 5.2 ab 5.18a
The pH of five different Mozzarella cheeses, depicted in figure 45 revealed that there
is significant (P<0.05) variation in vat I cheese from 5.12 % to 5.06% during the
storage period of 180 days, but the overall trend was similar in each type of cheese.
The lowest variation was observed in the vat I cheese, which was acidified with citric
acid and the highest was recorded in the vat V cheese which was acidified with
indigenous mixed culture. The vat II cheese showed variation from 5.32% to 5.12%
with an overall decrease of 0.2%, while vat III cheese showed 0.23% and vat IV
0.18% decrease during the period of 180 days.
Figure 41: pH in manufactured cheeses during Storage
4.9
4.95
5
5.05
5.1
5.15
5.2
5.25
5.3
5.35
5.4
0 30 60 90 120 150 180
storage period (days)
pH
Vat I Vat II VatIII Vat IV Vat V

143
The results revealed that the indigenous cultures were more active especially the
mixed culture of lactobacillus and bifidobacterium than the activity of commercial
starter culture and citric acid as the acidification of cheese milk requires the desired
pH during cheese production 329.
As the Lactic acid bacteria (LAB) are considered a major source of creating
favourable conditions like pH and acidity in the ripening process330 and the present
investigation proves that the fermentation process was faster by indigenous cultures
than commercial culture and citric acid used in pre-acidification. Due to biochemical
activity by these cultures and enzymatic action, there was more production of acid.
These results are also supported by Guinee et al, 257 and Sheehan et al. 313 who
reported similar variations in pH during storage of Mozzarella cheese.
4.6.1.8 Calcium content
Calcium content in cheese plays an important role in its manufacturing as well as the
functionality 331. It also helps to make a structural network structure during
coagulation of milk and creates linkages of casein micelles 332.
The mean results ± standard deviation of analysis for calcium content of different
Mozzarella cheeses are depicted in Figure 42 showed that the calcium contents
differentiate significantly due to the change in the pre-acidification treatments for the
manufacturing of cheeses.

144
Figure 42: Calcium content in manufactured cheeses during Storage
The results in Table 19 and Figure 42 elucidated that the calcium content of vat I
cheese (pre-acidified with citric acid) ranged from 826.13 mg/100g to 832.65
mg/100g between 0 to 180 days, respectively. An increase ranged from 835.12
mg/100g to 843.16 mg/100g was found in Vat II cheese that was pre-acidified with
commercial starter culture. In the cheese (Vat III), pre-acidified with indigenously
isolated lactobacillus culture, again an increase in calcium content was 13.37
mg/100g during storage of 6 months. In Vat IV, pre-acidified with indigenously
isolated bifidobacterium culture and in Vat V cheese pre-acidified with mixed
probiotics culture the increase was12.2 mg/100g and 8.24 mg/100g, respectively in
180 days of storage.
Table 19: Calcium content (mg/100g) in manufactured cheeses
Type of cheese Storage Period (Days)
0 30 60 90 120 150 180
Vat I 826.13a
828.3ab
829.32ab
830.51ab
831.63ab
832.65b
832.96b
Vat II 835.12a
837.23ab
840.13abc
842.05bc
842.64bc
842.99c
843.16c
Vat III 833.16a
837.26ab
842.56bc
844.19c
845.32c
846.01c
846.53c
Vat IV 830.16a
833.66ab
835.14ab
837.89bc
839.16bc
841.05c
842.36c
Vat V 831.86a
834.58ab
836.57ab
838.23c
839.62c
839.99c
840.1c
810
820
830
840
850
0 30 60 90 120 150 180
Storage period (days)
Mean Calcium Content (mg/100g)
Vat I Vat II Vat III Vat IV Vat V

145
The calcium content observed in the present investigation was supported by the
findings of Guo et al. 8 and Rudan et al. 11 who reported that the ripening period did
not affect the mineral content in Mozzarella cheese and remained unaffected during
storage of cheese because the amount of Ca remains in casein particles of cheese
that is the insoluble but plays a key role in cheese texture. According to Hassan 333 ,
during cheese storage period, there are significant changes in the proportions of Ca
in the insoluble and soluble phases but total amount of calcium remains
unchanged. The reason behind this fact is that 65% of calcium is associated with
the casein contents in bovine milk which are linked together by colloidal calcium
phosphate and hydrophobic bonding334 since the low and non-fat cheese have more
protein and consequently more calcium.

146
4.6.2 Rheological and functional characterization of manufactured cheeses
4.6.2.1 Melt time
By definition, the melt time is a time period required by cheese shred to melt into an
unvarying mass when heated at a particular temperature335.
The melt time of different Mozzarella cheese produced by different treatments of pre-
acidification are given in Figure 43 which showed that during storage period, the
different pre-acidification affected (P<0.05) significantly the melt time of different
Mozzarella cheese.
Figure 43: Melt time in manufactured cheeses during Storage
The Figure 43 and mean results ± standard deviation (shown in Table 20) show that
melt time of cheese decreased significantly from 136.25 seconds (sec) to 48.12 sec
after storage for 6 months for vat I cheese. The melt time decreased from 179.56 sec
to 97.86 sec during ripening from 0 to 180 days in the case of Vat II cheese, from
815
820
825
830
835
840
845
850
0 30 60 90 120 150 180
storage period (days)
Melt Time (sec)
Vat I Vat II Vat III Vat IV Vat V

147
182.89 sec to 129.25 sec in the Vat III cheese, from 185.71 sec to 118.63 sec in the
Vat IV cheese while from 194.56 sec to 136.48 sec in the vat V cheese. These
results indicated that there is a consistent decrease in the level of fat percentage
during storage period of 180 days.
Table 20: Melt Time during storage
Melt Time (sec)
Type of cheese Storage Period (Days)
0 30 60 90 120 150 180
Vat I 136.25g 125.41f 105.87e 98.23d 78.25c 61.29b 48.12a
Vat II 179.56g 169.42f 157.85e 142.67d 134.24c 115.97b 97.86a
Vat III 182.89f 179.32ef 176.23e 168.25d 156.89c 139.58b 129.25a
Vat IV 185.71f 180.02e 179.48e 159.24d 149.57c 134.83b 118.63a
Vat V 194.56e 181.45d 178.54d 163.2c 157.42b 141.63a 136.48a
These results are in line with the earlier studies of Guniee et al. 13and Kindstedt 8
who reported that the melt time is highest at start of storage period but with
maturation of cheese this time decreases. The researchers have revealed that the
protein matrix plays the main role in melting properties of cheese 336. During aging,
the amount of soluble calcium increases which provides more plasticization to the
cheese thereby increasing the functional properties such as melting 13.
Dave et al 337 has also reported the effect of bacterial culture on melt time of
cheese. They used single Streptococcus thermophilus culture as well as mix culture
of Streptococcus thermophilus and Lactobacillus helveticus and observed that the
melting time was more for cheeses which were made by mixed cultures which
agrees with the findings of present study that mixed culture takes more melt time as
compared with others.
4.6.2.2 Flowability
Flowability can be defined as an increase in diameter of the disc of cheese on
heating at a specific temperature for a defined time or simply flowability is an ability
of melted cheese to flow. The major factors for flowability of cheese are the casein
hydration, fat liquefaction, and high degree of fat coalescence 311.

148
The statistical results for flowability are presented in Figure 44 which reveals that
the different pre-acidification treatments with citric acid and bacterial cultures have
affected (P<0.05) significantly the flowability of different Mozzarella cheeses.
Table 21: Flowability during storage
Type of cheese Storage Period (Days)
0 30 60 90 120 150 180
Vat I 10.01a 19.35b 27.23c 36.01d 40.36d 50.37e 60.48f
Vat II 12.06a 23.69a 38.65b 42.03b 49.2c 53.79cd 59.02d
Vat III 13.01a 21.58b 37.02c 41.05c 57.06d 61.52d 74.21de
Vat IV 11.96a 21.04b 35.74c 46.02d 52.75e 63.54f 78.12g
Vat V 12.03a 25.03b 38.04c 49.12d 54.32d 67.14e 76.23f
The statistical analysis of flowability, shown in Table 21, reveal that there is
significant increase (P<0.1) from 10.01 to 60.48% during ripening days from 0 to
180 days for the vat I cheese that was pre-acidified with citric acid while the increase
in Vat II cheese that was pre-acidified with commercial starter culture was from
12.06% to 59.02%. In the cheese (Vat III), pre-acidified with indigenously isolated
lactobacillus culture, increase in flowability was 61.2% during storage for 6 months.
In Vat IV, pre-acidified with indigenously isolated bifidobacterium culture and in Vat V
cheese pre-acidified with mixed probiotics culture the increase was 56.16% and
64.20% in flow respectively during 180 days of storage.

149
Figure 44: Flowability in manufactured cheeses during Storage
The flowability percentage observed in the present investigation was found in
agreement with the findings of Guinee et al. 13 and Sheehan et al.313 who reported an
increase in the flowability of cheese with progression of ripening period. It has been
previously proved by Kindsted338 and Ayesha314 that cheeses manufactured from
buffalo milk have significantly higher flowability percentage which may be due to the
presence of low moisture content of the cheese; these cheeses have higher
flowability. Ayesha314 found the low flowability in case of indigenous bacterial
cultured cheese than commercial cultured cheese which is not supported by the
present investigations where the significantly higher flowability was found in the
indigenous mixed cultured cheese (vat V) i-e 64.2% as compared to 46.96% of
commercial starter cultured cheese (vat II). Even the cheeses manufactured by
indigenous lactobacillus and bifidobacterium cultures showed higher flowabity than
cheese produced by commercial starter culture (vat II cheese).
815
820
825
830
835
840
845
850
0 30 60 90 120 150 180
storage period (days)
Flowability
Vat I Vat II Vat III Vat IV Vat V

150
4.6.2.3 Firmness
The firmness is considered as an important rheological property of cheese which
plays key role in manufacturing, packaging, distribution, retail, and consumption of
cheese. It is a physical parameter which is used for categorization of the cheese into
fresh, soft, semi-soft, hard, semi- hard and very hard cheese 311.
The graphical results regarding firmness of different Mozzarella cheeses are
presented in Figure 45 that indicates firmness of cheeses manufactured was
significantly affected by different pre-acidification treatments during storage period of
6 months.
Figure 45: Firmness in manufactured cheeses during Storage
The firmness decreased significantly (P<0.1) from 402.68N to 154.36N during
ripening days (shown in Table 22), from 0 to 180 days for the vat I cheese that was
pre-acidified with citric acid while it decreased in Vat II cheese that was pre-acidified
with commercial starter culture from 405.31N to 204.36N. In the cheese (Vat III),
pre-acidified with indigenously isolated lactobacillus culture, decrease in firmness
0
50
100
150
200
250
300
350
400
450
500
0 30 60 90 120 150 180
storage period (Days)
Firmness
Vat I Vat II Vat III Vat IV Vat V

151
was from 395.45N to 168.20N during storage of 6 months. In Vat IV, pre-acidified
with indigenously isolated bifidobacterium culture and in Vat V cheese pre-acidified
with mixed probiotics culture the decrease was from 440.36N to 327.14N and from
444.51N to 159.12N in firmness respectively during 180 days of storage. The results
for firmness are supported by the results of previous research on Mozzarella cheese
by Yun et al. 339, Guo et al. 8 and Guinee et al.319. The results also illustrated that the
firmness was decreased by increasing storage days in all types of manufactured
cheeses and also agreed with the fact that the low fat content of cheese cause the
higher firmness11.
Table 22: Firmness during storage
Type of cheese Storage Period (Days)
0 30 60 90 120 150 180
Vat I 402.68f 306.12e 206.85d 200.23c 199.63c 178.23b 154.36a
Vat II 405.31f 395.12e 298.32d 249.23c 222.12b 216.2b 204.36a
Vat III 395.45a 364.01 a 358.96 a 342.78 a 325.96 a 319.25 a 312.96 a
Vat IV 440.36f 423.56e 396.54d 369.14d 347.12b 332.01a 327.14a
Vat V 444.51d 443.01d 442.84d 425.12c 402.56c 396.45b 389.45a
These results contradicted the findings of Ayesha314 who observed that the cheese
prepared from indigenous bacterial cultured possessed less firmness than cheese
manufactured by commercial starter culture. The present investigation revealed that
indigenous Lactobacillus cultured cheese (vat III) and mixed cultured cheese (vat V)
from the day 0 to day 180 showed low firmness as compared to cheese produced
from commercial starter culture and cheese pre-acidified with citric acid. The study
also highlighted, the fact, that the indigenous bifidobacterium did not result in the low
firmness in the cheese during storage.
4.6.3 Microbiological analysis of manufactured cheeses
The results of probiotic bacterial count at 22°C, probiotic bacterial count at 45°C and
total plate count are shown graphically in Figure 46, Figure 47 and Figure 48,
respectively, during the storage of 180 days for all types of cheeses. The analysis of
these bacteria revealed that there is a consistent increase in the count during
storage while drastic reduction was found in the vat I cheese manufactured by citric

152
acid pre-acidification (Table 23). The microbiological analysis for coagulase positive
staphylococcus aureus, of total coliforms, faecal coliforms, E.coli, Salmonella
species, Pseudomonas spp, yeast and mould count were found satisfactory as no
pathogen was observed throughout the storage period of 180 days in any type of
cheese.

153
Table 23: Microbiological count during storage
Storage Period (Days)
Type of cheese 0 30 60 90 120 150 180
Probiotic count at 45°C
Vat I 7.64±1.2 7.15±0.91 7.76±0.52 7.89±0.97 7.45± 6.13±1.02 5.98±0.99
Vat II 6.84±0.9 6.91±.01 7.13±0.32 7.24±0.98 7.68± 7.87±1.03 7.94±0.93
Vat III 8.36±1.22 8.79±1.01 8.91±0.51 9.02±1.23 9.21± 9.48±1.07 9.57±0.91
Vat IV 8.12±1.6 8.23±1.63 8.46±0.57 8.56±0.28 8.61± 8.72±0.99 8.87±0.89
Vat V 9.12±0.9 9.21±0.48 9.45±0.25 9.62±0.96 9.74± 9.83±0.84 9.91±0.73
Probiotic Count at 22°C
Vat I 6.89±1.45 7.12±0.23 7.24±0.19 7.38±0.18 7.46± 7.31±1.01 7.23±0.89
Vat II 7.12±1.2 7.26±0.61 7.34±0.46 7.43±0.96 7.58± 7.63±0.89 7.77±0.36
Vat III 7.31±1.1 7.42±0.48 7.56±0.78 7.67±0.78 7.79± 7.91±0.78 8.12±0.71
Vat IV 7.89±1.9 7.98±0.36 8.05±0.96 8.69±0.23 9.36± 9.68±1.03 9.98±1.01
Vat V 8.23±1.05 8.68±0.29 9.36±1.03 9.45±1.08 9.78± 9.89±1.01 9.93±1.09
Total plate count/g at 35°C
Vat I 10.36±0.68 10.56±0.25 10.94±1.04 10.99±1.06 9.36± 9.12±1.00 8.98±0.99
Vat II 9.98±1.2 10.23±0.81 10.56±1.01 10.63±1.02 10.96± 10.12±0.99 9.98±0.91
Vat III 12.03±0.63 12.41±0.23 12.63±1.08 12.89±0.47 12.99± 13.21±0.91 13.29±1.09
Vat IV 12.56±0.72 12.64±0.74 12.72±0.38 12.89±0.63 12.97± 13.69±0.38 13.76±1.25
Vat V 13.6±0.63 13.24±0.14 13.53±1.67 13.68±0.13 13.79± 14.03±0.46 14.09±1.06

154
Figure 46: Probiotic bacterial count at 22°C during storage
Figure 47: Probiotic bacterial count at 45°C during storage
0
2
4
6
8
10
12
0 30 60 90 120 150 180
storage period (days)
Probiotic count at 22°C
Vat I Vat II Vat III Vat IV Vat V
0
2
4
6
8
10
12
0 30 60 90 120 150 180
storage period (days)
Probiotic count at 45°C
Vat I
Vat II
Vat III
Vat IV
Vat V

155
Figure 48: Total Plate count during storage
The results of microbiological analysis are supported by the findings of Capellas et
al. who did not find Escherichia coli in the cheese manufactured from pasteurized
milk during storage340. The reason behind the satisfactory results for the analysis of
pathogens especially sanitary indicators in the cheese during storage is the good
quality of raw milk selected for the manufacturing of cheese, well equipped
laboratories, maintained dairy plants for the storage, and pre-treatment of raw milk,
heat processing of milk which was later used in the cheese processing. The results
of microbiological analysis was found in complete agreement with Okolie et al. who
found the cheese samples free form coliforms, yeast and mould and stated that
cheese samples are safe for human consumption341.
0
2
4
6
8
10
12
14
16
0 30 60 90 120 150 180
Axi
s Ti
tle
stoarge period (days)
Total aerobic count/g
Vat I
Vat II
Vat III
Vat IV
Vat V

156
4.6.4 Sensory evaluation of manufactured cheeses
The sensory characterization is an integral part of cheese quality evaluation. It has
been found that the probiotic bacteria could affect the appearance, flavor, and
texture of dairy products especially cheese 342. Thus, sensory properties of the
cheeses were evaluated in this study using a consumer panel. Table 24 shows the
statistical analysis for appearance, flavor, texture and overall acceptance for all types
of manufactured cheeses during the storage of 180 days. The data revealed that
there is significant difference (p<0.05) in manufactured cheeses. In the vat I cheese,
the overall appearance was improved significantly by day 90 and ranged from mean
score of 2.23 to 3.70 but the drastic decline was observed on day 120 (score 3.0)
and significant decline was observed until day 180 of storage ( score 2.03). A similar
pattern was observed in the vat II cheese, improvement was at peak till the day 120
but on day 150 the decline started with the appearance of cheese and maintained
this score on day 180. But in the case of cheese produced by using the indigenous
probiotic cultures (Vat III, vat IV and Vat V) similar pattern was observed and the
appearance improved with the passage of time during storage and highest score
was recorded on day 180 i-e 4.81, 4.86 and 4.92 for vat III, vat IV and vat V,
respectively. The highest score (4.92) was observed on day 180 in vat V cheese
which was acidified with mixed indigenous culture.
Among sensory attributes of cheese, the flavor is considered to be the most
important factor which consequently determines the response of consumers. In
flavor assessment, a significant improvement pattern was observed consistently
except vat II cheese in which flavor declined. Significant improvement was found in
all types of cheeses produced by indigenously isolated probiotic cultures which
ranged from score of 2.96 on day 0 to 4.59 on day 180 in the vat III cheese, ranging
from 2.88 to 4.50 in vat IV and ranging from 2.87 to 4.99 in vat V cheese. The main
reasons behind this improvement in flovor can be the metabolic processes343 and
the production of enzymes by probiotic bacteria during the storage period342.
Some investigators, including Dinakar and Mistry, revealed that probiotic bacteria do
not indicate significant changes in the textural characteristics 344 and similar findings
was investigated by Jurkiewicz 345. But a significant improvement was observed in

157
the texture of cheeses produced by indigenous cultures while the decline was found
in the score of texture in vat I cheese on day 180, which was manufactured by citric
acid. The vat II cheese manufactured by commercial starter culture also improved
the texture throughout the storage period of 6 months. the vat IV and vat V cheeses
showed same score of texture on day 180 i-e 4.99. The data show that there is rapid
improvement in the texture of vat V cheese manufactured by mixed indigenous
culture which had least score of 2.87 on day 0 while the maximum score was
recorded on day 180 that was 4.99. The improvement in the texture was due to the
biochemical reactions during storage. These reactions occurred due to the microbial
activities which breakdown the fat and protein molecules and ultimately produce
more flavouring compounds, while casein hydrolysis gives smooth texture to the
cheese346. It can be concluded from this fact that the mixed probiotic culture in vat V
cheese produces more smooth texture than the other types of cheeses may be
because of synergic biochemical reactions of lactobacillus and bifidobacterium
during storage.
While evaluating the overall acceptability of cheeses, the highest score (5.0) was
observed in the vat IV and vat V cheeses made by indigenous bifidobacterium and
mixed cultures acidification. But the decline was observed in the vat I cheese on day
180 with score of 3.10 from the 3.25 observed on day 130. The lowest score was
2.50 on day 0 in the case of vat I cheese and this lowest score was maintained on
day 180 as compared to other types of cheeses.
No adverse sensory and compositional changes were observed in the present study
by the addition of probiotic cultures in cheese during production, which finding is in
line with the investigations of Gardiner et al.347 and Stanton et al. 348. In fact, the
data of this study revealed that mixed indigenous cultured cheese gave more
acceptable sensory characteristics.

158
Table 24: Sensory evaluation of cheeses
Parameters Cheese type Storage Period (days)
0 30 60 90 120 150 180
Appearance Vat I 2.23ab
2.93bcd
3.5cd
3.7d
3bcd
2.8abc
2.03a
Vat II 2.23a
2.93ab
4.0ab
4.0ab
4.4b
3.0a
3.0a
Vat III 3.0a
3.5ab
3.95bc
4.20bcd
4.59cd
4.73d
4.81d
Vat IV 2.93a
3.2ab
3.5b
4.0c
4.51d
4.64de
4.86e
Vat V 3.07a
3.53b
3.63b
3.81b
4.30c
4.70d
4.92d
Flavor Vat I 2.06a
2.35a
2.82b
3.25bc
3.29c
3.44c
3.48c
Vat II 3.00a
3.31b
3.43ab
3.90b
3.98c
4.2c
4.0c
Vat III 2.96a
3.13a
3.52 ab
3.99bc
4.19cd
4.49cd
4.59d
Vat IV 2.88a
3.56b
3.72b
4.01bc
4.25cd
4.38cd
4.50d
Vat V 2.87a
3.19a
3.24a
3.64b
4.06c
4.56d
4.99e
Texture Vat I 2.90ab
3.31bc
3.64d
3.22bc
3.2.61a
2.53a
2.47a
Vat II 2.96a
3.12 ab
3.49b
3.49b
4.19c
4.33c
4.48d
Vat III 3.35a
3.55a
4.20b
4.64c
4.79cd
4.87cd
4.98d
Vat IV 3.04a
3.23a
3.56a
4.22b
4.29b
4.64bc
4.99d
Vat V 2.87a
3.49ab
3.78bc
3.90bc
4.32cd
4.65e
4.99e
Overall acceptability Vat I 2.50a
2.98b
3.33bc
3.50d
3.07b
3.25bc
3.10b
Vat II 2.99a
3.06a
3.45ab
3.53ab
3.89bc
4.20c
4.25c
Vat III 3.50a
3.67a
4.08b
4.43bc
4.53c
4.74c
4.78c
Vat IV 3.63a
3.91ab
4.03b
4.57c
4.67c
4.84cd
5.0d
Vat V 3.5a
4.1b
4.5c
4.7cd
4.91d
4.99d
5.0d

159
4.6.5 Survival evaluation of induced bacterial cultures
The Initial count of total probiotic bacteria in the vat II cheese was 8.6× 10⁸ cfu/g,
9.1× 10⁸ cfu/g in vat III cheese, 6.3× 10⁹ cfu/g in vat IV cheese and 9.9× 10⁹ cfu/g in
vat V cheese. The vat I cheese was not tested for the survival evaluation as it was
acidified by citric acid instead of bacterial cultures. The significant mean loss in
bacterial count in stimulating Gastric (SGJ-A and SGJ-B) and Stimulated Intestinal
juice (SIJ) are summarized in Table 25.
Table 25: Loss in Probiotic bacterial count in manufactured cheeses
Juice Loss during incubation (Mean log10 cfu/g)
Vat II cheese
Vat III cheese
Vat IV cheese
Vat V cheese
SGJ-A 4.98c 3.19b 3.31b 1.2a
SGJ-B 2.43c 1.97bc 1.85b 0.95a
SIJ 0 0 0 0
4.6.5.1 Survival evaluation In Stimulated Gastric Juice
The significant mean loss in bacterial count in Stimulating Gastric Juice (SGJ-A and
SGJ-B) is given in Table 25. When the vat II cheese was incubated for 60 min in
HCl-based SGJ-A, which contained 0.1M HCl with cheese:SGJ ratio of 1:6 (pH
0.65), the decrease found in number of probiotic bacteria by 4.98 log10 cfu/g while
the loss in bacterial count was 3.19 log10 cfu/g in the vat III cheese. The reduction in
the number of bacteria was 3.31 log10 cfu/g in the vat IV cheese but the minimum
loss in number was found in vat V cheese that was recorded 1.20 log10 cfu/g. These
results were in complete agreement with the findings of Hansen et al. 294 and
Krasaekoopt et al.147 that if no protection is provided by the encapsulation, there is
no survival of cells because of harsh condition in the stomach. It was observed that
the bacterial culture die-off in the outer regions as they are directly exposed to the
acid as compared to the inner regions which remained protected. Similar results

160
were observed when 3.0-log10 cfu/g of reduction was observed while no bacteria
survived in free form 349.
When survival was observed in the SGJ-B, by increasing the pH of SGJ-A from 1.4
to 2.0, there was a greater survival of bacterial cells than the SGJ-A in all cases. The
loss was 2.43 log10 cfu/g in the vat II cheese as compared to 4.98 log10 cfu/g in the
SGJ-A. In the vat III cheese, the loss in bacterial cells was 1.97 log10 cfu/g, and 1.85
log10 cfu/g in the vat IV cheese. Again the least loss in bacterial cells was found in
the vat V cheese which was acidified with mixed indigenous culture. This survival
was also supported by Gardiner et al. 139 who found no loss in the number of
probiotic bacteria when incubated for 2 h in porcine gastric juice with an initial pH of
2.0 and final pH of 4.74. It is important in the survival evaluation studies that SGJ
must match the natural stomach pH350 for the proper functioning of probiotics in the
consumer gut296.
4.6.5.2 Survival evaluation In Stimulated Intestinal Juice
The survival of bacterial cultures was also evaluated in the stimulated intestinal juice
by neutralizing the SGJ-1 and cheese mixture with bile and pancreatin were added.
The results are shown in Table 25. The resuscitation of injured bacterial cells was
observed as an increase was found in all types of cheeses, which matches the
findings of Ortakci et al.349.
4.7 Extraction of IgG from colostrum for supplement
The colostral whey was obtained by reacting the skim milk with 1.0N HCl. The
extracted IgGs from the colostral whey were analyzed using SDS-PAGE and results
are shown in Figure 49. The data from SDS-PAGE profile indicated the bovine
colostral whey and the aqueous phases were produced in reverse micelles at pH
6.0, pH 7.5, pH 9.0 and pH 10.

161
Figure 49: SDS-PAGE profile of the colostral whey; Lane 1, bovine colostral whey; lane 2, aqueous phase obtained at pH 6.0 extraction; lanes 3 and 4, aqueous phase obtained at pH 7.5 extraction; lanes 5 and 6, aqueous phase obtained at pH 9.0 extraction; Lanes 7 and Lane 8, aqueous phase obtained at pH 10.0 extraction.
To determine the antigen-antibody activity of IgGs, a stable antigen-antibody
complex was formed using double gel diffusion assay, which was based on the
principle that both antigen and antibody move through an inert medium and form a
precipitin line. This line gives the positive results for immunoprecipitin. The aqueous
phase which contained the IgG of the colostral whey was tested, and precipitin lines
were observed as shown in Figure 50. This result indicated that the IgG which was
extracted and purified by reversed micellar extraction was able to form a complex
with anti-serum, thus the extracted IgG possessed immunological activity and can be
used in further processing.

162
Figure 50: Double Gel diffusion assay for Immunoglobulin G
The Figure 50 shows the anti-bovine IgG serum in the central well and
aqueous phase extracted (pH 6.3) in the peripheral wells (a) Aqueous phase without
any dilution and (b) aqueous phase in 2-fold dilution

163
4.8 Whey processing and analysis
The collected greenish-yellow coloured liquid whey, from the cheese vats after
coagulation and curd formation, was stored in a storage tank in the spray drying
section of dairy plant at the temperature of 6°C to avoid bacterial growth.
Furthermore, the so called cheese dust is removed by clarification and excess of fat
by centrifugation and pasteurized at 72°C for 26 seconds as recommended by
Rynne et al. 351 to gain highest level of undenatured whey proteins. After
concentration and crystallization the whey is subjected to the spray drying in the
Integrated Filter Dryer of GEA Niro, Denmark and powdered whey was collected
from the outlet and analyzed for compositional, moisture, and microbiological
analysis.
Figure 51: Whey Processing steps
Liquid Whey separation after coagulation and curd
formation
whey separation from cheese dust
Non-hydroscopic whey powder

164
Figure 52: Collection of whey fluid
4.8.1 Compositional analysis of whey Powder
The average results of compositional analysis of whey powder are given in Table 26.
The results showed that the drying of liquid whey reduced the moisture content to
2.2 ±0.14% from 94% with pH 6.9±0.58, protein 13.8±1.09 %, Lactose 47.1±1.10 %,
fat 0.10±0.9 %, and ash 8.2±1.51 %.
Table 26: Compositional analysis of whey powder
Constituent Percentage (%)
Moisture 2.2±0.14 Protein 13.8±1.09 Lactose 74.1±1.10 Fat 0.10±0.9 Ash 8.2±1.51 pH 6.9±0.58
The previous investigations have recommended the use of Spray-freeze-drying
(SFD) technique for the preparation of dry powders for various applications 352, the
same was employed in the present study to convert the liquid sweet whey into whey
powder as it gives the free flowing and light particles 353 with minimum denaturation
of proteins 354. The lower moisture content proves the SFD efficiency and reduces
upto 3.3% which fall under the values of CODEX standards for whey powders 355.

165
The high percentage of protein (13.8%) and lactose (47.1%) was found in this sweet
whey extracted from probiotic cheese as compared to the protein and lactose
percentages studied previously 356. The reason for the high percentage of protein
and lactose may be due to the probiotic cultures used in the formation of cheese or
the effect of spray-freeze drying (SFD) technique. The high survival rate of probiotic
bacteria as well as constituents stability is recorded during the spray-freeze drying
(SFD) 357. As during the pre-treatment, the raw milk was defatted and standardized
to 0.10 percent fat so the spray-freeze drying did not show any drastic effects on the
fat composition in this case of whey processing. The ash and all other contents
found in the sweet whey podwer correlate with the FDA and Codex standards for
powder formulation 358.
4.8.2 Whey Protein Nitrogen Index (WPNI)
The undenaturated Whey Protein Nitrogen Index (WPNI) is determined to assess
whether the heat treatment applied, to the milk or other liquid products processing,
like whey to convert them into powder, is appropriate or not. According to the
classifications, there must be WPN < 1.5 High heat powder, > 1.5 - < 6.0 for Medium
heat powder and > 6.0 for Low heat powder 359. In the present study, the value of
WPN was found 6.2 mg /g of non-fat whey powder with the moisture content of 2.2
% after filtration of casein precipitates using NaCl, in order to make the filtrate
containing only undenaturated whey proteins. Therefore, the WPN value suggest
that low heat whey powder is processed in the spray-freeze drying.
4.8.3 Spore forming bacterial count
All the aerobic plate count agar plates were found with no colony. It means that the
use of good quality milk for cheese-whey processing yielded no spore forming
bacteria; same as observed in the previous study of processed milk 360.
4.8.4 SEM Images
To verify the internal microstructure of dried whey powder SEM imaging was
performed. The main purpose was to evaluate any collapse in structure during this
process as the external surface of the powder particles has great influence on
solubility, stickiness and flowability 361. A few researches have been conducted on

166
the correlation of microstructure and spray-freeze-dried whey particles; Al-Hakim and
Stapley studied SEM images of spray-freeze-dried whey proteins 354 while some
specific components of milk powder have been studied by Hindmarsh et al.362 and
Rogers et al. 363.
Figure 53: SEM images of spray-freeze-dried whey powder
The SEM images of spray-freeze-dried whey powder is shown in Figure 53. An
agglomeration of a large particle with a number of small particles is observed in (a)
and (d). All the images of (a), (b), (c) and (d) show smooth surfaces with small pores.
These small pores can be expected from spray -freeze drying during formation of
ice-crystals and later on sublimes and yield pores in the structure like the results
30µm 50µm
50µm 50µm

167
observed in previous studies during freeze drying. Similar results were found by
Hindmarsh et al. 362 and Rogers et al. 363.
4.9 Formation and characterization of Probiotic-whey based supplement
4.9.1 Nutritional, microbiological and sensory characteristics
All the three types of supplements were analyzed for their Probiotic count, nutritional,
microbiological and sensory characterization. The results of anti-diarrheal
supplement are given in Table 27 and evaluated against the USDEC standards for
whey products 178. It is found that all the constituents fall under the standards/
guidelines of USDEC.

168
Table 27: Nutritional, microbiological and sensory characterization of Probiotic-whey based supplement
Parameters Lb formula Bd formula Mixed formula USDEC standard
Nutritional evaluation Protein % 68.2±0.2 68.5±1.2 67.9±1.02 11.0%–14.5% Lactose % 21.1 ±1.04 21.1±1.5 21.1±1.45 63.0%–75.0% Fat% 0.10±0.9 0.10±0.81 0.10±0.12 1.0%–1.5% Ash % 8.2±1.02 8.2±1.2 8.2±1.8 8.2%–8.8% Moisture% 2.1±0.9 2.2±0.23 2.5±1.03 3.5%–5.0% Titratable Acidity % 0.12±0.5 0.14±0.12 0.12±0.11 0.10%–0.15% IgG (from bovine colotrum)% 0.05±0.25 0.05±0.11 0.05±0.9 -- Probiotic count Lactobacillus spp. >10
12 >10
12 >10
12 --
Bifidobacterium spp. >1012
>1012
>1012
-- Microbiological evaluation Aerobic Plate count (CFU/g) <10 <10 <10 <30,000/g Total coliforms (MPN/g) ND ND ND <10/g Faecal coliforms (MPN/g) ND ND ND - E.coli (MPN/g) ND ND ND Negative/ g Salmonella spp. (/25g) ND ND ND Negative/ 100g Listeria spp./g ND ND ND Negative Staph.aureus (coagulase-positive)/g ND ND ND Negative Sensory evaluation Colour Off-white Off-white Off-white Off-white to cream Flavor Normal Normal Normal Normal whey flavor
*ND= Not Detected
169
No significantly different results for nutritional evaluation were observed in the
formulas, the main reason was the standardization of whey components before the
utilization in the supplement in order to highlight the probiotic potential against acute
diarrhea in the infants. The probiotic count was also kept constant for the uniform
evaluation and efficacy studies of lactobacillus and bifidobacterium and their mixture
formula at >1012 CFU using McFarland standards 364.
4.9.2 Feed trials
The total of ninety six infants was studied with 1:1 sex ratio; divided into two
categories on the basis of age (≤ 6 months and > 6 month to 12 months). Each
category contained 48 infants (24 of each sex). Furthermore, each category was
randomly divided into equal numbers based on the type of formula intake. At the time
of enrollment, no significant difference was found in respect of age, weight, height,
and family history of allergy or gastrointestinal disease in the respective category of
patients. The features and findings of the 96 patients at the time of enrollment and
during the follow-up is given in Table 28. .

170
Table 28: Features of the 96 patients at enrollment and during the follow-up
≤ 6 months of age > 6 month to 12 months of age
Lb formula Bd formula M formula Control Lb formula Bd formula M formula Control Number of infants 14 12 11 11 8 12 14 14 Age (months) 3.1±2.2 3.9±2.1 3.3±2.5 3.5±2.4 6.4±2.1 5.1±2.2 7.1±2.2 8.4±2.2 Weight (Kg) 4.9±2.0 5.7±1.9 5.1±2.1 6.2±0.8 7.9±2.8 7.2±1.2 8.7±0.4 9.4±1.0 Height (cm) 59.2±2.9 64.1±2.0 59.7±3.7 61.9±5.4 7.1±2.9 6.9±3.9 8.4±2.1 8.9±2.0 Breastfeeding Y Y Y Y N N N N Solid food N N N N Y Y Y Y Intake days 21±3 18±2 8±1 32±4 16±2 21±4 11±3 37±6 Follow up days 32 32 32 32 32 32 32 32 Mean no. of stool per day 5.1±2.2
b 4.6±1.5
b 3.6±1.6
a 6.1±1.5
c 4.6±1.9
ab 5.9±0.9
b 3.4±1.4
a 7.3±1.2
b
Mean vomiting episodes per infant
2.5±2.0b 2.0±0.9
b 0.5±1.3
a 3.5±0.6
c 3.5±0.8
b 2.4±1.2
b 0.9±0.3
a 2.1±0.5
b
Mean loss in weight per infant
1.8±1.2c 1.1±0.9
b 0.3±0.4
a 2.2±0.1
c 0.7±0.6
a 1.1±0.3
a 0.5±1.1
c 1.9±0.4
b
Recovering from diarrhea (total mean days)
16±2.7bc
11±1.9b 04±1.2
a 21±4
c 12±3.3
ab 16±1.8
b 08±2.2
a 28±1.3
c
Lb formula= Lactobacillus formula, Bd formula=Bifidobacterium formula, M formula= Mixed formula containing 1:1 Lactobacillus and Bifidobacterium, Control= no probiotic formula given to infants of this group, Y= breastfeeding infants, N= Infants not on breastfeeding.

172
In the present clinical trials, the admitted patients of under 6 months of age category
were receiving the breastfeeding at the time of enrollment and not the solid food, but
later during the period of feeding trials, mothers were not allowed to feed their
children till the normality in number and consistency of patient's stool. The
significant data was observed and found that the after 16±2.7 days of Lb formula
majority of patients were normalized with mean number of stool of 5.1±2.2 per day,
mean vomiting episodes of 2.5±2.0 per infant and Mean loss in weight of 1.8±1.2
per infant while it took 11±1.9 days in normalization of stool number and
consistency in the case of Bd fromula with 4.6±1.5, 2.0±0.9, and 1.1±0.9 mean no. of
stool per day, mean vomiting episodes per infant and mean loss in weight per infant,
respectively. Minimum number of days were calculated for the recovery of patients to
their normal life in the M formula (04±1.2) which contained the mixture of both
lactobacillus as well as bifidobacterium in ratio of 1:1, while the controlled group of
patients recovered in 21±4 days, which have significantly different response than the
formula groups and the latest response of patients against diarrhea in this study in
respect to category of under 6 months of age. The findings of first category, in the
case of bifidobacterium, agrees with the previous study on the efficacy of
bifidobacterium based acidified supplement by Chouraqui et al. which had provided
more protective effects against acute enteritis 365.
The second category of patients age between 6 months to 12 months showed a
significantly late recovery response in the control group (28±1.3 days) while Mixed
formula again proved to be the best formula for the infants of this age group also in
only 08±2.2 recovery days in major cases with significant value of 3.4±1.4 mean
number of stools per day, 0.9±0.3 mean vomiting episodes per infant, and 0.5±1.1
mean loss in weight per infant. The lactobacillus -whey based (Lb) formula took
12±3.3 days for normalization of stool number and consistency while bifidobacterium
-whey based (Bd) formula took 16±1.8 days in normalization of patients.
At the time of enrollment, only the patients on solid food were selected with no
breastfeeding at all to test the prepared supplement in the proper way. There was no
difference in the monitoring time and volume of formula intake by each patient. The
potential mechanism by which these probiotic bacteria might exert a protective effect
against the acute gastroenteritis are numerous 366. A large variety of probiotic
bacteria survive through the gastrointestinal tract and proliferate in the intestine of

173
healthy adult as well as in the children 367. The use of a probiotic-whey based
formula with low casein and phosphate, but high lactose and protein contents and
synergic effect of living lactobacillus and bifidobacterium, known as probiotic
bacteria, have a significant protective impact on infantile acute gastroenteritis. The
probiotic-whey based formula is economically beneficial, as it is inexpensive as well
as reduces the severity of diarrhea. There is a possibility that the preventive effects
of the formula studied are because of high nutritional composition of whey or may be
the influence of coating of bacterial strains with prebiotics, under the process of
microencapsulation, as various studies highlight synergistic effects of prebiotic and
probiotics in the human intestine especially in infants 368. Another reason behind the
potential finding of the supplement may be the effects of bovine-colostrum
immunoglobulin G. The mammary glands of mother are responsible for transfer of
immunoglobulin (IgG) to young through a highly selective mechanism. These IgG are
transported and absorbed across the wall of the small intestine of infant, ultimately
reaching into the bloodstream to perform vitally important immunological protection
and defence against infections in infants 369. For this reason, an additional dose of
IgG is provided in the formulas that have been extracted from colostrum milk. As the
Bovine colostrum is generally used as a raw material for immune milk preparations
because of their immunological properties to treat or prevent infections of the
gastrointestinal tract 370.

174
4.10 Life cycle assessment of cheese and whey processing
The results of life cycle assessment of cheese and whey processing were found in-
line with other LCA studies for the assessment of different milk products including
cheese 24,25,31,32. All these activities endorsed the results of life cycle assessment.
The main focus of this study was on five impact categories; Global Warming
Potential (GWP), eutrophication, acidification, ecotoxicity (water chronic and acute,
ecotoxicity soil chronic), and human toxicity (air, water, and soil). The impact
categories used in this study and their units are given in Table 29, following the EDIP
method for LCA food.
Table 29: Impact Categories and their units
Impact Category Unit
Global Warming (GW 100) g CO2
Acidification g SO2
Eutrophication g NO3
Ecotoxicity water chronic m3/g
Ecotoxicity water acute m3/g
Ecotoxicity soil chronic m3/g
Human Toxicity air m3/g
Human Toxicity water m3/g
Human Toxicity soil m3/g
In the general practice in Pakistan, the cheese whey is drained off in other water
bodies which have a more significant impact on the environmental health. The Figure
54 shows the drainage system for dairy industry effluent containing whey liquid on
Multan Road, Lahore.

175
Figure 54: Drainage system for dairy industry
The impact category of Global Warming Potential (GWP) is mainly associated with
electricity, heat and fuel consumption, which showed 965g, 791 g, 1013g and 1487g
(NO3 equivalent) for existing scenario, S1, S2 and S3 respectively. The Life Cycle
Assessment (in percentages) for each impact category in the existing scenario, S1,
S2 and S3 are shown in Table 30, 31, 32 and 33, respectively.

176
Table 30: Life Cycle Impact Assessment for the existing Scenario
Impact category Global warming (GWP 100)
Acidification Eutrophication ET water
chronic
ETwater acute
ET soil chronic
HT air HT water HTsoil
Whey discharge 0.0 0.0 41.9 0.0 0.0 0.0 0.0 0.0 0.0
Water (tap) 0.4 0.1 0.1 0.0 0.0 0.0 0.2 0.1 0.1
Milk Transportation and storage
17.1 19.5 19.1 21.0 21.0 1.3 23.4 29.0 15.3
Addition of Citric acid 23.3 27.6 27.1 29.9 30.0 1.8 32.9 41.1 21.6
Packaging Material (Plastic)
3.2 3.6 1.0 7.4 7.5 0.5 18.6 6.0 37.4
Electricity consumption
27.8 44.0 7.8 34.3 34.1 82.8 17.5 9.5 13.9
Heat (dairies) 28.2 5.2 2.9 7.4 7.3 13.7 7.4 14.3 11.8
Total 100.0 100.0 100.0 100.0 100.0 100.0 100.0 100.0 100.0
Table 31: Life Cycle Impact Assessment for the Scenario 1 (S1)
Impact category Global warming
(GWP 100)
Acidification Eutrophication ET water
chronic
ETwater acute
ET soil chronic
HT air HT water HTsoil
Whey Discharge 0.00 0.00 53.12 0.00 0.00 0.00 0.00 0.00 0.00
Water (tap) 0.46 0.08 0.08 0.02 0.02 0.03 0.26 0.20 0.12
Milk transportation and storage
20.93 24.79 24.21 27.35 27.42 1.31 31.47 42.72 18.50
Addition of Probiotics 6.33 7.82 7.62 8.67 8.69 0.40 9.80 13.44 5.78
Packaging Plastic 3.90 4.59 1.32 9.70 9.78 0.49 25.05 8.88 44.68
Electricity consumption
33.93 56.10 9.94 44.68 44.50 83.92 23.52 13.66 16.72
Heat (dairies) 34.44 6.63 3.71 9.58 9.59 13.86 9.89 21.10 14.21
Total 100.00 100.00 100.00 100.00 100.00 100.00 100.00 100.00 100.00

177
Table 32: Life Cycle Impact Assessment for the Scenario 2 (S2)
Impact category Global warming (GWP 100)
Acidification Eutrophication ET water
chronic
ET water acute
ET soil chronic
HT air HT water HT soil
Water (tap) 0.36 0.26 0.02 0.02 0.02 0.02 0.21 0.14 0.09
Milk Transportation and storage
16.34 80.69 4.93 25.60 25.70 1.03 25.02 29.32 14.27
Addition of probiotics
4.45 22.92 1.40 7.31 7.34 0.28 7.02 8.31 4.02
Packaging (Plastic) 3.04 14.93 0.27 9.08 9.17 0.38 19.92 6.10 34.48
Electricity Consumption
26.48 182.59 2.02 41.82 41.71 66.07 18.70 9.38 12.90
Heat (dairies) 26.88 21.57 0.75 8.97 8.99 10.91 7.86 14.48 10.96
Whey powder production
22.44 -222.97 -109.39 7.20 7.08 21.30 21.26 32.27 23.26
Total 100.00 100.00 -100.00 100.00 100.00 100.00 100.00 100.00 100.00

178
Table 33: Life Cycle Impact Assessment for the Scenario 3 (S3)
Impact category Global warming (GWP 100)
Acidification Eutrophication ET water chronic
ETwater acute
ET soil chronic
HT air HT water HTsoil
Water (tap) 0.25 0.07 0.15 0.02 0.02 0.02 0.24 0.15 0.14
Milk transportation and storage
11.13 22.58 44.31 25.29 25.38 1.03 28.76 30.58 20.72
Addition of Probiotics
3.03 6.41 12.57 7.22 7.24 0.28 8.07 8.67 5.84
Electricity consumption
18.05 51.09 18.19 41.32 41.19 66.01 21.50 9.78 18.72
Heat (dairies) 18.32 6.04 6.78 8.86 8.87 10.90 9.04 15.11 15.91
Whey powder production
49.22 13.81 18.01 17.29 17.30 21.76 32.40 35.71 38.67
Total 100.00 100.00 100.00 100.00 100.00 100.00 100.00 100.00 100.00

179
The minimum value that is achieved in scenario 1 is due to the use of probiotics. It
reduces the consumption of fuel that is used in the transportation of citric acid from
England to Pakistan. This fuel consumption is cut out in further scenarios by the use
of probiotics. The second major contribution to this category was found by the use of
electricity and heat.
Energy is the main sector, which is responsible for environmental pollution. The
results obtained from LCA for Lahore cheese production support the results of a
study conducted in USA 371, that food industry is at fifth position for energy
consumption i.e 4.4% of total energy consumed by industry.
It was observed that use of electricity is minimum, in existing scenario while in
scenario 2 it is maximum where the production of powdered whey requires extra
amount of energy as it has been found that the freeze drying technology requires
high quantity of energy 372. The GWP and EI study was conducted by Aguirre-
villegas et al. and found that these two impact categories are affected by variations
in whey evaporation, whey drying, milk pasteurization and whey pasteurization 373 ,
their conclusion is verified by the present report of LCA during drying of whey. The
process of refrigeration is another important contributor in electricity consumption 24 .
The climate of Lahore requires an efficient cold storage system to maintain the
quality of milk. Milk itself is an excellent substrate for bacteria since it contains a wide
range of nutrients. The temperature is 37 degree Celsius when it comes out of the
udder, i.e. is the very favourable temperature for growth of bacteria. That’s why it is
important to store the milk below 10 degree Celcsius. Many worldwide studies
reported that high energy consumption and related environmental impacts are mainly
due to refrigeration 374. The cheese production is very electricity demanding, not only
for refrigeration but also to run the other cheese making operations.

180
Fig 55: LCIA results for different scenarios
The phase of standardization/pasteurization in cheese making requires high
temperature short time (HTST) at 161°F (72°C) for at least 15 seconds. After this it
needs to be cooled to 31 degree Celsius so that the protein in the milk may not be
damaged. This process requires heat. This heat is produced through fossil fuel

181
burning and ultimately gives rise to global warming as well as other impact
categories.
The scenario 3 contributes at its maximum with 35% of this impact category because
the energy consumption in whey drying process can not compensate well by the use
of chemical fertilizer. The production of chemical fertilizers and their transportation
requires much energy. The amount of energy used is higher than the amount
avoided. But the scenario 2 in which the production of whey which replaced the
antidiarrheal medicine is comparatively better than the other scenarios.
The impact categories of Eutrophication and Acidification were highly influenced by
the treatment of Whey. It was seen through Life Cycle Impact Assessment that
production of 1 tone of cheese contributes 10.57 g, 8.4g, -41 g, 5g (NO3 equivalent)
in existing, S1, S2 and S3 scenarios respectively to Eutrophication. The saving was
found in only S2 due to the saving of whey to discharge as waste. The Scenario 3
gives little compensation due to the use of whey on land. But the existing scenario
gives maximum contribution (58%) due to the high eutrophication caused by whey
disposal in other water bodies.

182
Figure 56: Comparison between different scenarios

183
In scenario 2 by utilization of this waste it gives savings of more than 80% in
Eutrophication and 40 % for acidification.
The electricity consumption is the most contributing factor to toxicity (both Eco and
human toxicity). The main emission of arsenic and heavy metals from mining of coal
are basically responsible for this major contribution to toxicity. The water depletion
and eutrophication are the main resource management issues and Kim's life cycle
assessment also represented that eutrophication has largest relative impact which
are driven by agricultural runoff and associated with whey-processing 215.
Therefore, improvements in the agricultural management and whey processing are
the needs of present dairy technologies.
Packaging of cheese is an important process for human toxicity via soil. This type of
plastic LDPE cannot be recycled and considered as dumped directly on land 375. This
dumping of plastic after use makes it more alarming for this impact category.
The use of whey on agriculture land was not found an environment friendly as
compared to the use of whey as a supplement of antidiarrheal medicine. The main
issue with the application of whey on the ground is that it is very low quality as
compared to chemical fertilizer. It cannot compensate its transportation to land.

184
CONCLUSION
In this project, the environment -friendly probiotic cheese was manufactured using
different methods of pre-acidification. The conventional chemical and biological
methods using citric acid and commercial starter cultures, respectively, were
compared with the indigenously isolated probiotic cultures. The physicochemical,
microbiological, rheological and sensory evaluations were performed on a 30 day
interval during the storage of 180 days. The results of microbiological analysis
showed that there is no significant effect of different pre-acidification types, but in the
physicochemical, sensory and survival evaluation studies, these cultures indicated
significant differences. Prior to survival evaluation, these indigenous cultures were
coated with Ca-alginate and the prebiotic amalgam. The findings of the survival
evaluation in Stimulated Gastric Juice (SGJ) and Stimulated Intestinal Juice (SIJ) of
these coated probiotic capsules give clear evidence of a significant increase in
probiotics growth with the passage of time during storage, especially in the case of
mixed culture, containing both the Lactobacillus and Bifidobacterium in 1:1 ratio. The
expert panel also showed the highest level of overall acceptance for this mixed
cultured cheese (M-cheese).
No doubt, Pakistan urgently needs the health beneficial value added dairy products
in the market. As the food industry is the second largest industry of Pakistan and the
milk production is on the fifth top global ranking. Meanwhile, the awareness about
the health and diet is increasing among the public with the increasing middle-income
families. These probiotic cheeses will, definitely, help in filling the market gaps in the
value added and health beneficial food and pharmaceutical products.
Presently, Pakistan has a relatively nascent and unregulated indigenous probiotic
dairy industry. There is a wide hole in the regulation and safety of these value added
functional products, as there is complete absence of procedures for the identification
of probiotics. The availability of these effective probiotic indigenous cultures would
locally help in the construction of the basic framework in this regard beside

185
decreasing the import cost of the foreign commercial cultures and chemicals used in
cheese production.
The Life Cycle Assessment (LCA) has highlighted the five impact categories; Global
Warming Potential (GWP), eutrophication, acidification, ecotoxicity (water chronic
and acute, ecotoxicity soil chronic), and human toxicity (air, water, and soil). The
results of assessment have revealed that Global Warming Potential (GWP) was
mainly associated with electricity, heat and fuel consumption, which showed 965g,
791 g, 1013g and 1487g for existing scenario, S1 (probiotics used), S2 (whey
utilization as a fertilizer) and S3 (whey utilization as a supplement), respectively
while minimum value was achieved in scenario 1 is due to the use of probiotics. As
far as consumption of electricity is concerned, the minimum was in the existing
scenario while in scenario 2 it is maximized; maybe because of freeze drying
technology used in formation of whey powder. The impact categories of
eutrophication and acidification were highly influenced by the treatment of Whey. It
was seen through Life Cycle Impact Assessment (LCIA) that production of 1 ton of
cheese contributes 10.57 g, 8.4g, -41 g, 5g in existing, S1, S2 and S3 scenarios
respectively to eutrophication. The saving was found in only S2 due to the saving of
whey to discharge as waste. The Scenario 3 gives little compensation due to the use
of whey on land. But the existing scenario gives maximum contribution (58%) due to
the high concentration of BOD and COD of Whey. In scenario 2 by utilization of this
waste it gives savings of more than 80% in eutrophication and 40 % for acidification.
Furthermore, the findings of feed trials of mixed cultured probiotic- whey based anti-
diarrheal supplement has supported the clinical medication for diarrhea in the infants
up to 12 months as the World Health Organization (WHO) has reported that diarrhea
is the second leading cause of death in children under 5 years old which kills around
1.5 million every year, especially in the developing countries like Pakistan. The trials
have revealed that there is no evidence of adverse side effects or recurrence of
diarrhea in the infants who were treated with this supplement.

186
Recommendations
- More work is required for strain identification and encapsulation techniques of
indigenous probiotic cultures in Pakistan.
-More research is needed for the re-evaluation of the results of western probiotic
science in the context of local conditions and to see if the probiotic confer similar
benefits.
-Further studies are required in the enzymatic changes in the probiotic cheeses
during storage.
-Use of pressure technology to improve the functionality and rheological properties of
probiotic cheese.
-Effect of seasonal variation on probiotic cheese quality and characteristics during
storage.
-In Pakistan, further studies on the environment and health effects of the dairy
processing is required.

187
Chapter 5
REFERENCES
1 Farah N Talpur, MI Bhanger, AA Khooharo, and G Zuhra Memon, Livestock Science 118 (1),
166 (2008). 2 JA Lucey and PF Fox, J. Dairy Sci. 76 (6), 1714 (1993).
3 P Dejmek and P Walstra, Cheese: Chemistry, Physics and Microbiology 1, 71 (2004).
4 Benjamin Senauer and Linde Goetz, The growing middle class in developing countries and
the market for high-value food products. (Food Industry Center, University of Minnesota, 2003).
5 Giuseppe Bertoni, Luigi Calamari, and Maria Grazia Maianti, Proceedings of the Nutrition
Society 60 (02), 231 (2001). 6 MK Rowney, MW Hickey, P Roupas, and DW Everett, J. Dairy Sci. 86 (3), 712 (2003).
7 Paul S Kindstedt, in Cheese: chemistry, physics and microbiology (Springer, 1993), pp. 337.
8 Ming R Guo and Paul S Kindstedt, J. Dairy Sci. 78 (10), 2099 (1995).
9 Michelle K Rowney, Peter Roupas, Malcolm W Hickey, and David W Everett, Int. Dairy J. 14
(9), 809 (2004). 10
Patrick F Fox, Paul LH McSweeney, Timothy M Cogan, and Timothy P Guinee, Cheese: Chemistry, Physics and Microbiology: General Aspects. (Academic Press, 2004).
11 Michael A Rudan, David M Barbano, J Joseph Yun, and Paul S Kindstedt, J. Dairy Sci. 82
(4), 661 (1999). 12
S Coppola, F Villani, R Coppola, and E Parente, Le Lait 70 (5-6), 411 (1990). 13
Timothy P Guinee, Dermot Harrington, Michael O Corcoran, Edward O Mulholland, and sCATHERINE MUJLLINS, Int. J. Dairy Technol. 53 (2), 51 (2000).
14 LE Metzger, DM Barbano, MA Rudan, and PS Kindstedt, J. Dairy Sci. 83 (4), 648 (2000).
15 Y García Curbelo, Y García, and R Bocourt Salabarría, Albéitar (140), 8 (2010).
16 M Saarela, L Lähteenmäki, R Crittenden, S Salminen, and T Mattila-Sandholm, Int. J. Food
Microbiol. 78 (1), 99 (2002). 17
Sigrid Mayrhofer, Konrad J Domig, Christiane Mair, Ulrike Zitz, Geert Huys, and Wolfgang Kneifel, Appl. Environ. Microbiol. 74 (12), 3745 (2008).
18 Madeline Velazquez and Joellen M Feirtag, Journal of Food Protection® 60 (5), 537 (1997).
19 G. Reid and R. Friendship, Anim. Biotechnol. 13 (1), 97 (2002).
20 C. Dunne and F. Shanahan, Current opinion in gastroenterology 18 (1), 40 (2002).
21 Sameh Awad, Nour Elhoda Ahmed, and Morsi El Soda, Food and Nutrition 4, 79 (2013).
22 Lucília Domingues, Pedro MR Guimarães, and Carla Oliveira, Bioengineered 1 (3), 164
(2010). 23
W James Harper, Biological Properties of Whey Components: A Review: Update 2004. (American Dairy Products Institute, 2004).
24 A Hospido, MT Moreira, and G Feijoo, Int. Dairy J. 13 (10), 783 (2003).
25 Merete Høgaas Eide, The International Journal of Life Cycle Assessment 7 (2), 115 (2002).
26 Christel Cederberg and Magnus Stadig, The International Journal of Life Cycle Assessment 8
(6), 350 (2003). 27
Guido Haas, Frank Wetterich, and Ulrich Köpke, Agric., Ecosyst. Environ. 83 (1), 43 (2001). 28
International Organization for Standardization, Environmental Management: Life Cycle Assessment: Principles and Framework. (ISO, 1997).
29 ÉG Castanheira, AC Dias, L Arroja, and R Amaro, Agricultural Systems 103 (7), 498 (2010).
30 Diego Iribarren, Almudena Hospido, María Teresa Moreira, and Gumersindo Feijoo, Sci.
Total Environ. 409 (10), 1786 (2011).

188
31 Valentina Fantin, Patrizia Buttol, Roberto Pergreffi, and Paolo Masoni, Journal of Cleaner
Production 28, 150 (2012). 32
Johanna Berlin, Int. Dairy J. 12 (11), 939 (2002). 33
CA Ramirez, M Patel, and K Blok, Energy 31 (12), 1984 (2006). 34
Gregory A Keoleian and David V Spitzley, Journal of Industrial Ecology 3 (1), 111 (1999). 35
Gil Hardy, Nutrition 16 (7), 688 (2000); No-Seong Kwak and David John Jukes, Food Control 12 (2), 99 (2001).
36 Catherine Stanton, R Paul Ross, Gerald F Fitzgerald, and Douwe Van Sinderen, Curr. Opin.
Biotechnol. 16 (2), 198 (2005). 37
Klaus Menrad, J. Food Eng. 56 (2), 181 (2003); Marcel B Roberfroid, Nutrition 16 (7), 689 (2000).
38 J. Schrezenmeir and M. de Vrese, Am. J. Clin. Nutr. 73 (2 Suppl), 361S (2001).
39 E Fern, presented at the International developments in science & health claims, ILSI
international symposium on functional foods in Europe, 2007 (unpublished); Jose Blandon, John Cranfield, and Spencer Henson, International Food Economy Research Group Department of Food, Agricultural and Resource Economics (2007).
40 A Elizabeth Sloan, Food Technol. 54 (4), 33 (2000).
41 A Elizabeth Sloan, Food Technol. 58 (4), 28 (2004).
42 Stella M Alzamora, Daniela Salvatori, María S Tapia, Aurelio López-Malo, Jorge Welti-
Chanes, and Pedro Fito, J. Food Eng. 67 (1), 205 (2005); Peter J Jones and Stephanie Jew, Trends Food Sci. Technol. 18 (7), 387 (2007).
43 D Charalampopoulos, SS Pandiella, and C Webb, Int. J. Food Microbiol. 82 (2), 133 (2003).
44 G Kociubinski and S Salminen, presented at the Functional food network general meeting,
2006 (unpublished). 45
MM Tabbers and MA Benninga, Nederlands tijdschrift voor geneeskunde 151 (40), 2198 (2007).
46 M. Boirivant and W. Strober, Current opinion in gastroenterology 23 (6), 679 (2007).
47 Nagendra P Shah, Int. Dairy J. 17 (11), 1262 (2007).
48 A. Ouwehand and S. Vesterlund, IDrugs : the investigational drugs journal 6 (6), 573 (2003).
49 Djomne Victor Sieladie, Ngoufack Francois Zambou, Pierre Marie Kaktcham, Alberto Cresci,
and Florence Fonteh, Innovative Romanian Food Biotechnology 9 (12) (2011). 50
L. Morelli and L. Capurso, Journal of clinical gastroenterology 46 Suppl, S1 (2012). 51
RP Ross, G Fitzgerald, K Collins, and C Stanton, Australian Journal of Dairy Technology 57 (2), 71 (2002).
52 Knut J Heller, The American journal of clinical nutrition 73 (2), 374s (2001).
53 H. Gill and J. Prasad, Adv. Exp. Med. Biol. 606, 423 (2008).
54 S Parvez, KA Malik, S Ah Kang, and H‐Y Kim, J. Appl. Microbiol. 100 (6), 1171 (2006).
55 Kaila Kailasapathy, Curr. Issues Intestinal Microbiol. 3 (2), 39 (2002).
56 Anil Kumar Anal and Harjinder Singh, Trends Food Sci. Technol. 18 (5), 240 (2007).
57 Latha Sabikhi, R Babu, DK Thompkinson, and Suman Kapila, Food and Bioprocess
Technology 3 (4), 586 (2010). 58
TC Souza, AM Silva, JRP Drews, DA Gomes, CG Vinderola, and JR Nicoli, Beneficial microbes 4 (2), 179 (2013).
59 Merete H Helland, Trude Wicklund, and Judith A Narvhus, Int. J. Food Microbiol. 91 (3), 305
(2004). 60
T. Werfel, Der Hautarzt; Zeitschrift fur Dermatologie, Venerologie, und verwandte Gebiete 60 (10), 802 (2009).
61 S. L. Gorbach, The American journal of gastroenterology 95 (1 Suppl), S2 (2000).
62 H. Lochs, Wiener klinische Wochenschrift 119 (15-16), 441 (2007).
63 CMC Chapman, GR Gibson, and I Rowland, European journal of nutrition 50 (1), 1 (2011).
64 S Fanaro, R Chierici, P Guerrini, and V Vigi, Acta paediatrica 92 (s441), 48 (2003).
65 Tomotari Mitsuoka, Asia Pacific J Clin Nutr 5 (1), 2 (1996).
66 Emeritus Tomotari Mitsuoka, in The Lactic Acid Bacteria Volume 1 (Springer, 1992), pp. 69.
67 Ruth E Toward, Gemma E Walton, and Glenn R Gibson, Nutrition and Aging 1 (3), 167
(2012). 68
Sampo J Lahtinen, Sofia Forssten, Juhani Aakko, Linda Granlund, Nina Rautonen, Seppo Salminen, Matti Viitanen, and Arthur C Ouwehand, Age 34 (1), 133 (2012).
69 S. J. Lahtinen, L. Tammela, J. Korpela, R. Parhiala, H. Ahokoski, H. Mykkanen, and S. J.
Salminen, Age 31 (1), 59 (2009). 70
P. Salari, S. Nikfar, and M. Abdollahi, Inflammation & allergy drug targets 11 (1), 3 (2012).

189
71 LV McFarland, Digestive diseases 16 (5), 292 (1999); Frédéric Barbut and Jean Luc
Meynard, BMJ: British Medical Journal 324 (7350), 1345 (2002). 72
H. Szajewska, M. Ruszczynski, and A. Radzikowski, The Journal of pediatrics 149 (3), 367 (2006).
73 Rial D Rolfe, The Journal of nutrition 130 (2), 396S (2000); FILIPPO Cremonini,
SIMONA Di Caro, L Santarelli, M Gabrielli, MARCELLO Candelli, ENRICO CELESTINO Nista, ANDREA Lupascu, G Gasbarrini, and ANTONIO Gasbarrini, Digestive and Liver Disease 34, S78 (2002).
74 S. Hempel, S. J. Newberry, A. R. Maher, Z. Wang, J. N. Miles, R. Shanman, B. Johnsen, and
P. G. Shekelle, JAMA : the journal of the American Medical Association 307 (18), 1959 (2012); Q. Hao, Z. Lu, B. R. Dong, C. Q. Huang, and T. Wu, Cochrane database of systematic reviews (9), CD006895 (2011).
75 L. V. McFarland, The American journal of gastroenterology 101 (4), 812 (2006); S. Sazawal,
G. Hiremath, U. Dhingra, P. Malik, S. Deb, and R. E. Black, Lancet Infect. Dis. 6 (6), 374 (2006).
76 B. C. Johnston, J. Z. Goldenberg, P. O. Vandvik, X. Sun, and G. H. Guyatt, Cochrane
database of systematic reviews (11), CD004827 (2011). 77
Susanne Hempel, Sydne J Newberry, Alicia R Maher, Zhen Wang, Jeremy NV Miles, Roberta Shanman, Breanne Johnsen, and Paul G Shekelle, JAMA: the journal of the American Medical Association 307 (18), 1959 (2012).
78 Stefano Bassetti, Reno Frei, and Werner Zimmerli, The American journal of medicine 105
(1), 71 (1998); Arnoldo J Riquelme, Mario A Calvo, Ana M Guzmán, María S Depix, Patricia García, Carlos Pérez, Marco Arrese, and Jaime A Labarca, Journal of clinical gastroenterology 36 (1), 41 (2003); P Zunic, J Lacotte, M Pegoix, G Buteux, G Leroy, B Mosquet, and M Moulin, Therapie 46 (6), 498 (1991); SF Ghasemi-Niri, AH Abdolghaffari, S Fallah-Benakohal, M Hosseinpour-Feizi, P Mahdaviani, H Jamalifar, M Baeeri, G Dehghan, and M Abdollahi, Journal of Physiology and Pharmacology 62 (3), 341 (2011).
79 M. de Vrese and P. R. Marteau, J. Nutr. 137 (3 Suppl 2), 803S (2007).
80 Jennifer A Applegate, Christa L Fischer Walker, Ramya Ambikapathi, and Robert E Black,
BMC Public Health 13 (Suppl 3), S16 (2013). 81
Jeannie S Huang, Athos Bousvaros, John W Lee, Angela Diaz, and Emily J Davidson, Dig. Dis. Sci. 47 (11), 2625 (2002).
82 K. M. Tuohy, H. M. Probert, C. W. Smejkal, and G. R. Gibson, Drug Discov. Today 8 (15),
692 (2003). 83
M. B. Roberfroid, Am. J. Clin. Nutr. 71 (6 Suppl), 1682S (2000). 84
H Kollaritsch, H Holst, P Grobara, and G Wiedermann, Fortschr Med 111, 152 (1993). 85
FT Black, PL Andersen, J Ørskov, F Ørskov, K Gaarslev, and S Laulund, in Travel Medicine (Springer, 1989), pp. 333.
86 Sh Yamazaki, H Kamimura, H Momose, T Kawashima, and K Ueda, BIFIDOBACTERIA AND
MICROFLORA. 1 (1) (1982). 87
Masahiro Tojo, Tadao Oikawa, Yoshiyuki Morikawa, Naoya Yamashita, Satoshi Iwata, Yoshitake Satoh, Juhei Hanada, and Ryuichiro Tanaka, Pediatrics International 29 (1), 160 (1987).
88 J. M. Saavedra, The Journal of pediatrics 135 (5), 535 (1999).
89 SherwoodL Gorbach, Te-Wen Chang, and Barry Goldin, The Lancet 330 (8574), 1519
(1987). 90
G. T. Macfarlane and J. H. Cummings, West. J. Med. 171 (3), 187 (1999). 91
M. E. Sanders, F. Guarner, R. Guerrant, P. R. Holt, E. M. Quigley, R. B. Sartor, P. M. Sherman, and E. A. Mayer, Gut 62 (5), 787 (2013).
92 Guillermo Bernaola Aponte, Carlos Alfonso Bada Mancilla, Nilton Yhuri Carreazo, and Raúl
Alberto Rojas Galarza, status and date: New search for studies and content updated (no change to conclusions), published in (8) (2013).
93 Shinji Fukuda, Hidehiro Toh, Koji Hase, Kenshiro Oshima, Yumiko Nakanishi, Kazutoshi
Yoshimura, Toru Tobe, Julie M Clarke, David L Topping, and Tohru Suzuki, Nature 469 (7331), 543 (2011).
94 L. V. McFarland, Annals of nutrition & metabolism 57 Suppl, 10 (2010).
95 Reza Karimi, Amir Mohammad Mortazavian, and Adriano Gomes Da Cruz, Dairy Science &
Technology 91 (3), 283 (2011). 96
M Hayes, M Coakley, L O'SULLIVAN, C Stanton, C Hill, GF Fitzgerald, JJ Murphy, and RP Ross, Australian journal of dairy technology 61 (2), 132 (2006).

190
97 Ana MP Gomes and F Xavier Malcata, J. Dairy Sci. 81 (6), 1492 (1998).
98 A Daigle, D Roy, G Belanger, and JC Vuillemard, J. Dairy Sci. 82 (6), 1081 (1999).
99 Drug and therapeutics bulletin 42 (11), 85 (2004); M Medici, CG Vinderola, and G
Perdigón, Int. Dairy J. 14 (7), 611 (2004). 100
H Mäkeläinen, S Forssten, K Olli, L Granlund, N Rautonen, and AC Ouwehand, Int. Dairy J. 19 (11), 675 (2009).
101 G Vinderola, W Prosello, F Molinari, D Ghiberto, and J Reinheimer, Int. J. Food Microbiol.
135 (2), 171 (2009). 102
Susanna Rokka and Pirjo Rantamäki, Eur. Food Res. Technol. 231 (1), 1 (2010); S Saranya and Antagonistic Hemashenpagam, Adv Appl Sci Res 2 (4), 528 (2011).
103 S. Salminen, A. von Wright, L. Morelli, P. Marteau, D. Brassart, W. M. de Vos, R. Fonden, M.
Saxelin, K. Collins, G. Mogensen, S. E. Birkeland, and T. Mattila-Sandholm, Int. J. Food Microbiol. 44 (1-2), 93 (1998).
104 Sherwood L Gorbach, The American journal of gastroenterology 95 (1), S2 (2000).
105 Claudia E Gutierrez-Fuentes, Luis A Zuñiga-Orozco, Jose Luis Vicente, Xochitl Hernandez-
Velasco, Anita Menconi, Vivek Ayamchirakkunnel Kuttappan, Gopala Kallapura, Juan David Latorre, Sherry Layton, and Billy Marshall Hargis, International Journal of Poultry Science 12 (6), 322 (2013).
106 GR Gibson, RA Rastall, and R Fuller, Gut flora, nutrition, immunity and health, 52 (2003).
107 U Svensson and GW Tannock, Probiotics: a critical review., 57 (1999).
108 HH Musa, SL Wu, CH Zhu, HI Seri, and GQ Zhu, Journal of Animal and Veterinary Advances
8 (2), 313 (2009). 109
RP Ross, C Desmond, GF Fitzgerald, and C Stanton, J. Appl. Microbiol. 98 (6), 1410 (2005). 110
RDCS Ranadheera, SK Baines, and MC Adams, Food Res. Int. 43 (1), 1 (2010). 111
F. Ibrahim, S. Ruvio, L. Granlund, S. Salminen, M. Viitanen, and A. C. Ouwehand, FEMS Immunol. Med. Microbiol. 59 (1), 53 (2010).
112 Stavros Plessas, Loulouda Bosnea, Athanasios Alexopoulos, and Eugenia Bezirtzoglou,
Eng. Life Sci. 12 (4), 433 (2012). 113
Fandi Ibrahim, Suvi Ruvio, Linda Granlund, Seppo Salminen, Matti Viitanen, and Arthur C Ouwehand, FEMS Immunology & Medical Microbiology 59 (1), 53 (2010).
114 Marie-Hélène Fortin, Claude P Champagne, Daniel St-Gelais, Michel Britten, Patrick Fustier,
and Monique Lacroix, Int. Dairy J. 21 (2), 75 (2011). 115
Adriano Gomes da Cruz, Flávia Carolina Alonso Buriti, Cínthia Hoch Batista de Souza, José Assis Fonseca Faria, and Susana Marta Isay Saad, Trends Food Sci. Technol. 20 (8), 344 (2009).
116 M Gobbetti, R Di Cagno, and M De Angelis, Crit. Rev. Food Sci. Nutr. 50 (8), 716 (2010).
117 Marco Candela, Simone Maccaferri, Silvia Turroni, Paola Carnevali, and Patrizia Brigidi, Int.
J. Food Microbiol. 140 (2-3), 93 (2010). 118
AP Bai and Q Ouyang, Postgrad. Med. J. 82 (968), 376 (2006). 119
Vivien E Rolfe, PJ Fortun, CJ Hawkey, and F Bath-Hextall, Cochrane database of systematic reviews 4 (2006).
120 S Krämer and SC Bischoff, MMW Fortschritte der Medizin 148 (35-36), 28 (2006).
121 M. Falagas, G. I. Betsi, and S. Athanasiou, Clin. Microbiol. Infect. 13 (7), 657 (2007).
122 RJ Boyle and MLK Tang, Clinical & Experimental Allergy 36 (5), 568 (2006).
123 T. R. Klaenhammer, M. Kleerebezem, M. V. Kopp, and M. Rescigno, Nat. Rev. Immunol. 12
(10), 728 (2012). 124
Roy Fuller, in Probiotics (Springer, 1992), pp. 1; Roxana Medina, Marta Katz, Silvia Gonzalez, and Guillermo Oliver, Journal of Food Protection® 64 (4), 559 (2001).
125 Jose M Saavedra, The American journal of clinical nutrition 73 (6), 1147S (2001); MG
O'sullivan, G Thornton, GC O'sullivan, and JK Collins, Trends Food Sci. Technol. 3, 309 (1992).
126 G. W. Tannock, Journal of pediatric gastroenterology and nutrition 38 (3), 244 (2004).
127 R. Fuller, Society for Applied Bacteriology symposium series 15, 1S (1986).
128 G. Reid, S. Anand, M. O. Bingham, G. Mbugua, T. Wadstrom, R. Fuller, K. Anukam, and M.
Katsivo, Journal of clinical gastroenterology 39 (6), 485 (2005). 129
Muzaffer Denli, Ferda Okan, and Kemal Celik, Pak. J. Nutr 2 (2), 89 (2003). 130
C. E. Nord, Current infectious disease reports 9 (4), 263 (2007). 131
L Ong, A Henriksson, and NP Shah, Int. Dairy J. 16 (5), 446 (2006). 132
Maria Magdalena Coman, Cinzia Cecchini, Maria Cristina Verdenelli, Stefania Silvi, Carla Orpianesi, and Alberto Cresci, Int. J. Food Microbiol. 157 (3), 346 (2012).

191
133 CG Vinderola, W Prosello, D Ghiberto, and JA Reinheimer, J. Dairy Sci. 83 (9), 1905 (2000).
134 Y Kourkoutas, L Bosnea, S Taboukos, C Baras, D Lambrou, and M Kanellaki, J. Dairy Sci.
89 (5), 1439 (2006). 135
A Kasımoğlu, M Göncüoğlu, and S Akgün, Int. Dairy J. 14 (12), 1067 (2004). 136
Eeva-Liisa Ryhänen, Anne Pihlanto-Leppälä, and Eero Pahkala, Int. Dairy J. 11 (4), 441 (2001).
137 Cínthia HB De Souza, Flávia CA Buriti, Jorge H Behrens, and Susana MI Saad, Int. J. Food
Sci. Tech. 43 (5), 871 (2008). 138
K Hatakka, AJ Ahola, H Yli-Knuuttila, M Richardson, T Poussa, JH Meurman, and R Korpela, J. Dent. Res. 86 (2), 125 (2007).
139 G Gardiner, C Stanton, PB Lynch, JK Collins, G Fitzgerald, and RP Ross, J. Dairy Sci. 82
(7), 1379 (1999). 140
Latha Sabikhi, MH Sathish Kumar, and BN Mathur, Journal of food science and technology, 1 (2013).
141 Y Vandenplas, E De Greef, T Devreker, G Veereman-Wauters, and B Hauser, Current
infectious disease reports, 1 (2013). 142
Marian MIHAIU, Bulletin of University of Agricultural Sciences and Veterinary Medicine Cluj-Napoca. Veterinary Medicine 67 (2) (2010).
143 M. T. Cook, G. Tzortzis, D. Charalampopoulos, and V. V. Khutoryanskiy, Journal of
controlled release : official journal of the Controlled Release Society 162 (1), 56 (2012). 144
L. C. Douglas and M. E. Sanders, J. Am. Diet. Assoc. 108 (3), 510 (2008). 145
Jean-Antoine Meiners, Prebiotics and Probiotics Science and Technology, by Charalampopoulos, Dimitris; Rastall, Robert A., ISBN 978-0-387-79057-2. Springer-Verlag New York, 2009, p. 805 1, 805 (2009).
146 F Ortakci, JR Broadbent, WR McManus, and DJ McMahon, J. Dairy Sci. (2012).
147 Wunwisa Krasaekoopt, Bhesh Bhandari, and Hilton Deeth, Int. Dairy J. 14 (8), 737 (2004).
148 Claude P Champagne and Patrick Fustier, Curr. Opin. Biotechnol. 18 (2), 184 (2007).
149 WK Ding and NP Shah, J. Food Sci. 72 (9), M446 (2007).
150 Pavan Kumar Soma, Patrick D Williams, and Y Martin Lo, Frontiers of Chemical Engineering
in China 3 (4), 413 (2009). 151
Khalida Sultana, Georgia Godward, N Reynolds, R Arumugaswamy, P Peiris, and Kaila Kailasapathy, Int. J. Food Microbiol. 62 (1), 47 (2000).
152 K Kailasapathy, CAB Reviews: Perspectives in Agriculture, Veterinary Science, Nutrition and
Natural Resources 4 (033), 1 (2009). 153
Kasipathy Kailasapathy and CP Champagne, AGRO FOOD INDUSTRY HI-TECH 22 (2), 25 (2011).
154 Gildas K. Gbassi and Thierry Vandamme, Pharmaceutics 4 (4), 149 (2012).
155 Amir Mortazavian, Seyed Hadi Razavi, Mohammad Reza Ehsani, and Sara Sohrabvandi,
Iranian Journal of Biotechnology (IJB) 5 (1), 1 (2007). 156
Rama Dubey, TC Shami, and KU Bhasker Rao, Def. Sci. J. 59 (1), 82 (2009). 157
AJ Meulenbroek and WP Zeijlemaker, CLB, Plesmanlaan, Amsterdam, Holland, ISBN-13 822202535 (1996).
158 F Klobasa, JE Butler, and F Habe, Am. J. Vet. Res. 51 (9), 1407 (1990); JG Van de Winkel
and Clark L Anderson, J. Leukocyte Biol. 49 (5), 511 (1991). 159
Raymond J Playford, Christopher E Macdonald, and Wendy S Johnson, The American journal of clinical nutrition 72 (1), 5 (2000).
160 W Stephan, H Dichtelmüller, and R Lissner, Journal of clinical chemistry and clinical
biochemistry. Zeitschrift fur klinische Chemie und klinische Biochemie 28 (1), 19 (1990). 161
Thomas T Wheeler, Alison J Hodgkinson, Colin G Prosser, and Stephen R Davis, Journal of mammary gland biology and neoplasia 12 (4), 237 (2007).
162 K Stelwagen, E Carpenter, B Haigh, A Hodgkinson, and TT Wheeler, J. Anim. Sci. 87 (13
suppl), 3 (2009). 163
A Plettenberg, A Stoehr, H-J Stellbrink, H Albrecht, and W Meigel, The clinical investigator 71 (1), 42 (1993); Jennifer Steele, Jerlyn Sponseller, Diane Schmidt, Ocean Cohen, and Saul Tzipori, Human vaccines & immunotherapeutics 9 (7), 0 (2013); Carol O Tacket, Steven B Binion, Eileen Bostwick, Genevieve Losonsky, Michael J Roy, and Robert Edelman, The American journal of tropical medicine and hygiene 47 (3), 276 (1992); Shafiqul A Sarker, Thomas H Casswall, Dilip Mahalanabis, Nur H Alam, Manuel J Albert, HARALD BRÜSSOW, George J Fuchs, and LENNART HAMMERSTRÖM, The Pediatric infectious disease journal

192
17 (12), 1149 (1998); Hannu Korhonen, Pertti Marnila, and HS Gill, British Journal of Nutrition 84 (S1), 135 (2000).
164 Emil L Smith, J. Biol. Chem. 165 (2), 665 (1946).
165 T. T. MacDonald and I. Bell, The Proceedings of the Nutrition Society 69 (3), 442 (2010).
166 Z Khan, C Macdonald, AC Wicks, MP Holt, D Floyd, S Ghosh, NA Wright, and RJ Playford,
Alimentary pharmacology & therapeutics 16 (11), 1917 (2002). 167
Grant D Brinkworth and Jonathan D Buckley, European journal of nutrition 42 (4), 228 (2003).
168 Kathleen F Benson, Steve G Carter, Kelly M Patterson, Dilip Patel, and Gitte S Jensen,
Preventive Medicine 54, S116 (2012). 169
Cristina Castellote, Rosario Casillas, Carolina Ramírez-Santana, Francisco J Pérez-Cano, Margarida Castell, M Glòria Moretones, M Carmen López-Sabater, and Àngels Franch, The Journal of nutrition 141 (6), 1181 (2011); Hans-Iko Huppertz, Stefan Rutkowski, Dirk H Busch, Reinhard Eisebit, Reinhard Lissner, and Helge Karch, Journal of pediatric gastroenterology and nutrition 29 (4), 452 (1999).
170 Geoffrey W Smithers, F John Ballard, Adam D Copeland, Kirthi J de Silva, David A Dionysius,
Geoffrey L Francis, Chris Goddard, Paul A Grieve, Graeme H McIntosh, and Ian R Mitchell, J. Dairy Sci. 79 (8), 1454 (1996).
171 Muhammad Rizwan Tariq, Aysha Sameen, Muhammad Issa Khan, Nuzhat Huma, and
Adeela Yasmin, (2013). 172
Efstathia Tsakali, Konstantinos Petrotos, Angela D’Allessandro, and Panagiotis Goulas. 173
ME Carunchia Whetstine, JD Parker, MA Drake, and DK Larick, J. Dairy Sci. 86 (2), 439 (2003).
174 KM Blaschek, WL Wendorff, and SA Rankin, J. Dairy Sci. 90 (4), 2029 (2007).
175 Abdérrazak Akbache, Éric Lamiot, Olivier Moroni, Sylvie Turgeon, Sylvie F Gauthier, and
Yves Pouliot, J. Membr. Sci. 326 (2), 435 (2009); JG Zadow, in Robinson: Modern Dairy Technology (Springer, 1994), pp. 313.
176 Matti Harju and Matti Heikonen, (EP Patent 0,315,135, 1989).
177 Fisseha Welderufael and Paula Jauregi, Separation Science and Technology 45 (15), 2226
(2010). 178
US USDEC, Reference Manual for US Whey and Lactose Products, Whey and Lactose: Natural Milk Products (2004).
179 Dominik D Alexander and Michael D Cabana, Journal of pediatric gastroenterology and
nutrition 50 (4), 422 (2010). 180
Yves Pouliot, Int. Dairy J. 18 (7), 735 (2008). 181
Michael Iskedjian, Hania Szajewska, Jörg Spieldenner, Bechara Farah, and Jade Berbari, Current Medical Research & Opinion 26 (11), 2599 (2010).
182 G Pasin and SL Miller, Sports Nutrition, 1 (2000).
183 Clémence Bernard, Stéphanie Regnault, Solie Gendreau, Stéphanie Charbonneau, and Perla
Relkin, Food Hydrocolloids 25 (4), 758 (2011). 184
Richard J Fitzgerald and Brian A Murray, Int. J. Dairy Technol. 59 (2), 118 (2006). 185
Adil Rocafi, Éric Lamiot, Olivier Moroni, Sylvie L Turgeon, Sylvie F Gauthier, and Yves Pouliot, Dairy Science & Technology 91 (5), 615 (2011).
186 Wassef Ben Ounis, Sylvie F Gauthier, Sylvie L Turgeon, and Yves Pouliot, J. Membr. Sci.
351 (1), 189 (2010). 187
P Jelen, Encyclopaedia of Food Science and Technology 4, 2835 (1992). 188
K Burrington, Food Product Design 30 (2000). 189
Adrian J Lowe, Clifford S Hosking, Catherine M Bennett, Katrina J Allen, Christine Axelrad, John B Carlin, Michael J Abramson, Shyamali C Dharmage, and David J Hill, J. Allergy Clin. Immunol. 128 (2), 360 (2011).
190 Michael H Tunick, Whey processing, functionality and health benefits, 8 (2008).
191 ND Keri Marshall, Alternative Medicine Review 9 (2), 136 (2004).
192 Carol Bayford, Nutrition (2010).
193 Eric Van Cutsem and Jann Arends, European Journal of Oncology Nursing 9, S51 (2005).
194 Gurpreet Kaur, Parmjit S Panesar, Manav B Bera, and Harish Kumar, Bioprocess
Biosystems Eng. 32 (1), 63 (2009). 195
Marko Outinen, Antti Heino, and Janne Uusi-Rauva, LWT-Food Science and Technology 43 (4), 647 (2010).
196 I Moreno-Indias, N Castro, A Morales-delaNuez, D Sánchez-Macías, P Assunção, J Capote,
and A Argüello, J. Dairy Sci. 92 (10), 4792 (2009).

193
197 Zeynep Atamer, Meike Samtlebe, Horst Neve, Knut J Heller, and Joerg Hinrichs, Frontiers in
microbiology 4 (2013). 198
Yuan Fang, Sam Rogers, Cordelia Selomulya, and Xiao Dong Chen, Biochem. Eng. J. 62, 101 (2012).
199 Walter Klöpffer, Environmental Science and Pollution Research 4 (4), 223 (1997).
200 Bo Pedersen Weidema, Market information in life cycle assessment. (Miljøstyrelsen, 2003).
201 Poritosh Roy, Daisuke Nei, Takahiro Orikasa, Qingyi Xu, Hiroshi Okadome, Nobutaka
Nakamura, and Takeo Shiina, J. Food Eng. 90 (1), 1 (2009). 202
Nicholas Harvey and Beverley Dawn Clarke, Environmental impact assessment in practice. (Oxford University Press, 2012).
203 Erwin Meissner Schau and Annik Magerholm Fet, The International Journal of Life Cycle
Assessment 13 (3), 255 (2008). 204
Jeroen B Guinée, The international journal of life cycle assessment 7 (5), 311 (2002). 205
Tomas Ekvall and Bo P Weidema, The international journal of life cycle assessment 9 (3), 161 (2004).
206 Mary Ann Curran, The International Journal of Life Cycle Assessment 1 (3), 179 (1996).
207 Montse Meneses, Jorgelina Pasqualino, and Francesc Castells, J. Environ. Manage. 107, 76
(2012). 208
Gerald Rebitzer, Tomas Ekvall, R Frischknecht, D Hunkeler, G Norris, T Rydberg, W-P Schmidt, Sangwon Suh, BP Weidema, and DW Pennington, Environ. Int. 30 (5), 701 (2004).
209 Henrik Wenzel, Michael Z Hauschild, and Leo Alting, Environmental Assessment of Products:
Volume 1: Methodology, tools and case studies in product development. (Springer, 2000). 210
Catherine Benoît, Gregory A Norris, Sonia Valdivia, Andreas Ciroth, Asa Moberg, Ulrike Bos, Siddharth Prakash, Cassia Ugaya, and Tabea Beck, The international journal of life cycle assessment 15 (2), 156 (2010).
211 DW Pennington, J Potting, Göran Finnveden, E Lindeijer, O Jolliet, Ty Rydberg, and G
Rebitzer, Environ. Int. 30 (5), 721 (2004); John Reap, Felipe Roman, Scott Duncan, and Bert Bras, The International Journal of Life Cycle Assessment 13 (5), 374 (2008).
212 Ralph K Rosenbaum, Till M Bachmann, Lois Swirsky Gold, Mark AJ Huijbregts, Olivier Jolliet,
Ronnie Juraske, Annette Koehler, Henrik F Larsen, Matthew MacLeod, and Manuele Margni, The International Journal of Life Cycle Assessment 13 (7), 532 (2008); Olivier Jolliet, Manuele Margni, Raphaël Charles, Sébastien Humbert, Jérôme Payet, Gerald Rebitzer, and Ralph Rosenbaum, The International Journal of Life Cycle Assessment 8 (6), 324 (2003).
213 Edgar G Hertwich, Sarah F Mateles, William S Pease, and Thomas E McKone, Environ.
Toxicol. Chem. 20 (4), 928 (2001). 214
Sara González-García, Almudena Hospido, María Teresa Moreira, Gumersindo Feijoo, and Luis Arroja, Journal of Cleaner Production (2013).
215 Daesoo Kim, Greg Thoma, Darin Nutter, Franco Milani, Rick Ulrich, and Greg Norris, The
International Journal of Life Cycle Assessment, 1 (2013). 216
Tara Garnett, environmental science & policy 12 (4), 491 (2009); Giacomo Pirlo, Sara Carè, Valentina Fantin, Francesca Falconi, Patrizia Buttol, Giuseppina Terzano, and Paolo Masoni; Johanna Berlin and Ulf Sonesson, Journal of Cleaner Production 16 (4), 483 (2008).
217 Sara González-García, Érica G Castanheira, Ana Cláudia Dias, and Luis Arroja, The
International Journal of Life Cycle Assessment, 1 (2013). 218
Thu Lan T Nguyen and Shabbir H Gheewala, The International Journal of Life Cycle Assessment 13 (2), 147 (2008).
219 Nicoletta Kythreotou, Savvas A Tassou, and Georgios Florides, Energy 36 (10), 6090 (2011).
220 Ming-Jia Yan, James Humphreys, and Nicholas M Holden, J. Environ. Manage. 92 (3), 372
(2011); Anne-Grete Roer, Astrid Johansen, Anne Kjersti Bakken, Kristin Daugstad, Gustav Fystro, and Anders Hammer Strømman, Livestock Science (2013).
221 Pierre-Sylvain Mirade, Bruno Perret, Hervé Guillemin, Daniel Picque, Béatrice Desserre,
Marie-Christine Montel, and Georges Corrieu, Energy (2012). 222
C Foster, K Green, and M Bleda, (2007). 223
PH Nielsen, AM Nielsen, BP Weidema, R Dalgaard, and N Halberg, Draft version (2003). 224
M Elisabeth Sharpe, TF Fryer, and DG Smith, Identification methods for microbiologists, 233 (1979).
225 W Harrigan and MC Cance, (Academic Press. London).
226 H Forouhandeh, S Zununi Vahed, MS Hejazi, MR Nahaei, and M Akbari Dibavar, Curr. Res.
Bacteriol 3 (2), 84 (2010).

194
227 Wilkie F Harrigan, Laboratory methods in food microbiology. (Access Online via Elsevier,
1998). 228
Philipp Gerhardt, RGE Murray, RN Costilow, Eugene W Nester, Willis A Wood, NR Krieg, and G Briggs Phillips, (1981).
229 Robin Temmerman, Ilse Scheirlinck, Geert Huys, and Jean Swings, Appl. Environ. Microbiol.
69 (1), 220 (2003). 230
Ulrich K Laemmli, Nature 227 (5259), 680 (1970). 231
B David Hames, Gel Electrophoresis of Proteins: A Practical Approach: A Practical Approach. (Oxford University Press, 1998).
232 DG Pitcher, NA Saunders, and RJ Owen, Lett. Appl. Microbiol. 8 (4), 151 (1989).
233 Gerard Muyzer and Kornelia Smalla, Antonie Van Leeuwenhoek 73 (1), 127 (1998).
234 Matthew A Wikler, Performance standards for antimicrobial susceptibility testing: Sixteenth
informational supplement. (Clinical and Laboratory Standards Institute, 2006). 235
E Vlková, V Rada, P Popelářová, I Trojanová, and J Killer, Livestock Science 105 (1), 253 (2006).
236 Mami Anas, Henni Jamal Eddine, and Kihal Mebrouk, World J Dairy Food Sci 3 (2), 39
(2008). 237
Ebenezer Siaw Mante, Esther Sakyi-Dawson, and Wisdom Kofi Amoa-Awua, Int. J. Food Microbiol. 89 (1), 41 (2003).
238 I Mainville, Y Arcand, and ER Farnworth, Int. J. Food Microbiol. 99 (3), 287 (2005).
239 Yang Huang and Michelle C Adams, Int. J. Food Microbiol. 91 (3), 253 (2004).
240 NT Annan, AD Borza, and L Truelstrup Hansen, Food Res. Int. 41 (2), 184 (2008).
241 M Rosenberg, D Gutnick, and Ei Rosenberg, FEMS Microbiol. Lett. 9 (1), 29 (1980).
242 Jai K Kaushik, Ashutosh Kumar, Raj K Duary, Ashok K Mohanty, Sunita Grover, and Virender
K Batish, PloS one 4 (12), e8099 (2009). 243
B Del Re, B Sgorbati, M Miglioli, and D Palenzona, Lett. Appl. Microbiol. 31 (6), 438 (2000). 244
Juárez Tomás, B Wiese, and ME Nader‐Macías, J. Appl. Microbiol. 99 (6), 1383 (2005). 245
C Nexmann Jacobsen, V Rosenfeldt Nielsen, AE Hayford, PL Møller, KF Michaelsen, A Paerregaard, B Sandström, M Tvede, and M Jakobsen, Appl. Environ. Microbiol. 65 (11), 4949 (1999).
246 F Minervini, S Siragusa, M Faccia, F Dal Bello, M Gobbetti, and M De Angelis, J. Dairy Sci.
95 (2), 508 (2012). 247
RKA Feltham, ANNETTE K POWER, PATRICIA A PELL, and PHA Sneath, J. Appl. Microbiol. 44 (2), 313 (1978).
248 A CAREER AT FAO, Organización de Naciones Unidas: http://www. fao.
org/ag/locusts/en/info/info/index. html (2001). 249
W Horowitz, AOAC Washington DC (1980). 250
S Kirk and Ronald Sawyer, Pearson's composition and analysis of foods. (Longman Group Ltd., 1991).
251 K Muhammad, I Altaf, A Hanif, AA Anjum, and MY Tipu, The Journal of Animal and Plant
Sciences 19 (2), 74 (2009). 252
David M Barbano, J Joseph Yun, and Paul S Kindstedt, J. Dairy Sci. 77 (9), 2687 (1994). 253
Wiliam Horwitz, Recovery studies, 17th edn. Byrd Richmond, VA (2000). 254
RL Bradley, E Arnold, DM Barbano, RG Semerad, DE Smith, and BK Vines, Standard methods for the examination of dairy products 16, 433 (1992).
255 Henry V Atherton and John Alvin Newlander, Chemistry and testing of dairy products. (AVI
Publishing Co. Inc., 1977). 256
EP Feeney, TP Guinee, and PF Fox, J. Dairy Sci. 85 (7), 1646 (2002). 257
TP Guinee, EP Feeney, MAE Auty, and PF Fox, J. Dairy Sci. 85 (7), 1655 (2002). 258
Maria De Angelis, Silvia de Candia, Maria Piera Calasso, Michele Faccia, Timothy P Guinee, Maria C Simonetti, and Marco Gobbetti, Int. J. Food Microbiol. 125 (2), 123 (2008).
259 Suk Shin Kim and Santi R Bhowmik, J. Food Sci. 55 (4), 1008 (1990).
260 GEA Niro, (GEA Niro, Søborg, Denmark, 1978).
261 H Michael Wehr and Joseph F Frank, Standard methods for the examination of dairy
products. (American Public Health Association, 2004). 262
MA Drake, Y KARAGUL‐YUCEER, KR Cadwallader, GV Civille, and PS Tong, J. Sens. Stud.
18 (3), 199 (2003). 263
Seppo Salminen, Atte Von Wright, and Arthur Ouwehand, Lactic acid bacteria: microbiology and functional aspects. (Marcel Dekker, 2004).
264 Behboud Jafari, Ali Rezaie, and Siamak Alizadeh.

195
265 RE Buchanan and NE Gibbons, Baltimore, MD, 1246 (1974).
266 Annie Felten, Claude Barreau, Chantal Bizet, Philippe Henri Lagrange, and Alain Philippon,
J. Clin. Microbiol. 37 (3), 729 (1999). 267
MZ Hoque, F Akter, KM Hossain, MSM Rahman, MM Billah, and KMD Islam, World Journal of Dairy & Food Sciences 5 (1), 39 (2010).
268 T Setyawardani, WP Rahayu, R Maheswari, and NHS Palupi, Anim. Prod. 13 (1) (2011).
269 Anita Khanafari and Sepideh Hosseini Porgham, Jundishapur Journal of Microbiology 5 (4),
590 (2012). 270
T Ahmed and R Kanwal, Pakistan Veterinary Journal 24 (2), 87 (2004). 271
Aarti Bhardwaj, Monica Puniya, KPS Sangu, Sanjay Kumar, and Tejpal Dhewa, Research & Reviews: Journal of Dairy Science & Technology 1 (2) (2012).
272 Parvathy Seema Nair and Puthuvallil Kumaran Surendran, (2005).
273 A Leke, MB Romond, and C Mullie, Communicating Current Research and Educational
Topics and Trends in Applied Microbiology Available from: http://www. formatex. org/microbio/pdf/page s758-765. pdf (2007).
274 Ewa Wasilewska and Maria Bielecka, Polish journal of food and nutrition sciences 12, 90
(2003). 275
Nditange Shigwedha and Li Jia, (2013). 276
A Zinedine and M Faid, World J Dairy Food Sci 2, 28 (2007). 277
Danilo Ercolini, Giancarlo Moschetti, Giuseppe Blaiotta, and Salvatore Coppola, Syst. Appl. Microbiol. 24 (4), 610 (2001).
278 Sabine Kastner, Vincent Perreten, Helen Bleuler, Gabriel Hugenschmidt, Christophe Lacroix,
and Leo Meile, Syst. Appl. Microbiol. 29 (2), 145 (2006). 279
William P Charteris, Phillip M Kelly, Lorenzo Morelli, and J Kevin Collins, Journal of Food Protection® 64 (12), 2007 (2001).
280 M Zarazaga, Y Sáenz, A Portillo, C Tenorio, F Ruiz-Larrea, R Del Campo, F Baquero, and C
Torres, Antimicrobial agents and chemotherapy 43 (12), 3039 (1999). 281
Anja S Hummel, Christian Hertel, Wilhelm H Holzapfel, and Charles MAP Franz, Appl. Environ. Microbiol. 73 (3), 730 (2007).
282 Approved Standard, Wayne, PA: NCCLS (1997).
283 ED Simova, DB Beshkova, and Zh P Dimitrov, J. Appl. Microbiol. 106 (2), 692 (2009).
284 AH Soomro, T Masud, and Kiran Anwaar, Pakistan Journal of Nutrition 1 (1), 20 (2002).
285 A Yateem, MT Balba, T Al-Surrayai, B Al-Mutairi, and R Al-Daher, Int. J. Dairy Sci 3 (4), 194
(2008). 286
Houria Ouled-Haddar, Tayeb Idoui, Mohamed Sifour, Messaouda Guezira, and Messaouda Bouthabet, The Online Journal of Science and Technology 2 (1) (2012).
287 KB Vivek.
288 Kun‐Nan Chen, Ming‐Ju Chen, Je‐Ruel Liu, Chin‐Wen Lin, and Hsin‐Yi Chiu, J. Food Sci. 70
(5), M260 (2005). 289
S. K. Yeo and M. T. Liong, J. Sci. Food Agric. 90 (2), 267 (2010). 290
WK Ding and Nagendra P Shah, J. Food Sci. 74 (2), M100 (2009). 291
Adriano G Cruz, Adriane EC Antunes, Ana Lúcia OP Sousa, José AF Faria, and Susana MI Saad, Food Res. Int. 42 (9), 1233 (2009).
292 Jean‐Michel Rabanel, Xavier Banquy, Hamza Zouaoui, Mohamed Mokhtar, and Patrice
Hildgen, Biotechnol. Prog. 25 (4), 946 (2009). 293
Mohammed Akhiar and Nur Syarfa Aqilah, MMG 445 Basic Biotechnology eJournal 6 (1) (2010).
294 L Truelstrup Hansen, PM Allan-Wojtas, Y-L Jin, and AT Paulson, Food Microbiol. 19 (1), 35
(2002). 295
Wunwisa Krasaekoopt, Bhesh Bhandari, and Hilton Deeth, Int. Dairy J. 13 (1), 3 (2003). 296
Iole Pitino, Cinzia Lucia Randazzo, Giuseppina Mandalari, Alberto Lo Curto, Richard Martin Faulks, Yvan Le Marc, Carlo Bisignano, Cinzia Caggia, and Martin Sean John Wickham, Food Microbiol. 27 (8), 1121 (2010).
297 MD Sharp, Donald J McMahon, and JR Broadbent, J. Food Sci. 73 (7), M375 (2008).
298 Arnaud Picot and Christophe Lacroix, Int. Dairy J. 14 (6), 505 (2004).
299 Peter J Whorwell, Linda Altringer, Jorge Morel, Yvonne Bond, Duane Charbonneau, Liam
O'Mahony, Barry Kiely, Fergus Shanahan, and Eamonn MM Quigley, The American journal of gastroenterology 101 (7), 1581 (2006).
300 Ulrich Schillinger, Claudia Guigas, and Wilhelm Heinrich Holzapfel, Int. Dairy J. 15 (12), 1289
(2005).

196
301 Prisca Schär-Zammaretti and Job Ubbink, Biophys. J. 85 (6), 4076 (2003).
302 Huub HM Rijnaarts, Willem Norde, Edward J Bouwer, Johannes Lyklema, and Alexander JB
Zehnder, Appl. Environ. Microbiol. 59 (10), 3255 (1993). 303
K Ramiah, CA Van Reenen, and LMT Dicks, Int. J. Food Microbiol. 116 (3), 405 (2007). 304
Jos Boekhorst, Michiel Wels, Michiel Kleerebezem, and Roland J Siezen, Microbiology 152 (11), 3175 (2006).
305 Jos Boekhorst, Quinta Helmer, Michiel Kleerebezem, and Roland J Siezen, Microbiology 152
(1), 273 (2006). 306
L Vandevoorde, H Christiaens, and Willy Verstraete, J. Appl. Microbiol. 72 (3), 214 (1992). 307
Virginia S Ocaña and Maria Elena Nader-Macias, Br. J. Biomed. Sci. 59 (4), 183 (2001); Blaženka Kos, Jagoda Šušković, Snježana Vuković, Miljenko Šimpraga, Jadranka Frece, and Srećko Matošić, J. Appl. Microbiol. 94 (6), 981 (2003); C Cesena, L Morelli, M Alander, T Siljander, E Tuomola, S Salminen, T Mattila-Sandholm, T Vilpponen-Salmela, and A Von Wright, J. Dairy Sci. 84 (5), 1001 (2001).
308 Frederick J Angulo, Jeffrey T LeJeune, and Päivi J Rajala-Schultz, Clin. Infect. Dis. 48 (1), 93
(2009). 309
Ganesh Prabhakar Pradhan, Lokamanya Tilak. (National Book Trust, India, 1994). 310
Sarfraz Ahmad, Isabelle Gaucher, Florence Rousseau, Eric Beaucher, Michel Piot, Jean François Grongnet, and Frédéric Gaucheron, Food Chem. 106 (1), 11 (2008); NC GANGULI, (Austrália, 1992); Exequiel María Patiño, Rev. Vet. 15 (1), 1 (2004).
311 Patrick F Fox, Fundamentals of cheese science. (Springer, 2000).
312 Siew Kim Lee, Skelte Anema, and Henning Klostermeyer, Int. J. Food Sci. Tech. 39 (7), 763
(2004). 313
Jeremiah J Sheehan and Timothy P Guinee, Int. Dairy J. 14 (2), 161 (2004). 314
PROPERTIES OF MOZZARELLA CHEESE, UNIVERSITY OF AGRICULTURE, 2009. 315
H Mallatou and EC Pappa, Int. J. Dairy Technol. 58 (3), 158 (2005). 316
Amal Mohammed Ali and Kamal Awad Abdel-Razig, Pakistan Journal of Nutrition 10 (1), 65 (2011).
317 Anna Renda, David M Barbano, J Joseph Yun, Paul S Kindstedt, and Steven J Mulvaney, J.
Dairy Sci. 80 (9), 1901 (1997). 318
Robert L Fife, Donald J McMahon, and Craig J Oberg, J. Dairy Sci. 79 (11), 1903 (1996). 319
TP Guinee, EO Mulholland, J Kelly, and DJO Callaghan, J. Dairy Sci. 90 (1), 110 (2007). 320
JU McGregor and CH White, J. Dairy Sci. 73 (3), 571 (1990). 321
E Küçüköner and ZU Haque, Int. J. Dairy Technol. 59 (3), 166 (2006). 322
Christelle Lopez, Bénédicte Camier, and Jean-Yves Gassi, Int. Dairy J. 17 (3), 235 (2007). 323
Tahir Zahoor and Riaz Ahmad Rlaz, Pak. J. Agri. Sci 28 (2) (1991). 324
CA Brickley, MAE Auty, P Piraino, and PLH McSweeney, J. Food Sci. 72 (9), C483 (2007). 325
F Amárita, M De La Plaza, P Fernández de Palencia, T Requena, and C Peláez, Food Chem. 94 (2), 240 (2006).
326 MUHAMMAD RAMZAN, HUMA NUZHAT, MIHAELA TITA, and OVIDIU TITA, Acta
Universitatis Cibiniensis Series E: FOOD TECHNOLOGY 14 (1), 27 (2010). 327
TP Guinee, Int. J. Dairy Technol. 57 (2‐3), 99 (2004). 328
Paul LH McSweeney and Maria José Sousa, Le Lait 80 (3), 293 (2000). 329
NY Farkye, Cheese: Chemistry, Physics and Microbiology 2, 343 (2004). 330
Morsi A El Soda, FEMS Microbiol. Rev. 12 (1), 239 (1993). 331
Donald J McMahon, B Paulson, and CJ Oberg, J. Dairy Sci. 88 (11), 3754 (2005). 332
BY Kim, NA Bringe, and JE Kinsella, Food Hydrocolloids 4 (3), 239 (1990). 333
A Hassan, ME Johnson, and JA Lucey, J. Dairy Sci. 87 (4), 854 (2004). 334
Pieter Walstra, J. Dairy Sci. 73 (8), 1965 (1990). 335
Ciara E O'Reilly, Patrick M Murphy, Alan L Kelly, Timothy P Guinee, Mark AE Auty, and Thomas P Beresford, Innovative Food Science & Emerging Technologies 3 (1), 3 (2002).
336 P. Allan-Wojtas, E. R. Farnworth, H. W. Modler, and S. Carbyn, Microsc. Res. Tech. 36 (5),
390 (1997). 337
Rajiv I Dave, Pragati Sharma, and Donald J McMahon, Le Lait 83 (1), 61 (2003). 338
David M Barbano, Kathy Y Chu, JJ Yun, and PS Kindstedt, presented at the Annual Marschall Italian Cheese Seminar, Madison, WI, 1993 (unpublished).
339 J Joseph Yun, David M Barbano, and Paul S Kindstedt, J. Dairy Sci. 76 (12), 3648 (1993).
340 Marta Capellas, Montserrat Mor-Mur, Esther Sendra, Reyes Pla, and Buenaventura Guamis, Journal of Food Protection® 59 (6), 582 (1996).

197
341 PO Uaboi-Egbenni, PN Okolie, TI Akintunde, O Bisi-Johnson, L Enwe, and PO Bessong, Pakistan Journal of Nutrition 9 (9), 920 (2010).
342 R Karimi, S Sohrabvandi, and AM Mortazavian, Comprehensive Reviews in Food Science and Food Safety 11 (5), 437 (2012).
343 DL Van Hekken, MH Tunick, and YW Park, J. Dairy Sci. 88 (6), 1966 (2005). 344 Panyam Dinakar and VV Mistry, J. Dairy Sci. 77 (10), 2854 (1994). 345 Cynthia Hyppolito Jurkiewicz, Universidade de São Paulo. Faculdade de Ciências
Farmacêuticas, 1999. 346 LE Metzger, DM Barbano, PS Kindstedt, and MR Guo, J. Dairy Sci. 84 (6), 1348 (2001). 347 G Gardiner, RP Ross, JK Collins, G Fitzgerald, and C Stanton, Appl. Environ. Microbiol. 64 (6),
2192 (1998). 348 C Stanton, G Gardiner, PB Lynch, JK Collins, G Fitzgerald, and RP Ross, Int. Dairy J. 8 (5-6),
491 (1998). 349 F Ortakci and S Sert, J. Dairy Sci. (2012). 350 I. Mainville, Y. Arcand, and E. R. Farnworth, Int. J. Food Microbiol. 99 (3), 287 (2005). 351 Nuala M Rynne, Thomas P Beresford, Alan L Kelly, and Timothy P Guinee, Int. Dairy J. 14
(11), 989 (2004). 352 Yuh-Fun Maa, Phuong-Anh Nguyen, Theresa Sweeney, Steven J Shire, and Chung C Hsu,
Pharmaceutical research 16 (2), 249 (1999). 353 C Sonner, YF Maa, and G Lee, presented at the 3rd World Meeting on Pharmaceutics,
Biopharmaceutics & Pharmaceutical Technology, 2000 (unpublished). 354 K Al-Hakim and AGF Stapley, presented at the Proceedings of the 14th International Drying
Symposium (IDS 2004), 2004 (unpublished). 355 ADDITIFS ALIMENTAIRES DES NORMES DE PRODUITS and LA NGAA, (2012). 356 Md Kamrul Haque and Yrjö H Roos, Innovative Food Science & Emerging Technologies 7 (1),
62 (2006); Henry R Costantino, Laleh Firouzabadian, Chichih Wu, Karen G Carrasquillo, Kai Griebenow, Stephen E Zale, and Mark A Tracy, J. Pharm. Sci. 91 (2), 388 (2002); Yuh-Fun Maa, Phuong-Anh Nguyen, James D Andya, Nancy Dasovich, Theresa D Sweeney, Steven J Shire, and Chung C Hsu, Pharmaceutical research 15 (5), 768 (1998).
357 E Ananta, M Volkert, and D Knorr, Int. Dairy J. 15 (4), 399 (2005); BRIAN TO and MARK R ETZEL, J. Food Sci. 62 (3), 576 (1997).
358 FAO Joint, (2004). 359 Eva PROCHÁZKOVÁ, Jan HRABĚ, Jiří KREJČÍ, and Natalia ONIPCHENKO. 360 Ammara Hassan, Imran Amjad, and Shahid Mahmood, Asian Journal of Food and Agro-
Industry 2 (3), 434 (2009). 361 Mitra Mosharraf and Christer Nyström, Int. J. Pharm. 122 (1), 35 (1995). 362 JP Hindmarsh, AB Russell, and XD Chen, J. Food Eng. 78 (1), 136 (2007). 363 Samuel Rogers, Winston Duo Wu, Jonathan Saunders, and Xiao Dong Chen, Drying
Technology 26 (4), 404 (2008). 364 L. V. McFarland, Anaerobe 15 (6), 274 (2009). 365 Jean-Pierre Chouraqui, Louis-Dominique Van Egroo, and Marie-Claire Fichot, Journal of
pediatric gastroenterology and nutrition 38 (3), 288 (2004). 366 J. M. Saavedra and R. H. Yolken, Journal of pediatric gastroenterology and nutrition 44 (4),
509 (2007); Muhammad Irfan Masood, Muhammad Imran Qadir, Jafir Hussain Shirazi, and Ikram Ullah Khan, Crit. Rev. Microbiol. 37 (1), 91 (2011).
367 L MT Dicks and M Botes, Beneficial microbes 1 (1), 11 (2010); S. J. Allen, E. G. Martinez, G. V. Gregorio, and L. F. Dans, Cochrane database of systematic reviews (11), CD003048 (2010).
368 M. Roller, Y. Clune, K. Collins, G. Rechkemmer, and B. Watzl, The British journal of nutrition 97 (4), 676 (2007); Monika Roller, Gerhard Rechkemmer, and Bernhard Watzl, The journal of Nutrition 134 (1), 153 (2004); G Moro, I Minoli, M Mosca, S Fanaro, J Jelinek, B
198
Stahl, and G Boehm, Journal of pediatric gastroenterology and nutrition 34 (3), 291 (2002); J. Ghisolfi, M. Roberfroid, J. Rigo, G. Moro, and I. Polanco, Journal of pediatric gastroenterology and nutrition 35 (4), 467 (2002).
369 DL Watson, Australian Journal of Biological Sciences 33 (4), 403 (1980); J Xu, P Dennehy, H Keyserling, LE Westerman, Y Wang, RC Holman, JR Gentsch, RI Glass, and B Jiang, Clin. Diagn. Lab. Immunol. 12 (2), 273 (2005).
370 FO Uruakpa, MAH Ismond, and ENT Akobundu, Nutrition Research 22 (6), 755 (2002); AT Nagao, Friedlander‐Del Nero, C Arslanian, and MMS Carneiro‐Sampaio, Scand. J. Immunol. 53 (6), 602 (2001).
371 Greg Thoma, Jennie Popp, Darin Nutter, David Shonnard, Richard Ulrich, Marty Matlock, Dae Soo Kim, Zara Neiderman, Nathan Kemper, and Cashion East, Int. Dairy J. (2012).
372 Anwesha Sarkar, Lakshmi Dave, Anant Dave, and Shantanu Das, Sustainable Food Processing, 127 (2013).
373 HA Aguirre-Villegas, FX Milani, S Kraatz, and DJ Reinemann, Transactions of the ASABE 55 (2), 613 (2012).
374 SA Tassou, G De-Lille, and YT Ge, Applied Thermal Engineering 29 (8), 1467 (2009); James M Calm, International Journal of Refrigeration 25 (3), 293 (2002).
375 P Cinelli, Advances in Materials Science and Engineering 2013 (2013).

199
Annexure -I
Sensory Evaluation Form
Scorecard: 5 point Hedonic Scale
Judge Name:__________________________
Sample No.: __________________________
Date:______________
Note: Place a check in the appropriate column to indicate the placing deserved
score:
5= Preferable, 4= Good, 3= Acceptable, 2= Least acceptable, 1= Not acceptable
Sensory Evaluation Score Card
1 2 3 4 5 A. Appearance B. Flavour C. Texture D. Overall acceptability
comments:__________________________________________________________
___________________________________________________________________
_________________________________________________________________

200
Annexure -II
PUBLICATIONS FROM THIS THESIS
Published:
1. Ammara Hassan and M. Nawaz Chaudhry, Culture-dependent and culture-
independent techniques to identify lactic acid bacteria in fermented products.
African Journal of Microbiology Research Vol. 7(30), pp. 3983-3987, July
2013
Accepted:
2. Ammara Hassan, M. Nawaz Chaudhry and Barbara Rasco. Microencapsulation,
Survival and Adherence studies of Indigenous Probiotics. African Journal of
Microbiology Research Vol. 3(31), pp. xxxxx, March 2014
Submitted:
3. Ammara Hassan, M. Nawaz Chaudhry and Barbara Rasco. Quality and
efficacy studies of Probiotic whey preparations for treatment of acute
diarrhea in Infants: A Double- blind, Placebo-controlled, Randomized
study. International Journal of Clinical and
Experimental Medicine (waiting for an editor's final decision).
4. Ammara Hassan, M. Nawaz Chaudhry and Barbara Rasco. Incorporation of
probiotic indigenous cultures in the cheese and its Physicochemical,
Microbiological, rheological, sensory and functional characterization during
storage (Submitted).
5. Ammara Hassan, M. Nawaz Chaudhry, Barbara Rasco and Aadila Btaool. Life
cycle assessment (LCA) of Probiotics cheese manufacturing (Submitted).