eco-innovative measures in large swedish … measures in large swedish companies ... regenerative...
TRANSCRIPT

V I N N O V A A N A l y s I sV A 2 0 1 3 : 0 3
ECO-innOvativE MEasurEs in largE swEdish COMpaniEs
an invEntOry basEd On COMpany rEpOrts
B I r g I t B r u N k l A u s , J u t t A H I l d e N B r A N d & s t e V e N s A r A N s I N I- C H A l m e r s u N I V e r s I t y O f t e C H N O l O g y

VINNOVA´s publications are published at www.VINNOVA.se
Title: Eco-innovative Measures in large Swedish Companies - An inventory based on company reportsAuthor: Birgit Brunklaus, Jutta Hildenbrand & Steven Saransini - Chalmers University of TechnologySeries: VinnoVa analysis Va 2013:03ISBN: 978-91-86517-84-7ISSN: 1651-355XPublished: March 2013Publisher: VinnoVa - Swedish Governmental agency for innovation Systems/Verket för innovationssystemCase No: 2011-04036
VINNOVA - strengthening Sweden´s innovativeness
VINNOVA is Sweden’s innovation agency. Our mission is to promote sustainable growth by improving the conditions for innovation, as well as funding needs-driven research.
VINNOVA’s vision is for Sweden to be a world-leading country in research and innovation, an attractive place in which to invest and conduct business. We promote collaborations between companies, universities, research institutes and the public sector. We do this by stimulating a greater use of research, by making long-term investment in strong research and innovation milieus and by developing catalytic meeting places. VINNOVA’s activities also focus on strengthening international cooperation. In order to increase our impact, we are also dedicated to interacting with other research financiers and innovation-promoting organisations. Every year VINNOVA invests about SEK 2 billion in various initiatives.
VINNOVA is a Swedish government agency working under the Ministry of Enterprise, Energy and Communications and acts as the national contact agency for the EU Framework Programme for R&D. We are also the Swedish government’s expert agency within the field of innovation policy. VINNOVA was founded in January 2001. About 200 people work here and we have offices in Stockholm and Brussels. Our Director General is Charlotte Brogren.
The VINNOVA Analysis series includes publications of studies, analyses, official reports and evaluations that have been produced or commissioned by VINNOVA´s Operational Development Division.

Eco-innovative measures in large Swedish companies
An inventory based on company reports
by
Birgit Brunklaus, Jutta Hildenbrand & Steven Saransini
Chalmers University of Technology

Preface Operations at VINNOVA – the Swedish innovation agency – require a solid knowledge of the Swedish national, regional and sectorial systems for innovation in an international perspective. This includes knowledge of the stakeholders in the innovation system as well as their respective roles, global context, networks and innovation processes. The knowledge base is used in strategy processes, in dialogues with stakeholders in the innovation system, in operative activities and as a support during follow-up, evaluation and effect analyses of VINNOVA activities.
Within its framework of strategic monitoring VINNOVA has embarked on a series of analyses of trends for several branches of industry. Parameters examined include business structure, strategic areas for renewal and cooperation in research, and inno-vation. On-going or recently completed studies include: Life Science; Automotive; Chemicals; Mines and minerals; Metals; Maritime; Forest, pulp and paper; Information and communications technology; Environmental Technology and finally, Energy.
In order to address the complex concept of environmental aspects in industry and Environmental Technology, VINNOVA have tried to accomplish a more compre-hensive and complete picture by using three different methods creating three com-plementary images. The first method is to collect information about companies’ activities regarding environmental issues in all studies listed above. The second method is to analyse the industrial branch of Environmental Technology mentioned above. With the third method, represented by this study, eco-innovative measures among 100 large companies from 11 industries in Sweden are examined. Data from corporate annual reports has been gathered and analysed using a range of criteria that show what types of measures companies pursue in order to tackle environmental issues. The material in this study as well as the studies mentioned above is intended for use in strategic discussions by various stakeholders.
This analysis has been performed by a group of researchers at Chalmers University of Technology, Department of Civil and Environmental Engineering. Dr. Birgit Brunklaus is the project leader and is assistant professor in “Life Cycle Assessment for social systems”. Jutta Hildenbrand, is assistant professor in “Life cycle assessment for production systems” and Steven Sarasini, is a post-doc at the Department of Civil and Environmental Engineering.
VINNOVA in March 2013
Jonas Brändström Anna Sandström Chief Strategy Officer Senior Advisor Transport & Environment Division International Collaboration & Networks

Content
Summary ........................................................................................................... 7
Sammanfattning ............................................................................................... 8
1 Introduction ............................................................................................... 9 1.1 Classifying eco-innovations ............................................................................ 9 1.2 Defining eco-innovation ................................................................................ 10 1.3 Analysing eco-innovations ............................................................................ 12
2 Methods ................................................................................................... 16 2.1 Sample ........................................................................................................... 16 2.2 Data collection ............................................................................................... 17 2.3 Data analysis ................................................................................................. 18
3 Results and analysis ............................................................................... 20 3.1 Chemical producing companies .................................................................... 20 3.2 Consultancy and service companies .............................................................. 22 3.3 Retail companies ........................................................................................... 23 3.4 Food companies ............................................................................................. 25 3.5 Construction companies ................................................................................ 26 3.6 Electrics and electronics companies .............................................................. 28 3.7 Companies producing pulp, paper and wood products ................................. 30 3.8 Mining, metals, and material producing companies...................................... 32 3.9 Automotive companies .................................................................................. 34 3.10 Logistics and transport companies ................................................................ 38 3.11 Machinery and equipment companies ........................................................... 42 3.12 Summary of all industries ............................................................................. 47
4 Discussing eco-innovation measures ................................................... 50 4.1 Eco-innovation in general ............................................................................. 50 4.2 Drivers of eco-innovation .............................................................................. 50 4.3 Internal measures to change products and processes .................................... 50 4.4 Organisational measures ............................................................................... 51 4.5 User driven eco-innovation ........................................................................... 51 4.6 Eco-innovation via value chain interactions ................................................. 52 4.7 Eco-innovation via other external partners ................................................... 52 4.8 Conclusions and further research .................................................................. 53
Appendix ......................................................................................................... 55


7
Summary
The project examines eco-innovative measures among 100 large companies from 11 industries in Sweden. Data from corporate annual reports was gathered and analysed using a range of criteria that show what types of measures companies pursue in order to tackle environmental issues. These criteria range from internal measures, such as developing new products and processes, to measures that include the value chain and public/private partners that can help boost eco-innovation.
The study shows that the majority of companies see themselves as proactive and that their main focus vis-à-vis eco-innovation is on internal measures, with an emphasis on energy efficiency and renewable energy and materials. Examples of measures that focus on energy efficiency include effective lighting, insulation and lean production. Exam-ples of measures that focus on renewable energy measures include sourcing electricity based on wind, biomass and solar power. Examples of measures that focus on renew-able materials include bio- and organic-based products, or biomass-based production. The study highlights various eco-innovation measures that have the potential to bring about meaningful change, including “ZERO mission” (Skanska), the “One tonne life” project to create a climate smart household (ICA as partner), launch of a “left over dating” matchmaker service to find “dinner partners” with supplementary ingredients (Lantmännen), smart homes and cars (Semcon), smart application of technologies (ABB and Ericsson), smart grids to link homes, vehicles and users (Toyota), regenerative braking systems (SJ), “Zee-weed” membrane techniques for water treatment (ITT), biomass-based fuels of their own process (SCA), and light-weight materials (SSAB).
The study finds some evidence that drivers of eco-innovation range from business opportunities to costs and legislation. Companies in the construction and consultancy/ service groups, for instance, see environmental issues as a business opportunity. Gene-rally, companies note the importance of legislation such as REACH, and consumer demands as drivers of eco-innovation. However other companies in our sample rarely mention drivers. The study also shows that annual reports are sufficient for gathering general information on product development and production processes, while infor-mation regarding R&D is not always presented and needs to be supplemented with questionnaires and interviews. The project provides a starting point for further research on eco-innovation regarding the value chain, the consumers and the role of networks.
8
Sammanfattning
Eco-innovativa åtgärder i stora Svenska företag: En inventering baserad på företagsrapporter Projektet kartlägger miljöinnovativa åtgärder bland 100 stora företag från 11 branscher i Sverige. Data från företagens senaste årsredovisningar har samlats in 2012 och analyserats utifrån en rad kriterier som visar vilka typer av åtgärder företag bedriver för att åtgärda miljöproblem. Dessa kriterier varierar från interna åtgärder, såsom att utveckla nya produkter och processer till åtgärder som innefattar värdekedjan och offentliga/privata aktörer som kan bidra till att främja miljöinnovationer.
Studien visar att en majoritet av företagen ser sig själva som aktiva avseende miljö-aspekter. De flesta miljöinnovationer är baserade på interna åtgärder, främst när det gäller energieffektivitet, förnybar energi och material. Exempel på energieffektiva åtgärder är belysning, isolering av hus och lean produktion. Exempel på åtgärder inom energi är grön el baserad på vindkraft, biomassa och solenergi. Exempel på förnybara åtgärder för material är ekologiska produkter, eller produktion baserad på biomassa. Exempel på intressanta miljöinnovationer är exempelvis ”Zero Mission” (Skanska), projektet "one tonne life" för at främja klimatsmarta hushåll (ICA), kontakt tjänsten "restdejting" för att hitta ”middagspartner” med kompletterande ingredienser (Lantmännen), smarta hem och bilar (Semcon), smarta tillämpningar av teknik (ABB och Ericsson), smarta elnät för att länka hem, fordon och användare (Toyota), regenerativa bromssystemet (SJ), "Zee-weed" teknik (ITT), bränslen från biomassa baserad på sin egen process (SCA) och lättviktsmaterial (SSAB). Åtgärder i värdekedjan kopplas till krav vid upphandling, medan åtgärder som inkluderar konsumenter nämns mer sällan.
Drivkrafter för miljöinnovativa åtgärder handlar om allt från affärsmöjligheter till kostnad och lagstiftning. Företag inom bygg och konsult/tjänstesektorn har tagit upp miljöfrågorna som en affärsmöjlighet. Företag i allmänhet tar upp lagstiftning, såsom REACH, liksom konsumentkrav som drivkraft, medan företag inom fordons- och transportbranschen sällan nämner drivkrafter. Studien visar också att årsredovisningar är tillräckliga för att samla in information om produktutveckling och produktionspro-cesser, medan information om FoU inte presenteras i lika stor utsträckning och därför behöver information om sådana aspekter kompletteras via t ex intervjuer. Projektet ger avstamp till fortsatt forskning om miljöinnovationer med koppling till värdekedja, konsumenter och nätverkens roll.
9
1 Introduction
This report presents results from the project ‘Mapping environmental issues affecting R&D processes in companies with extensive operations in Sweden’ that was initiated by VINNOVA in November 2011 (Kartläggning av hur miljöaspekter påverkar FoU-processer i företag med omfattande verksamhet i Sverige, Diarienr. 2011-04036). The project was initiated as an explorative study to identify how large Swedish companies work with environmental issues, and particularly how environmental issues influence research and development. During early discussions with VINNOVA representatives we decided to analyse annual corporate reports and where applicable environmental/ sustainability reports as a means to collect information regarding large Swedish companies’ efforts vis-à-vis eco-innovation. VINNOVA initiated another study on Mapping Clean Tech Companies in Sweden that was completed in parallel with ours.
The main purpose of the project was to examine environmental activities in large Swedish companies in a comprehensive way. We decided to focus on companies’ efforts to reduce their environmental footprint, which includes R&D activities and product development where the main focus is reducing environmental impacts. We sought to address two research questions:
• What types of measures and activities do companies employ as a means to reduce their environmental impacts?
• What are the main drivers of eco-innovation in large companies?
In order to address these issues we developed a framework to examine eco-innovation from a company perspective. The framework provides the means to examine eco-innovation in quantitative and qualitative ways, and is described in the next section.
1.1 Classifying eco-innovations Schumpeter is frequently cited as a founding father of research on innovation. He defines innovation in terms of two key features – novelty and commercialisation:
“(1) The introduction of a new good – that is one with which consumers are not yet familiar – or of a new quality of a good. (2) The introduction of a new method of production, that is one not yet tested by experience in the branch of manufacture concerned, which need by no means be founded upon a discovery scientifically new, and can also exist in a new way of handling a commodity commercially. (3) The opening of a new market, that is a market into which the particular branch of manufacture of the country in question has not previously entered, whether or not this market has existed before. (4) The conquest of a new source of supply of raw materials or half-manufactured goods, again irrespective of whether this source

10
already exists or whether it has first to be created. (5) The carrying out of the new organisation of any industry, like the creation of a monopoly position (for example through trustification) or the breaking up of a monopoly position” (Schumpeter, 1934, p. 66).
Innovations are commonly classed in terms of products (goods or services) and processes (technical or organisational):
Figure 1.1: A taxonomy of innovations
Source: Edquist, 2001
Taken together, these definitions mean that innovations encompass the commercialisa-tion of new products and processes. The term commercialisation is related to economic transactions and is often taken to mean the first sale of a product or process on a market. The essence of novelty, however, is subject to broader debate with the term varyingly used to describe new to a market, new to a firm, new to an industry and so on. Here useful distinctions can be made between invention, innovation and diffusion/adoption. Invention is the ‘discovery’ of a new application related to a technological break-through, for instance, but which does not encompass commercialisation. Innovation includes the latter stage. Diffusion or adoption are terms that describe the spread of an innovation to a new area. Diffusion occurs when a technology that is “already imp-lemented in other firms and industries” OECD (2005: 34) is adopted by a new firm or industry.
1.2 Defining eco-innovation These features of innovation (novelty and commercialisation) underpin many aspects of research on eco-innovation. Eco-innovation is a relatively new term that is often used interchangeably with others such as environmental technology and eco-efficiency (Hellström, 2007). Environmental technologies can be defined as “technologies whose use is less environmental harmful than relevant alternatives” (Kemp and Foxon, 2007:2). Eco-innovation is broader in that it is not limited to technology, although definitions vary considerably. James (1997:53) defines eco-innovation as “new products and processes which provide customer and business value but significantly decrease environmental impacts”. Similarly, Carrillo-Hermosilla et al. (2009) define eco-innovation as “technological change in production processes and products”, and “change in the behaviour of individual users or organisations” that improves

11
environmental performance. Rennings (2000) offers a broader definition of eco-innovation as:
“…all measures of relevant actors (firms, politicians, unions, associations, churches, private households) which: develop new ideas, behavior, products and processes, apply or introduce them; and which contribute to a reduc-tion of environmental burdens or to ecologically specified sustainability targets”.
Note that the first two definitions by James (1997) and Carrillo-Hermosilla et al. (2009) contain references to novelty and commercialisation whereas that of Rennings (2000) does not. Rather than focusing on novelty and commercialisation, Rennings (2000) advocates a broader use of the term that focuses on reducing environmental impacts: “Eco-innovations can be developed by firms or non-profit organizations, they can be traded on markets or not, their nature can be technological, organizational, social or institutional”. By arguing that eco-innovations ‘can be traded on markets or not’ Rennings (see also Norberg-Bohm, 1999) deviates from traditional notions of inno-vation in order to include measures and activities that nonetheless reduce environmental impacts but which are not necessarily linked to economic transactions (e.g. car sharing). Whether such measures can be regarded as eco-innovations is somewhat questionable, although they are often supportive of the commercialisation of new environmental products and processes.
To confuse matters further, eco-innovation has been defined without regard for the reduction of environmental impacts. For instance, Andersen (2008) defines eco-innovations as:
“…innovations which are able to attract green rents on the market. The concept is closely related to competitiveness and makes no claim on the “greenness” of various innovations. The focus of eco-innovation research should be on the degree to which environmental issues are becoming integrated into the economic process. Eco-innovation research, then, analyses trends and dynamics in the greening of business strategies, markets, technologies and innovation systems” (p. 5, emphasis added).
Similarly, Kemp and Foxon (2007:5) argue that: “the widespread use of eco-innovations does not guarantee overall improvements in environmental quality”. This is because some eco-innovations which aim to improve resource efficiency are coupled to cost savings (via reduced energy use, for example) such that a ‘rebound effect’ occurs whereby efficiency gains are trounced by increased consumption. Kemp and Foxon (2007) thus describe eco-innovation in terms of innovations that are intended to reduce environmental impacts:
“Eco-innovation is the production, assimilation or exploitation of a novelty in products, production processes, services or in management and business methods, which aims, throughout its life cycle, to prevent or substantially

12
reduce environmental risk, pollution and other negative impacts of resources use (including energy use). Novelty and environmental aim are the two distinguishing features” (p.5, emphasis added).
On the issue of novelty, Hellström (2007) reminds us that innovations are traditionally classified as incremental versus radical (see Freeman and Soete, 1997). This aspect of innovation again draws on Schumpeter (1942) who noted that incremental innovations typically enhance existing competences whereas radical innovations destroy existing competences (this under the banner of the term ‘creative destruction’). Furthermore, Hellström (2007) argues that the conceptualisation of eco-innovations prevalent in the literature alludes to a bias towards incremental changes, perhaps owing to inductive reasoning and the fact that vested interests and existing policies tend to favour gradual not revolutionary change.
1.3 Analysing eco-innovations Together these aspects of the academic discourse on this topic highlight a latent need to examine eco-innovations from a systemic perspective. This is especially the case if the majority of eco-innovations are of an incremental nature and are complemented by negative feedbacks (a rebound effect) that in effect they do not reduce environmental impacts. One potential means to examine eco-innovation is thus in terms of systemic and modular innovation (Henderson and Clark, 1990), which has otherwise been described in terms of architectural and component innovations. Hellström (2007:150) describes these elements as follows:
“Component innovation takes place when one or more modules nested within a larger system are replaced, while the system itself stays intact. An architectural innovation on the other hand entails changing the overall system design and hence the way that the parts interact with each other”.
The main rationale for examining eco-innovation in this manner is that even where technological changes can potentially reduce environmental impacts, changes are also required in terms of the organisational and institutional systems within which innova-tion is embedded in order to realise environmental benefits. Hence system change requires that eco-innovations are of a radical and not incremental nature, as noted in figure 2. Furthermore, radical changes are coupled to both sustainability and competitiveness.
13
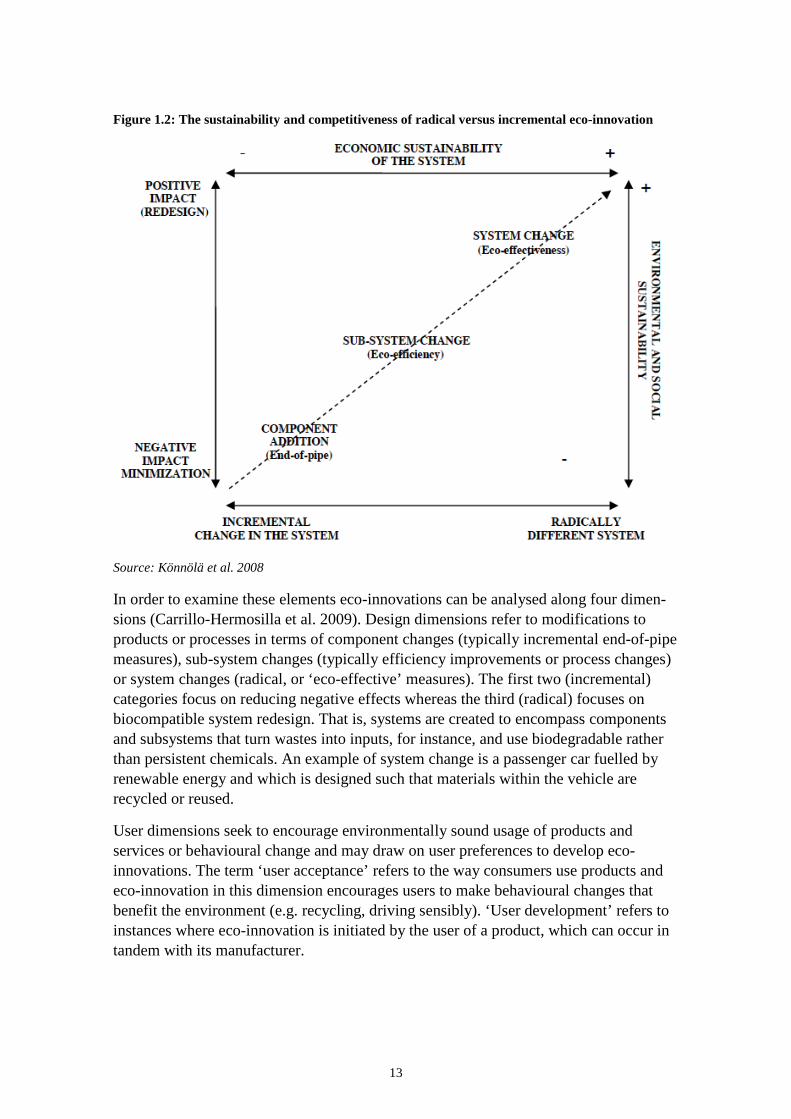
Figure 1.2: The sustainability and competitiveness of radical versus incremental eco-innovation
Source: Könnölä et al. 2008
In order to examine these elements eco-innovations can be analysed along four dimen-sions (Carrillo-Hermosilla et al. 2009). Design dimensions refer to modifications to products or processes in terms of component changes (typically incremental end-of-pipe measures), sub-system changes (typically efficiency improvements or process changes) or system changes (radical, or ‘eco-effective’ measures). The first two (incremental) categories focus on reducing negative effects whereas the third (radical) focuses on biocompatible system redesign. That is, systems are created to encompass components and subsystems that turn wastes into inputs, for instance, and use biodegradable rather than persistent chemicals. An example of system change is a passenger car fuelled by renewable energy and which is designed such that materials within the vehicle are recycled or reused.
User dimensions seek to encourage environmentally sound usage of products and services or behavioural change and may draw on user preferences to develop eco-innovations. The term ‘user acceptance’ refers to the way consumers use products and eco-innovation in this dimension encourages users to make behavioural changes that benefit the environment (e.g. recycling, driving sensibly). ‘User development’ refers to instances where eco-innovation is initiated by the user of a product, which can occur in tandem with its manufacturer.

14
In a narrow sense, product-service dimensions include the development of services to reduce the environmental impact of a particular product (e.g. energy efficiency services) and measures that stimulate eco-innovation in supply chains. Note that product-service dimensions and user dimensions may overlap. Carbon labels that display the amount of carbon dioxide embodied in a product can both encourage sustainable consumption and stimulate eco-innovation in the supply chain.
In a broader sense, product-service dimensions encompass “a marketable set of products and services capable of jointly fulfilling a user's needs” (Goedkoop et al, 1999). Here the focus is on the delivery of a function (e.g. electric car leasing) rather than individual products and is regarded as eco-innovation when it is designed with the aim of reducing environmental impacts. In some instances, product-service combinations harness supporting networks (e.g. networks rather than chains of suppliers) and infrastructure (e.g. electric car charging stations) to deliver this functionality (Mont 2002).
Table 1: Three dimensions of eco-innovations and related activities
Source: Könnölä et al. 2008

15
Governance refers to institutional or organisational measures that seek to “resolve conflicts over environmental resources in both the public and private sectors” (Könnölä et al. 2008). Governance at the institutional level refers typically to policy and its role in stimulating innovation in environmental technologies and overcoming technological lock-ins. At the business level governance can take many forms and typically includes relationships with key stakeholders such as governments that can assist in the removal of barriers to eco-innovation. Alternatively, firms may seek to work horizontally by creating new organisational structures that facilitate eco-innovation. Joint ventures between automakers and utility companies that aim to develop, test and demonstrate infrastructure for charging electric vehicles are an example of horizontal measures. These three dimensions are summarised in table 1.

16
2 Methods
In this chapter we present and describe our sample alongside our methods to collect and analyse data using an eco-innovation framework.
2.1 Sample Our sample includes large companies that operate in Sweden. We defined large companies in terms of numbers of employees. We also decided that the companies in our sample should perform R&D activities in Sweden and export at least some of their products. The complete inventory comprised 114 companies, of which 92 were examined. We excluded some companies mainly because of a lack of data regarding environmental measures in reports. One problem regarding our sample is that it includes multinational companies with operations in Sweden that are headquartered elsewhere. These companies did not always distinguish between measures that are relevant for Sweden and operations located in other countries. For instance, Outokumpu Oyj, Arla, Siemens and Smurfit Kappa Group have operations in Sweden but are headquartered elsewhere. Others such as Volvo Group and Vattenfall are headquartered in Sweden but have operations in foreign locations. Whilst we tried to focus on the Swedish elements of companies’ operations, some of the data presented here refer to companies’ operations in a wider context.
Since our analysis is based on annual reports, it is influenced by the level of detail companies are obliged to provide. Financial reports for international corporations can be consolidated to an extent that the contribution of operations in one country cannot be identified. We found several cases as regards companies based outside of Sweden where no report was provided, but there were at the same time hints that this is not due to a lack of measures – they were just not reported in the format we required.
We also observed that several brands which are well known in Sweden are subsidiaries in financial holdings, e.g. Findus is a subsidiary in the Lion/Gem holding based in Luxembourg. This also contributed to a lack of transparency in reporting.
We encountered similar problems regarding sustainability and environmental reports. These are voluntary publications. Whereas companies based in Sweden are forthcoming with this information, we found that companies headquartered elsewhere are often less transparent. This does not necessarily mean that those companies neglect sustainability issues, but that they do not publish comprehensive reports. Generally, sustainability and environmental reports are publicly available and target investor audiences and interested members of the public. Since reports are an instrument for external communication, they often lack detail regarding on-going research and development projects, whereas technical and organisational measures that reduce risks

17
for investors by ascertaining legal compliance and good standing with social stakeholders are generally covered.
Our initial aim was to include 100 companies in the sample. However, we could not find any reports for 8 companies (e.g. TitanX Engine Cooling AB, Gestamp HardTech Aktiebolag), which may be because of company structures (this set of companies includes foundations, holdings and companies not listed on the stock exchange). A further 14 companies reported only financial information, provided no English version of their report or insufficient environmental information and were thus excluded. Overall, we could not access sufficient data for 22 of the overall sample of 114 companies such that our final sample includes 92 companies.
As a first step in sorting the companies into industrial sectors, we used the first two digits of the SNI 2007 classification. Since this approach led to a large number of sector categories with few entries, we identified the main areas of business according to reports and company descriptions to create 11 categories that would allow the division in reasonably homogenous groups: chemical producing companies; consultancy and service companies; retail companies; food companies; construction companies; electrics and electronics companies; companies producing pulp, paper and wood products; mining, metals and material producing companies; automotive companies; logistics and transport companies; and machinery and equipment companies.
2.2 Data collection We employed two masters’ students to collect data in 2012. For all companies, annual reports and (where available) sustainability reports were retrieved from company websites. To ensure that company information was up-to-date, we used public sources (e.g. www.allabolag.se) to confirm data about corporate ownership, classification according to SNI 2007 and to estimate the number of employees. Data collection was based on the most recent reports available in July 2012. This includes in some cases reports from 2010, but for the most part 2011 reports were used.
Data regarding each eco-innovative measure were copied from reports in their original format and pasted and organised according to a template to facilitate a common proce-dure for further analysis (see table 2). The list of measures was then categorised using terms borrowed from the general management literature: internal measures, product development, vertical measures and horizontal measures. We also gathered information regarding companies’ business activities, main environmental problems and environ-mental policies. Where companies mentioned targets, drivers and other quantitative data related to eco-innovative measures we added them to bolster our dataset.
18
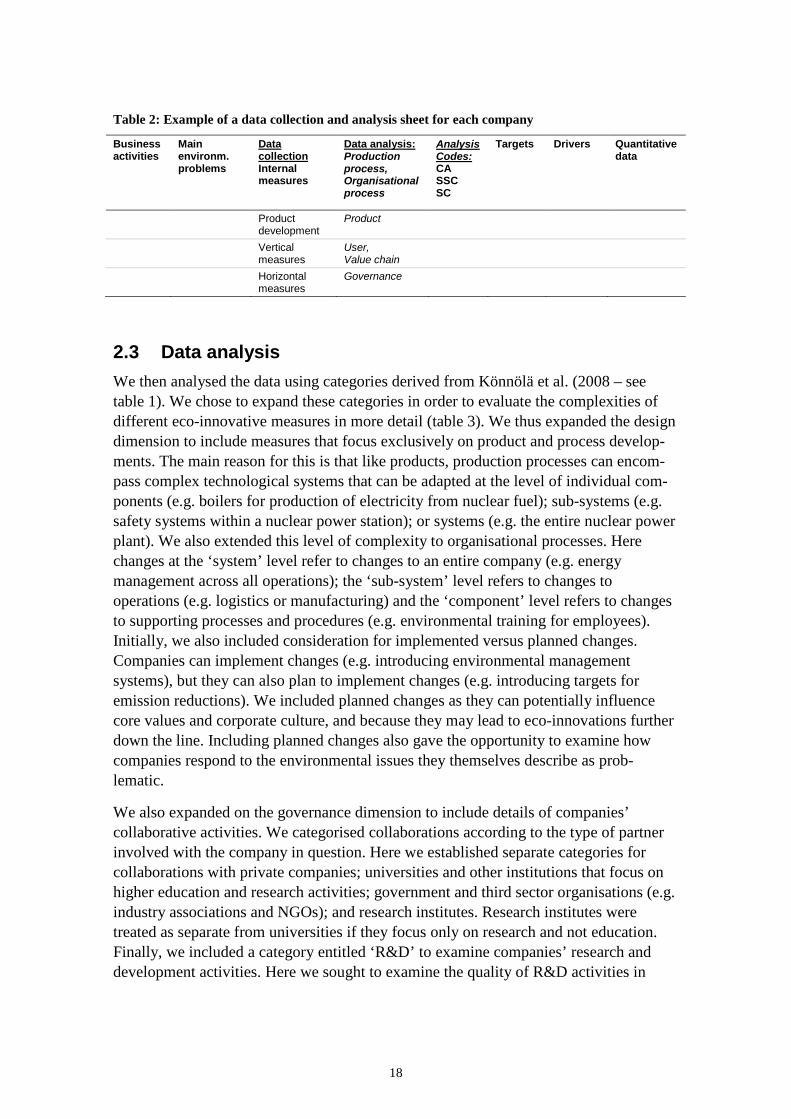
Table 2: Example of a data collection and analysis sheet for each company
Business activities
Main environm. problems
Data collection Internal measures
Data analysis: Production process, Organisational process
Analysis Codes: CA SSC SC
Targets Drivers Quantitative data
Product development
Product
Vertical measures
User, Value chain
Horizontal measures
Governance
2.3 Data analysis We then analysed the data using categories derived from Könnölä et al. (2008 – see table 1). We chose to expand these categories in order to evaluate the complexities of different eco-innovative measures in more detail (table 3). We thus expanded the design dimension to include measures that focus exclusively on product and process develop-ments. The main reason for this is that like products, production processes can encom-pass complex technological systems that can be adapted at the level of individual com-ponents (e.g. boilers for production of electricity from nuclear fuel); sub-systems (e.g. safety systems within a nuclear power station); or systems (e.g. the entire nuclear power plant). We also extended this level of complexity to organisational processes. Here changes at the ‘system’ level refer to changes to an entire company (e.g. energy management across all operations); the ‘sub-system’ level refers to changes to operations (e.g. logistics or manufacturing) and the ‘component’ level refers to changes to supporting processes and procedures (e.g. environmental training for employees). Initially, we also included consideration for implemented versus planned changes. Companies can implement changes (e.g. introducing environmental management systems), but they can also plan to implement changes (e.g. introducing targets for emission reductions). We included planned changes as they can potentially influence core values and corporate culture, and because they may lead to eco-innovations further down the line. Including planned changes also gave the opportunity to examine how companies respond to the environmental issues they themselves describe as prob-lematic.
We also expanded on the governance dimension to include details of companies’ collaborative activities. We categorised collaborations according to the type of partner involved with the company in question. Here we established separate categories for collaborations with private companies; universities and other institutions that focus on higher education and research activities; government and third sector organisations (e.g. industry associations and NGOs); and research institutes. Research institutes were treated as separate from universities if they focus only on research and not education. Finally, we included a category entitled ‘R&D’ to examine companies’ research and development activities. Here we sought to examine the quality of R&D activities in

19
terms of types of R&D (pilot/demonstration projects, gathering data from users, labora-tory tests etc.) and the focus of R&D activities (energy issues, emissions, chemicals and so on). We created codes for each of these categories, which are listed in table 3. Where information was available, we included consideration of novel measures and drivers of eco-innovative activities.
Table 3: Dimensions and categories of eco-innovative activities
Dimensions of eco innovation
Categories Codes Data collection
Codes Data analysis
Product Component change/addition CA-Pt-G CA – P Sub-system changes SSC-Pt-G SSC – P System changes SC-Pt-G SC – P
Production process Component change/addition CA-Ps-T CA –Ps Sub-system changes SSC-Ps-T SSC –Ps System changes SC-Ps-T SC – Ps
Organisational processes (implemented)
Supporting procedures and processes
SPP-IM Support
Operational measures OP-IM OP General policy and management GPM-IM GPM-IM
Organisational processes (planned)
Supporting procedures and processes
SPP-SI
Operational measures OP-SI General policy and management GPM-SI GPM-SI
User User acceptance UA User- initiative User development UD User – change
Value chain Product services PSD Service Other value chain (e.g. suppliers) VC VC
Governance Partnership with other private company
G-1-1 G – industry (i)
Partnership with university or similar
G-1-2 G – uni
Partnership with government/third sector (public private partnerships)
G-1-3 G – NGO (G or G-pp)
Partnership with research institute G-1-4 G - res inst Derived from Könnölä et al. 2008

20
3 Results and analysis
This section describes the main results of our study. In what follows we provide quanti-tative and qualitative data to describe eco-innovative measures among each group of companies: chemical producing companies; consultancy and service companies; retail companies; food companies; construction companies; electrics and electronics com-panies; companies producing pulp, paper and wood products; mining, metals and material producing companies; automotive companies; logistics and transport com-panies; and machinery and equipment companies.
3.1 Chemical producing companies The chemical industry sample consists of the following 8 companies: AstraZeneca, Akzo Nobel, Borealis, Perstorp, Swedish Match, Nolato, General Electric, and Trelleborg. Two companies are not included, Octapharma provided no environmental information and Trioplast provided only information on their websites (which included information on REACH, waste hierarchy and ISO 14001), but no formal report.
Figure 3.1: Eco-innovation measures in the chemical industry
Internal measures The chemical industry is working with the same effort on product related tasks and the production process (16% respectively 18%, figure 3.1), while more measures in the organizational process are reported. Those are mainly established due to general targets or programs: e.g. targets for greenhouse gas (Akzo Nobel), energy in production or fuel

21
consumption related to transports (Swedish Match), and group target and unit targets (Nolato). Energy efficiency measures are found in both product development and production processes. In the production processes, examples include lighting, heating and ventilation (Swedish Match and Nolato), and overall measures, such as lean manu-facturing (Perstorp). In the product development, examples are found to save energy, such as lightweight packaging (Swedish Match) and low friction seals for wind turbines and cars (Trelleborg). In product development, chemical companies are using also a systems approach, such as Biodiesel from rapeseed oil (Perstorp) or organic based snus (Swedish Match) or bio based plastics (Nolato). Some of the chemical companies state using LCA (AstraZeneca, Perstorp) and some state using a lean, or efficiency-based approach (Perstorp, Nolato).
The chemical companies focus on developing new products, such as low friction applications for wind power and cars (Trelleborg), as well as performing energy efficient measures in production units outside Sweden, such as lighting (Swedish Match).
External measures Companies in the chemical industry perform only energy measures with users (Akzo Nobel, Perstorp, Nolato, Trelleborg) and setting demands on suppliers by defining standards, such as Global Responsible Procurement standard (AstraZeneca), FSC (Akzo, Swedish Match) or Code of Conduct (Perstorp, Swedish Match). Measures with user participation are less common than within the value chain (3% and 6%, figure 3.1), while governance measures have a rather high count (16%, figure 3.1). Examples of governance measures are related to the UN Global Compact (AstraZeneca, Akzo Nobel, Nolato, Trelleborg) and the World Business Council for Sustainable Development (WBCSD) chemical group (Akzo) and water group (Borealis).
R&D activities R&D measures are mostly related to the use of hazardous chemicals and the search for alternative resources for product development, such as bio based or recycled materials (Nolato). Other environmental issues, such as energy, waste and water are related to production processes. The emphasis for measures related to the value chain is on social issues and ethics, less on environmental implications.
Drivers Drivers for eco-innovation are mainly the chemical legislation REACH and other regulations regarding, for example, volatile organic compounds VOC (5 out of 8 companies). Companies also described customer demands (3 out of 8) and cost reductions (3 out of 8) as drivers.
Novelties with potential Among the interesting developments for chemical companies are “Green IT” solutions such as video conference and virtual servers (Perstorp), “innovation programs” for

22
priority substances such as lead/cobalt/chromates (Akzo), and “learning partnerships” with Universities (Trelleborg).
3.2 Consultancy and service companies The consultancy/service sample consists of the following 7 companies: Sweco, IBM, WSP, ÅF, Semcon, Investment AB Kinnev, Securitas. Three companies are not included, Sven Tylens (no report), Svenska Rymd and Investment Latour (reports with insufficient information).
Figure 3.2: Eco-innovation measures in the consultancy/service
Internal measures Companies from the consultancy/service group focus mainly on product development (services) and organisational processes (28% respectively 22%, figure 3.2), e.g. offering service like concepts for energy efficiency, renewable energy solutions, effective traffic or waste water solutions (Sweco). Consultancy/service companies in the building indus-try often perform energy efficiency measures, such as additional insulation or ventila-tion (Sweco, WSP, ÅF), while companies in the electronic sector also perform smart solutions for vehicles and homes (Semcon) or provide energy efficient software and products (IBM). All consultancy/service companies are using a systems approach in production in form of renewable energy: biogas and wind (Sweco), solar power and electric vehicles (IBM), biomass and wind based electric power supply, combined heat and power plants (ÅF), and biogas fuelled cars and wind power stations (Semcon). Compared to energy measures, examples of water and material measures are found less often in companies’ reports (Sweco, IBM, WSP, ÅF, Semcon).

23
Some of the consultancy/service companies state using LCA (IBM, WSP) whilst others state using the lean or efficiency approach (IBM, Semcon).
External measures Companies in the consultancy/service business perform more users initiated measures than any other businesses (10 measures in total). Examples for measures with users are: new construction and renovation plan together with the client (Sweco), “IBM start Jam” on how to influence consumer behaviour (IBM), carbon tracking scheme for staff (WSP), always offer clients a green solution (ÅF), Volkswagen’s 1 litre car (Semcon), eco-friendly electricity and district heating for costumers (Investment AB Kinnev). More measures are found within the value chain and governance measures with indus-trial partners (16% resp. 13%, figure 3.2). Most examples are found in one company that works together with suppliers, for example the project to eliminate lead from products together with suppliers or the packaging redesign projects with suppliers (IBM).
The consultancy/service companies focus on developing new energy efficiency pro-ducts, especially in the building industry (Sweco, WSP, ÅF). These products are rarely spread on another market, with exception of new heat and power plants built in Turkey, Bulgaria or Russia (ÅF).
R&D activities R&D measures in most companies are related to product development and energy efficiency. IBM is active as regards several environmental issues, such as recycling and material innovation, and at several levels, such as operational, user and value chain level.
Drivers Drivers for eco-innovation measures are mainly environmental reasons, such as restore the environment (WSP), reduce hazardous waste (IBM), precaution to environmental changes (Investment AB Kinnev). Other examples are referring to business opportunity/ clients demands (Sweco, ÅF).
Novelties with potential Among the interesting activities reported for consultancy/service are geo IT (Sweco), eco patents and smart vehicles/homes/wind (Semcon).
3.3 Retail companies The retail sector sample consists only of 3 companies, the food retailer ICA, the pharmaceutical retailer Tamro and the textile retailer H&M. Ahlsell was excluded due to lack of information.

24
Figure 3.3: Eco-innovation measures in the retail sector
Internal measures Among the internal measures the retail sector is working mostly with the production process and organisational process (19% respectively 36%, figure 3.3)- Reported measures focus on e.g. energy efficiency and waste, but also include measures related to products on offer like organic food (ICA) and renewable or organic textiles (H&M). Besides energy efficiency measures for applications like lighting, refrigerators or logistics; all retail companies are using a systems approach in production, such as using renewable energy for transport (ICA), rail transport (H&M) or solar panels (ICA, Tamro, H&M).
Some of the retail companies focus on establishing new eco-products on the market (ICA) and other try to find new suppliers (H&M).
Some of the retail companies state using LCA or carbon footprint (ICA, H&M) and none use the lean or efficiency approach.
External measures Companies in the retail sector perform few measures with users, and rather many within the value chain regarding demands on suppliers (ICA putting demands on farmers, Code of Conduct within H&M) and governance measures with industrial partners and NGOs (3% resp 10% resp 20%, figure 3.3). Examples of NGOs are WWF for ICA and Tamro, and Greenpeace for H&M).
R&D activities R&D measures are not mentioned in the retail sector, since only a few measures are performed together with universities or research institutes, among those the project ‘one
25
tonne life’ to create a climate smart household together with Chalmers University of Technology (ICA) or “Mistra Fashion Future” (H&M).
Drivers Drivers for eco-innovation are mainly standards, regulations and initiatives (ICA, Tamro, H&M), and business survival (ICA).
Novelties with potential Among the interesting activities reported by retailers is the ‘One tonne life’ project to create a climate smart household (ICA as a partner). Another example is a concept called ‘eat soon’ – a label for food products nearing their expiration date. Products with the label are either sold at discounted prices or donated to charity projects. More exam-ples are a carbon offset for business travels used to finance wind farms in China (ICA), charging stations for electric cars at supermarkets (ICA), collecting garments for recycling in Switzerland (H&M), wash and care (H&M).
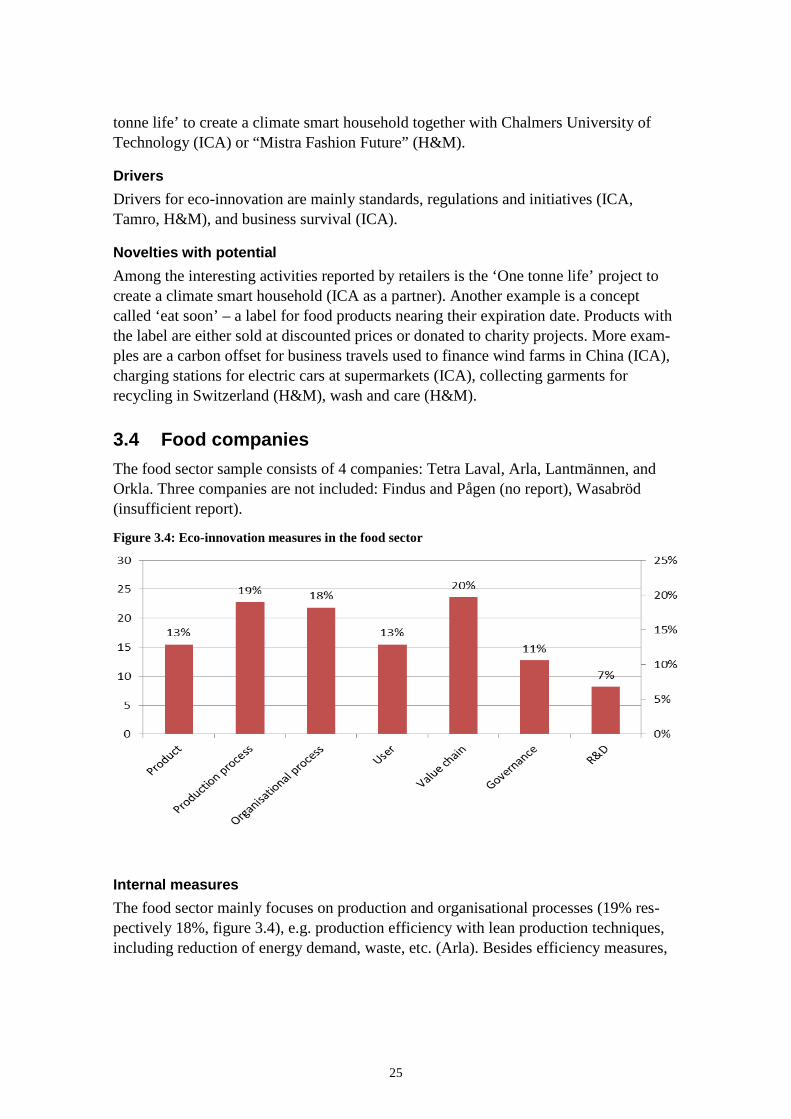
3.4 Food companies The food sector sample consists of 4 companies: Tetra Laval, Arla, Lantmännen, and Orkla. Three companies are not included: Findus and Pågen (no report), Wasabröd (insufficient report).
Figure 3.4: Eco-innovation measures in the food sector
Internal measures The food sector mainly focuses on production and organisational processes (19% res-pectively 18%, figure 3.4), e.g. production efficiency with lean production techniques, including reduction of energy demand, waste, etc. (Arla). Besides efficiency measures,

26
companies are using a systems approach to examine the life cycles of their products, from farming to consumer (Arla, Lantmännen).
The food sector companies are active in improving products’ environmental impact as well as in increasing the numbers of eco-products, while they are less active in different countries or markets.
Some of the food companies state using LCA/carbon footprint (Tetra Laval, Arla, Lantmännen) and one uses lean (Arla).
External measures Companies in the food sector perform more measures with users and a rather high percentage within the value chain and some governance measures with universities (13% resp 20% resp 11%, figure 3.4). Examples for measures with users and value chain are: making recycling easy for consumers (Tetra Laval), help farmers to reduce their impact (Arla), dialogue with consumers using blogs (Lantmännen), help customers with innovation projects (Orkla).
R&D activities R&D measures are mostly related to product development and environmental issues like renewable energy, agricultural practices and food production (Lantmännen). They occur on diverse levels, such as operations (internal), user, value chain (external) and university (governance) level.
Drivers
Drivers for eco-innovation measures are mainly cost reduction (Tetra Laval, Arla, Lantmännen, and Orkla), consumer demands (Arla, Lantmännen, Tetra Laval), safety (Tetra Laval, Lantmännen), and future growth/long term perspective (Arla, Orkla).
Novelties with potential Among the interesting activities reported for the food group are Bio PET (Tetra Laval), Zero waste initiative (Arla), Arla strategic innovation centre (Arla), innovation plat-form, blogs, launch of a ‘leftover dating’ matchmaker service to find dinner partners who offer complementary leftover ingredients that would otherwise be wasted, food prize innovation (Lantmännen), and innovation with consumer (Orkla).
3.5 Construction companies The construction group consists of 4 companies: Skanska, PEAB, NCC, all of which are mainly construction companies, while Saint Gobain is a construction consulting company.

27
Figure 3.5: Eco-innovation measures in the construction sector
Internal measures The construction group is working mostly on products and the organisational process (20% and 30% respectively, figure 3.5), e.g. mainly energy efficient housing, carbon issues and environmental classifications like LEED (PEAB, Skanska). All construction companies use efficiency measures, such as insulation or ventilation (Skanska, PEAB, NCC, Saint Gobain). Besides efficiency measures, more and more companies are using renewable energy such as solar panels, wind energy (Skanska, Saint Gobain) and fuel cells (Saint Gobain).
The construction group companies are active in energy efficient products (NCC, PEAB, and Saint Gobain), while only Skanska is active in different countries, like the UK.
Some of the construction companies state using LCA (NCC, PEAB) and none use the lean or efficiency approach.
External measures Companies in the construction group perform few measures with users, more within the value chain and even more governance measures with industrial partners (8% resp 10% resp 15%, figure 3.5). Most examples are reported by NCC and include helping cus-tomers to calculate their energy consumption or offering know-how and ideas on how tenants can act in an environmentally smarter way through choosing options with reduced energy demand (NCC).

28
R&D activities R&D measures are mostly related to product development and environmental issues like carbon in construction (Skanska), long life asphalt (NCC). R&D measures are rarely carried out with users (except NCC) or universities (except Saint Gobain).
Drivers Drivers for eco-innovation are mainly business opportunities (Skanska, PEAB, NCC, Saint Gobain) and regulation/rules, such as for energy or hazardous substances (Skanska, PEAB, Saint Gobain).
Among the interesting activities reported for the construction group are Skanska’s ‘ZERO’ concept for energy, unsustainable materials, hazardous materials, waste to land fill, water use (Skanska), the use of standards like LEEDS (Skanska, PEAB), tenants behaviour (NCC), eBook (Saint Gobain), variety of renewable energy products (Saint Gobain).
3.6 Electrics and electronics companies The electrics and electronics group sample consists of 10 companies. Three more com-panies (Colfax Corp/ESAB, Emerson and FLIR Systems) were identified from the list, but provided only reports with financial information according to the requirements of the U.S. Securities and Exchange Commission. Information about environmental measures is available on the websites, but not as a comprehensive environmental report. In one case, the board of directors unanimously recommended to vote against proposals for a sustainability report, the reason given by the board was that “preparing a sustain-ability report would not be a prudent use of our resources and in the best interests of our stockholders” (Emerson).
The remaining companies include ABB and Siemens (electrics and electronics, various purposes), Ascom, Ericsson, Sony and Telia Sonera (telecommunication, including infrastructure), Electrolux (home appliances and professional appliances), Elekta (medical equipment), Schneider Electric (energy specialist, services) and Vattenfall (utilities, electricity distribution). Although the sector is heterogeneous, all companies routinely develop and apply (high) technology to provide services and goods.
29
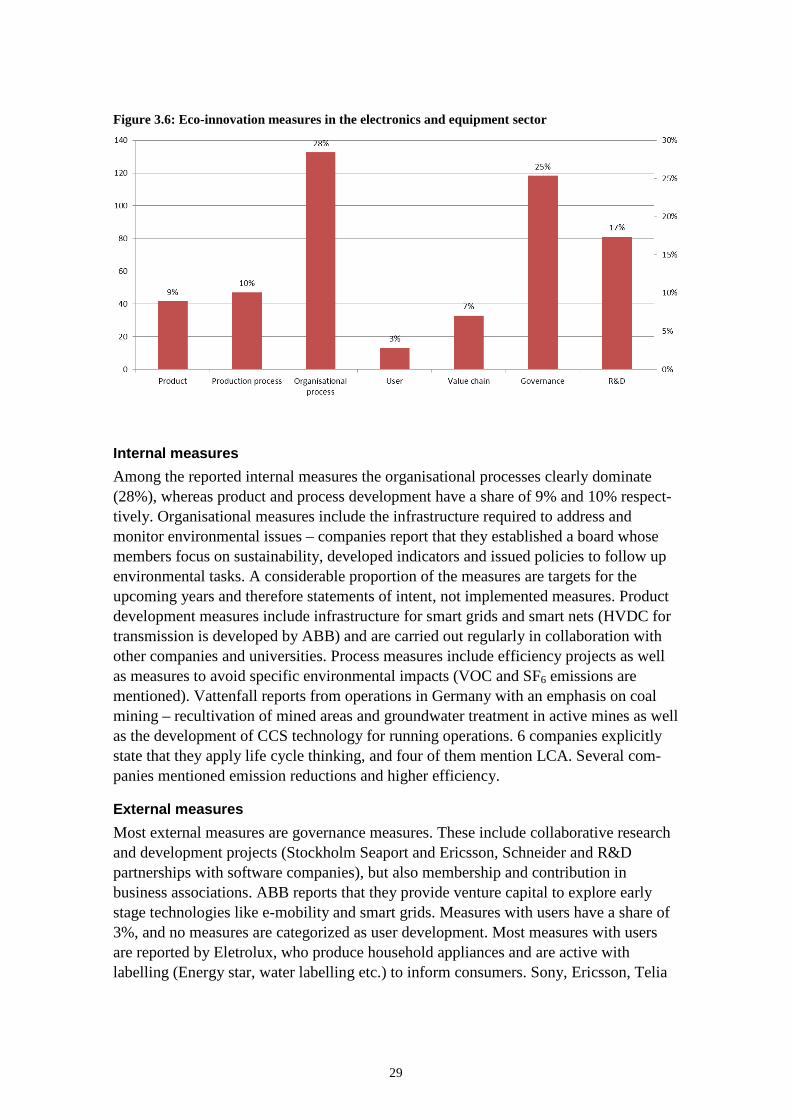
Figure 3.6: Eco-innovation measures in the electronics and equipment sector
Internal measures Among the reported internal measures the organisational processes clearly dominate (28%), whereas product and process development have a share of 9% and 10% respect-tively. Organisational measures include the infrastructure required to address and monitor environmental issues – companies report that they established a board whose members focus on sustainability, developed indicators and issued policies to follow up environmental tasks. A considerable proportion of the measures are targets for the upcoming years and therefore statements of intent, not implemented measures. Product development measures include infrastructure for smart grids and smart nets (HVDC for transmission is developed by ABB) and are carried out regularly in collaboration with other companies and universities. Process measures include efficiency projects as well as measures to avoid specific environmental impacts (VOC and SF6 emissions are mentioned). Vattenfall reports from operations in Germany with an emphasis on coal mining – recultivation of mined areas and groundwater treatment in active mines as well as the development of CCS technology for running operations. 6 companies explicitly state that they apply life cycle thinking, and four of them mention LCA. Several com-panies mentioned emission reductions and higher efficiency.
External measures Most external measures are governance measures. These include collaborative research and development projects (Stockholm Seaport and Ericsson, Schneider and R&D partnerships with software companies), but also membership and contribution in business associations. ABB reports that they provide venture capital to explore early stage technologies like e-mobility and smart grids. Measures with users have a share of 3%, and no measures are categorized as user development. Most measures with users are reported by Eletrolux, who produce household appliances and are active with labelling (Energy star, water labelling etc.) to inform consumers. Sony, Ericsson, Telia

30
and Vattenfall contribute with one count each in this activity area. Value chain measures have a share of 7%, with most measures reported from procurement and sourcing (code of conduct for suppliers: ABB, Elekta, Siemens, Sony, Telia, workshops and training: ABB, Elekta, Siemens, Telia). Vattenfall and Ericsson provide retail and industrial customers with support regarding energy efficiency measures, which is categorized as a product service development.
R&D activities R&D has a high share in this sector. The measures are related to environmental issues in various ways, including reduction of local environmental effects (VOC emissions from production processes as reported by ABB) and providing technology for energy-efficiency (ABB, Electrolux, Ericsson, Schneider, Siemens, Sony, Telia, Vattenfall). Product development is another area: Sony developed a plastic which uses more than 99% recycled materials and is blended with sulphur based flame retardant.
Drivers Drivers are mainly legislation, from local authorities to EU-wide legislation (WEEE, RoHS, energy standards). Consumer driven development is also mentioned (by 3 companies). EU regulations are mentioned several times.
Novelties with potential Interesting examples for this sector are linked to “smart” application of technology: sustainable cities (ABB and Ericsson: Stockholm Royal Seaport project with smart-grid solution, Volvo, Göteborg Energi, Victoria Institute, Ericsson: electric vehicle charging, smart power usage). Companies in telecommunication also mention projects that lower the environmental burden caused by short product use time. Sony developed a plastic which uses more than 99% recycled materials and is blended with a sulphur based flame retardant, thus reducing the emissions due to the manufacturing process and providing an application for plastic from discarded electronic products.
3.7 Companies producing pulp, paper and wood products The sector producing pulp, paper and wood consists of 10 companies. One more company (Domsjö Fabriker) was identified from the list, but provided only one sustainability report in 2010 (in Swedish) and was therefore excluded.
The remaining companies include Billerud, Metsä Board, Mölnlycke, SCA Pulp, Smurfit Kappa Group and Stora Enso (pulp and paper, cardboard packaging), Sveaskog and Södra Skogsägarna (forest, pulp) and Gustav Kähr and IKEA (wood flooring and furniture). IKEA’s report is not directed towards investors, but is mainly a document to inform customers. The group is slightly heterogeneous, but all companies routinely use wood to provide goods.

31
Figure 3.7: Eco-innovation measures in the pulp, paper and wood products sector
Internal measures Most reported measures are organisational measures (36%), followed by production processes (18%) and product development (10%). Organisational measures include the structure that is required to monitor environmental implications (management systems and indicators for example at Metsä, Smurfit Kappa). Several companies report using biomass from their own processes (bark, black liquor) to replace fossil fuel, thus changing production systems and also providing surplus heat to external users (SCA, Smurfit Kappa, Sveaskog). Several companies also mention investment in efficient production processes. Product development is related to new packaging solutions (Billerud, Mölnlycke, SCA) and also new FSC-certified flooring (Gustav Kähr).
Several product development measures are mentioned, and lighter packaging and chemical free conservation are visible examples. A special distinction between different markets is not included, though SCA reports several efficiency measures specifically for their UK-based mills.
Process efficiency achieved by used excess heat and combining heat and power is important for several companies. Application of an LCA approach is only mentioned by 3 companies in their reports (Metsä, Mölnlycke, Smurfit Kappa).
32
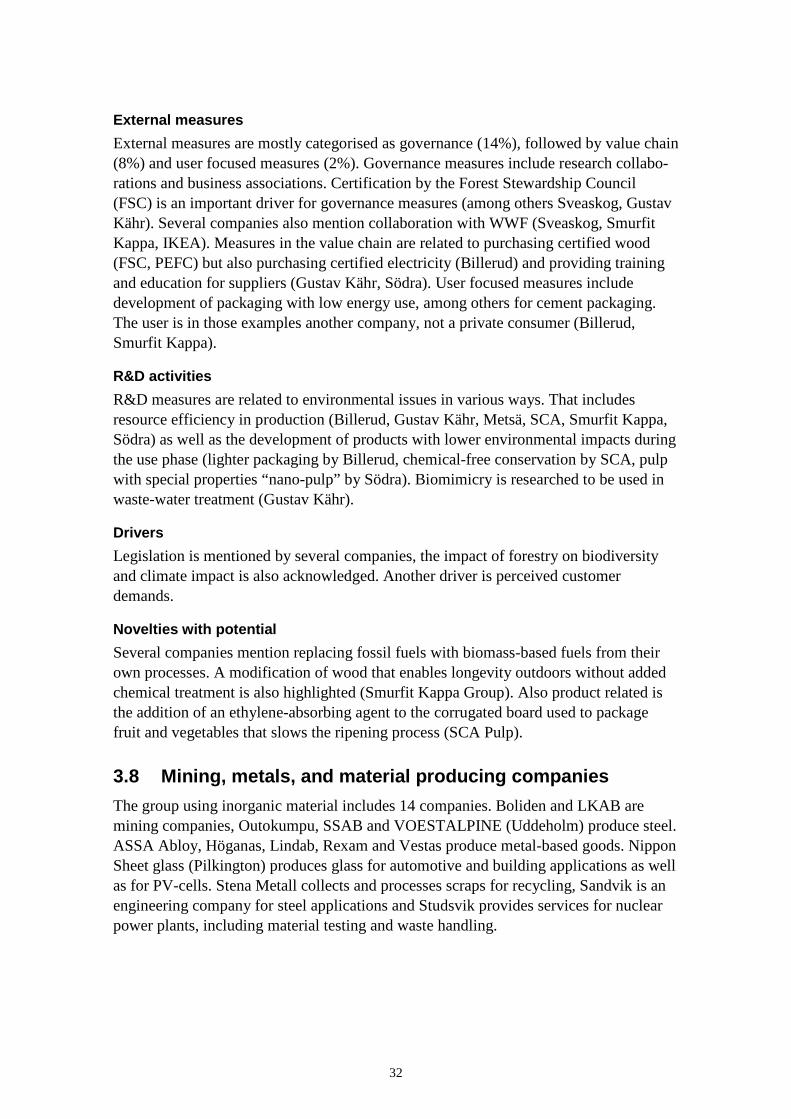
External measures External measures are mostly categorised as governance (14%), followed by value chain (8%) and user focused measures (2%). Governance measures include research collabo-rations and business associations. Certification by the Forest Stewardship Council (FSC) is an important driver for governance measures (among others Sveaskog, Gustav Kähr). Several companies also mention collaboration with WWF (Sveaskog, Smurfit Kappa, IKEA). Measures in the value chain are related to purchasing certified wood (FSC, PEFC) but also purchasing certified electricity (Billerud) and providing training and education for suppliers (Gustav Kähr, Södra). User focused measures include development of packaging with low energy use, among others for cement packaging. The user is in those examples another company, not a private consumer (Billerud, Smurfit Kappa).
R&D activities R&D measures are related to environmental issues in various ways. That includes resource efficiency in production (Billerud, Gustav Kähr, Metsä, SCA, Smurfit Kappa, Södra) as well as the development of products with lower environmental impacts during the use phase (lighter packaging by Billerud, chemical-free conservation by SCA, pulp with special properties “nano-pulp” by Södra). Biomimicry is researched to be used in waste-water treatment (Gustav Kähr).
Drivers Legislation is mentioned by several companies, the impact of forestry on biodiversity and climate impact is also acknowledged. Another driver is perceived customer demands.
Novelties with potential Several companies mention replacing fossil fuels with biomass-based fuels from their own processes. A modification of wood that enables longevity outdoors without added chemical treatment is also highlighted (Smurfit Kappa Group). Also product related is the addition of an ethylene-absorbing agent to the corrugated board used to package fruit and vegetables that slows the ripening process (SCA Pulp).
3.8 Mining, metals, and material producing companies The group using inorganic material includes 14 companies. Boliden and LKAB are mining companies, Outokumpu, SSAB and VOESTALPINE (Uddeholm) produce steel. ASSA Abloy, Höganas, Lindab, Rexam and Vestas produce metal-based goods. Nippon Sheet glass (Pilkington) produces glass for automotive and building applications as well as for PV-cells. Stena Metall collects and processes scraps for recycling, Sandvik is an engineering company for steel applications and Studsvik provides services for nuclear power plants, including material testing and waste handling.

33
Figure 3.8: Eco-innovation measures in the mining, metals and other materials group
Internal measures Most reported measures are organisational measures (33%), followed by production measures (18%) and product measures (12%). The reported measures are mostly add-ressing specific environmental issues whereas an overarching systems approach is less often applied. Organisational measures however address a wider range of operations; the reported measures include implementation of codes of conduct, indicators and policies required for following up environmental performance. Production measures target various emissions from specific plants and cover a wide range from paving gravel roads to exchanging fuels (albeit not with renewable sources). Product measures are reported for applications of glass (Pilkington) and metal products with modified mate-rial properties (lightweight with high strength by SSAB; from recycled material by Stena Metall). 6 companies report life cycle approaches. Efficient resource and energy use is a topic for all companies throughout the group, in several cases also referring to the production of energy efficient products for their customers.
External measures Governance measures dominate (14%), followed by value chain measures (5%), and only few user-oriented measures (1%) are mentioned. Governance measures include organisation in business associations that address the group’s specific energy intense operations. Collaborations and dialogue with authorities and NGOs are about as frequently reported as research activities with universities.

34
R&D activities R&D addresses energy demand during the use phase (ASSA Abloy, Lindab), materials with low environmental impact and process efficiency (Höganas), resource efficiency and closing loops (LKAB, Outokumpu, Stena Metall).
Drivers Legislation is mentioned by several companies, and this includes local authorities as well as the EU, particularly the Emission Trading Scheme (ETS). Also mentioned are statements regarding cost efficiency and contributions to save resources.
Novelties with potential Product development measures with a life cycle perspective including lightweight materials (SSAB) and low emissivity glass (Pilkington) are mentioned. The focus is on the use phase of the product and the energy demand during this phase. Improved recyc-ling processes providing high quality secondary material is another focus (Stena Metall).
3.9 Automotive companies 9 companies from our overall sample are described here as automotive companies. These are: Autoliv, Gnutti, Haldex, Kongsberg, Toyota, SAAB, Volkswagen, Volvo Cars and the Volvo group. These companies operate within different markets for automobiles, and are either automakers themselves or suppliers to the automotive industry. TitanX and Gestamp do not provide reports and were therefore excluded. The reports by Robert Bosch and GKN driveline are aggregated and allow no conclusion for Swedish activities and are therefore also not included.
Main environmental issues The main environmental issues identified by companies in this group are use of resources and raw materials (7 companies), climate change (6 companies), emissions to air and water (6 companies), waste (6 companies), energy consumption in both the production and use phase (5 companies), chemical usage (4 companies), resource use (3 companies), safety (1 company), noise (1 company), biodiversity (1 company) and urban congestion (1 company).
Measures to tackle these issues Overall, companies in this group made reference to 268 environmental measures, of which 56 were described as novelties.
Internal measures Changes to organisational processes In comparison to other sectors, companies within this group made relatively few statements to reflect general policies and management approaches (1.1% of 268 measures). These statements show that companies in this group are keen to advocate a

35
holistic approach to tackling environmental problems by focusing comprehensively on their operations and through dialogues with stakeholders. Similarly, relatively few statements of intent regarding operations were noted (4.1%). These measures focused mainly on energy efficiency within company operations or related to products. Both Volvo and Volkswagen include targets to increase the energy efficiency of their pro-ducts. Only one statement of intent related to supporting procedures and processes and included an emissions target for logistical operations (Volkswagen).
Few measures were recorded related to organisational process changes at the level of the entire company (1.5% of 268 measures). Two companies (Volvo Cars and SAAB) introduced a code of conduct, whereas Toyota introduced ‘climate accounting’ and the Volvo Group established a group-wide CSR strategy. Companies from this group were much more active in terms of organisational process changes at the operational level (11.6% of 268 measures) than other aspects of their eco-innovative activities. The most common measures in this category are related to environmental management systems and ISO14001 certification. Other significant activities related to CSR routines and activities were mentioned, and the energy efficiency of production facilities also featured. 7.5% of the overall measures recorded for this group encompass organisational changes to supporting procedures and processes. The most common type of measure is related to the use of renewable energy within production and manufacturing. Companies also mentioned activities that seek to reduce the use of water in manufacturing and have established routines that seek to incorporate consideration of environment impacts at the product development stage.
Changes to products Companies within this group are most active in terms of technological changes to pro-ducts. Relatively few changes within this category are related to changes to components in products (3% of 268 measures). Here, measures focused mainly on the introduction of new materials to various ends, such as the development of wood fibre doors to reduce fossil fuel dependency (Volvo Cars) and the introduction of nanostructured compounds to reduce weight (Volvo Group). The most populated category involves sub-system level product changes (21% of overall measures). Measures in this category focus mainly on products’ energy efficiency, emissions, weight and use of raw materials. Several examples include the electrification or hybridisation of vehicles to improve energy efficiency and reduce emissions. Measures in this category also focus on the increased use of renewable fuels to reduce fossil fuel dependency. For instance, in 2011 the Volvo Group separately launched trucks based on hybrid and methane-diesel tech-nologies. Significant focus is also given to reducing weight and waste via the use of lightweight recyclable materials. The inclusion of weight reduction as a means of increasing energy efficiency in vehicles’ use phase suggests that to an extent companies from this group approach eco-innovation in the holistic way described above.
These companies noted very few systemic product changes (1.5% of 268 measures). The inclusion of measures as systemic changes depends to an extent on companies’

36
position in the value chain. For instance, Volvo Cars’ introduction of an all-electric car can be considered here as a systemic change given its role as an automaker that has historically focused on vehicles with internal combustion engines. Similarly, Haldex, which deals mainly as a supplier of braking systems to the automotive industry intro-duced an electromechanical braking system, which allows for improvements in terms of energy efficiency and safety. Whilst the braking system encompasses a sub-system change for an automaker such as Volvo Cars, it represents a system-level product change for Haldex since its main activities are limited to supplying braking systems. Another notable system level product change is Toyota’s provision of smart grids to link homes, vehicles and users.
Changes to production processes Companies from this group rather surprisingly reported on few technological process changes. 3% of the group’s overall measures focus on technological process changes at the component level. These include energy saving measures such as automatic lighting systems (Autoliv) and efforts to improve the management of hazardous substances such as treatment systems for wastewater (Gnutti). Slightly more technological changes to processes were made at the sub system level (5% of 268 measures). These measures variously focused on energy, emissions, recycling and the use of chemicals in manufac-turing processes. SAAB, for example, introduced a new IT tool to monitor the use of chemicals in all of its products.
External measures Changes involving users Similar to others, this group of companies reported on few measures that involve users as the source of eco-innovations. 1.9% of 268 measures fall under the user-acceptance category and only one company noted measures that can assist in user-driven innova-tions (1.5% of 268 measures): the Volvo Group noted that it has a database system (‘ecolution’) for user feedback, which produces useful information for product development.
Changes involving the value chain Companies in this group reported on significantly more measures related to the product-service dimension (5.2% of 268 measures) than the types of eco-innovative measures described hitherto. Two companies (Scania and Volkswagen) noted that they provide training on eco-driving for their customers. Two companies have also provided car-sharing services (Volvo Group and Volkswagen). Measures in this category typically involve the use of ICT to provide different types of services to users. These include services that allow users to calculate CO2 emissions associated with driving and use ‘infrastructure and transport solutions’ in a more efficient way (both Volvo Group) and smart grid technology (Toyota).
Companies were also more active in terms of measures that focus on the value chain (6.7%). The most common type of measure is related to the assessment of suppliers
37
according to environmental criteria. Assessments were in some instances linked to imposing a code of conduct for suppliers, which also featured significantly and often comprised the selection of suppliers with environmental management systems with ISO14001 certification. Whilst these measures suggest arm’s length relationships with upstream suppliers, other efforts that focused specifically on energy and emissions involved closer downstream collaborations. Toyota, for instance, has established a ‘sustainable retailer programme’ that aims to reduce energy use and emissions by introducing energy-saving lighting and sourcing electricity from renewable sources. However closer collaborative involvements with organisations in the value chain are the exception not the rule, suggesting that some opportunities for innovation have not been realised.
Governance changes In terms of governance, the majority of collaborations involve private-private partner-ships (6% of 268 measures). Aside from memberships in numerous industry associa-tions, companies have established notable partnerships that focus on hybrid and electric vehicles. For instance, Kongsberg launched a joint venture with QRTECH that focuses on hybrid and electric drivelines, and Volvo Cars launched a ‘strategic cooperation’ with Siemens that focuses on “electrical drive technology, power electronics and charging technology”. Another notable collaboration in the field of electromobility is Haldex’s participation in a European research project called ‘HAVEit’, which resulted in the electromechanical braking system mentioned above. The project included other suppliers to the automotive industry along with research institutes.
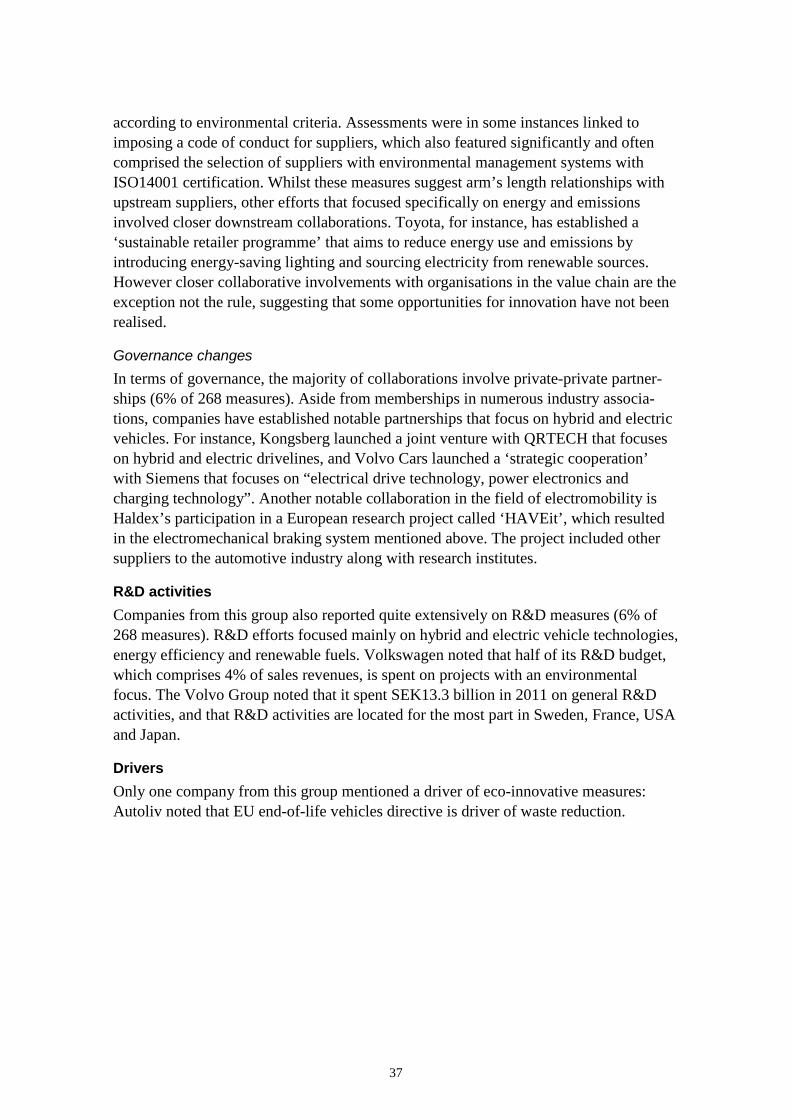
R&D activities Companies from this group also reported quite extensively on R&D measures (6% of 268 measures). R&D efforts focused mainly on hybrid and electric vehicle technologies, energy efficiency and renewable fuels. Volkswagen noted that half of its R&D budget, which comprises 4% of sales revenues, is spent on projects with an environmental focus. The Volvo Group noted that it spent SEK13.3 billion in 2011 on general R&D activities, and that R&D activities are located for the most part in Sweden, France, USA and Japan.
Drivers Only one company from this group mentioned a driver of eco-innovative measures: Autoliv noted that EU end-of-life vehicles directive is driver of waste reduction.

38
Figure 3.9: Eco-innovative measures among automotive companies
3.10 Logistics and transport companies Six companies from our overall sample are described here as logistics and transport companies. These are: Green Cargo, Posten Norden, Posten Norge, Schenker, SJ and Stena. All of these companies have operations that focus on logistics and the transport of freight, goods and/or people. They collectively utilise different means of transport-tation including road, rail air and sea. One exception within the group is Stena which, in addition to logistics, is also involved in property development.
Main environmental problems The companies in this group note that their main environmental concerns are related to climatic impacts (two companies), emissions to air including carbon dioxide (four companies), use of fossil fuels (two companies), energy consumption (five companies), water consumption (two companies) and waste (two companies).
Measures to tackle these issues Together this group of companies mentioned 168 measures related to eco-innovation, of which only 6 were described as novel. Collectively these companies reported eco-innovations related to process changes, value chain measures and governance activities and reported no changes to products or measures that involve users.
Internal measures Changes to organisational processes The most frequently mentioned activities are related to general policy and management of the companies (15.5% of 168 overall measures). Here the companies in question are

39
keen to emphasise their environmental responsibilities, where they pledge to work continually on environmental issues with various stakeholders. Companies tend to frame environmental responsibilities as core values, and they occasionally pledge to become industry leaders on sustainability issues. For instance, Postnord claims that it is at “the forefront of the industry in reducing impact on the climate”. Companies occasionally make reference to competitive gains that can be made from tackling environmental issues, and they frequently refer to efficiency measures.
Companies from this group listed various other statements of intent that focus on operational changes (4.2% of 168 overall measures) and supporting processes and procedures (4.8%). At the operational level, companies have vowed to reduce paper waste (SJ) and have varyingly set targets for renewable electricity production (PostNord) and to reduce fuel consumption (Posten Norge). At the level of supporting processes and procedures companies have set targets to increase the number of electric vehicles in the logistics fleet (Posten Norge); aim to raise environmental awareness among, and provide training to employees (Posten Norge, SJ) and have planned investments for new logistics centres (Posten Norge).
These companies have also made various organisational changes that are perhaps supported by the statements of intent described above. The majority of these changes occur at the level of supporting processes and procedures (11.9% of 168 overall measures); with fewer at the operational level (10.1%) and fewer still at the level of the entire company (4.8%). At the level of supporting processes and procedures, most measures focus on employee training and awareness raising activities such as Posten Norge’s ‘environmental diploma’. One notable and novel measure is that of Posten Norden, which has invested in a ‘climate fund’ that enables employees to create their own proposals to help reduce climatic impacts within the company’s operations. Similarly, SJ has introduced an environment blog to stimulate dialogue among employees and Stena has established an innovation initiative that seeks to glean proposals from employees. At the company level, measures are mostly focused on environmental management systems that have implemented throughout the entire company. SJ, DB Schenker and Posten Norden have achieved ISO14001 certification for all their operations.
Changes to products Companies within this group did not mention any product changes in terms of goods. This is probably due to the fact that their main products are in fact services related to the transportation of people and goods. Their main environmental impacts are related to processes and particularly the technologies and fuels used in logistical operations. Hence the bulk of their environmental activities focus on these areas. The most commonly implemented measures focus on technological changes to processes at the sub-system level. These measures amounted to 14.3% of companies’ overall environ-mental efforts. The majority of these measures have improved the efficiency of these companies’ logistical operations, and include measures such as rolling out new trains

40
equipped with lighter and recyclable materials and technologies such as LED lighting (SJ); the introduction of new locomotives equipped with more efficient engines (Green Cargo); increased use of renewable energy (various); introduction of electric vehicles (Posten Norge); and production and deployment of more efficient tanker vessels (Stena). The fact that this is the main focus area for environmental improvement is reflected in companies’ R&D efforts. The majority of R&D efforts are focused on technological process changes at the sub-system level, including efforts to test renew-able fuels (Stena, Posten Norden and DB Schenker) and electric vehicles (Posten Norden) alongside various R&D projects that aim to improve energy efficiency.
Changes to production processes Companies within this group also made various technological process changes that focused on changes to components within their logistical operations. Overall these measures amounted to 7.1% of their overall activities. Whilst the overall result of these measures was often cited to be efficiency gains, making them similar in effect to sub-system changes, the actual measures were focused more on component changes, such as the introduction of regenerative braking systems (SJ) and fuel switching (Postnord). SJ appears to be particularly meticulous in its approach to improving efficiency having noted that its carriages are equipped with eco-labelled materials that are easy to clean, thus reducing waste.
It is also notable that none of the companies in this group noted technological process changes of a more systemic nature. Hence despite claims that these companies are in pursuit of environmental leadership and that they are ‘already green’, none had found ways to radically redesign their logistical operations in an eco-effective rather than eco-efficient manner. However it may be the case that such technological opportunities simply do not exist, or that the associated capital costs together with these companies’ vested interests pose too much of an obstacle to realising such changes. The extent to which these companies really are ‘already green’ would perhaps shed light on the necessity of such changes.
External measures Changes involving users Another source of concern is that companies from this group did not mention any initiatives involving users as the source of eco-innovations. Whether it is really the case that these companies do not pursue user-driven eco-innovation is an issue that requires further research. However, it is likely that opportunities exist in this area, at least with regard to efficiency gains and the use of logistical services. Yet the absence of R&D measures that investigate such opportunities suggests that companies from this group do not emphasise users as a source of reduced environmental impacts.
Notwithstanding, these companies do provide a range of product-services that can potentially help users reduce their environmental impacts. Companies have established a range of digital services such as Green Cargo’s online environmental impact

41
calculator, which provides comprehensive information on the environmental impacts of transportation services. Another example of digitisation lies with SJ, which has intro-duced e-ticketing as a means to save paper. Posten Norge also offers a service to customers to ensure climate neutrality for goods deliveries.
Changes involving the value chain As regards measures with suppliers, companies from this group were rather vague in that they mostly reported on active dialogues with and standard setting for suppliers on different types of environmental issues, including waste, chemicals, emissions and energy use. The most concrete measures relate to sourcing renewable electricity and fuels, which are noted by the majority of companies in this group.
Governance changes On governance, measures include participation in joint research projects with other companies, universities and government agencies (SJ); funding from government authorities for key investments (Green Cargo); and membership/participation in wider forums such as the Global Compact and the Swedish Partnership for Global Responsibility (SJ).
R&D activities The companies in this group reported quite extensively on their R&D activities (10% of their overall measures). Several companies mentioned R&D that focuses on the use of alternative fuels such as methanol, DME, LNG, ‘evolution diesel’ (based on pine oil) and electricity in their transport fleets. Others mentioned measures linked to the development and testing of new vehicles (Posten Norge) and vessels (Stena) that can reduce environmental burdens. Several R&D activities were performed in collaboration with external partners such as suppliers (Schenker) and innovative networks that include companies from other industries (Posten Norge and Posten Norden).
Drivers The companies in this group did not mention any notable drivers for the measures.

42
Figure 3.10: Eco-innovative measures among logistics and transport companies
3.11 Machinery and equipment companies 17 companies from our overall sample are described here as machinery and equipment companies. These are: Alfa Laval, Atlas Copco, Atlet, Bombardier, Camfil, Emhart, Fläkt, Getinge, Husqvarna, ITT, Kockum, Komatsu Forest, Metso, Micronic Mydata, NIBE, Systemair and SKF. These companies develop and manufacture machinery and equipment for a range of uses, including mining, construction, transportation, health-care, heating, ventilation, electronics, and for extracting, processing or distributing other resources such as pulp and paper, water, and fossil fuels. Despite the fact that these companies each operate in different markets, the commonality between these companies is that they each rely heavily on engineering competences.
The report by Åkers was excluded due to brevity and lack of information on environ-mental issues; Munters does not provide a report.
Main environmental problems The companies in this group note that their main environmental concerns are related to energy and resource consumption (14), use of chemicals (6), climatic impacts (9), waste (3), logistics (1), use of raw materials (7), biodiversity (1), emissions to air, water and/or soil (5), noise (1), use phase of products (2), and safety (1).
Measures to tackle these issues Together these companies identified 407 measures to tackle environmental problems, of which 116 were noted for their novelty.

43
Internal measures Changes to organisational processes In terms of general policy and management statements, companies in this group are keen to emphasise the links between environmental and financial sustainability, fre-quently referring to sustainability as a driver for innovation (e.g. Kockums), techno-logical leadership (e.g. Metso) and competitiveness (e.g. Fläkt Woods). Sustainability is generally referred to as a business responsibility, and some companies note that they have internalised societal and legislative pressures to become more environmentally friendly. Furthermore, in statements that reflect their core values and long-term objectives, companies make numerous references to efficiency, both in terms of creating products that are efficient during the use-phase and in terms of the efficiency of processes in production and manufacturing. Some references are made to stakeholders, particularly customers and employees, as key elements in an ‘ethical’ approach to sustainability.
As regards operational changes, companies reported relatively few measures that influence their entire company (1.2%). Reported measures focus on consolidating sustainability practices within companies. For instance, NIBE reviewed its work on sustainable development and developed a new code of conduct, whereas Camfil and Bombardier organised conferences to encourage employees to share information on best practices related to sustainability. The companies in this group were much more active in terms of organisational changes at the operational level (9.8%). The most common measures are related to environmental management systems and ISO14001 certification, which the companies are applying increasingly to various parts of their operations. Companies from this group have also outlined various changes to routines related to product development and typically emphasise the way that environmental concerns have been integrated into product development routines. For instance, Bombardier reported that it has invested in Design for Environment by providing training in DfE for 900 engineers. Similarly, Getinge reported that it has implemented procedures for eco-design principles to be integrated throughout operations that focus on product develop-ment. Other notable measures in this category include ITT’s ‘Let’s solve Water’ campaign, which invites employees to contribute innovative ideas for new product development and Bombardier’s ‘Green Fund’ campaign, which invites employees to contribute with ideas for products with better energy efficiency and reduced environ-mental footprint. Like those described above, measures in this category focus mainly on energy and emissions, though waste, safety and chemicals also feature. As regards the latter, Alfa Laval has introduced a ‘chemical black list’ where chemicals must be eliminated entirely within three years of their inclusion.
Companies from this group have been active in terms of organisational changes in the form of supporting processes and procedures (8.1% of 407 measures). These measures most commonly focus on energy, emissions and chemical use. As regards energy, SKF reported that they have chosen to adhere to the US Green Building Council’s ‘Leader-ship in Energy and Environmental Design’ standard for new buildings, and Alfa Laval

44
reported that it had completed 54 energy saving projects in 34 factories between 2008-2011. As regards chemicals, several companies noted that they had implemented measures in conjunction with REACH legislation. For instance, Bombardier launched ‘REACH working groups’ and SKF established a ‘designated steering group to communicate REACH demands inside and outside the company’. Companies also noted several changes related to the way they report and evaluate CSR issues.
Changes to products The main focus area for this group is sub-system changes to products in the form of newly manufactured goods (17.2% of the overall 407 measures). Approximately half of the changes refer to improvements in the energy efficiency of these products, which range from heat pumps (NIBE), disinfection units (ITT), battery-powered tools (Husqvarna), air filters (Camfil), propulsions systems (Bombardier), drill rigs (Atlas), hydraulic excavators (Komatsu), and air-handling units (Fläkt). Roughly one quarter of the products developed by these companies also sought to reduce emissions during the use phase, and to a lesser extent products focused on reducing waste, the use of chemicals, water and other raw materials. In other words, eco-innovative measures at the level of product development focused mainly on providing efficiency gains related to the main environmental issues these companies identified as theirs.
In comparison to sub-system changes to products, companies from this group made very few component changes (0.2% of 407 measures) and no measures that encompassed system-level changes were recorded. However this finding may be slightly erroneous given the authors’ lack of technical knowledge regarding these companies’ products. This problem was confounded by a lack of information provided in annual reports, which made it difficult to assess whether efficiency changes were the result of changes to components or sub-systems. Further research is required to address this issue, and requires detailed knowledge of the technologies in question.
Changes to production processes Companies did report significantly on component changes to existing technological processes related to the manufacture of goods (9.6% of 407 measures). Again most of these efforts were made to improve energy efficiency, and in some instances to reduce waste and the use of harmful chemicals. The types of measures noted here are mostly related to changes to technical components within manufacturing, including the installation of heat pumps at manufacturing facilities (micronic and NIBE); the introduction of automated lighting systems (micronic); and the replacement of furnaces and ventilation systems (NIBE). The focus on energy efficiency is again reflected in technological process changes at the sub-system level, which comprised 2.5% of the overall 407 measures. Here the companies from this group have implemented new subsystems within production facilities, including new water-cooling and compressed air systems and automation within production (all NIBE). None of the companies in this group reported on technological process changes that encompass the systemic level.

45
External measures Changes involving users Despite the fact that companies from this group identify customers as a key and important stakeholder in their efforts to become more environmentally sustainable, measures focused on the inclusion of users as a source for innovation were extremely few (2.5% of 407 measures). In terms of user acceptance, only two measures were mentioned in reports: Atlas Copco noted that it has a target for increasing customers’ energy efficiency by 20% before 2020, and Camfil provides advice for customers on the most energy efficient air filters. This focus on energy efficiency is also reflected in user-driven innovations. For example, Systemair has worked together with Skanska Healthcare to develop ‘the most energy-efficient hospital in the world’, in Solna. Companies were similarly active in terms of the product-service dimension (2.5% of 407 measures) having established a range of measures to inform customers of the environmental impacts of various products. Notable exceptions include Atlas Copco’s product take-back scheme, where the company refurbishes and resells used equipment, and ‘Getinge Online’ – a system that helps users monitor and optimise the operational status of its equipment during use.
Changes involving the value chain Companies from this group were much more active in establishing measures within their supply chains (7.6% of 407 measures). The most common type of measure within this category involves companies sharing and/or imposing their own code of conduct with the supply chain. Companies are also keen to assess and evaluate suppliers’ efforts to make environmental improvements, and in some instances companies require that suppliers have implemented their own environmental management systems with ISO14001 certification. There are also a few examples where companies mention dialogues with suppliers but only one instance of a company examining opportunities for innovation with its suppliers (Fläkt Woods). Together these findings suggest that companies within this group do to an extent collaborate with suppliers but that the full range of opportunities has perhaps not been sufficiently explored or perhaps such collaborations exist but are not described in the analysed reports.
Governance changes As regards governance measures, which account for around 10% of these companies’ overall activities, four companies are involved in the UN Global Compact (Kockums, Bombardier, Atlas Copco and Alfa Laval). Governance activities are evenly divided between partnerships with public, private and third sector actors. Those with univer-sities and other companies typically focus on innovation and competitiveness and tend to harness complementarities that can boost product development. For instance, Systemair notes that close collaboration with universities and research institutes both in Sweden and abroad ‘provides valuable experience in a series of research sectors’ and ITT has partnered with GE to distribute ‘ZeeWeed’ technologies (membrane tech-nologies and products used to treat wastewater). As regards ties with the Third sector,

46
companies from this group report on participation in the Carbon Disclosure Project and other sustainability indices such as the Dow Jones sustainability index. Companies also mentioned some efforts to establish multi-stakeholder dialogues. Camfil, for instance, noted that such activities have been established in order to build consensus on policy issues within the EU.
R&D activities Surprisingly, companies in this group reported very narrowly on their R&D efforts (1.7% of 407 measures). Those that were mentioned focused on renewable energy, materials, energy efficiency and water use. Further research is required to examine the full range of R&D activities within this group, both in terms of the content and direction of R&D and companies main research partners.
Drivers Companies from this group reported on various drivers of their environmental activities. Drivers were not typically related to specific measures and were instead mentioned in a more general way. Examples of drivers include customer demands, and some instances other stakeholders. However most attention was given to legislative drivers such as REACH, CAFÉ, and EU Directives that focus on efficient buildings, VOCs, waste and CO2 emissions.
Figure 3.11: Eco-innovative measures among machinery and equipment companies

47
3.12 Summary of all industries The overall analysis consists of 92 companies: chemicals (8), consultancy/service (7), Retail (3), Food (4), construction (4) electric and electronics (10), pulp, paper and wood (10), Mining, metals and materials (14), automotives (9), logistics and transport (6), Machinery and equipment (17). The groups and examples are found in table 4. The results of the overall analysis can be found in figure 3.12.
Table 4: Type of sector, number of companies and examples
Sector Companies Examples
Chemicals 8 Astra, Akzo, Perstorp
Consultancy/services 7 IBM, WSP, Sweco, ÅF
Retail 3 ICA, H&M
Food 4 Arla, TetraLaval
Construction 4 Skanska, NCC
Electric and Electronics 10 ABB, Ericsson, Telia Sonera, Vattenfall, Electrolux
Pulp, paper and wood 10 Ikea, Stora Enso, SCA
Mining, metals and other materials 14 Stena Metall, SSAB
Automotives 9 Autoliv, Toyota, VW, Volvo
Logistics and Transports 6 SJ, Stena, Posten, Green Cargo
Machinery and equipment 17 Alfa Laval, Nibe, SKF
Internal measures As regards internal measures, the large Swedish companies that feature in this study focus roughly equally on developing new products and on making changes to produc-tion processes. The balance between product and process innovations shifts between companies depending on the types of products they offer (goods or services) and as regards to the main source of environmental degradation (i.e. in the production or use phase). Companies from groups that focus on chemicals, consultancy, and construction are more product-oriented and typically focus on making environmental improvements via different product applications using LCA, for instance. In contrast, service and production companies (e.g. logistics and transport) tend to focus more on efficiency whereas retailing and construction companies do not. Whilst this may appear to be an obvious and logical finding, it also provides practitioners with a nuanced understanding in that different industry sectors require different types of support in reducing their environmental impacts.
Our findings also suggest that the companies that feature in this study focus mostly on changes to organisational processes (see figure 3.12). Many of these measures are related to actual implemented practices that reduce environmental burdens (e.g. energy efficiency measures) and companies appear to increasingly engage with measures such as renewable energies or renewable materials. The latter reflect eco-innovative

48
measures at a more radical, systemic level that can potentially bring about effective rather than efficient changes. However, a large proportion of organisational process changes are related to targets and statements of intended changes rather than implemented changes. We included these in our study because they have the potential to shape and influence organisational cultures, for instance, but with the risk that our findings overly state the importance of statements of intent. This is in part due to the fact that we examined corporate reports, which are intended to communicate a positive image of the company in question to their various stakeholders.
Figure 3.12: Overall eco-innovation measures
External measures Overall, and as regards eco-innovative measures that involve external partners, the large Swedish companies that feature in this study cited fewest measures with users, more with the value chain and most in terms of governance measures (figure 3.12).
On the whole companies appear to work very infrequently with users. This came as something of a surprise given that users have been highlighted as a strong source of innovation and given that they offer great potential to reduce the environmental impacts of products during the use-phase. Two exceptions appear to be the food and construc-tion groups, which are much more active in terms of user engagement, especially as regards changing the way users utilise products. This may be because companies from the food and construction groups have successfully identified the potential to reduce environmental impacts during the use-phase. Alternatively it may be because companies from other groups did not report significantly on their interactions with users.
Companies reported on interactions with the value chain in a divergent way. Some groups were more active in terms of eco-innovative measures that deliver product services to downstream value chain actors whereas others focused more on activities with actors that are upstream in the value chain. On the whole companies were mode-

49
rately active as regards measures that involve the value chain, although the food group was much more active than the rest. This may be due the fact that companies do not report on value chain measures in a comprehensive fashion, or it may be due to the fact that they have not identified the potential for working with the value chain to make environmental improvements.
As regards governance measures, companies generally appear to work to roughly the same extent with industrial partners and universities. However, the mining, metals and other materials and the automotive groups appears to partner more with universities than others. In contrast, consultancy, retail, construction, electric and electronics are working more with industrial partners. Again, our findings may be skewed by the fact that we drew data from corporate annual reports. It is unlikely that the companies in our sample fully describe governance activities given that there are many forms of network collaboration that can influence eco-innovation. Whilst companies are likely to report on measures that were completed during the year the annual report was published and which have delivered key results in terms of reduced environmental impacts, it is unlikely that they will report on longstanding partnerships or those of a less tangible nature. These include participation in trade associations and industry networks; informal collaborations with science partners; memberships in advocacy coalitions; contracts with consulting companies; agreements with key suppliers and dealers and so on. These types of partnerships may be useful in terms of generating new and radical ideas, knowledge and competence for eco-innovation and for accessing new markets.
In contrast, it may be the case that the companies that feature in this study have diffi-culty in engaging with some actors because they have not identified the potential to make environmental improvements via eco-innovation networks, or because of the various barriers to innovating via networks. For instance, networking with other private companies is risky in the context of competitive markets.

50
4 Discussing eco-innovation measures
4.1 Eco-innovation in general Overall, the results presented in this study show that companies have established a range of activities and measures linked to eco-innovation and that, on the whole, Swedish companies appear to be quite proactive in dealing with environmental issues. This finding is reflected in other studies. Sweden has the second highest score behind Finland according to the EU innovation scoreboard (EEA 2006). According to another study, more innovative companies tend to collaborate internally, between marketing and product development, and externally with suppliers and partners (Ny teknik, 2009). There are also trends which suggest that companies that prioritise environmental issues are more innovative, since they are faster than others in responding to legislative demands and in marketing new processes and products (Ny teknik, 2009). Compared to a similar international study on large companies based on strategies and goals in annual reports (Deloitte, 2012), this report focus on performed measures. The Deloitte study shows that some of the Swedish companies have a holistic approach (ICA) and work with their suppliers, such as ZERO chemicals campaign (H&M).
4.2 Drivers of eco-innovation The findings presented in this study also suggest that Swedish companies are today responding to a wider range of drivers of eco-innovation. Studies show that Swedish companies have previously responded to regulative drivers of eco-innovation (Zaring and Hellsmark 2001) whereas this study finds that in addition to regulations, consumer demands and business opportunities (via cost reductions, for example) are presently considered as drivers. This finding is mirrored in other studies on eco-innovation (Baumast 2002; Arundel and Kemp 2009).
4.3 Internal measures to change products and processes By categorising these activities and measures according to the various dimensions of eco-innovation, the study also demonstrates that companies focus mainly on making changes to products and processes (internal company measures).
For the most part, product and process changes occur at the level of sub-systems and thus focus on increased efficiency in production or for users. Whilst it is arguably commendable that companies adopt such an approach, it appears to be the case that companies do not fully consider the environmental impacts of these changes.
Whilst companies adopt a systems approach via life-cycle analysis, for instance, the possibility remains that the environmental benefits of efficiency improvements are counteracted by increased consumption – the so-called ‘rebound effect’ (Binswanger
51
2001; Hertwich 2008). Further research is required to examine the way companies deal with this problem, as it may be the case that they do consider environmental impacts in a more holistic sense but which is not apparent in their reports.
On the whole, companies noted few system-level changes to products and processes. This is perhaps to be expected given that such changes are of a more radical nature and thus likely to require new competences and large investments, and are generally more risky. Notwithstanding, the group described as consultancy and service companies focused on system-level changes more than any other group. This is likely a reflection of their role as a provider of knowledge and competences to other companies that seek to make environmental improvements. Further research could provide useful insights into the role of consultancies and service companies as regards system-level eco-innovations.
4.4 Organisational measures The most populated category reflects organisational process changes within the com-panies in this sample. Whilst we acknowledge the importance and relevance of such changes for eco-innovations related to products and production processes, we also feel that the number of measures that fell into this category reflects the use of company reports as a source of data. Organisational changes in the form of changes to routines and procedures within companies; targets to reduce environmental impacts of products, operations and processes; and changes to codes of conduct, corporate culture and core values are undoubtedly important elements of environmental management that underpin changes of a more technological nature. However we feel that this type of measure is somewhat overstated in company reports, which to some extent are intended to improve and maintain a company’s image. Further research could seek to identify linkages between the approach taken by top management and companies’ efforts to pursue and develop eco-innovations.
4.5 User driven eco-innovation Whilst companies demonstrated strong capabilities in translating the need for environ-mental improvements into new products and production processes, the proportion of measures that focus on collaborations with external actors was considerably smaller in size. In particular, companies mentioned relatively few measures that involved users as the source of eco-innovation, even though user driven sectors like the consultancy and service sectors have more focus on the consumer than e.g. the chemical industry. This finding contradicts studies that have demonstrated the value of users’ inputs to the innovative process, usually described under the heading ‘user-driven innovation’ (von Hippel 1986, Bogers et al. 2010). We reflect on this finding in the following ways. The absence of evidence of user-driven eco-innovation could perhaps be attributed to corporate reporting, in that full details of innovative procedures are not included in company reports – our methods may not fully explore the role of the user in eco-

52
innovation. Alternatively, companies may not be aware of the potential to involve lead users as a source of eco-innovation. Finally, user-driven innovation may be confined to situations where users are adequately knowledgeable and competent, such as the development of scientific instrumentation (von Hippel 1976). The extent to which users are capable of making key contributions to developments in electronics or automobiles is unlikely given the complexity of the products in question. Here user inputs may be limited to explicating demands regarding the environmental functionality of products rather than their inner workings. Notwithstanding, further research could seek to identify the extent to which a lack of user involvement constitutes a missed opportunity.
4.6 Eco-innovation via value chain interactions In comparison, companies were more active as regards collaborations with suppliers. When compared to previous studies (e.g. Zaring and Hellsmark 2001), this study suggests that Swedish companies have expanded their efforts to collaborate with suppliers and that they increasingly pursue a more systemic approach. However, the majority of value chain measures noted by this study focus on procurement policies (purchasing only from suppliers with environmental management systems); assessing and auditing suppliers’ environmental credentials; or providing suppliers with a code of conduct. Examples of close and innovative collaborations in the value chain were harder to find, even though sectors like the retailing sectors have more focus on the value chain. We assume that companies experience these types of measures as more risky and costly, and that they require companies to devote particular sets of competences and human resources that they may in some instances be lacking.
4.7 Eco-innovation via other external partners Moreover, whilst companies reported on numerous governance measures, a similar statement can be made about the quality of collaborations with external partners that are not part of the value chain. Again, it appears to be the case that Swedish companies have expanded collaborations with actors beyond the value chain (cf. Zaring and Hellsmark 2001). However, a large proportion of the governance measures described in this study encompassed partnerships that are not necessarily focused on making actual environmental improvements via new products and processes. These include member-ships in industry associations and other coalitions such as the UN Global Compact. Companies also mentioned numerous partnerships with NGOs (mainly as an element of stakeholder management procedures) and governments or government agencies. We interpret these measures to be of importance to eco-innovation as they can help build societal and legislative legitimacy for new technologies, for instance, and because these sorts of partnerships may reduce the risks and uncertainties related to radical measures. However, companies mentioned relatively few governance measures that comprise collaborative partnerships aiming to develop new technologies. Furthermore, those instances where companies did describe such measures offer great promise. Automotive
53
companies, for instance, have established ambitious partnerships with companies outside their traditional value chains related to the electrification of vehicles.
4.8 Conclusions and further research The main purpose of the project was to examine the way large Swedish companies tackle environmental issues in a comprehensive manner. In particular, this study sought to address the following questions:
• What types of measures and activities do companies employ as a means to reduce their environmental impacts?
• What are the main drivers of eco-innovation in large companies?
The majority of companies that feature in this study see themselves as proactive and most eco-innovations are based on internal measures, typically focusing on energy efficiency, renewable energy and materials. Companies appear also to be working proactively with the value chain and other external partners, whereas measures invol-ving users are more seldom mentioned. Companies noted various drivers of eco-innovation including policies and legislation, consumer demand, business opportunities and the possibility to reduce costs.
Whilst this study has produced relatively broad and comprehensive results, we feel that there are several aspects of eco-innovation that have been only touched upon here and which warrant further research. This is in part a methodological issue related to cor-porate reporting. Whilst corporate reports are easily accessible and can facilitate the creation of comprehensive databases, we feel that further more in-depth studies are required to examine eco-innovation in a manner that can benefit and inform prac-titioners and policymakers. Studies may benefit by following on the following issues:
• What types of eco-innovation have the potential to deliver the largest environmental improvements?
Here it may be useful to examine the different dimensions of eco-innovation as described in the dimensions of our framework. It may be the case, for instance, that innovation networks with universities or other science partners have the potential to bring about more radical eco-innovations than via companies interactions with users. Similarly, companies may be able to establish more fruitful collaborations with suppliers. Since the companies that feature in this study focus mainly on internal measures, it may be useful to question how much any company can or should achieve by working alone on issues with such broad societal impacts.
• How can environmental improvements be quantified?
The various dimensions of eco-innovation mean that quantifying some efforts is easier than others. For instance, a new production process designed to reduce CO2 emissions is much easier to quantify than a collaboration within an industry association that helps to

54
create new network interactions that can indirectly influence eco-innovation. What sorts of methods can be used to compare these different dimensions?
• What are the drivers and barriers of eco-innovation?
Our study has only touched upon the numerous drivers of eco-innovation, many of which were of a legislative nature. In order to design and implement policies and legal frameworks that promote eco-innovation we must better understand the range of drivers and barriers of eco-innovation from a company perspective. Further research is thus required and should seek to provide nuanced understandings of drivers and barriers from the perspective of different industries. Our study focused on large companies, but future studies should also focus on SMEs given their innovative potential.
55
Appendix
Acknowledgments The authors gratefully acknowledge the financial support and the discussions with Anna Sandström, Göran Andersson and Jonas Brändström from the Swedish Governmental Agency for Innovation Systems - VINNOVA. The authors also acknowledge the data collection and the discussions with the master students from the environmental management course (spring 2012), Anika Regett and Gibran Vita.
References Andersen, MM. (2008). Eco-innovation: Towards a taxonomy and a theory. Paper presented at the 25th Celebration Conference 2008 on Entrepreneurship and innovation – organizations, institutions, systems and regions. Copenhagen, CBS, Denmark, June 17 - 20, 2008.
Arundel, A. & Kemp, R. (2009). Measuring eco-innovation. UNU-MERIT Working paper series, Netherlands.
Baumann H , B Brunklaus, P Gluch, A Kadefors, A-C Stenberg & Thuvander, L. (2003). Miljöbarometern för byggsektorn 2002. Environmental Systems Analysis & Centrum för management i byggsektorn, Chalmers University of Technology. Gothenburg.
Baumast, A. (2002). Environmental Management – the European Way. Corporate Environmental Management 8(2):148-156.
Binswanger, M. (2001) Technological progress and sustainable development: what about the rebound effect? Ecological Economics 36(1): 119-132.
Bogers, M., Afuah, A. & Bastian, B. (2010). Users as innovators: A review, critique, and future research directions. Journal of Management, 36(4): 857–875.
Carrillo-Hermosilla, J., del Rio González, P. & Könnölä, T. (2009). Eco-Innovation: When Sustainability and Competitiveness Shake Hands. Hampshire, MA: Palgrave Macmillan.
Deloitte (2012). Towards ZERO Impact growth – Strategies of leading companies in 10 industries. Deloitte, Netherlands.
EEA (2006). Eco-innovation indicators, Copenhagen.
Edquist, C. (2001). The Systems of Innovation Approach and Innovation Policy: An account of the state of the art. Lead paper presented at the DRUID Conference, Aalborg, June 12-15, 2001, under theme F: ‘National Systems of Innovation, Institutions and Public Policies’.

56
Freeman C. & Soete L. (1997). The Economics of Industrial Innovation (3rd edn). Pinter: London.
Gluch P. Brunklaus B. et al. (2007). Miljöbarometern för bygg- och fastighetssektorn 2006. Building Management & Centrum for management i byggsektorn, Chalmers University of Technology. Gothenburg.
Goedkoop MJ, van Halen CJG, te Riele HRM & Rommens PJM. (1999). Product service systems. Ecological and economic basics. The Hague, Den Bosch and Amersfoort:Pi!MC, Stoorm C.S. and PRe´ Consultants. Gothenburg: Gothenburg Research Institute.
Hellström, T. (2007). Dimensions of Environmentally Sustainable Innovation: the Structure of Eco-Innovation Concepts. Sustainable Development 15, 148–159.
Henderson RM. & Clark KB. (1990). Architectural innovation: the reconfiguration of existing product technologies and the failure of established firms. Administrative Science Quarterly 35: 9–30.
Hertwich EG. (2008) Consumption and the rebound effect: An industrial ecology perspective. Journal of Industrial Ecology 9(1-2): 85-98.
James, P. (1997) The Sustainability Circle: a new tool for product development and design. Journal of Sustainable Product Design 2, 52:57
Kemp, R. & Foxon, T. (2007). Typology of eco-innovation. UM-MERIT: Measuring eco-innovation.
Könnölä, T., Carrillo-Hermosilla, J. & del Río Gonzalez, P. (2008). Dashboard of Eco-innovation. DIME International Conference "Innovation, sustainability and policy", 11-13 September 2008, GREThA, University Montesquieu Bordeaux IV, France
Mont, O. (2002). Clarifying the concept of product-service system. Journal of Cleaner Production 10/3, 237-245.
Norberg-Bohm, V. (1999). Stimulating ‘green’ technological innovation: an analysis of alternative policy mechanisms. Policy Sciences 32, 13–38.
Ny teknik (2009), “Så blir ditt företag bäst på innovationer”, www.nyteknik.se, 28 February 2009.
OECD (2005). The Measurement of Scientific and Technological Activities: Guidelines for Collecting and Interpreting Innovation Data: Oslo Manual, Third Edition. Prepared by the Working Party of National Experts on Scientific and Technology Indicators, OECD, Paris, para. 37.
Rennings K. (2000). Redefining innovation – eco-innovation research and the contribution from ecological economics. Ecological Economics 32: 319–332.
Schumpeter JA. (1934). The Theory of Economic Development. Harvard University Press: Cambridge, MA.

57
Schumpeter, JA. (1942) Capitalism, Socialism and Democracy. London: Routledge.
von Hippel, E. (1976). The dominant role of users in the scientific instrument innovation process. Research Policy, 5(3), 212-239.
von Hippel, E. (1986). Lead users: a source of novel product concepts. Management Science 32(7): 791–805
Zaring, O. & Hellsmark, H. (2002). The Swedish Business Environmental Barometer 2001. Greener Management International (forthcoming).
Tables and figures Table with overall eco-innovation measures including detailed categories, such as component addition (CA), subsystem change (SSC), and system changes (SC).
Figures for each of the 11 industries including detailed categories, such as component addition (CA), subsystem change (SSC), and system changes (SC).
Consultancy & services
Organisational process R&D NoveltyCA SSC SC CA SSC SC Support OP initiate change Service VC G industry uni NGO Res inst
Chemicals 1 14 23 9 20 14 8 15 24 13 4 4 5 17 13 10 10 2 3 24 518 companies 38 43 60 8 22 38 24
Consultancy/ services 5 32 35 0 7 9 17 20 12 7 10 5 33 8 10 13 9 2 0 26 607 companies 72 16 56 15 41 34 26
Retail 0 2 16 2 13 12 6 23 14 8 0 4 3 11 14 7 2 5 0 0 263 companies 18 27 51 4 14 28 0
Food 0 2 15 1 18 6 1 7 10 6 4 13 7 19 7 2 4 0 1 9 164 companies 17 25 24 17 26 14 9
Construction 0 17 8 0 7 2 5 20 11 2 0 10 4 9 7 8 3 0 1 11 194 companies 25 9 38 10 13 19 11
Automotives 8 57 4 8 14 2 21 42 3 4 4 5 14 18 18 4 16 4 1 16 569 companies 69 24 70 9 32 43 16
Logistics and Transports 0 0 0 12 24 0 28 24 26 8 0 0 7 7 7 4 2 3 0 16 66 companies 0 36 86 0 14 16 16
Machinery and equipment 1 70 0 39 10 0 44 71 69 5 8 2 10 31 11 10 9 9 1 7 11617 companies 71 49 189 10 41 40 7
Electric and Electronics 25 9 4 19 19 5 62 48 6 5 0 12 4 26 0 61 15 32 0 74 5910 companies 38 43 121 12 30 108 74
Pulp, paper and wood 30 2 3 35 10 13 76 36 0 3 4 1 1 25 0 18 21 7 0 41 6310 companies 35 58 115 5 26 46 41
Mining, metals and other materials 49 1 0 52 13 2 60 44 12 4 0 2 1 16 0 39 14 14 0 40 7714 companies 50 67 120 2 17 67 40
GovernanceGPM
Product Production process User Value chain

58
Retail
Food
Construction
Electrics & electronics
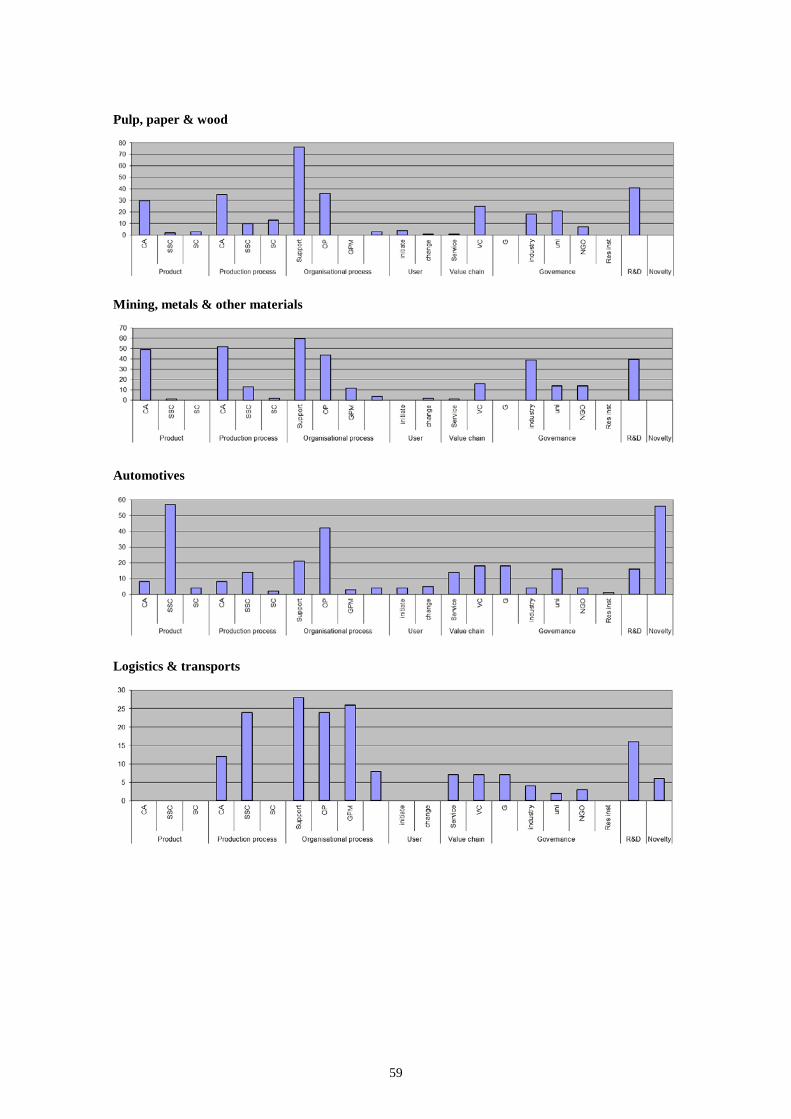
59
Pulp, paper & wood
Mining, metals & other materials
Automotives
Logistics & transports

60
Machinery & equipment

VINNOVA AnalysisVA 2013:
01 Chemical Industry Companies in Sweden
02 Metallindustrin i Sverige 2007 - 201103 Eco-innovative Measures in large
Swedish Companies - An inventory based on company reports
04 Gamla möjligheter - Tillväxten på den globala marknaden för hälso- och sjukvård till äldre
05 Rörliga och kopplade - Mobila produktionssystem integreras
VA 2012:01 Impact of innovation policy - Lessons
from VINNOVA´s impact studies. For Swedish version see VA 2011:10
02 Lösningar på lager - Energilagringstekniken och framtidens hållbara energiförsörjning
03 Friska system - eHälsa som lösning på hälso- och sjukvårdens utmaningar
04 Utan nät - Batterimarknadens utvecklingsmöjligheter och framtida tillväxt
05 Sveriges deltagande i sjunde ramprogrammet för forskning och teknisk utveckling (FP7) - Lägesrapport 2007 - 2011. Only available as PDF
06 Företag inom fordonsindustrin - Nationella, regionala och sektoriella klusterprofiler som underlag för analys- och strategiarbete
07 Svensk Life Science industri efter AstraZenecas nedskärningar. Only available as PDF
08 EUREKA Impact Evaluation - Effects of Swedish participation in EUREKA projects
09 Uppföljning avseende svenskt deltagande i Eurostars. For English version see VA 2012:10. Only available as PDF
10 Follow-Up of Swedish Participation in Eurostars. For Swedish version see VA 2012:09. Only available as PDF
VA 2011:01 Smart ledning - Drivkrafter och
förutsättningar för utveckling av avancerade elnät
02 Framtid med växtverk - Kan hållbara städer möta klimatutmaningarna?
03 Life science companies in Sweden - Including a comparison with Denmark
04 Sveriges deltagande i sjunde ramprogrammet för forskning och teknisk utveckling (FP7) - Lägesrapport 2007-2010, fokus SMF. Only available as PDF. For brief version see VA 2011:05
05 Sammanfattning Sveriges deltagande i FP7 - Lägesrapport 2007-2010 - Fokus SMF. Brief version of VA 2011:04
06 Effektanalys av forskningsprogram inom material från förnyelsebara råvaror
07 Effektanalys av starka forsknings- & innovationssystem. Only available as PDF. For brief version see VA 2011:08
08 Sammanfattning - Effektanalys av starka forsknings- & innovationssystem. Brief version of VA 2011:07
09 Samarbete mellan Sverige och Kina avseende vetenskaplig sampublicering - aktörer, inriktning och nätverk. Only available as PDF
10 När staten spelat roll - lärdomar av VINNOVAs effektstudier. For English version see VA 2012:01
VINNOVA InformationVI 2013:
01 Branschforskningsprogrammet för skogs- & träindustrin - Projektkatalog 2013
02 Destination Innovation- Inspiration, fakta och tips från Ungas Innovationskraft
03 Inspirationskatalog - Trygghetsbostäder för äldre
04 Challenge-Driven Innovation - Societal challenges as a driving force for increased growth. For Swedish version see VI 2012:16
05 Innovationsupphandling - en möjlighet till förnyelse och utveckling
06 Årsredovisning 201207 Trygghetsbostader för äldre - en
kartläggning. Only available as PDF08 Äldre entreprenörer med sociala
innovationer för äldre - en pilotstudie kring en inkubatorverksamhet för äldre. Only available as PDF
09 Fixartjänster i Sveriges kommuner - Kartläggning och sanhällsekonomisk analys. For brief version see VINNOVA Information VI 2013:10
10 Sammanfattning Fixartjänster i Sveriges kommuner - Kartläggning. Brief version of VINNOVA Information VI 2013:09
VI 2012:02 Så blir Sverige attraktivare
genom forskning och innovation - VINNOVAs förslag för ökad konkurrenskraft och hållbar tillväxt till regeringens forsknings- och innovationsproposition
03 Idékatalog - Sociala innovationer för äldre
04 Innovation i offentlig upphandling - Ett verktyg för problemlösning
05 Årsredovisning 201107 Din kontakt till EU:s forsknings- och
innovationsprogram08 Uppdrag att stärka det svensk-
kinesiska forsknings- och innovationssamarbetet. Only available as PDF
09 Projektkatalog eTjänster. Slutkonferens - summering och reflektioner
10 Hållbara produktionsstrategier samt Tillverkning i ständig förändring - Projektkatalog 2012
VINNOVA´s publicationsMarch 2013
See www.vinnova.se for more information

11 VINNVÄXT12 Efffekter av innovationspolitik -
Tillbakablickar och framtidsperspektiv13 Banbrytande IKT - Projektkatalog14 Smartare, snabbare, konvergerande
lösningar - Projektkatalog inom området IT och Data/Telekommunikation i programmet Framtidens kommunikation
15 Fordonsstrategisk forskning och innovation för framtidens fordon och transporter.
16 Utmaningsdriven innovation - Samhällsutmaningar som drivkraft för stärkt tillväxt. For English version see VI 2013:04
17 Handledning för insatser riktade mot tjänsteverksamheter och tjänsteinnovation. Only available as PDF
VINNOVA ReportVR 2013:
01 Från eldsjälsdrivna innovationer till innovativa organisationer - Hur utvecklar vi innovationskraften i offentlig verksamhet?
02 Second Internationel Evaluation of the Berzeli Centra Programme
03 Uppfinningars betydelse för Sverige - Analys av och förslag till hur den svenska innovationskraften kan utvecklas och tas tillvara bättre
VR 2012:01 Utvärdering av Strategiskt
gruvforskningsprogram - Evaluation of the Swedish National Research Programme for the Mining Industry
02 Innovationsledning och kreativitet i svenska företag
03 Utvärdering av Strategiskt stålforskningsprogram för Sverige - Evaluation of the Swedish National Research Programme for the Steel Industry
04 Utvärdering av Branschforsknings-program för IT & Telekom - Evaluation of the Swedish National Research Programme for IT and Telecom
05 Metautvärdering av svenska branschforskningsprogram - Meta-evaluation of Swedish Sectoral Research Programme
06 Utvärdering av kollektivtrafikens kunskapslyft. Only available as PDF
07 Mobilisering för innovation - Studie baserad på diskussioner med 10 koncernledare i ledande svenska företag. Only available as PDF
08 Promoting Innovation - Policies, Practices and Procedures
09 Bygginnovationers förutsättningar och effekter
10 Den innovativa vården11. Framtidens personresor - Slutrapport.
Dokumentation från slutkonferens hösten 2011 för programmet Framtidens personresor
12 Den kompetenta arbetsplatsen13 Effektutvärdering av Produktionslyftet
- Fas 1: 2007-2010. Only available as PDF

The Environment - everyone´s responsibilityIndividuals, businesses and governments - all need to work together for a better future environment.E-Print and Trosa Tryckeri in cooperation with VINNOVA, take responsibility for an eco-friendly print production.We use modern production techniques and environmentally friendly materials in our efforts to minimize environmental impact.
Production: VINNOVA´s Communication DivisionPrinted by: E-Print AB, Stockholm, Sweden, www.eprint.se
March 2013Sold by: Fritzes Offentliga Publikationer, www.fritzes.se

VINNOVA strengthens Sweden’s innovation capacity
v e r k e t f ö r i n n o vat i o n s sy s t e m – s w e d i s h g o v e r n m e n ta l a g e n cy f o r i n n o vat i o n s y s t e m s
VINNOVA, SE-101 58 Stockholm, Sweden Besök/Office: Mäster Samuelsgatan 56Tel: +46 (0)8 473 3000 Fax: +46 (0)8 473 3005
[email protected] www.VINNOVA.se