ecodesign batteries – 1. stakeholder meeting …...cathode active material 8 o 107 o 66 o 188 o...
TRANSCRIPT

ECODESIGN BATTERIES – 1. STAKEHOLDER MEETING PRESENTATION OF TASK 4
Tim Hettesheimer, Antoine Durand
December 20, 2018 – Brussels

2
AGENDA
Purpose of task 4 Subtask 4.1 - Technical product description Description of a battery systems key components Input for PEF: 3.2 Representative products Technical improvement: BAT and BNAT according to literature Definition of design options
Subtask 4.2 - Production, distribution and end-of-life* Product weight and Bills-of-Materials (BOMs) Input for PEF: 6.1 Raw material acquisition Materials flow and collection effort at end-of-life (secondary waste) Second life Recycling Input for PEF: 6.6 End of life
*Production stage and EOL also considered in PEF (for mobile applications, also in the following), aswell as Use stage (see task 3)

3
PURPOSE OF TASK 4- TECHNOLOGIES
Task 4 provides a technological description of the products in scope of the study. It serves two different purposes: inform the policymakers and stakeholders about the product and its components from a
technical perspective, it serves to define the Base Cases and also works towards the definition of Best Available
Technologies (BAT) and state-of-the-art Best Not-yet Available Technologies (BNAT).
While the Base Case represents an average product on the market today The Best Available Technology (BAT) represents the best commercially available product with the
lowest resources use and/or emissions. The Best Not yet Available Technology (BNAT) represents an experimentally proven technology
that is not yet brought to market, e.g. it is still at the stage of field-tests or official approval.
The assessment of the BAT and BNAT provides the input for the identification of the improvement potentials in Task 6. The data for the base cases will serve as input for Task 5.
SUBTASK 4.1 - TECHNICAL PRODUCT DESCRIPTION
4

Description of the key components of a battery system
5
KEY COMPONENTS- SUBTASK 4.1 - TECHNICAL PRODUCT DESCRIPTION
Battery System
Source: Hettesheimer 2017: Strategische Produktionsplanung in jungen Märkten. Ein systemdynamischer Ansatz zur Konzeption und dynamischen Bewertung von Produktionsstrategien am Beispiel der Lithium-Ionen-Traktionsbatterie. Stuttgart: Fraunhofer Verlag.
Input for PEF: 3.2 Representative products

6
BAT & BNAT - SUBTASK 4.1 - TECHNICAL PRODUCT DESCRIPTION
The procedure differs from MEErP in which sections on standard improvement, BAT and BNAT are usually described in sequence.
BAT and BNAT by means of future development prospective of the different battery components.
Please provide further input on improvement options and if they can be considered as BAT or BNAT.
Today (BAT)
Cathode
Nickel-rich materials
High-energy NMCs
High-voltage spinels
Layer thickness
Aqueous cathode production
Anode
Graphite
Si/C composites 2–5 % SiO
Lithium metal
Electrolyte
Additivation
Alternative liquid electrolytes
Polymer electrolyte SPE/CPE
Separator Stable separators
Cell design and cell formats
Stacking instead of winding
Optimization of inactive materials
Battery management system (BMS)
Electricity meter with 2-3 physical measuring ranges
Sensorless temperature measurement
Compatibility of electronics for automotive and stationary applications
Thermal management
Battery temperature control during fast charging
Homogenization of temperature
Source: Thielmann, Axel; Neef, Christoph; Hettesheimer, Tim; Döscher, Henning; Wietschel, Martin; Tübke, Jens (2017): Energiespeicher-Roadmap (Update 2017). Hochenergie-Batterien 2030+ und Perspektiven zukünftiger Batterietechnologien. Karlsruhe.
Technical improvement: BAT and BNAT according to literature
2020 (BNAT)
Until 2025 (BNAT)
From 2025 (out of time scope)
Si/C >5 % Si/C --> 20 %

Definition of design options: Exemplarily for base case 1
Voettekst invulling7
DESIGN OPTIONS - SUBTASK 4.1 - TECHNICAL PRODUCT DESCRIPTION
Name BC 1 EE CRM DUR Ext REP EESFull Name PC - BEV_BC PC - BEV_EE PC - BEV_CRM PC - BEV_DUR PC - BEV_Ext PC - BEV_REP PC - BEV_EES
Main strategy Base Case Higher Efficiency of the battery Better CRM recycling Higher durability of
the battery
User profile changed: after 1st lifetime, range is limited
High repairability 1st life: like BC 2nd life: as ESS
(repurposing)
DescriptionOptimized BMS
and thermalmanangement
Substitution of weldings and
adhesives by e.g. screws/
Substitution of composites by metals
Increased durability due to better cooling and
dimensioning of cell and system
After EoL used e.g. for short ranged city car
Possibility to exchange e.g. a
damaged module and thus
to delay EoL
Use of battery for 2nd life application
Caracteristics/parameters of 2nd life application not here
Positive influence on:
Higher FU due to higher system
efficiency
Lower installed capacity
Better recyclability FU by longer lifetime
Increased lifetime beyond 80% SoH
Increased FU due to lifetime
Increased lifetime
Increased FU due to lifetime
Increased FU due to lifetime
(side effect): improved information for 2nd hand EV
(increased trust from customers)
Negative influence on:
Higher volume and weight (e.g. switch from composites to other materials)-->
Lower energy density
Lower lifetime (recyclability vs.
lifetime)
Lower quantity of FU
System efficiency (e.g. cooling)
Installed capacity
Energy density
Non-optimal system compatibility (if 1st life influenced because of
2nd life)
Higher weight and volume because of design for
replacements -> Lower energy
density
System compatibilityAny options missing or not applicable?
SUBTASK 4.2 - PRODUCT WEIGHT AND BILLS-OF-MATERIALS (BOMS)
Calculation of the BOM for the base cases
8

Product weight and Bills-of-Materials (BOMs) – Main barriers for defining the BOM for a BC
9
BARRIERS FOR BOM- SUBTASK 4.2 - PRODUCT WEIGHT AND BILLS-OF-MATERIALS (BOMS)
Calculation of BoM on battery system level for all base cases, but: Up to now, there is no representative product in the market, which could be used as a base case Products, even on cell level, differ regarding cell chemistry and cell format The heterogeneity of possible designs and products increases strongly when reaching the module and
system level.
Battery System
Heterogeneity of design

Summary of approach for defining the BOM for a base case
10
APPROACH BOM - SUBTASK 4.2 - PRODUCT WEIGHT AND BILLS-OF-MATERIALS (BOMS)
BOM on cell level (Bottom-up)
Common cells on the market
BOM of cells rated per Wh Materials in g/Wh
Calculation of BOM for virtual product
on cell levelaccording to marketshare by total (k)Wh
BOM on battery system level (top-down)
Cell(Materials + Housing)
Module
Pack (Housing
BMS, Th.M)
kg ?
e.g. 225 kg
Module
Pack (Housing
BMS, Th.M)
Weight from cellBOM known
Literature review & own modelling
75%
5%
20%(BMS 5%,..)
Weight distribution
225 kg
15 kg
60 kg
Weight of moduleand pack
Calculation of BOM for virtual product(system level) underconsideration of the different share of cellchemistry per application
Calculation of the BOM for the pack consideringdifferent applications
Calculation of BMS andThermal managementweight and the BOM
Calculation of battery systemand - modulesweight by meansof typical shareof cell mass.
Calculation of the BOM for the moduleconsidering the cell format of the common cell

Product weight and Bills-of-Materials (BOMs) – Cell level
11
BOM ON CELL LEVEL- SUBTASK 4.2 - PRODUCT WEIGHT AND BILLS-OF-MATERIALS (BOMS)
5 common cells on the market
Considering to cover most cell chemistries and to cover all three cell formats
Calculation of the BOM on cell level for different applications under consideration of the share of each cell chemistry
BOM for a virtual product for each base case
Format Pouch Pouch Prismatic Cylindrical Prismatic
Chem.NCM 622
LFPAh 59 25,9 60 3,18 250Wh 212,4 96 222 11,45 875V 3,6 3,7 3,7 3,6 3,2W/mm 305 171 173 18,25 410H/mm 100 233 125 65,1 146T/mm 13,5 7,5 45 58
Material per cell in g Material per cell in g Material per cell in g Material per cell in g Material per cell in gCathode active material 346 NCM424/NCM200,7 NCM523/NCA 552 NCA (82/15/3)16,46 LFP 1400Cathode active material 1 Fe 0 Fe 0 Fe 0 Fe 0,0 Fe 496Cathode active material 2 Co 39 Co 21 Co 22 Co 1,4 Co 0Cathode active material 3 Ni 117 Ni 29 Ni 75 Ni 7,5 Ni 0Cathode active material 4 Mn 37 Mn 64 Mn 223 Mn 0,0 Mn 0Cathode active material 5 Al 0 Al 0 Al 1 Al 0,2 Al 0Cathode active material 6 Li 46 Li 21 Li 42 Li 2,2 Li 62Cathode active material 7 P 0 P 0 P 0 P 0,0 P 275Cathode active material 8 O 107 O 66 O 188 O 5,1 O 568Cathode conductor Carbon 9 Carbon 10,6 Carbon 25,23 Carbon 0,22 boron modified 200Cathode binder PVDF 9 PVDF 9,49 PVDF 23,43 PVDF 0,15 PVDF 66,67Cathode additives ZrO2 4 ZrO2 ZrO2 ZrO2 ZrO2Cathode collector Al foil 23 29,2 Al foil 67,2 Al foil 1,62 Al foil 295,2Total cathode 390 250 668 18 1962Anode active material Graphite 199 Graphite (MPG106 Graphite (MPG244,41 Graphit (MAG 11,64 Graphit 1000Anode binder 1 SBR 3 AAS? 4,42 SBR 6,57 SBR 0,19 SBR 26,3Anode binder 2 CMC 3 CMC CMC 6,57 CMC 0,19 CMC 26,3Anode collector Cu foil 55 Cu foil 53,2 Cu foil 162,4 Cu foil 4,06 Cu foil 640,8Anode heatresistnt layer Al Al Al 42,24 Al Al Total anode 261 163,62 462,19 16,08 1693,4Formulated electrolyte Total 128 Total 76,9 Total 313,13 Total 4,7 Total 1100Fluid LiPF6 12 LiPF 9,8432 LiPF 40,08064 LiPF 0,6016 LiPF 140,8Fluid LiFSI 6 LiFSI LiFSI LiFSI LiFSISolvents EC 26 EC 24,608 EC 100,2016 EC 1,504 EC 352Solvents DMC 0 DMC 24,608 DMC 100,2016 DMC 1,504 DMC 352Solvents EMC 72 EMC 17,687 EMC 72,0199 EMC 1,081 EMC 253Solvents PC 12 PC PC PC PCTotal electrolyte 128 76,7462 312,50374 4,6906 1097,8Separator PE 10 µm+AL 24 PE 10 µm+AL - PE 10 µm+AL - PE 10 µm+AL - PE 10 µm+AL -Separator PP 15 µm + A - PP 15 µm + A 18,0 PP 15 µm + A - PP 15 µm + A - PP 15 µm + A -Separator PP/PE/PP PP/PE/PP PP/PE/PP 61,96 PP/PE/PP PP/PE/PP 215,04Separator PE-Al2O3 PE-Al2O3 PE-Al2O3 PE-Al2O3 1,05 PE-Al2O3Total separator 23,6 17,9832 61,96 1,05 215,04Tab with film Al Tab 5 Al Tab 5 Al Tab Al Tab Al Tab
Ni Tab 16 Ni Tab 16 Ni Tab Ni Tab Ni TabExterior covering PET/Ny/AI/PP 17 PET/Ny/AI/PP 19,21 PET/Ny/AI/PP - PET/Ny/AI/PP - PET/Ny/AI/PP -Collector parts Al leads Al leads Al leads 3,8 Al leads Al leads 15Collector parts Cu leads Cu leads Cu leads 10,4 Cu leads Cu leads 45Collector parts Plastic fastene- Plastic fastene- Plastic fastene16 Plastic fastene- Plastic fastene20Cover Valve, rivet te - Valve, rivet te - Valve, rivet te 112 Valve, rivet te 1,86 Valve, rivet te 100Case Al Al Al 150,5 Al Al 800Case Ni plating Iron Ni plating Iron Ni plating Iron Ni plating Iron 5,93 Ni plating IronTotal cell packaging 38 40 293 8 980
SDI BMW i3 Panasonic 18650
Electrolyte
Separator
Cell Packaging
LGC Volt (Gen2)
BOM Cell level
BYD 200Ah for e6/k9
General Information
LGC Bolt
NCM523/NCA(80/15/5)/LMO - (Share 6/2/2)
NCM424/NCM111/LMO - (6/2/2 assumed)
NCA (82/15/3)
Kathode
Anode
Source: Takeshita et al. 2016, 2018

Product weight and Bills-of-Materials (BOMs) – Cell level
12
BOM ON CELL LEVEL- SUBTASK 4.2 - PRODUCT WEIGHT AND BILLS-OF-MATERIALS (BOMS)
Calculation of BoM on battery system level for all base cases, but: Up to now, there is no representative product in the market, which could be used as a base caseCalculation of a virtual product, based on different cell chemistries and their market share in the different applications5 common cells on the market
LGC Bolt Cell LGC Volt (Gen2) SDI BMW i3 Panasonic
18650 BYD for e6/k9
Format Pouch Pouch Prismatic Cylindrical Prismatic
Chem. NCM 622 NCM424/NCM111/LMO
NCM523/NCA (80/15/5)/LMO
- 6/2/2NCA (82/15/3) LFP
Ah 59 25,9 60 3,18 200Wh 212,4 96 222 11,45 640V 3,6 3,7 3,7 3,6 3,2
W/mm 305 171 173 18,25 410H/mm 100 233 125 65,1 146T/mm 13,5 7,5 45 58
Same battery chemistries as in PEF: NMC (LiNixMnyCozO2), LiMn (LiMnO2), LFP ( LiFePO4)Difference to PEF: NCA instead of LCO
BOM Virtual product „Grid stabilisation“= 10% BOM NCM + BOM 80% LFP + BOM 10% NCA

Module and System level – Definition of module and systems weight
13
BOM ON SYSTEM LEVEL- SUBTASK 4.2 - PRODUCT WEIGHT AND BILLS-OF-MATERIALS (BOMS)
OEM are designing their own modules and systems Bottum-up approach not feasible Weight of the different systems components needed Thus considering the results of the literature review and the modelling the following weight distributions
are defined for the applications:

Product weight and Bills-of-Materials (BOMs) – Module and System level
14
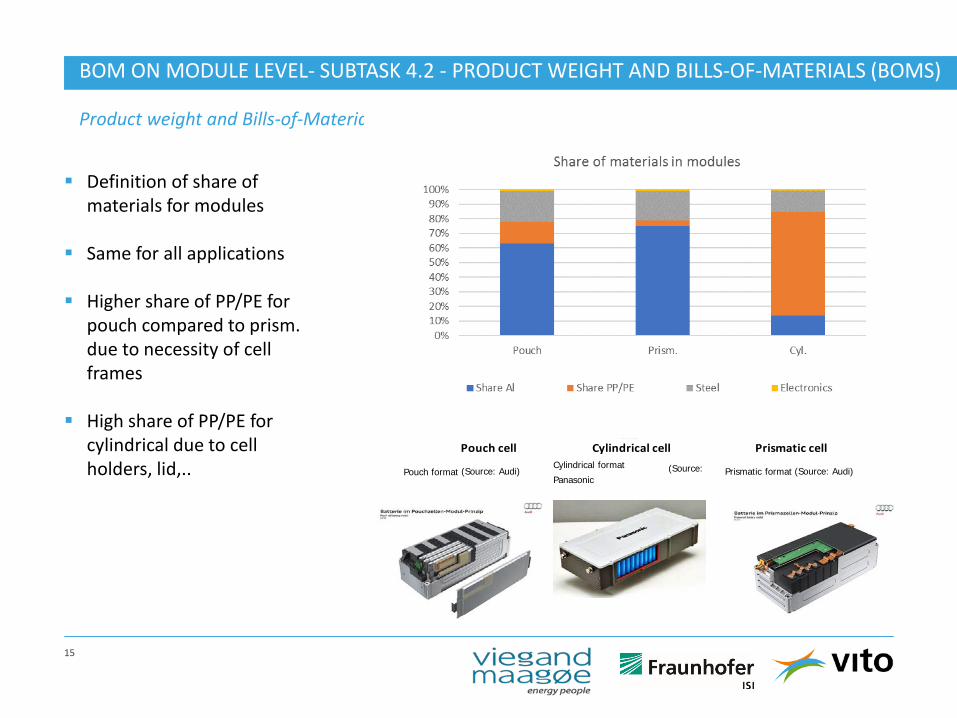
BOM ON MODULE LEVEL- SUBTASK 4.2 - PRODUCT WEIGHT AND BILLS-OF-MATERIALS (BOMS)
Definition of share of materials for modules
Same for all applications
Higher share of PP/PE for pouch compared to prism. due to necessity of cell frames
High share of PP/PE for cylindrical due to cell holders, lid,..
C
C
+
-BB
A
A
Flach- bzw. Pouchzelle Rundzelle Prismatische ZellePouch cell Cylindrical cell Prismatic cell1
Prismatic format(Source: Audi)Pouch format (Source: Audi)Cylindrical format (Source: Panasonic
Product weight and Bills-of-Materials (BOMs) – Module and System level
15
BOM ON MODULE LEVEL- SUBTASK 4.2 - PRODUCT WEIGHT AND BILLS-OF-MATERIALS (BOMS)
Definition of share of materials for modules
Same for all applications
Higher share of PP/PE for pouch compared to prism. due to necessity of cell frames
High share of PP/PE for cylindrical due to cell holders, lid,..
C
C
+
-BB
A
A
Flach- bzw. Pouchzelle Rundzelle Prismatische ZellePouch cell Cylindrical cell Prismatic cell1
Prismatic format(Source: Audi)Pouch format (Source: Audi)Cylindrical format (Source: Panasonic

BOM for the base cases
16
SUBTASK 4.2 - PRODUCT WEIGHT AND BILLS-OF-MATERIALS (BOMS)
BOM on cell level already given based on common cells cell weight known
Calculation of the components weight, based on the cell weight and the specific share of weight of the components
Calculation of the materials of the module (excl. cells) , the system housing, BMS,.. based on the shown assumptions.
Following the PEF, chargers are not included
PC BEV PC PHEV LCV BEV Truck BEV Truck PHEV Res. Storage Grid stab.System Level Component Material 40.000 12.000 35.000 45.000 20.000 10.000 10.000
Fe 3.399 3.399 2.974 10.196 5.664 4.531 4.531 Co 5.036 561 4.407 4.439 936 308 308 Ni 18.735 2.302 16.393 15.852 3.837 1.208 1.208 Mn 8.797 3.883 7.697 3.103 6.471 172 172 Al 255 49 223 170 82 19 19 Li 7.369 1.441 6.448 6.933 2.401 975 975 P 1.885 1.885 1.649 5.654 3.141 2.513 2.513 O 22.384 7.841 19.586 24.747 13.069 6.142 6.142 Carbon 2.929 1.924 2.563 5.013 3.207 1.888 1.888 PVDF 1.922 947 1.682 2.248 1.579 665 665 ZrO2 276 - 242 311 - 17 17 Al foil 7.256 3.654 6.349 9.278 6.090 2.948 2.948
Graphite 40.683 13.377 35.597 46.619 22.295 11.098 11.098 SBR 802 421 702 966 702 272 272 CMC 802 200 702 966 334 272 272 Cu foil 17.176 7.480 15.029 21.029 12.466 6.472 6.472 Al 1.142 - 999 - - - -
LiPF6 3.585 1.521 3.137 4.388 2.534 1.396 1.396 LiFSI 482 - 422 542 - 30 30 EC 8.625 3.802 7.547 10.591 6.336 3.470 3.470 DMC 6.698 3.802 5.861 8.423 6.336 3.350 3.350 EMC 10.210 2.732 8.934 12.125 4.554 2.745 2.745 PC 906 - 793 1.019 - 57 57
PE 10 micron 1.778 - 1.556 2.000 - 111 111 PP 15 micron - 899 - - 1.499 - - PP/PE/PP 3.149 1.475 2.756 4.424 2.458 1.966 1.966 PE-Al2O3 1.100 110 963 825 183 92 92
Al Tab 377 250 330 424 417 24 24 Ni Tab 1.205 800 1.055 1.356 1.333 75 75 PET/Ny/AI/PP 1.266 961 1.107 1.424 1.601 79 79 Al leads 206 103 180 309 171 137 137 Cu leads 590 309 516 926 514 411 411 Plastic fasten 570 137 498 411 229 183 183 Al, Steel, Va 5.662 881 4.954 3.519 1.468 1.077 1.077 Al 9.553 5.486 8.359 16.457 9.143 7.314 7.314 Ni plating Iron 6.215 621 5.438 4.661 1.036 518 518
Al 6.874 3.120 6.015 8.503 5.199 2.947 2.947 PP/PE 3.986 1.032 3.488 3.807 1.720 869 869 Steel 2.539 1.028 2.222 2.959 1.714 946 946 Electronics 135 52 118 154 87 48 48
Steel 4.331 2.093 3.790 4.935 3.488 1.924 1.924 Copper 5.414 2.616 4.737 6.169 4.360 2.405 2.405 Printed circuit 1.083 523 947 1.234 872 481 481
Al 9.745 4.709 8.527 11.105 7.848 4.329 4.329 Steel 1.083 523 947 1.234 872 481 481
Al 22.739 10.988 19.896 25.911 18.313 3.848 3.848 PP/PE 1.624 785 1.421 1.851 1.308 2.886 2.886 Steel 6.497 3.139 5.685 7.403 5.232 11.545 11.545 WEEE 1.624 785 1.421 1.851 1.308 962 962
Module
System
BMS
Thermal management
Packaging
Cell
Cathode
Anode
Electrolyte
Separator
Cell Packaging
Input for PEF: 6.1 Raw material acquisition and pre-processing
75%
5 %
4 %
4 %
12 %
Relative weight of components
Relative share of materials in the components
Any major comments on the approach?
SUBTASK 4.2: MATERIALS FLOW AND COLLECTION EFFORT AT END-OF-LIFE
2nd life batteries
17
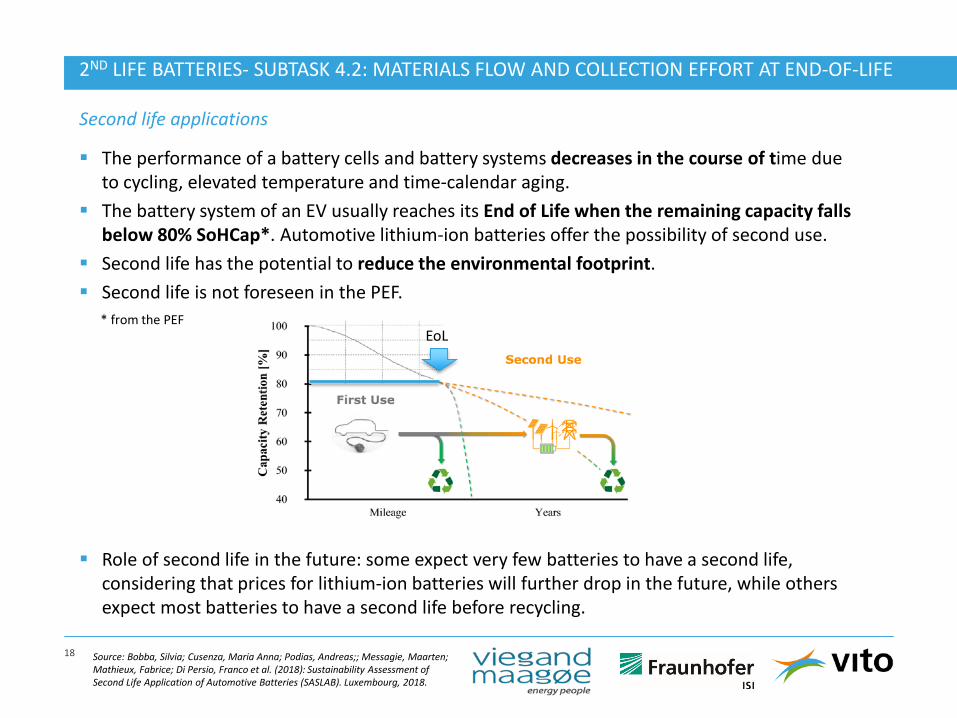
Second life applications
18
The performance of a battery cells and battery systems decreases in the course of time due to cycling, elevated temperature and time-calendar aging.
The battery system of an EV usually reaches its End of Life when the remaining capacity falls below 80% SoHCap*. Automotive lithium-ion batteries offer the possibility of second use.
Second life has the potential to reduce the environmental footprint. Second life is not foreseen in the PEF.
Role of second life in the future: some expect very few batteries to have a second life, considering that prices for lithium-ion batteries will further drop in the future, while others expect most batteries to have a second life before recycling.
* from the PEF
Source: Bobba, Silvia; Cusenza, Maria Anna; Podias, Andreas;; Messagie, Maarten; Mathieux, Fabrice; Di Persio, Franco et al. (2018): Sustainability Assessment of Second Life Application of Automotive Batteries (SASLAB). Luxembourg, 2018.
2ND LIFE BATTERIES- SUBTASK 4.2: MATERIALS FLOW AND COLLECTION EFFORT AT END-OF-LIFE
EoL

Possiblities at End of life
19
Source: Electric vehicles from life cycle and circular economy perspectives TERM 2018: Transport and Environment Reporting Mechanism (TERM) report
2ND LIFE BATTERIES- SUBTASK 4.2: MATERIALS FLOW AND COLLECTION EFFORT AT END-OF-LIFE
Rawmaterial
Batterymaterials LIB Direct
reuseBattery
repurposing Recycling Landfill
e.g. same application
New application (e.g. grid support)
In terms of repurposing it can be distinguished between two different strategies: 1) Direct reuse: The battery system is not dismantled, tested and directly reused
2) Battery repurposing: The battery system is dismantled at module level and a new battery system is created by repackaging
EoL (80% SoH)
2nd life

Barriers of second life applications
20
“Design for disassembly” is a relevant issue (e.g. connection of structural components) for 2nd
use Automation to manage large amounts in an economical way But the large variety of
battery cells and battery system systems is a major challenge for automated dismantling Enable the storage of all important data from the operational history of the battery pack at
individual battery cell level Find suitable application for each cell, module or system The access to this data has to be enabled. The design of electronics for use in automobiles and in stationary applications would make it
possible to move the battery to its second use without making any major concessions with regard to the required performance
2ND LIFE BATTERIES- SUBTASK 4.2: MATERIALS FLOW AND COLLECTION EFFORT AT END-OF-LIFE

Possibility to integrate 2nd life as a base case
21
EV batteries reaching EoL (80 % SoHcap) repurposed for stationary application (ESS)
Main advantage: Quantity of FU increased by far environmental impacts / QFU get improved
Few examples over the world
Application EV Passenger Car Stationary
Life-time of the installed system [year]
10 15
Battery system capacity [kWh] 40 32 (= 40 x 80%)
SoH @ EoL 80% 50%*
Quantity of functional units (QFU) 43 200 216 000
*Non-critical application
SUBTASK 4.2 – MATERIALS FLOW AND COLLECTION EFFORT AT END-OF-LIFE - 2ND LIFE BATTERIES

EoL of EV batteries
22
The data stored during the life of the battery in the BMS may include the following parameters (at pack, battery pack and sub-pack levels): remaining capacity; battery temperature profile; overall kilometres (pack level); load and charge profile of each battery pack/module/cellThis might also increase information transparency and there the trust of customers in 2nd hand EV car
Challenges Possible solutions
Mechanical Facilitate the operations of repair, remanufacture and repurpose
Use of physical features of the product (battery) that enable assembly/disassembly
Information Quality of the modules, in particular: determination of the State of Health (SoH) of a used battery
Data storage and access to some data stored in the BMS to facilitate the determination of the State of Health (SoH)
SUBTASK 4.2 – MATERIALS FLOW AND COLLECTION EFFORT AT END-OF-LIFE - 2ND LIFE BATTERIES

Two fold approach in theory possible
23
SUBTASK 4.2 – MATERIALS FLOW AND COLLECTION EFFORT AT END-OF-LIFE - 2ND LIFE BATTERIES
Specific measures targeting 1st life EV battery systems to prepare / facilitate repurposing
Specific measures targeting ESS battery systems manufactured with 2nd life battery components to push such a market.
Otherwise: such batteries systems might have to fulfill same requirements as ESS battery systems manufactured with brand new battery components

SUBTASK 4.2: MATERIALS FLOW AND COLLECTION EFFORT AT END-OF-LIFE
Recycling
24
Recycling
25
Currently recycling processes focus on the recovery of the most valuable materials Ni and Co.Next to the high commodity prices for these materials, expect future shortage due to the increasing production of lithium-ion batteries
Recycling of Li-ion batteries is currently low, due to: very small battery volumes reaching end of life poor knowledge of battery design; a lack of proper pack and cell marking.
RECYCLING- SUBTASK 4.2 – MATERIALS FLOW AND COLLECTION EFFORT AT END-OF-LIFE
Recycling processes for LIB are a combination of different individual processes: The deactivation can be done by discharging the entire battery system The pyrometallurgical process involves the recovery of metal from the electrode materials
with the help of thermal processes Bind heavy metals cobalt, copper and nickel in a melt, other metal components are completely slagged and could be deposited in a landfill.
The hydrometallurgical uses leaching and some preparation processes enables direct recovery of metals as cobalt, nickel, manganese and lithium and extraction of
Al and Li from the slag of pyrometallurgical processes.

Recycling efficiency
26
RECYCLING- SUBTASK 4.2 – MATERIALS FLOW AND COLLECTION EFFORT AT END-OF-LIFE
The efficiency of battery recycling is a combination of the collection rate and the recycling efficiency.
The collection and recycling of batteries is regulated under the Directive 2006/66/EC, which is currently under revision (the PEF assumes 95% collection rate for emobility)
The recycling efficiency differs according to the processes used.
Combination of pyrom. & hydrom. processes - NMC and LFP [%]
Purely hydrometallurgical process - NMC only [%]
Purely hydrometallurgical process - LFP only [%]
Lithium 57 94 81
Nickel 95 97 NA
Manganese 0 ~100 NA
Cobalt 94 ~100 NA
Iron 0 NA 0
Phosphate 0 NA 0
Natural graphite 0 0 0
Please review and provide further input on the extra cost/energy required for lithium andnatural graphite recycling in different processes, which will be useful in Task 6. Input for PEF: 6.6 End of life
Source: Lebedeva, Natalia; Di Persio, Franco; Boon-Brett, Lois (2016): Lithium ion battery value chain and related opportunities for Europe. In: European Commission, Petten.
Next steps
27
DATA SOURCING
Today Introduction of the data sources Warmly invited to review and provide input Spreadsheet will be shared after the meeting via emailAfter the stakeholder Meeting: We kindly ask for your feedback until: 20. January 2018
