ecological health layers water bodies - new jersey · remedial priority system ecological health...
TRANSCRIPT
Remedial Priority System
Ecological Health Layers
Water Bodies “Surface Water Quality Standards”
March 2012

Ecological Receptor Layers
The Ecological Receptor Layers developed by the Department are:
• Pinelands,
• Highlands,
• Water Bodies (Surface Water Quality Standards),
• Natural Heritage,
• Landscape - Habitats and Animals,
• Other Freshwater Wetlands,
• Salt Water Marsh

Derived Layer based on population
• Reason for Inclusion: The Surface Water Quality Standards (SWQS) establish the designated uses to be achieved and specify the water quality (criteria) necessary to protect the State's waters. Designated uses include potable water, propagation of fish and wildlife, recreation, agricultural and industrial supplies, and navigation. These are reflected in use classifications assigned to specific waters.
• Source Layers: • Surface Water Quality Standards
– Basis for Layer: Streams designated as antidegredation
• Land Use
– Basis for Layer: The Surface Water Quality Standards layers were intersected with the water land use areas to give a
better polygon coverage.
Water Body Layer
• Cell Values:
• Four new layers were created from the surface water quality standards (SWQS) coverage based on antidegradation values for Category One Waters (C1), Category Two Waters (C2), Delaware River (DL), and Outstanding National Resource Waters (ON). Each of these layers were intersected with land use areas described as water to give a better defined polygon coverage of water bodies. The same was done with land use areas defined as wetlands resulting in four wetlands polygon layers with an antidegradation value. Each of these 12 layers (four each for streams, lakes and wetlands) were buffered by 300' and 500'. Each of these layers (now 24) were given an initial value, exported into a raster coverage and then combined into one composite raster taking the max value from input grids.
• Values were created to reflect inter-relationships between this layer and all other Ecological Receptor Layers.
Water Body Layer

Ecological Health Layers
Surface Water Quality Standards Cell Values
Anti
Degradation “Category”
300 ft
buffer
500 ft
buffer
300'
Wetland
500'
Wetland
DR DRBC – Zone 5 300 230 150 110
DR DRBC – Zone 4 400 300 200 150
DR DRBC – Zone 3 500 380 250 190
DR DRBC – Zone 2 500 380 250 190
DR DRBC – Zone 1E 600 450 300 230
DR DRBC – Zone 1D 600 450 300 230
DR DRBC – Zone 1C 600 450 300 230
Water Body Layer
The Cell Values for the Delaware River Basin Commission Zones:
Key for this Table is on slide 9

Ecological Health Layers
Surface Water Quality Standards Cell Values
Anti
Degradation “Category”
300 ft.
buffer
500 ft.
buffer
300'
Wetland
500'
Wetland
C2 SE3 300 230 150 110
C2 SE2 300 230 150 110
C2 SE1 300 230 150 110
C2 FW2 – NT / SE3 400 300 200 150
C2 FW2 – NT / SE2 500 380 250 190
C2 FW2 – NT / SE1 500 380 250 190
C2 FW2 – NT 600 450 300 230
C2 FW2 – TP 700 530 350 260
C2 FW2 – TM 800 600 400 300
Water Body Layer
The Cell Values for the Category Two Waters:
Key for this Table is on slide 9

Ecological Health Layers
Surface Water Quality Standards Cell Values
Anti
Degradation “Category”
300 ft.
buffer
500 ft.
buffer
300'
Wetland
500'
Wetland
C1 FW2 – NT / SE2 600 450 300 230
C1 FW2 – NT/SE1/SC 600 450 300 230
C1 FW2 – NT / SE1 600 450 300 230
C1 FW2 – NT 700 530 350 260
C1 FW2 – TP 800 600 400 300
C1 FW2 – TM 900 680 450 340
Water Body Layer
The Cell Values for Class One Waters:
Key for this Table is on slide 9

Ecological Health Layers
Surface Water Quality Standards Cell Values
Anti
Degradation “Category”
300 ft.
buffer
500 ft.
buffer
300 ft.
Wetland
500 ft.
Wetland
ON FW1 800 600 400 300
ON FW1 – TP 900 680 450 340
ON FW1 – TM 900 680 450 340
ON PL 1000 750 500 380
ON PL – TM 1000 750 500 380
Water Body Layer
The Cell Values for Outstanding National Resource Waters:
• Calculation Method:
– All cells that are within the ground water Extent Area are summed.
Key for this Table is on slide 9

Antidegradation Categories •ON - Outstanding National Resource Waters •C1 - Category One Waters: Protected from any measurable change in water quality because of ecological, recreational or fisheries resources.
•C2 - Category Two Waters: A "default" designation that applies to all surface waters
except those designated as Outstanding National Resource Waters (ONRW) or C1. •DR - Delaware River
Stream Classifications •DRBC - Delaware River Basin Commission
• Zones 1,2,3,4 & 5 - The Delaware River is divided into five Zones •SE - Saline Estuarine Waters/3 Categories •FW - Freshwater •NT - Non-Trout •TP - Trout Producing •TM - Trout Maintenance •PL - Pinelands
Water Body Layer
Key for Cell Value Tables

• The following is the method used to create the Water Body GIS layer
Water Body Layer

Creating the Water Body Layer
Site
Water Body Layer
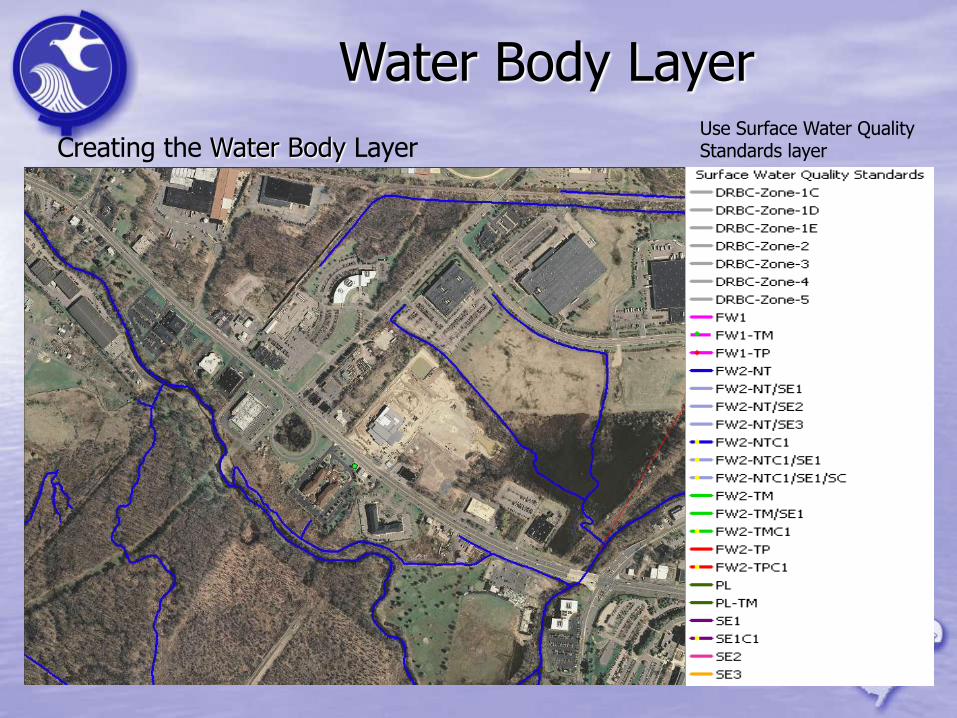
Use Surface Water Quality Standards layer Creating the Water Body Layer
Water Body Layer
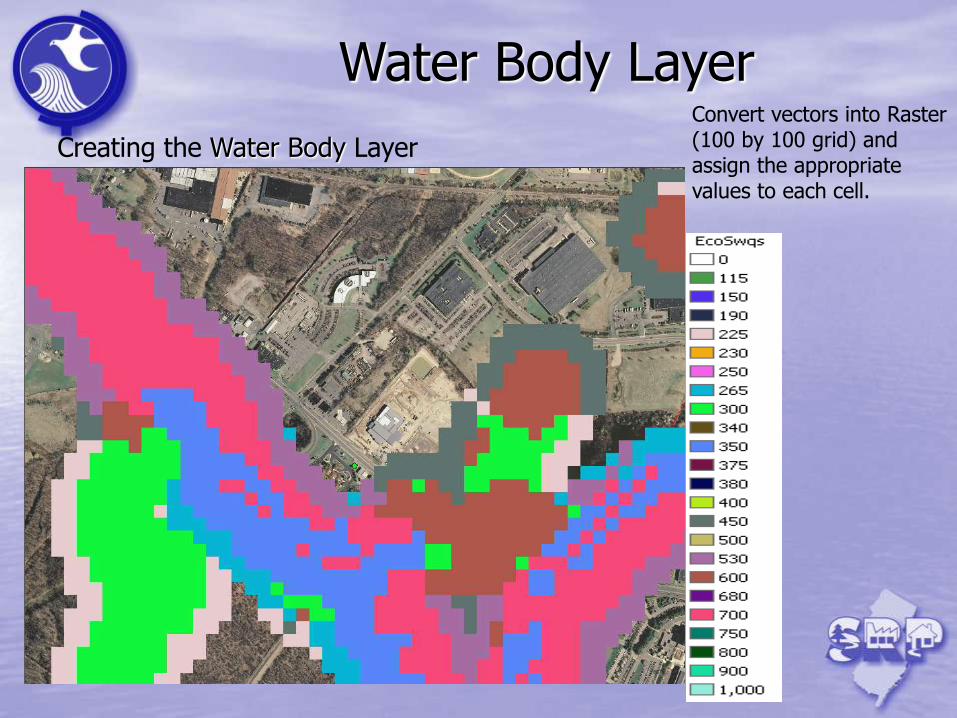
Convert vectors into Raster (100 by 100 grid) and assign the appropriate values to each cell.
Creating the Water Body Layer
Water Body Layer

Creating the Water Body Layer
Water Body Layer
Site
Extent Area
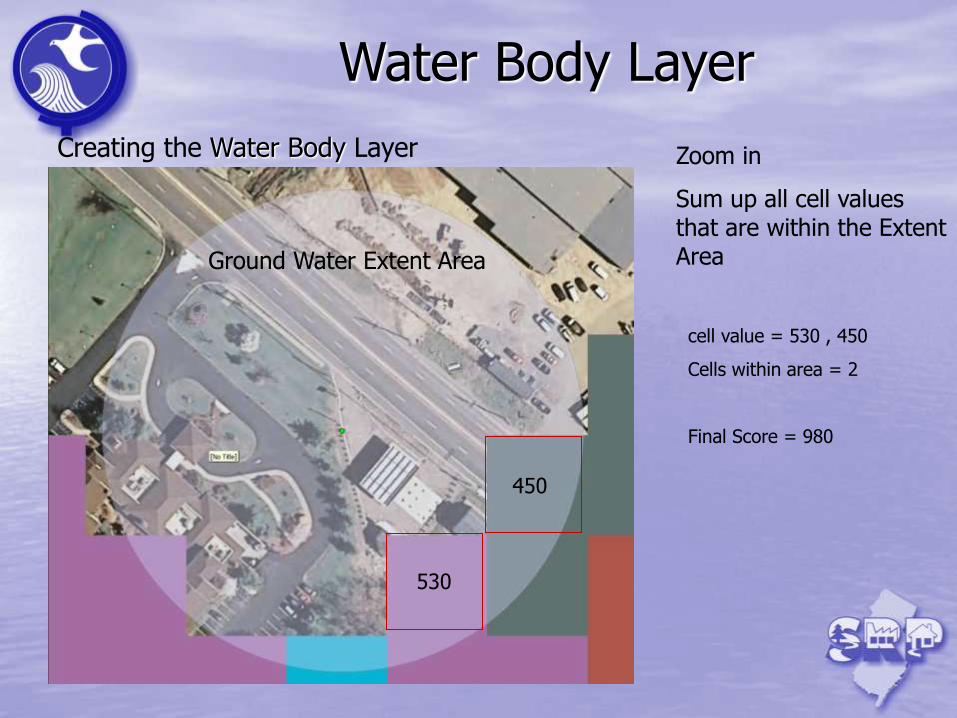
Zoom in
Sum up all cell values that are within the Extent Area
cell value = 530 , 450
Cells within area = 2
Final Score = 980
Creating the Water Body Layer
Water Body Layer
Ground Water Extent Area
530
450
• A Water Body Layer is created for the entire state.
• The following is the layer used to calculate the Water Body Receptor Layer Score.

Legend Ecological: Water
Body (SWQS) Score:
Ecological: Water Body