ecological immunology in a fluctuating environment: an
TRANSCRIPT

Ecological immunology in a fluctuating environment: anintegrative analysis of tree swallow nestling immunedefenseGabriel Pigeon1,2, Marc B�elisle1, Dany Garant1, Alan A. Cohen3 & Fanie Pelletier1,2
1D�epartement de biologie, Universit�e de Sherbrooke, 2500 boulevard de l’Universit�e, Sherbrooke, QC, J1K 2R1, Canada2Canada Research Chair in Evolutionary Demography and Conservation, D�epartement de biologie, Universit�e de Sherbrooke, 2500 boulevard de
l’Universit�e, Sherbrooke, QC, J1K 2R1, Canada3D�epartement de m�edecine de famille, Universit�e de Sherbrooke, 3001 12�e Ave Nord, Sherbrooke, QC, J1H 5N4, Canada
Keywords
Agricultural intensification, bird, ecological
immunology, integrated immune score,
performance, tree swallow.
Correspondence
Gabriel Pigeon, Universitee de Sherbrooke,
2500 boulevard de l’Universitee, Sherbrooke,
QC, J1K 2R1, Canada. Tel: (819) 821 8000
63020; Fax: (819) 821 8049;
E-mail: [email protected]
Funding information
This work was supported by funding from
the Natural Sciences and Engineering
Research Council (NSERC) of Canada through
Discovery grants to M.B., D.G. and F.P., the
Canadian foundation for innovation (CFI)
grants to M.B. D.G. and F.P., the Fonds
Qu�eb�ecois de la Recherche sur la Nature et
les Technologies (FQRNT) new researcher
grant to F.P. and the Canada Research Chair
program (CRC to FP and MB).
Received: 17 October 2012; Revised: 17
January 2013; Accepted: 21 January 2013
Ecology and Evolution 2013; 3(4): 1091–1103
doi: 10.1002/ece3.504
Abstract
Evolutionary ecologists have long been interested by the link between different
immune defenses and fitness. Given the importance of a proper immune
defense for survival, it is important to understand how its numerous compo-
nents are affected by environmental heterogeneity. Previous studies targeting
this question have rarely considered more than two immune markers. In this
study, we measured seven immune markers (response to phytohemagglutinin
(PHA), hemolysis capacity, hemagglutination capacity, plasma bactericidal
capacity, percentage of lymphocytes, percentage of heterophils, and percentage
of eosinophils) in tree swallow (Tachycineta bicolor) nestlings raised in two
types of agro-ecosystems of contrasted quality and over 2 years. First, we
assessed the effect of environmental heterogeneity (spatial and temporal) on the
strength and direction of correlations between immune measures. Second, we
investigated the effect of an immune score integrating information from several
immune markers on individual performance (including growth, mass at fledg-
ing and parasite burden). Both a multivariate and a pair-wise approach showed
variation in relationships between immune measures across years and habitats.
We also found a weak association between the integrated score of nestling
immune function and individual performance, but only under certain environ-
mental conditions. We conclude that the ecological context can strongly affect
the interpretation of immune defenses in the wild. Given that spatiotemporal
variations are likely to affect individual immune defenses, great caution should
be used when generalizing conclusions to other study systems.
Introduction
Wild organisms are continuously exposed to pathogens
such as viruses, bacteria, or macroparasites. An individ-
ual’s immune capacity is thus closely linked to its fit-
ness (Saino et al. 2004; Cichon and Dubiec 2005).
Several studies have shown that environmental condi-
tions can affect an organism’s immune defenses (Neve
et al. 2007; Arriero 2009). Understanding why and how
biotic and abiotic factors contribute to variation in
immunity in free-living organisms is therefore critical to
understanding the evolution of physiological systems
(Martin et al. 2011). The fact that environmental condi-
tions can interact with an organism’s immune defenses
has prompted the emergence of a new field often
referred to as ecological immunology. Given that
immune defenses are costly to develop, maintain, and
use (reviewed in Lochmiller and Deerenberg 2000), indi-
viduals are expected to trade-off limited resources
between immunity and other costly functions such as
growth and reproduction. Maximization of an organ-
ism’s immune defenses is also limited due to the risk of
an over-responsive immune system, which can lead to
autoimmune pathology (Graham et al. 2005; Sadd and
Siva-Jothy 2006). Immune defenses are thus expected to
be under stabilizing selection. For example, in blue tits
© 2013 The Authors. Ecology and Evolution published by Blackwell Publishing Ltd. This is an open access article under the terms of the Creative
Commons Attribution License, which permits use, distribution and reproduction in any medium, provided the original work is properly cited.
1091

(Cyanistes caeruleus), individuals at both extremes of
antibody responsiveness were shown to have lower
survival probability (Raberg and Stjernman 2003). The
optimal level of immune defense, however, is not fixed
because different environments have different pathogen
pressures, which can lead to local optima (Viney et al.
2005). Relating immunity and fitness is therefore not a
trivial task because the environment and immune sys-
tem are involved in complex relationships.
An organism’s immune defenses are the result of a com-
plex network system composed of many effectors or func-
tions that deal with infections originating from diverse
pathogens (Segel and Cohen 2001). This complexity causes
important challenges for researchers interested in studying
the immune system in an ecological context. Until
recently, few studies had simultaneously considered more
than two immune indices. To bring new insights to our
understanding of eco-immunology, researchers have come
to the consensus that multiple immune indices should be
used to quantify the immune defenses of an individual.
For example, Buehler et al. (2011) found that several
immune indices of red knots (Calidris canutus) varied sig-
nificantly over the annual cycle. Similarly, immune func-
tions of house sparrows (Passer domesticus) have been
found to change during the annual cycle (Pap et al. 2010).
Immune functions can also change according to environ-
mental constraints as red knots in captivity appear to use
different immune strategies than wild individuals (Buehler
et al. 2008). Correlations between immune measures can
also vary. Matson et al. (2006a) measured 13 immune
markers and detected positive correlations between func-
tionally related immune markers, such as hemolysis and
hemagglutination, within waterfowl (Anseriformes) species.
However, those correlations were no longer significant
when compared across species, suggesting different inter-
specific immune constraints. Correlations among immune
markers could also vary within a species. In the wild, the
correlation between phytohemagglutinin (PHA)-induced
inflammation and humoral immune response differs
between tree swallows (Tachycineta bicolor) living in Ten-
nessee and those living in New York or Alaska (Ardia
2007). The rearing environment is also known to modify
the correlation between PHA response and immunoglobu-
lin level in blue tit nestlings (Arriero 2009). Although few
studies have investigated within-population differences,
based on patterns observed across populations, different
environmental conditions within populations are also
expected to affect the strength and direction of correlations
among immune indices. For example, low-quality habitat
could generate trade-offs between different components of
the immune defenses leading to negative correlations.
The aim of this study was to assess the effects of envi-
ronmental quality and annual variation on the correla-
tions among seven immune markers in tree swallow
nestlings raised in contrasted agro-ecosystems of southern
Qu�ebec, Canada. Previous studies on this system have
revealed large differences in environmental quality both
over time and space (Ghilain and B�elisle 2008; Rioux
Paquette et al. In press; Baeta et al. 2012; see study area
section). More specifically, we assessed: (1) if correlations
between different immune measures changed across habi-
tat and year in a predictable manner, and (2) if an inte-
grated immune score correlated with individual
performance. We used seven immune measures to assess
the immune system of nestlings. Those measures included
(1) the response to phytohemagglutinin (PHA), a mea-
sure of induced pro-inflammatory capacity (Vinkler et al.
2010); (2) the hemolysis capacity, a measure of natural
antibody levels; (3) the hemagglutination capacity, a mea-
sure of the complement activation (Matson et al. 2005);
(4) the bactericidal capacity of plasma, a measure of the
capacity to eliminate bacterial pathogens (Matson et al.
2006b); (5) the percentage of lymphocytes, a measure of
immunological investment (Beldomenico et al. 2008); (6)
the percentage of heterophils, non-specific, phagocytizing
cells that are modulators of inflammatory responses
(Maxwell and Robertson 1998); and (7) the percentage of
eosinophils, which play a role in inflammation and
defense against parasites (Davis et al. 2008). We then
combined a multivariate and a simpler pair-wise correla-
tion approach (as suggested in Buehler et al. 2011) to
assess how environmental heterogeneity affects the consis-
tency of relationships among immune measures and to
evaluate the effect of immunity on three proxies of indi-
vidual performance (fledgling mass, nestling growth, and
parasite burden).
Materials and Methods
Study area and population
Tree swallows are small aerial insectivores
(mean � SD = 21.9 � 1.5 g) that breed during summer
over most of North America. They are mostly found in
open habitats near water or agricultural fields (Winkler
et al. 2011). Our study was conducted using nest-boxes
established in 2004 in southern Qu�ebec, Canada, over a
10,200 km2 area (Fig. 1). Although the breeding activities
of tree swallows have been followed yearly since 2004,
monitoring of immune measures started in 2010. There-
fore, this study focuses on tree swallow nestlings born in
2010 and 2011 on 10 farms (10 nest-boxes/farm) located
at both extremes of a gradient of agricultural intensifica-
tion (i.e., 4 farms in extensively cultivated farmlands and
6 farms in intensively cultivated farmlands). Agricultural
intensification is characterized by a shift to higher pro-
1092 ª 2013 The Authors. Ecology and Evolution published by Blackwell Publishing Ltd.
Eco-immunology in a Fluctuating Environment G. Pigeon et al.

ductivity cultivars grown as part of large monocultures, a
reduction in marginal habitats and increased use of
pesticides and fertilizers (Donald et al. 2006). It has been
associated with a decline of farmland bird populations in
many countries (Chamberlain et al. 2000; Murphy 2003)
and to a greater extent, of aerial insectivorous birds such
as tree swallows (Blancher et al. 2009; Nebel et al. 2010).
The mechanisms through which agricultural intensifica-
tion negatively affects bird populations involve the
homogenization of habitat and landscape structure as well
as pesticide use which are all hypothesized to lower insect
prey abundance (Benton et al. 2002). For instance, insect
prey availability within intensively cultivated landscapes
has been shown to be lower than in extensively cultivated
ones in our study system (Rioux Paquette et al. In press).
Moreover, the clutch size and fledging probability of tree
swallows decrease with increasing amounts of intensively
cultivated areas within 5 km of our nest-boxes (Ghilain
and B�elisle 2008). Nest-box occupancy by tree swallows
within intensive farmlands of our study system is also
lower due to competition with house sparrows (Robillard
et al. 2012). All of these evidences support the assumption
that extensively cultivated landscapes consist in higher
quality habitats compared to intensively cultivated ones.
We accordingly assigned nest-boxes to either intensive
(low-quality habitat) or extensive (higher quality habitat)
agricultural landscapes on the basis of the relative cover
of intensive and extensive cultivars found within a radius
of 500 m and 5 km of nest-boxes. We defined intensive
agricultural landscapes as those mostly composed of
annual crops, such as corn, soybean, and other cereals,
and extensive ones as those mostly composed of hayfields,
pastures and fallows (for more details on landscape char-
acterization see Ghilain and B�elisle 2008). At the 500-m
scale, cultivars were identified visually in the field on each
year and reported on orthophotos (1:40 000). The relative
cover of intensive and extensive cultivars was then calcu-
lated using ArcView GIS Spatial Analyst 2.0a (ESRI 2005).
At the 5-km scale, the relative cover of intensive and
extensive cultivars was also measured with ArcView, but
based on a mosaic of geo-referenced and classified Land-
sat-7 satellite images taken between August 1999 and May
2003 (pixel resolution 25 9 25 m; Canadian Wildlife Ser-
vice 2004). The relative cover at both the 500-m and the
5-km scale was highly correlated (intensive-2010:
r = 0.90; intensive-2011: r = 0.84; extensive-2010:
r = 0.75; extensive-2011: r = 0.67), leading to the same
classification of nest-boxes over both years.
(a) (b)
Figure 1. A) Adult tree swallow (Tachycineta bicolor) on a branch and B) distribution of the 10 farms used in this study and located along a
gradient of agricultural intensification in southern Qu�ebec, Canada, 2010–2011. The location of the study area at larger scale is represented by a
star on the map in the top right corner. Land cover types (represented by the colours black, green, yellow and red) are based on a mosaic of
classified LANDSAT-7 satellite images (Canadian Wildlife Service 2004). Dark squares indicate intensive farm locations and white squares indicate
extensive farm locations. Photo by Gabriel Pigeon.
ª 2013 The Authors. Ecology and Evolution published by Blackwell Publishing Ltd. 1093
G. Pigeon et al. Eco-immunology in a Fluctuating Environment

Blood sampling
We collected blood samples of nestlings on day 8 after
hatching from the left brachial vein using heparinized
capillaries. The first 5 lL was used for leukocyte counts.
An additional 30 lL was dried on filter paper to deter-
mine sex based on DNA (for details, see Porlier et al.
2009). All remaining blood was immediately put on ice
and centrifuged within 45 min. Capillaries were centri-
fuged 10 min at 14,500 g (using a Clinical 200 centrifuge,
VWR, Quebec, Canada) before freezing. Plasma was kept
frozen until used for agglutination and bacteria killing
assays (see below). If the total plasma volume collected
was inferior to 50 lL, nestlings were re-sampled 2 days
later and both plasma samples homogenized to obtain a
sufficient volume for assays (76% of 210 nestlings were
re-sampled). Differing proportion of plasma of 8- versus
10-day-old nestling had no significant effect on relevant
immune (linear mixed model; bactericidal capacity:
coef. = 0.01 � 0.06 SE, P = 0.82; hemagglutination:
�0.10 � 0.12, P = 0.40; and lysis: �0.32 � 0.33,
P = 0.34). This is similar to results from Palacios et al.
(2009), who found no significant effect of nestling age on
lysis or hemagglutination.
Immunity measurements
PHA response
We measured pro-inflammatory response by measuring
the response to phytohemagglutinin (PHA; Martin et al.
2006; Pigeon et al. In press). Nestlings were tested on day
14 after hatching. Each bird was injected 0.1 mL of PHA
1 mg/mL (L8754-50MG, Sigma Aldrich, St Louis, MO,
USA) diluted in phosphate-buffered saline (no. 811-010-
CL, Wisent, St-Bruno, Canada) in the left wing patagium.
PHA response was measured as the difference in pata-
gium thickness (in mm) before and after PHA injection
as determined with a screw micrometer (293 MDC-Lite,
Mitutoyo Corporation, Montreal, Canada, �0.001 mm).
The second patagium measurements were taken 48 h fol-
lowing injection (mean � SD = 47.92 � 0.49 h). All
patagium measurements were made by the same observer.
Repeatability of PHA measurements, defined as the pro-
portion of the total variation that can be attributed to
variation among individuals versus variation among mea-
surements within individuals (Wolak et al. 2012), was
very high r = 0.97, n = 408 nestlings, 3 repeated.
Agglutination and lysis
We measured natural antibodies and complement
effectiveness using a hemolysis-hemagglutination assay
following the protocol of Matson et al. (2005) modified
by Palacios et al. (2009). Briefly, 10 lL of plasma was
used for a serial dilution (1:2) in phosphate-buffered sal-
ine in a 96-well u-bottom plate (3797, Corning Inc.,
Corning, NY, USA) to obtain 11 plasma concentrations
with a negative control for each sample. We then added
10 lL of a 2% rabbit red blood cell solution (R309-0050,
Rockland Immunochemicals, Gilbertsville, PA) to each
sample and incubated them 90 min at 37ºC, then 20 min
at 20ºC inclined at 45º before scanning the samples at
300 dpi resolution (HP CM1312nfi mfp). Agglutination
and lysis were scored from the scan from 1 to 12 (the
negative log2 of the last plasma dilution exhibiting agglu-
tination and lysis as in Matson et al. (2005)). We tested
individuals in duplicate when sufficient plasma was avail-
able (n = 175 of 210) and used mean score in statistical
analyses. All scoring was done by G. Pigeon blind to nest-
box location. To avoid storage effects on measurements,
scoring was performed within 2 months after the field
season. Therefore, the year was known to the observer,
but the average scoring in respective years was unknown.
Bacteria killing assay
We measured the bactericidal capacity of plasma follow-
ing the bacteria killing assay protocol used by Morrison
et al. (2009) (modified from Matson et al. 2006b). E. coli
pellets (ATCC 8739) were reconstituted and diluted in
PBS to obtain a concentration of 100–150 CFU per plate
on controls. We then added 5 lL of plasma to 20 lL of
this bacteria solution and 95 lL of cell culture medium.
This solution was incubated 45 min at 40ºC before plat-
ing 50 lL on LB plates. A negative control without tree
swallow plasma was made every hour. All plates were per-
formed in duplicate and incubated for 24 h at 40ºC. Thebactericidal capacity of plasma was recorded as [1�(aver-
age number of surviving colonies on an individual’s
plates/average number of colonies on control
plates)] 9 100.
White cell counts
To obtain a leukocyte profile, we smeared and air dried
approximately 5 lL of fresh blood on a glass slide imme-
diately after collection on 8-day-old nestlings. Smears
were stained with quick-dip stain and counter stain with-
out heat fixation (Toma et al. 2006) before they were
scanned for leukocytes using a 109 ocular and 1009 oil
immersion lens. A total of 100 leukocytes were identified
from each slide, noting the frequencies of lymphocytes,
heterophils, eosinophils, basophils, and monocytes. Leu-
kocytes were identified according to Clark et al. (2009).
Basophils and monocytes were not considered further due
1094 ª 2013 The Authors. Ecology and Evolution published by Blackwell Publishing Ltd.
Eco-immunology in a Fluctuating Environment G. Pigeon et al.

to their rarity (<1%). A sub-sample of nine slides was
counted four times to estimate repeatability (Wolak et al.
2012). Repeatability (r) was 0.75, 0.91, and 0.63 for lym-
phocytes, heterophils, and eosinophils, respectively.
Proxies of individual performance
We considered three proxies of individual performance:
growth between 2 and 16 days after hatching, mass at
fledging and parasite burden. Nests were monitored every
2 days during the breeding season (from early May to
mid-July). Nestlings were marked individually by nail
clipping until their 12th day of life and thereafter ringed
with an official aluminum ring. Nestlings were weighed
(� 0.01 g) with a platform scale equipped with a conten-
tion device at 2 and 16 days after hatching. Growth was
calculated as the mass gained between those two measure-
ments. Mass at day 16 was used as fledging mass. The
number of Protocalliphora pupae in each nest was
counted after the breeding season and used as a measure
of parasite burden imposed by a blood-feeding ectopara-
site (Daoust et al. 2012). These three measures of perfor-
mance influence survival and were used as we could not
obtain more direct measures of fitness. Growth and fledg-
ing mass are positively correlated with the probability of
recruitment in several species of birds, including tree
swallow (McCarty 2001; Monros et al. 2002), whereas a
large ectoparasite burden significantly reduces survival
(Thomas et al. 2007). All procedures described in this
study were approved by the Universit�e de Sherbrooke’s
Animal Care Committee (protocol number FP2009-01)
and comply with current Canadian laws regarding animal
research.
Statistical analysis
Assessment of the data structure
We only retained nestlings for which all immunity mea-
sures were available for analyses (n = 210). We checked
all immune measures for normality. Bactericidal capacity
of plasma was highly skewed; we therefore normalized it
prior to all analyses using the following formula: -√(1-bactericidal capacity) (Legendre and Legendre 1998).
Immune measures were then centered and scaled to unit
variance to reduce the impact of measurement units.
Given the statistically inherent correlations among the
percentages of three types of leukocytes (�0.67 �r � �0.30), only one leukocyte percentage was used in
multivariate analysis. We used lymphocyte percentage as
an indicator of immunological investment (Beldomenico
et al. 2008). We conducted a redundancy analysis (RDA),
which is an extension of multiple linear regression to
multivariate response variables (Legendre and Legendre
1998) on immunity measurements (bactericidal capacity,
hemolysis, hemagglutination, response to PHA and per-
centage of lymphocyte) using year, farmland type, sex and
all possible two way interactions as constraining variables
to assess the general correlation structure among all five
immunity variables as well as the impact of possible
grouping variables on their correlation structure. The
RDA was conditioned on nest-box to control for non-
independence of nestlings from the same nest-box. We
then used an ANOVA-like permutation test for RDA
using 1000 permutation to assess the level of significance
(Legendre et al. 2011). The model was then simplified in
a step-wise fashion. The final model included farmland
type, year and their interaction. The RDA and the permu-
tation test were performed using the vegan v2.0-4 package
in R (Oksanen et al. 2012). Given that both year (2010,
2011) and farmland type (extensive, intensive) and their
interaction had significant effects (Table 2), we considered
that our population consisted of four sub-groups, repre-
senting different ecological contexts (intensive-2010,
intensive-2011, extensive-2010 and extensive-2011). Nor-
malized immune measurements were centered and scaled
to unit variance within each sub-group for further analy-
ses. The above analyses were performed in R v2.15. (R
Development Core Team 2012).
Correlation among immunity indices
We followed the statistical methods suggested by Buehler
et al. (2011) for assessing the relationships among
immunity indices and their variability across years and
farmland types. First, principal component analysis (PCA)
and correlation circles were obtained for each of the four
sub-groups using the ade4 package in R (Dray 2007). We
examined correlation circles for principal components
(PC) with an eigenvalue higher than one (i.e., for PC 1
and 2 in all cases, as well as for PC 3 for extensive-2010)
(Electronic, Table S2). To help interpreting the group-
specific PCA axes, we used a pair-wise approach to evalu-
ate the correlations among all our immune markers. We
thus calculated a Pearson’s correlation coefficient and its
95% confidence intervals with the Fisher Z-score method
following Sokal and Rohlf (1994) for every pair of
immune measures by year and by farmland type. These
correlation analyses were also performed in R.
Correlation between immunity and proxies ofindividual performance
We used the scores on the first and second principal
components provided by the group-specific PCAs as gen-
eral immunity indices. The relationships between
ª 2013 The Authors. Ecology and Evolution published by Blackwell Publishing Ltd. 1095
G. Pigeon et al. Eco-immunology in a Fluctuating Environment

immunity and fledging mass and growth were modeled in
R using linear mixed models (Bates et al. 2011) in order
to take into account the non-independence of nestlings
born in the same nest-box. None of the models in which
the effect of PC1 was allowed to vary by nest-box were
significantly better than when only the intercept varied
(most significant: v2 = 3.08, P = 0.21), so a common
slope was used. As burden was assessed at the nest-box
level, the relationship between immunity and parasite
burden was modeled with a linear model using the aver-
age immune score by nest as response variable.
Results
Assessing data structure
We measured the immunity of 210 tree swallow nestlings
over the 2 years of the study (Table 1). Preliminary RDAs
of the entire dataset suggested a difference between years
as well as between habitats of different agricultural
intensity (Electronic, Fig. S1). RDA1 and RDA2
explained, respectively, 16.38% and 3.98% of the variance
in the 5 immune indices (Table S1). The permutation test
supported this interpretation: year, farmland type, and
their interaction, but not nestling sex (Variance = 0.02,
F-value = 1.18, P-value = 0.31), had significant effects on
the measures of nestlings’ immunity (Table 2). Hence,
further analyses were performed on four sub-groups rep-
resenting both farmland types and years.
Relationships among immune measuresacross environments
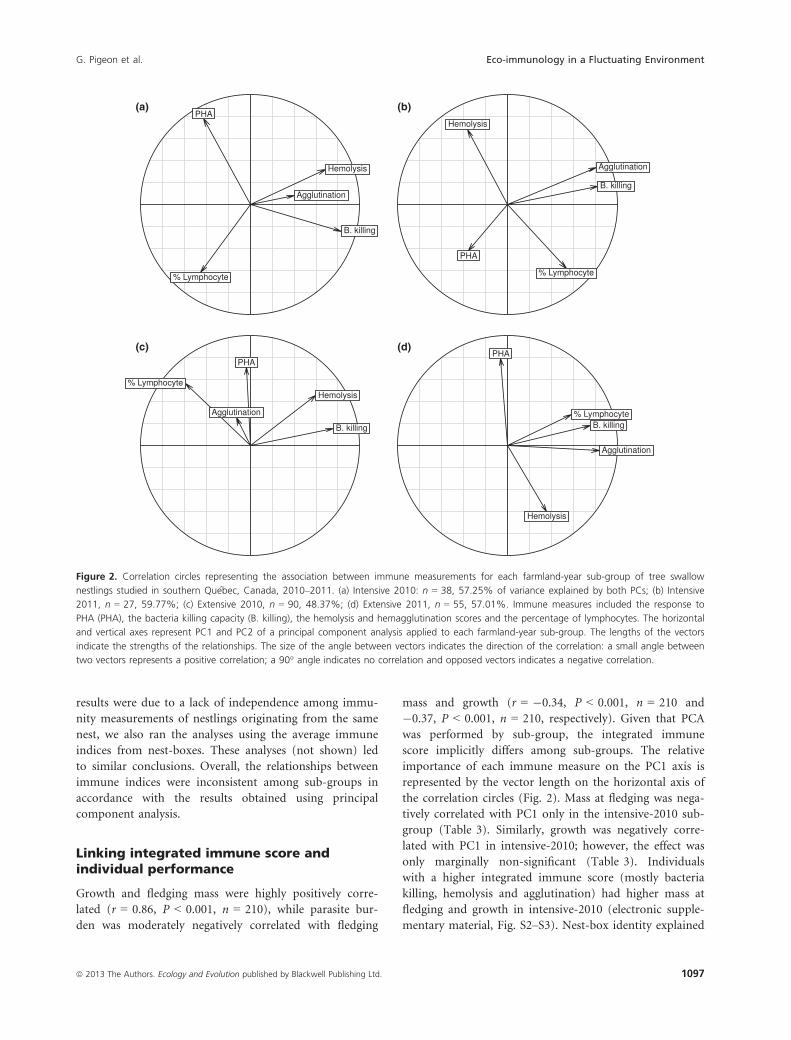
The first two components of the sub-group PCAs explained
together from 48.37% (in extensive-2010) to 59.77% (in
intensive-2011) of the variance (mean = 55.60%). All four
sub-groups showed different correlation patterns. Hemoly-
sis and lymphocyte percentage showed a negative correla-
tion (long opposed [151º and 165º] vectors) in both
intensive sub-groups, in contrast to extensive sub-groups
(either perpendicular (90°) vectors or long and small vec-
tors angled at 99º and 85º; Fig. 2). Agglutination was
strongly positively correlated with bacteria killing capacity
in both intensive-2011 (11º between vectors) and exten-
sive-2011 (17º between vectors), but not in extensive-2010
sub-groups (105º between vectors) or intensive-2010 (28ºbetween vectors, and short vector length for agglutination;
Fig. 2). Relationships between hemolysis and agglutination
were always low. Bacteria killing capacity and percentage of
lymphocytes showed no correlation except in extensive
2011 where the relationship was positive (12º between vec-
tors; Fig. 2).
We used a pair-wise approach to explore correlations
among indices, which showed that sub-groups differed in
the strength and direction of correlations among different
immune markers (Fig. 3). Correlation coefficients ranged
from �0.36 to 0.61. There was considerable variation
even within sub-groups, resulting in large confidence
intervals. Both year and farmland type affected the
strength and direction of several pair-wise correlations.
For instance, the positive correlation between bacteria
killing capacity and agglutination titer was significant only
in 2011 (intensive: r = 0.61, P < 0.001; extensive:
r = 0.49, P = 0.001). Also, the correlation differed signifi-
cantly between extensive-2010 (r = 0.02, P = 0.82) and
extensive-2011. In contrast, the correlation between bacte-
ria killing capacity and hemolysis was significant in 2010
(intensive: r = 0.38, P = 0.02; extensive: r = 0.21,
P = 0.05), but not in 2011 (intensive: r = �0.10,
P = 0.63; extensive: r = 0.06, P = 0.66). Additionally, only
extensive-2011 had a significant agglutination–lymphocyte
correlation (r = 0.29, P = 0.03). Although none of the
four sub-group correlations between hemolysis and lym-
phocyte percentage differed significantly, farmland type
seemed to have a greater effect on the correlations than
did year. Only in intensive-2010 did a significant negative
correlation between two immune indices occur, namely
between PHA response and bacteria killing capacity of
plasma (r = �0.37, P = 0.02). To assess whether our
Table 1. Descriptive statistics of seven immune measures taken on
tree swallow nestlings in southern Qu�ebec, Canada, 2010 (n = 128)
and 2011 (n = 82).
Immune marker Mean Median Minimum Maximum
PHA 1.10 1.11 0.02 2.26
Bacteria killing 0.72 0.85 0.00 1.00
Hemolysis 1.21 1.00 0.00 3.50
Agglutination 8.22 8.25 3.00 12.00
% lymphocytes 44.63 45.00 15.00 79.00
% heterophils 28.89 29.00 6.00 58.00
% eosinophils 25.42 25.00 6.00 51.00
Table 2. Effects of different grouping variables on five immune mea-
sures taken on tree swallow nestlings in southern Qu�ebec, Canada
(2010–2011; see Table 1) and assessed by redundancy analysis. Het-
erophil and eosinophil percentages were ignored because of non-
independence with lymphocyte percentage. P-values were obtained
based on ANOVA-like permutation tests conditioned by nest-boxes
using 1000 permutations. Sample size is 210.
Grouping variable Variance F-value P-value
Year 0.73 37.86 <0.001
Farmland type 0.08 4.27 0.001
Year: Farmland type 0.13 6.48 <0.001
1096 ª 2013 The Authors. Ecology and Evolution published by Blackwell Publishing Ltd.
Eco-immunology in a Fluctuating Environment G. Pigeon et al.
results were due to a lack of independence among immu-
nity measurements of nestlings originating from the same
nest, we also ran the analyses using the average immune
indices from nest-boxes. These analyses (not shown) led
to similar conclusions. Overall, the relationships between
immune indices were inconsistent among sub-groups in
accordance with the results obtained using principal
component analysis.
Linking integrated immune score andindividual performance
Growth and fledging mass were highly positively corre-
lated (r = 0.86, P < 0.001, n = 210), while parasite bur-
den was moderately negatively correlated with fledging
mass and growth (r = �0.34, P < 0.001, n = 210 and
�0.37, P < 0.001, n = 210, respectively). Given that PCA
was performed by sub-group, the integrated immune
score implicitly differs among sub-groups. The relative
importance of each immune measure on the PC1 axis is
represented by the vector length on the horizontal axis of
the correlation circles (Fig. 2). Mass at fledging was nega-
tively correlated with PC1 only in the intensive-2010 sub-
group (Table 3). Similarly, growth was negatively corre-
lated with PC1 in intensive-2010; however, the effect was
only marginally non-significant (Table 3). Individuals
with a higher integrated immune score (mostly bacteria
killing, hemolysis and agglutination) had higher mass at
fledging and growth in intensive-2010 (electronic supple-
mentary material, Fig. S2–S3). Nest-box identity explained
(a) (b)
(c) (d)
Figure 2. Correlation circles representing the association between immune measurements for each farmland-year sub-group of tree swallow
nestlings studied in southern Qu�ebec, Canada, 2010–2011. (a) Intensive 2010: n = 38, 57.25% of variance explained by both PCs; (b) Intensive
2011, n = 27, 59.77%; (c) Extensive 2010, n = 90, 48.37%; (d) Extensive 2011, n = 55, 57.01%. Immune measures included the response to
PHA (PHA), the bacteria killing capacity (B. killing), the hemolysis and hemagglutination scores and the percentage of lymphocytes. The horizontal
and vertical axes represent PC1 and PC2 of a principal component analysis applied to each farmland-year sub-group. The lengths of the vectors
indicate the strengths of the relationships. The size of the angle between vectors indicates the direction of the correlation: a small angle between
two vectors represents a positive correlation; a 90° angle indicates no correlation and opposed vectors indicates a negative correlation.
ª 2013 The Authors. Ecology and Evolution published by Blackwell Publishing Ltd. 1097
G. Pigeon et al. Eco-immunology in a Fluctuating Environment

a large portion of the variance in fledging mass
(mean � SD = 43.29 � 11.69%) and growth (63.18 �6.16%). None of the sub-groups had a significant rela-
tionship between PC2 and fledging mass or growth. The
linear regression using nest average immune score
revealed that the relationship between immunity and
parasite burden were non-significant (Table 3). However,
extensive-2011 showed a marginally significant negative
relationship. Averaging by nest-box greatly reduced our
statistical power, especially in intensive farmlands where
sample size was already small due to lower nest-box
occupancy. Yet, parasite burden in extensive-2011 showed
a marginally significant negative relationship with PC1,
suggesting that individuals with a lower immune score
had higher parasite burden (see Fig. S4).
Discussion
Our results highlight the importance of considering envi-
ronmental heterogeneity when assessing individual
immune defenses. Indeed, the relationships among
immune measures of nestling tree swallows varied across
agricultural environments. Yet, the spatial differences in
environments had important effects that varied through
time. Moreover, while nestlings with greater immune
scores sometimes performed better, the magnitude of the
effect was weak and depended on the environment. Our
results reinforce the claim that the complexity and vari-
ability of the immune system may not be captured by
one or two immune markers (Matson et al. 2006a; Ardia
2007). While the use of multiple immune markers is a
significant step forward for ecological immunology, future
studies will also need to overcome the challenges caused
by temporal and spatial environmental differences.
Relationships among immune measuresacross environments
To face a high diversity of pathogens, the immune sys-
tem must be flexible, which might explain why correla-
tions were not consistent between environments. Matson
et al. (2006a) previously showed that relationships among
immune indices changed across species and Ardia (2007)
showed that within a species (tree swallows) they chan-
ged across populations. Our results now suggest that
there is variation even within a single population and
that correlations vary in an unpredictable manner at the
relatively large spatiotemporal scales that we used (as
suggested by a significant year by farmland-type interac-
tion). Our results suggest that local environment (both
spatial and temporal) can influence the correlation pat-
tern among immune markers and hence, nestlings’
immune defense.
We expected that investment trade-offs among immune
functions, resulting in negative correlations between com-
peting immune components, would be observable in
intensive farmlands, which are composed of lower quality
habitats (Ghilain and B�elisle 2008; Arriero 2009). The
PHA response and the bacteria killing capacity of plasma,
our most functionally different measures (PHA response
−0.
50.
00.
5
Pea
sron
cor
rela
tion
coef
ficie
nts
PH
A−
BK
PH
A−
Lys
BK
−Ly
s
PH
A−
Agg
BK
−A
gg
Lys−
Agg
PH
A−
Lym
BK
−Ly
m
Lys−
Lym
Agg
−Ly
m
PH
A−
Het
BK
−H
et
Lys−
Het
Agg
−H
et
Lym
−H
et
PH
A−
Eos
BK
−E
os
Lys−
Eos
Agg
−E
os
Lym
−E
os
Het
−E
os
Figure 3. Pair-wise Pearson correlation coefficients among immune measures of nestling tree swallows studied in southern Qu�ebec, Canada,
2010–2011, according to levels of agriculture intensity (extensive = circles; intensive = triangles) and year (2010 = filled shape; 2011 = open
shape). Error bars represent 95% confidence intervals calculated by Fisher Z-score transformation. All possible pairs among phytohemagglutinin
response (PHA), hemagglutination (Agg), hemolysis (Lys), bacteria killing capacity of plasma (BK), percentage of lymphocytes (Lym), percentage of
heterophils (Het), and percentage of eosinophils (Eos) were included.
1098 ª 2013 The Authors. Ecology and Evolution published by Blackwell Publishing Ltd.
Eco-immunology in a Fluctuating Environment G. Pigeon et al.

is an induced, mostly cellular, immune response while
bactericidal capacity of plasma is constitutive and
humoral), were significantly negatively correlated
(r = �0.28) only in intensive farmlands in 2010, lending
partial support to our prediction. This result points
toward a trade-off between the innate and acquired
immune system under certain conditions. This is different
from the findings of Palacios et al. (2012), who only
found evidence of a trade-off between cellular and
humoral components of the innate immune system in
tree swallows of Tompkins County, New York (USA).
Nevertheless, other pair-wise correlations among immune
markers were negatively correlated in high-quality habitat
and uncorrelated in low-quality habitat, inconsistent with
this hypothesis. Our results suggest that the answer may
be more complex than a simple trade-off when resources
are limited. Although trade-offs may be present when
resources are limiting, negative correlations may also be
caused by preferential investment in certain immune
components appropriate for the pathogens present in the
habitat. Further research is needed in order to determine
the relative importance of resources and pathogens in a
natural context.
Temporal environmental heterogeneity was also impor-
tant. For example, the correlation between bacteria killing
capacity and lymphocyte percentage was negative in 2010
and positive in 2011. Although 2 years of data are insuffi-
cient to clearly determine how the quality of each year
influences the immune defenses, our results still suggest
that immune markers might reveal opposing results
even in the same population, the same habitat, but for
different years. This is similar to the results of Hegemann
et al. (2012) who found that patterns in immune func-
tions of skylarks (Alauda avensis) differed between years.
At least two non-mutually exclusive explanations can
account for the differences in relationship among immune
measures across our farmland-year sub-groups. First, a
difference in energetic or nutrient constraints could result
from different habitat quality. Nutrition has been shown
repeatedly to have an important impact on immune
defenses (Lochmiller et al. 1993; Siva-Jothy and Thomp-
son 2002). In our study system, Rioux Paquette et al. (In
press) showed that insect prey abundance was lower late
in the season in intensive farmlands when it is most
crucial for nestling development and fledging. Yet this
difference in prey abundances was only observed in 2 out
of 3 years, likely as a result of yearly variations in meteo-
rological conditions. Such differences in resources
between years and habitats could explain the observed
differences in the correlations among immune markers.
Another possible explanation is that pathogen pressure
differs among environments. In our system, the average
number of Protocalliphora pupae per nest ranged from
9.7 � 1.8 in intensive-2010 to 13 � 2.6 in extensive-2011
with intermediate levels in intensive-2011 and extensive-
2010 (6.3 � 2.7 and 6.4 � 2.2, respectively). However,
the abundance of Protocalliphora pupae only differed
between extensive-2010 and extensive-2011 (Tukey post-
hoc test, P = 0.03). Parasites can have a considerable
impact on immune measures (Boughton et al. 2011) and
influence the correlation between the humoral and cellu-
lar immune responses in birds (Johnsen and Zuk 1999).
Table 3. Effect of integrated immune response (PC1) on A) mass at fledging, B) growth between day 2 and 16 after hatching, and C) parasite
burden (number of Protocalliphora pupae in nest) of tree swallow nestlings for each farmland-year sub-group (intensive 2010, intensive 2011,
extensive 2010 and extensive 2011). Estimates (� standard error (SE)) were obtained for linear mixed models including nest-box as a random
effect for mass at fledging and growth and from a linear model for parasites. % refers to the proportion of total variance explained by nest-box
identity.
Sub-group Intensive 2010 Intensive 2011 Extensive 2010 Extensive 2011
No of nestling (no of nest) 38 (11) 27 (10) 90 (25) 55 (16)
A) Fledging mass Estimate 0.485 �0.235 �0.019 0.234
SE 0.221 0.273 0.173 0.198
F-value 4.820 0.742 0.012 1.387
P-value 0.037 0.40 0.91 0.25
% 39.86 28.53 49.68 55.10
B) Growth Estimate 0.034 �0.009 0.003 0.000
SE 0.018 0.028 0.014 0.015
F-value 3.444 0.101 0.034 0.001
P-value 0.075 0.76 0.85 0.98
% 71.25 56.88 60.35 64.24
C) Parasites Estimate �6.181 3.171 �1.967 �6.628
SE 4.258 4.988 3.559 3.359
F-value 1.452 0.636 0.553 1.973
P-value 0.18 0.54 0.58 0.06
ª 2013 The Authors. Ecology and Evolution published by Blackwell Publishing Ltd. 1099
G. Pigeon et al. Eco-immunology in a Fluctuating Environment

For example, infection by coccidians, which are intracellu-
lar intestine parasites, significantly increased bacteria kill-
ing capacity, but not lysis or hemagglutination in house
sparrows (Pap et al. 2011). Likewise, the presence of bac-
terial or viral pathogens is likely to influence investment
in different axes of the immune system (Soler et al.
2011). Although only pathogen pressure from Protocalli-
phora (a large blood sucking ectoparasite) was measured
in this study, the large variability in immune defense pat-
terns observed is consistent with individuals modulating
their immune components according to local environ-
ment in order to optimize their immune defenses.
Integrated immune score and individualperformance
Finding informative indicators of immunological health
has been the holy grail of modern medicine and immu-
nology for decades (Davis 2008). Although, this is funda-
mental both for medicine and eco-immunology, this is
not a trivial task. Our article represents a modest attempt
to do so by applying the novel approach proposed by
Buehler et al. (2011). Correlations among immune mea-
surements were inconsistent among farmland-year sub-
groups. Using a single PCA of the pooled data for the
whole population would thus be unjustified and could
lead to erroneous conclusions (McCoy et al. 2006).
Because PCAs were performed on each farmland-year
sub-group to obtain an integrated immune score, none of
the scores used as explanatory variables have the same
meaning. Interpretation must then be made individually
for each sub-group. While such an approach complicates
the interpretation, it is more appropriate given that indi-
viduals from different sub-groups have probably experi-
enced different ecological conditions (environment,
pathogen pressure, nutritional status; which causes the
differences in immune relationships).
Globally, relationships between the integrated immune
score and performance were low. Variability in immune
strategies within our farmland-year sub-groups could
explain this lack of relationship, suggesting that adjust-
ments within the immune system according to environ-
mental conditions occurred on a very local scale. For
example, the effect of the integrated immune score on
fledging mass and growth was significant only in the
intensive-2010 sub-group. It is difficult to conclude on
the causes of this difference and it must be noted, how-
ever, that causation cannot be inferred from our analysis.
Our results nevertheless suggest that the effect of immu-
nity on performance could fluctuate with the environ-
ment. Consequently, it might be even more challenging
to collapse information from different biomarkers into a
metric that can be linked to fitness. Indeed, it is possible
that individuals with large variation in their immune
defense would perform better than others. Methods used
to analyze complex systems may therefore offer an inter-
esting way to push the envelope further in eco-immunol-
ogy. For example, combining the concept of degeneracy
(ability of different elements of a system to perform simi-
lar functions) and network theory has been proposed by
Tieri et al. (2010) to explore the characteristics of such a
complex system while taking into account the role of
stochastic fluctuations.
Another factor which makes the study of immune
defenses and individual performance difficult is mortality
during early development. Most of the mortality occurs
before all immune measures are obtained, and deceased
individuals are thus not considered in analyses. Given that
mean nestling mortality is relatively high in our study
system and varies across habitats (intensive-2010: 28.0%;
extensive-2010: 20.4%; intensive-2011: 37.3%; extensive-
2011: 25.3%; see also Ghilain and B�elisle (2008)), mea-
surement of immunity is partly based on a post-selection
sample. Nestlings dying before fledging could have lower
immune defenses (Christe et al. 1998). The non-random
removal of individuals with the lowest integrated immune
scores could explain the lack of correlation between our
proxies of individual performance and immunity in
intensive-2011, where mortality was highest. Even though
we missed this invisible fraction (Nakagawa and Freckl-
eton 2008) representing low fitness individuals, we were
still able to detect a correlation between immunity and
fledging mass or parasite burden in intensive-2010 and
parasite burden in extensive-2011.
Concluding remark
Our results suggest that eco-immunological studies on a
particular species, or even a single population, will not be
easily generalized to others. Given that spatiotemporal
variation is likely to affect individual immune defenses,
further studies on multiple immune measures are criti-
cally needed to quantify the importance of environmental
variation on immune defenses. To understand the under-
lying mechanisms of organismal immunity, research must
not only use multiple immune measurements, but also
investigate how immune measures vary in different eco-
logical contexts using larger scale, long-term studies in
order to assess general trends. New statistical approaches
might also be required to analyze data from multiple
biomarkers. Molecular-based immune markers such as
b-defensin genes (Hellgren and Sheldon 2011) or major
histocompatibility complex diversity (Piertney and Oliver
2006) should also be included in studies to assess the
complex interactions between genotype and environment
as well as to tease apart the relative importance of
1100 ª 2013 The Authors. Ecology and Evolution published by Blackwell Publishing Ltd.
Eco-immunology in a Fluctuating Environment G. Pigeon et al.
evolutionary versus ecological variables involved in
immune defense.
Acknowledgments
This work was supported by funding from the Natural Sci-
ences and Engineering Research Council (NSERC) of Can-
ada through Discovery grants to M.B., D.G. and F.P., the
Canadian foundation for innovation (CFI) grants to M.B.
D.G. and F.P., the Fonds Qu�eb�ecois de la Recherche sur la
Nature et les Technologies (FQRNT) new researcher grant
to F.P. and the Canada Research Chair program (CRC to
FP and MB). We are very grateful to H. P.-Gauvin and
C. Gayet for help in the field and to several graduate stu-
dents and research assistants that have contributed to the
long-term tree swallow data collection. We also thank all
the farmers who graciously allow us to conduct our
research on their properties. A.A.C. is a member of the
FRQ-S supported Centre de recherche sur le vieillissement
and Centre de recherche Clinique �Etienne LeBel.
Conflict of Interest
None declared.
References
Ardia, D. R. 2007. The ability to mount multiple immune
responses simultaneously varies across the range of the tree
swallow. Ecography 30:23–30.
Arriero, E. 2009. Rearing environment effects on immune
defence in blue tit Cyanistes caeruleus nestlings. Oecologia
159:697–704.
Baeta, R., M. B�elisle, and D. Garant. 2012. Agricultural
intensification exacerbates female-biased primary brood sex-
ratio in tree swallows. Landscape Ecol. 27:1395–1405.
Bates, D., M. Maechler, and B. Bolker. 2011. lme4: linear
mixed-effects models using S4 classes. R package version
0.999999-0. Available at: http://CRAN.R-project.org/
package=lme4.
Beldomenico, P. M., S. Telfer, S. Gebert, L. Lukomski, M.
Bennett, and M. Begon. 2008. The dynamics of health in
wild field vole populations: a haematological perspective.
J. Anim. Ecol. 77:984–997.
Benton, T. G., D. M. Bryant, L. Cole, and H. Q. P. Crick.
2002. Linking agricultural practice to insect and bird
populations: a historical study over three decades. J. Appl.
Ecol. 39:673–687.
Blancher, P. J., R. D. Phoenix, D. S. Badzinski, M. D. Cadman, T.
L. Crewe, C. M. Downes, et al. 2009. Population trend status of
Ontario ‘s forest birds. Forestry Chronicle 85:184–201.
Boughton, R. K., G. Joop, and S. A. O. Armitage. 2011.
Outdoor immunology: methodological considerations for
ecologists. Funct. Ecol. 25:81–100.
Buehler, D. M., T., Piersma & B. I., Tieleman. 2008. Captive and
free-living red knots Calidris canutus exhibit differences in non-
induced immunity that suggest different immune strategies in
different environments. J. Avian Biol. 39:560–566.
Buehler, D. M., M. A. Versteegh, K. D. Matson, and B. I.
Tieleman. 2011. One problem, many solutions: simple
statistical approaches help unravel the complexity of the
immune system in an ecological context. PLoS ONE 6:e18592.
Chamberlain, D. E., R. J. Fuller, R. G. H. Bunce, J. C.
Duckworth, and M. Shrubb. 2000. Changes in the
abundance of farmland birds in relation to the timing of
agricultural intensification in England and Wales. J. Appl.
Ecol. 37:771–788.
Christe, P., A. P. Møller, and F. de Lope. 1998.
Immunocompetence and nestling survival in the house
martin: the tasty chick hypothesis. Oikos 83:175–179.
Cichon, M., and A. Dubiec. 2005. Cell-mediated immunity
predicts the probability of local recruitment in nestling blue
tits. J. Evol. Biol. 18:962–966.
Clark, P., W. Boardman, and S. Raidal. 2009. Atlas of Clinical
Avian Hematology. Oxford, Wiley-Blackwell, Iowa, Ames.
Daoust, S. P., J. Savage, T. L. Whitworth, M. B�elisle, and
J. Brodeur. 2012. Diversity and Abundance of
Ectoparasitic Blow FliesProtocalliphora(Diptera:
Calliphoridae) and theirNasonia(Hymenoptera:
Pteromalidae) Parasitoids in Tree Swallow Nests within
Agricultural Lands of Southern Qu�ebec, Canada. Ann.
Entomol. Soc. Am. 105:471–478.
Davis, M. M. 2008. A prescription for human immunology.
Immunity 29:835–838.
Davis, A. K., D. L. Maney, and J. C. Maerz. 2008. The use of
leukocyte profiles to measure stress in vertebrates: a review
for ecologists. Funct. Ecol. 22:760–772.
Donald, P. F., F. J. Sanderson, I. J. Burfield, and F. P. J. van
Bommel. 2006. Further evidence of continent-wide impacts
of agricultural intensification on European farmland birds,
1990–2000. Agric. Ecosyst. Environ. 116:189–196.
Dray, S. 2007. The ade4 package: implementing the duality
diagram for ecologists. J. Stat. Softw. 22:1–20.
Ghilain, A., and M. B�elisle. 2008. Breeding success of tree
swallows along a gradient of agricultural intensification.
Ecol. Appl. 18:1140–1154.
Graham, A. L., J. E. Allen, and A. F. Read. 2005. Evolutionary
Causes and Consequences of Immunopathology. Annu. Rev.
Ecol. Syst. 36:373–397.
Hegemann, A., K. D. Matson, C. Both, and B. I. Tieleman.
2012. Immune function in a free-living bird varies over the
annual cycle, but seasonal patterns differ between years.
Oecologia 170:605–618.
Hellgren, O., and B. C. Sheldon. 2011. Locus-specific protocol
for nine different innate immune genes (antimicrobial
peptides: beta-defensins) across passerine bird species reveals
within-species coding variation and a case of trans-species
polymorphisms. Mol. Ecol. Resour. 11:686–692.
ª 2013 The Authors. Ecology and Evolution published by Blackwell Publishing Ltd. 1101
G. Pigeon et al. Eco-immunology in a Fluctuating Environment

Johnsen, T. S., and M. Zuk. 1999. Parasites and tradeoffs in
the immune response of female red jungle fowl. Oikos
86:487–492.
Legendre, P., and L., Legendre. 1998. Numerical Ecology. 2nd
English ed. Elsevier Science, Amsterdam.
Legendre, P., J. Oksanen, and C. J. F. ter Braak. 2011. Testing
the significance of canonical axes in redundancy analysis.
Methods Ecol. Evol. 2:269–277.
Lochmiller, R. L., and C. Deerenberg. 2000. Trade-offs in
evolutionary immunology: just what is the cost of
immunity? Oikos 88:87–98.
Lochmiller, R. L., M. R. Vestey, and J. C. Boren. 1993.
Relationships between protein nutritional status and
immunocompetence in northern bobwhite chicks. Auk
110:503–510.
Martin, L. B., P. Han, J. Lewittes, J. R. Kuhlman, K. C. Klasing,
and M. Wikelski. 2006. Phytohemagglutinin-induced skin
swelling in birds: histological support for a classic
immunoecological technique. Funct. Ecol. 20:290–299.
Martin, L. B., D. M. Hawley, and D. R. Ardia. 2011. An
introduction to ecological immunology. Funct. Ecol. 25:1–4.
Matson, K. D., R. E. Ricklefs, and K. C. Klasing. 2005. A
hemolysis-hemagglutination assay for characterizing
constitutive innate humoral immunity in wild and domestic
birds. Dev. Comp. Immunol. 29:275–286.
Matson, K. D., A. A. Cohen, K. C. Klasing, R. E. Ricklefs,
and A. Scheuerlein. 2006a. No simple answers for
ecological immunology: relationships among immune
indices at the individual level break down at the species
level in waterfowl. Proc. Roy. Soc. Lon. Ser. B Biol. Sci.
273:815–822.
Matson, K. D., B. I. Tieleman, and K. C. Klasing. 2006b.
Capture stress and the bactericidal competence of blood and
plasma in five species of tropical birds. Physiol. Biochem.
Zool. 79:556–564.
Maxwell, M. H., and G. W. Robertson. 1998. The avian heterophil
leucocyte: A review. World Poultry Sci J 54:155–178.
McCarty, J. P. 2001. Variation in growth of nestling tree
swallows across multiple temporal and spatial scales. Auk
118:176.
McCoy, M. W., B. M. Bolker, C. W. Osenberg, B. G. Miner,
and J. R. Vonesh. 2006. Size correction: comparing
morphological traits among populations and environments.
Oecologia 148:547–554.
Monros, J. S., E. J. Belda, and E. Barba. 2002. Post-fledging
survival of individual great tits: the effect of hatching date
and fledging mass. Oikos 99:481–488.
Morrison, E. S., D. R. Ardia, and E. D. Clotfelter. 2009. Cross-
fostering reveals sources of variation in innate immunity
and hematocrit in nestling tree swallows Tachycineta bicolor.
J. Avian Biol. 40:573–578.
Murphy, M. T. 2003. Avian Population Trends within the
Evolving Agricultural Landscape of Eastern and Central
United States. Auk 120:20.
Nakagawa, S., and R. P. Freckleton. 2008. Missing inaction:
the dangers of ignoring missing data. Trends Ecol. Evol.
23:592–596.
Nebel, S., A., Mills, J. D, McCracken, and P. D. Taylor. 2010.
Declines of Aerial Insectivores in North America Follow a
Geographic Gradient. Avian Conserv. Ecol. 5:1.
Neve, L. D., J. J. Soler, M. Ruiz-Rodr�ıguez, D. Mart�ın-G�alvez,
T. P�erez-Contreras, and M. Soler. 2007. Habitat-specific
effects of a food supplementation experiment on
immunocompetence in Eurasian Magpie Pica pica nestlings.
Ibis 149:763–773.
Oksanen, J., F. G., Blanchet, R., Kindt , P., Legendre, P. R.,
Minchin, R. B., O’Hara, et al. 2012. vegan: community
Ecology Package. R package version 2.0-3. http://CRAN.
R-project.org/package=vegan.R. package version 2.0-3.
Palacios, M. G., J. E. Cunnick, D. Vleck, and C. M. Vleck.
2009. Ontogeny of innate and adaptive immune defense
components in free-living tree swallows, Tachycineta bicolor.
Dev. Comp. Immunol. 33:456–463.
Palacios, M. G., J. E. Cunnick, D. W. Winkler, and C. M.
Vleck. 2012. Interrelations among immune defense
indexes reflect major components of the immune system
in a free-living vertebrate. Physiol. Biochem. Zool. 85:
1–10.
Pap, P. L., G. A. Czirjak, C. I. Vagasi, Z. Barta, and D.
Hasselquist. 2010. Sexual dimorphism in immune function
changes during the annual cycle in house sparrows.
Naturwissenschaften 97:891–901.
Pap, P. L., C. I. V�ag�asi, G. �A. Czirj�ak, A. Titilincu, A. Pintea,
G. Osv�ath, et al. 2011. The Effect of Coccidians on The
Condition and Immune profile of Molting House Sparrows
(Passer Domesticus). Auk 128:330–339.
Piertney, S. B., and M. K. Oliver. 2006. The evolutionary
ecology of the major histocompatibility complex. Heredity
96:7–21.
Pigeon, G., R. Baeta, M. B�elisle, D. Garant, and F. Pelletier. In
press. Effects of agricultural intensification and temperature
on immune response to phytohemagglutinin in tree
swallows (Tachycineta bicolor). Can. J. Zool. 56–63.
Porlier, M., M. B�elisle, and D. Garant. 2009. Non-random
distribution of individual genetic diversity along an
environmental gradient. Philos. Trans. R. Soc. Lond. B Biol.
Sci. 364:1543–1554.
R Development Core Team. 2012. R: A Language and
Environment for Statistical Computing. 2.15.0 ed. R
Foundation for Statistical Computing, Vienna,
Austria.
Raberg, L., and M. Stjernman. 2003. Natural selection on
immune responsiveness in blue tits Parus caeruleus.
Evolution 57:1670–1678.
Rioux Paquette, S., D. Garant, F. Pelletier, and M. B�elisle. In
press. Seasonal patterns in tree swallow prey (Diptera)
abundance are affected by agricultural intensification. Ecol.
Appl.
1102 ª 2013 The Authors. Ecology and Evolution published by Blackwell Publishing Ltd.
Eco-immunology in a Fluctuating Environment G. Pigeon et al.

Robillard, A., D. Garant, and M. B�elisle. 2012. The Swallow
and the Sparrow: how agricultural intensification affects
abundance, nest site selection and competitive interactions.
Landscape Ecol. 1–15.
Sadd, B. M., and M. T. Siva-Jothy. 2006. Self-harm caused by
an insect’s innate immunity. Proc. Roy. Soc. Lon. Ser. B
Biol. Sci. 273:2571–2574.
Saino, N., M. Romano, R. Ambrosini, R. P. Ferrari, and A. P.
Moller. 2004. Timing of reproduction and egg quality
covary with temperature in the insectivorous Barn Swallow,
Hirundo rustica. Funct. Ecol. 18:50–57.
Segel, L. A., and I. R. Cohen. 2001. Design principles for the
immune system and other distributed autonomous systems.
Oxford University Press, New York.
Siva-Jothy, M. T., and J. J. W. Thompson. 2002. Short-term
nutrient deprivation affects immune function. Physiol.
Entomol. 27:206–212.
Sokal, R. R., and F. J. Rohlf. 1994. Biometry: The Principles
and Practice of Statistics in Biological Research. W.H.
Freeman & Company, New York.
Soler, J. J., J. M. Peralta-Sanchez, E. Flensted-Jensen, A. M.
Martin-Platero, and A. P. Moller. 2011. Innate humoural
immunity is related to eggshell bacterial load of European
birds: a comparative analysis. Naturwissenschaften 98:807–813.
Thomas, D. W., B. Shipley, J. Blondel, P. Perret, A. Simon, and
M. M. Lambrechts. 2007. Common paths link food abundance
and ectoparasite loads to physiological performance and
recruitment in nestling blue tits. Funct. Ecol. 21:947–955.
Tieri, P., A. Grignolio, A. Zaikin, M. Mishto, D. Remondini, G. C.
Castellani, et al. 2010. Network, degeneracy and bow tie
integrating paradigms and architectures to grasp the complexity
of the immune system. Theor. Biol. Med. Model. 7:32.
Toma, S., L. Cornegliani, P. Persico, and C. Noli. 2006.
Comparison of 4 fixation and staining methods for the
cytologic evaluation of ear canals with clinical evidence of
ceruminous otitis externa. Vet. Clin. Path. J 35:194–198.
Viney, M. E., E. M. Riley, and K. L. Buchanan. 2005. Optimal
immune responses: immunocompetence revisited. Trends
Ecol. Evol. 20:665–669.
Vinkler, M., H. Bainov�a, and T. Albrecht. 2010. Functional
analysis of the skin-swelling response to phytohaem-
agglutinin. Funct. Ecol. 24:1081–1086.
Winkler, D. W., K. K. Hallinger, D. R. Ardia, R. J. Robertson, B.
J. Stutchbury, and R. R. Cohen. 2011. Tree Swallow
(Tachycineta bicolor). in A. Poole, ed. The birds of North
America online. Cornell lab of ornithology, Ithaca, New York.
Available at: http://bna.birds.cornell.edu/bna/species/011.
Wolak, M. E., D. J. Fairbairn, and Y. R. Paulsen. 2012.
Guidelines for estimating repeatability. Methods Ecol. Evol.
3:129–137.
Supporting Information
Additional Supporting Information may be found in the
online version of this article:
Figure S1. Redundancy analysis of pooled nestlings
immune measurements with year, farm type and sex as
constraining variables. Arrows represent loading values of
the different immune measures. Red circles represent
centroids of constraining variables. 20.37% of the variance
is explained by RDA 1 and 2. n = 210.
Figure S2. Relationship between PC1 and mass at fledg-
ing of tree swallow nestlings. Regression lines are obtained
from linear mixed model (LME) and represent the regres-
sion with a random intercept by nest-boxes. The contri-
bution to PC1 of each immune marker by sub-group is
equal to the horizontal loading displayed in Figure 2.
Figure S3. Relationship between PC1 and growth of tree
swallow nestlings. Regression lines are obtained from lin-
ear mixed model (LME) and represent the regression with
a random intercept by nest-boxes. The contribution to
PC1 of each immune marker by sub-group is equal to the
horizontal loading displayed in Figure 2.
Figure S4. Relationship between PC1 and parasite burden
of tree swallow nestlings. Regression lines are obtained
from linear model. The contribution to PC1 of each
immune marker by sub-group is equal to the horizontal
loading displayed in Figure 2. Gray area represents confi-
dence interval.
Table S1. Eigenvalues of the redundancy analysis for the
pooled value.
Table S2. Eigenvalues and loading values of the principal
component analysis for the four sub-groups.
ª 2013 The Authors. Ecology and Evolution published by Blackwell Publishing Ltd. 1103
G. Pigeon et al. Eco-immunology in a Fluctuating Environment