ecological modelling - upf
TRANSCRIPT
Ecological Modelling 222 (2011) 2631– 2641
Contents lists available at ScienceDirect
Ecological Modelling
jo ur n al homep ag e: www.elsev ier .com/ locate /eco lmodel
A SVM-based model for predicting distribution of the invasive tree Miconiacalvescens in tropical rainforests
Robin Pouteaua,∗, Jean-Yves Meyerb, Benoît Stoll a
a Laboratoire Géosciences du Pacifique Sud, Université de Polynésie franc aise, BP 6570, Faa’a, French Polynesiab Délégation à la Recherche, Gouvernement de Polynésie franc aise, BP 20981, Papeete, French Polynesia
a r t i c l e i n f o
Article history:Received 5 October 2010Received in revised form 12 March 2011Accepted 30 April 2011Available online 9 June 2011
Keywords:Distribution modelDigital elevation model (DEM)Support vector machines (SVM)Vegetation mappingInvasive speciesRainforest
a b s t r a c t
Advances in spatial and spectral resolution of sensors can be useless to detect directly understory andsubcanopy species but make remote sensing of some ecosystems components increasingly feasible. Wepropose to use support vector machines (SVM) to integrate multisource-derived biophysical descriptors(overstory plant species, physiography and climate) for the indirect detection of the small invasive treeMiconia calvescens in tropical rainforests on the island of Tahiti (South Pacific). Our model consists in clas-sifying overstory plant species from an optical Quickbird scene, with the output then used in a subsequentfusion process with digital elevation model (DEM) extracted physiographic and climatic descriptors. Arange of accuracy metrics was calculated to assess the SVM-based model which widely outperforms thecommonly used GARP model. Biophysical descriptors alone are necessary and sufficient to explain M.calvescens distribution and suggest that the potential invaded area is currently saturated in our study siteon Tahiti. Rainfall, elevation and slope steepness are the major variables explaining the species distri-bution. In addition, our results show that morning insolation plays a critical role on M. calvescens heightwhether it is restricted to the subcanopy or reaches the forest surface. The model can be used to map thepotential distribution of M. calvescens in areas where it has been recently introduced and rapidly spread-ing, such as in the Hawaiian islands, New Caledonia and Australia or in other French Polynesian islands.It also may be adapted to detect other species (plants or animals, alien invasives or rare endemics) in theunderstory and subcanopy of forest ecosystems.
© 2011 Elsevier B.V. All rights reserved.
1. Introduction
Invasive species are recognized as a primary cause of global bio-diversity loss and an agent of global change (Millennium EcosystemAssessment, 2005). Because of their isolation and small areas,island ecosystems are particularly vulnerable to biological inva-sions (Loope and Mueller-Dombois, 1989; Paulay, 1994; Kuefferet al., 2010). As reported by Atherton et al. (2007), invasive alienspecies represent the first threat to the insular native biota in the“Pacific Ecoregion”. They underlined the need for “more informa-tion on the distribution and impact of invasive species in sensitivesites and the identification of alien-free habitats” as their firststrategic direction.
Advances in the spatial and spectral resolutions of sensors nowallow a direct detection at species or community levels (Xie et al.,2008). As an example, Asner et al. (2008a) mapped a selectedgroup of native and invasive species in a Hawaiian rainforest using
∗ Corresponding author. Tel.: +689 866 438; fax: +689 803 842.E-mail address: [email protected] (R. Pouteau).
hyperspectral Airborne Visible/Infrared Imaging Spectrometer(AVIRIS) data, identifying species by their differences in canopyspectral signature. Asner et al. (2008b) also mapped the locationand impacts of five invasive plant species in Hawaii based on LightDetection And Ranging (LiDAR) imagery by identifying 3D trans-formation of the structure of native rainforests. Walsh et al. (2008)studied the positive synergism between Quickbird and Hyperiondata at the pixel- and object-levels to characterize the location,density and spatial structure of Psidium guajava (Myrtaceae), asmall alien invasive tree in the Galápagos islands.
As stated in Joshi et al. (2004), an increasing number of studiesdeal with the use of remote sensing for mapping invasive speciesusing various remotely sensed data and remote sensing techniquesfrom global to local scales. They divided these past studies into fourclasses: (i) applications in detecting canopy dominating species; (ii)mixed canopy dominant species; (iii) invaders influencing canopydominant species; and (iv) understory and subcanopy species.
While many plant invaders do not reach the canopy surface, thefourth class is the least represented in terms of case studies, becauseunderstory and subcanopy species are inherently more difficultto detect and there is a need for extensive ground truth surveys.Joshi et al. (2006) mapped cover percentage and potential areas
0304-3800/$ – see front matter © 2011 Elsevier B.V. All rights reserved.doi:10.1016/j.ecolmodel.2011.04.030
2632 R. Pouteau et al. / Ecological Modelling 222 (2011) 2631– 2641
of Chromolaena odorata (Asteraceae), an herbaceous weed com-monly found in a range of habitats, including rainforest understory.They extracted six ancillary variables from a Landsat ETM+ imageand integrated using an artificial neural network: grazing intensity,distance from forest ecotone, distance from the road, understorybiomass, forest canopy density and light intensity reaching theunderstory.
All fourth class studies need to use predictive mapping whichinvolves making correspond meaningful environmental layers,known a priori to be a proxy of the presence/absence of the trackedspecies, with known localities of the tracked species for extrapola-tion to the entire study site. Most of the species predictive mappingapproaches are reviewed in Franklin (1995). Principal integrationmethods include rule-based models, generalized linear models,classification (and regression) trees and more recently machinelearning algorithms such as artificial neural networks (Lindermanet al., 2004; Joshi et al., 2006), genetic algorithms (Peterson et al.,2003; Roura-Pascual et al., 2004; Loo et al., 2007; LaRosa et al., 2007;Sánchez-Flores, 2007; Ebeling et al., 2008; Roura-Pascual et al.,2008) and support vector machines (Guo et al., 2005; Drake et al.,2006). Input data are usually ancillary data only but some studiesalso couple ancillary data with remotely sensed imagery (Strahler,1981; Hutchinson, 1982; Linderman et al., 2004; Joshi et al., 2006).
Before the present study, several attempts to map the distribu-tion of Miconia calvescens (Melastomataceae) were conducted inthe Society islands of French Polynesia (Tahiti and Moorea) and inthe Hawaiian islands where the species is also invasive.
In 1990, the Station Polynésienne de Télédétection (PolynesianRemote Sensing Station) made the very first attempt to map M.calvescens comparing its spectral properties on two SPOT sceneswith spectro-radiometric data taken by helicopter and in the field(Wibaux, 1990). In 1997, a collaboration between the University ofCalifornia at Berkeley’s Richard B. Gump Research Station and theMinistry of the Environment of the Government of French Polyne-sia attempts to map M. calvescens using aerial photographs takenduring helicopter surveys over Tahiti and Moorea (Krantz, 1997).These two studies identified limitations of aerial imagery when M.calvescens was confined to the understory or the subcanopy. Indeed,M. calvescens is a shade-tolerant small tree (<15 m tall) that regen-erates in rainforest understory and grows more rapidly in forestgaps and open areas, becoming dominant in canopy where it shadesout other plants, except the higher trees (>15–20 m) which densitydetermine whether it is directly discernible or not.
In 1993, Florence (1993) delimits the distribution of M.calvescens mainly based on personal field observations as M.calvescens was indiscernible on aerial photograph when locatedin the understory and subcanopy of rainforest (Florence, personalcommunication cited in Meyer, 1996). Despite the temporal biasbetween today and 1993, that map is still satisfactory at the con-sidered scale which suggests that the stretch of the invasion hasalready reached its maximum. This saturation hypothesis is impor-tant to produce an actual distribution map and not a potentialdistribution one. The limit of Florence’s study is the coarse spatialresolution which is not relevant for an effective in situ monitoringeffort.
The most recent study was conducted by the “Big Island InvasiveSpecies Committee” in the Hawaiian islands (LaRosa et al., 2007).The niche-distribution model Genetic Algorithm for Rule Set Pro-duction (GARP) (Stockwell and Peters, 1999) was used to projectpotential habitat of M. calvescens using GIS-based information,namely elevation, precipitation, slope steepness and windward-ness and the ecological range of M. calvescens on Tahiti from Meyer(1998). Unfortunately, the accuracy of this method was not reallyassessed.
With the increasing availability and accuracy of remotely senseddata and the concomitant development of predictive mapping
methods, it is now possible to precisely describe invasive speciesdistribution, a crucial step to improve policy, legislation and proce-dures implemented against them, and also to manage landscapesand natural risks, improve natural resources monitoring and main-tain sustainable development.
The aim of this study is twofold: (i) to introduce a set of bio-physical predictors in relation with the ecology of M. calvescens;and (ii) to compare our SVM-based model with the widely usedGARP model for M. calvescens predictive mapping.
2. Material and methods
2.1. Study area and species
Tahiti, located 17◦38′ South and 149◦30′ West in the SouthPacific Ocean, is a high volcanic tropical oceanic island, 0.3–1.7 Myrold (Duncan et al., 1994). It is the largest (1045 km2), highest(2241 m elevation) and most populated (ca. 180,000 inhabitantsin 2007) island of French Polynesia. It has also the richest vascu-lar flora with 467 native plant species, 212 (ca. 45%) of which areendemic (Meyer and Florence, 1996).
As in most of the small Pacific islands, the native forests of FrenchPolynesia, and Tahiti in particular, have been invaded by alienplants, accidentally or purposely introduced by humans (Meyer,2004). A total of 593 plant species is currently naturalized, with57 considered highly invasive (Fourdrigniez and Meyer, 2008). M.calvescens is probably the worst plant invader on Tahiti, being alsoone of the world’s 100 worst invasive species (ISSG, 2010). Thissmall tree, commonly 4–12 m tall (up to 15 m), is native to rain-forests of Central and South America. It was introduced in Tahiti in1937 as an ornamental plant because of its large leaves with pur-ple undersides and has invaded about two-thirds of the forestedarea on the island (between 70,000 and 80,000 ha) and became thedominant canopy tree over large areas (Meyer, 1998). This spec-tacular invasion is probably due to the combination of its rapidvegetative growth and its reproductive competitiveness (early sex-ual maturity, self pollination, trimodally reproduction each year,active dispersal over long distances, high rate of germination, largesize and persistence of the soil seed bank) (Meyer et al., 2008).
Our study site is the Papenoo valley, the largest valley in Tahitiand French Polynesia (18 km long, covering about 9000 ha) rangingfrom sea level to the Mont Orohena (2241 m), the highest peak ofFrench Polynesia and the South Pacific. It was selected because ofits accessibility (by road) and its ecological importance. Indeed, thePapenoo valley includes the only protected natural area in Tahiti,“Te Faaiti Natural Park”, a 750 ha rainforest (Meyer, 2007), as well asthe unique Anaori’i swampy mid-elevation plateau, an extremelyrare habitat in French Polynesia (Meyer, 2009). Both areas are par-tially invaded by M. calvescens.
Zonal vegetation types occurring in the Papenoo valley are afunction of a climatic gradient (precipitation and temperature)controlled by the topography. Vegetation of the study site can bedivided into three types, according to their preferential ecolog-ical conditions (Papy, 1951–1954; Florence, 1993; Florence andLorence, 1997; Meyer, 2007):
- a low- to mid-elevation mesic vegetation where precipitationranges from 1500 to 3000 mm per year and elevation is lower than900 m. This vegetation type is commonly found on steep slopesand ridge crests where native Dicranopteris linearis fernlands andstands of the large alien tree Falcataria moluccana occur;
- a low- to mid-elevation wet forest for which precipitationexceeds 3000 mm per year and elevation is lower than 900 m,found in valleys and dominated by the small native tree Hibis-cus tiliaceus, the large alien tree Spathodea campanulata, and thePolynesian introduced bamboo Schizostachyum glaucifolium;
R. Pouteau et al. / Ecological Modelling 222 (2011) 2631– 2641 2633
- and a montane cloud forest which is found on the upper slopes(up to 900 m) where temperatures are cool, precipitation is above3000 mm per year, with almost persistent diurnal cloud cover.About 60% of the endemic vascular plant species of French Poly-nesia are found in cloud forests and 25% of these endemics areconfined to this habitat type (Meyer, 2010).
2.2. Remote sensing methods
2.2.1. Ancillary biophysical variablesLaRosa et al. (2007) propose four data fields to map M. calvescens
in Hawaiian islands. We keep them except windwardness since,working at an entire island-scale, windwardness appears pertinentbut not at a single valley-scale:
elevation (id. the DEM) affecting temperature. Considering anenvironmental lapse rate of 0.0058 ◦C m−1 as observed in Hawaii(Baruch and Goldstein, 1999), there is a shift of 13 ◦C between sea-level and the highest summit of Tahiti. Air temperature is one ofthe most important factors controlling vegetation zonation and keyprocesses such as evapotranspiration, carbon fixation and decom-position, plant productivity and mortality in mountain ecosystems(Chen et al., 1999; Nagy et al., 2003).
precipitations. Our precipitations map is an interpolation ofdata from a network of meteorological stations set up by MétéoFrance in French Polynesia and the Groupement d’Etude et de Ges-tion du Domaine Public (Laurent et al., 2004). Precipitation refersto valley-scale pattern of water availability but excludes effect ofmicro-topography on water flow and concurrence at the commu-nity scale.
slope steepness can be considered as a proxy of overland andsubsurface flow velocity and runoff rate, effect of micro-topographyon precipitation, geomorphology, soil water content (Wilson andGallant, 2000), mechanical effect on plant rooting and seed disper-sion.
In this study, in addition to those introduced by LaRosa et al.(2007), we propose four additive biophysical variables potentiallyimpacting the presence/absence of M. calvescens:
- annual potential insolation (API) calculated by the Solar Analy-sis tool, an ArcView GIS extension. It equates to the amount ofradiative energy received over the ground (Fu and Rich, 2002);
- slope exposure as a proxy of solar insolation, evapotranspiration(Wilson and Gallant, 2000) and trade wind exposure;
- compound topographic index (CTI) at a 5% threshold, quantifyingwater drainage by micro-topography and explaining geomor-phology (Moore et al., 1993; Gessler et al., 2000);
- and overstory plant species map, indeed forest overstory canaffect temperature and resources availability (light, water, nutri-ents) by competition (Riegel et al., 1992). Vegetation map isobtained using a support vector machine classification.
Redundancy between biophysical variables is inevitable, aboveall between primary physiographic attributes (elevation, slopesteepness, slope exposure) and secondary physiographic attributes(annual potential insolation and compound topographic index) thatare computed from primary physiographic attributes (Moore et al.,1991). In consequence, correlation between biophysical variables istested to avoid overweighting problem. Elevation, slope steepness,API, slope exposure and CTI are extracted from a 5 m-resolution dig-ital elevation model (DEM) projected in the system WGS 84 UTM 6South.
2.3. Genetic algorithm for rule-set production (GARP)
The niche-distribution model GARP used in LaRosa et al. (2007)for mapping M. calvescens was also successfully used for other
invasive species mapping in many studies (Peterson et al., 2003;Roura-Pascual et al., 2004; Loo et al., 2007; Sánchez-Flores, 2007;Ebeling et al., 2008; Roura-Pascual et al., 2008). GARP is a machinelearning-based analytical package developed by Stockwell andPeters (1999). More details on the program are available at the URLhttp://www.nhm.ku.edu/desktopgarp/index.html where the Desk-top version used in this study can also be downloaded. Due tounstable traits of the GARP algorithm producing various solutions,we choose to keep the map producing the best overall accuracyafter 100 runs.
2.4. Support vector machines (SVM)
SVM is widely used in classification of remotely sensed datasuch as optical data (e.g. Foody and Mathur, 2006), syntheticaperture radar (SAR) data (e.g. Lardeux et al., 2009), hyperspectraldata (e.g. Lennon et al., 2002) and multisensor data (Hill et al.,2005; Camps-Valls et al., 2006; Waske and Benediktsson, 2007).Although SVM is seldom used in the literature for biogeographicmodelling (see Guo et al., 2005; Drake et al., 2006 for applications),it can be an optimal statistical tool for our study case since it isadapted to numerous and heterogeneous variables and mixtures ofqualitative and quantitative variables. In Waske and Benediktsson(2007), a range of the most commonly used classifiers are com-pared for multisource classification, namely maximum likelihood,decision trees, boosted decision trees and support vector machines(SVM). According to their results, SVM gives the best accuracy.Artificial neural networks is another widely used classifiers whichis not compared in the latter study but shows lacks face to SVM inother studies (e.g. Foody and Mathur, 2004; Pal and Mather, 2004;Nemmour and Chibani, 2006).
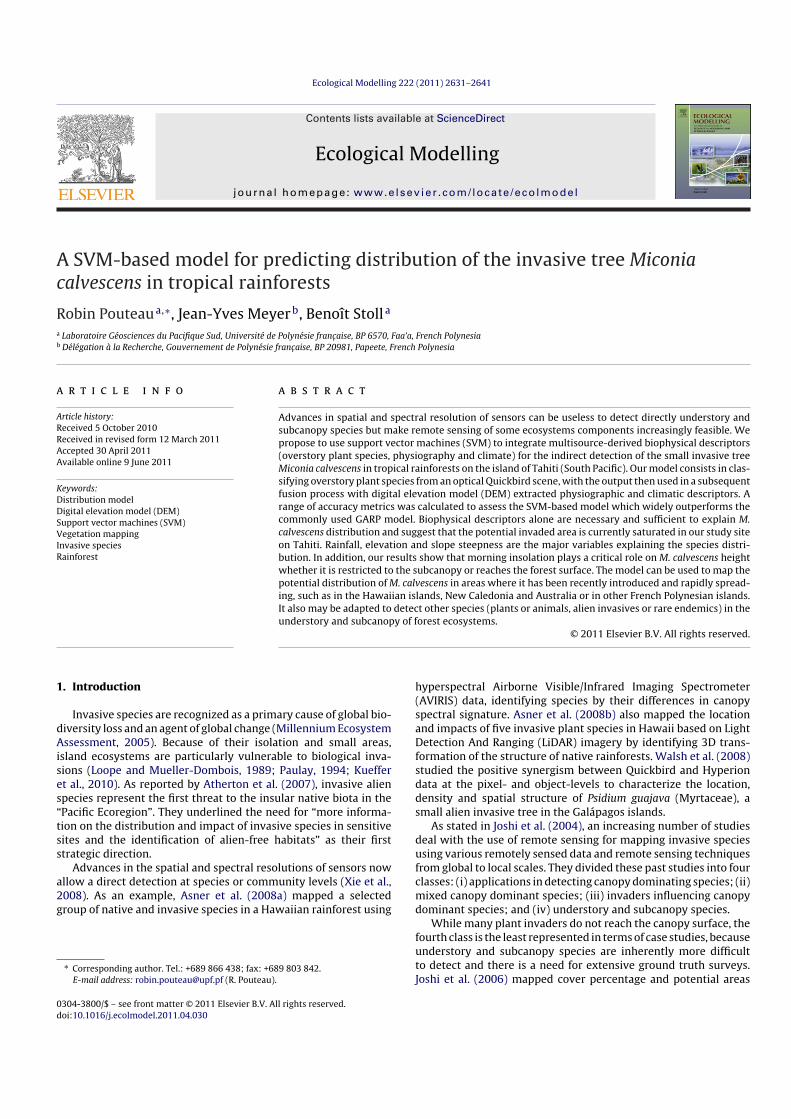
Fig. 1 presents the SVM, originally introduced as a binary clas-sifier (Vapnik and Chervonenkis. 1998). SVM uses two classes oftraining samples within a multi-dimensional feature space to fit anoptimal separating hyperplane (in each dimension, vector compo-nents is a biophysical variable). In this way, it tries to maximize themargin that is the distance between the closest training samples,or support vectors, and the hyperplane itself.
SVM consists in projecting vectors into a high dimension fea-ture space by means of a kernel function then fitting the optimalhyperplane that separates classes using an optimization function(1). For a generic pattern x, the corresponding estimated label y isgiven by (1).
y = sign[f (x)] = sign
(N∑
i=1
aiyiK(xi, x) + b
)(1)
wherein N is the number of training points, the label of theith sample is yi, b is a bias parameter, K(xi,x) is the chosen kernelfunction and ai denotes the Lagrangian multipliers.
SVM, introduced by Vapnik and Chervonenkis (1998), is exten-sively described by Burges (1998), Schölkopf and Smola (2002) andHsu et al. (2009). As suggested by the latter and supported by manyother papers, we use the radial basis function (RBF) as the kernel.The equation is (2).
K(xi, x) = exp||xi x||2
2�2(2)
Noise in the data can be accounted for by defining a distance tol-erating the data scattering, thus relaxing the decision constraint.This regularization parameter C as well as � is found by cross-validation.
SVM have been created for two-class problem but extensionshave been developed to deal with Q class problem (Q > 2). Among
2634 R. Pouteau et al. / Ecological Modelling 222 (2011) 2631– 2641
Fig. 1. SVM classifier scheme.
them, we choose the One-Against-One algorithm which consistsin the construction of Q(Q − 1)/2 hyperplanes which separate eachpair of classes.
2.5. Proposition of a classification scheme
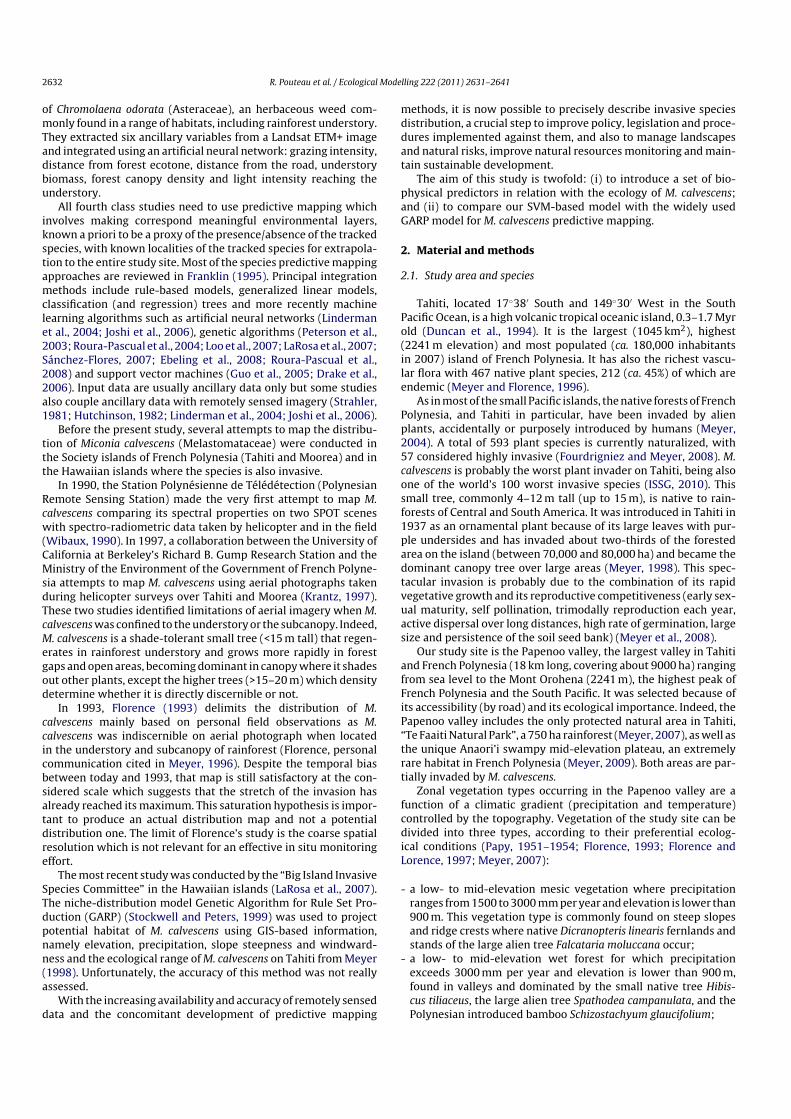
Hereafter, a generic classification scheme is proposed to predictspecies distribution in montane tropical environment (Fig. 2).
2.5.1. Overstory plant species monosource classificationWe first classify overstory plant species from four spectral bands
(0.45–0.90 �m) and 0.61 m-resolution pan-sharpened Quickbirdimagery. Two pan-sharpened standard scenes, acquired on 23 June2003 at 08h06 a.m. (local time) and on 15 June 2005 at 08h25 a.m.,were concatenated and orthorectified using a 5 m-resolution DEMand ground control points. A statistical computation of the region
Fig. 2. Schematic diagram of the SVM-based M. calvescens mapping.
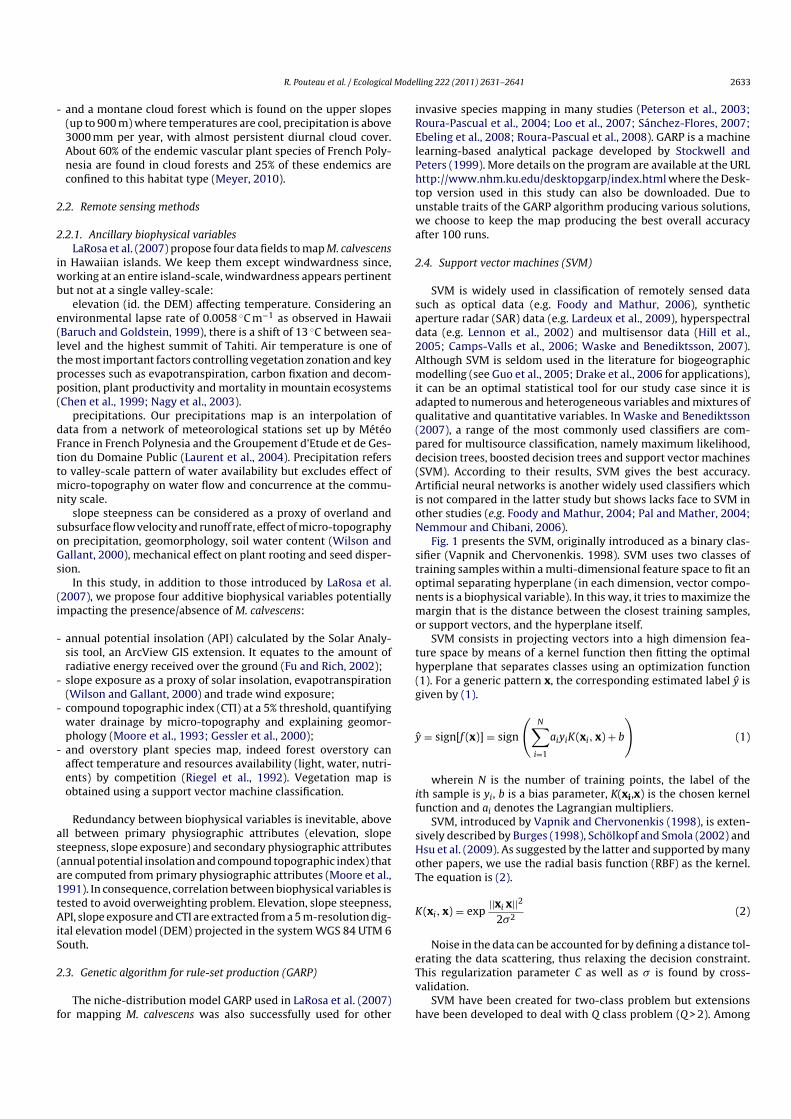
of interest (ROI) collected in situ is performed from the four bandsand informs that no spectral signature corresponds to the pres-ence/absence of M. calvescens on the Quickbird scenes (data notshown, see Fig. 3).
After preprocessing, a SVM is applied on the four spectral bandsand four multi-level grey level co-occurrence matrix (GLCM)texture metrics (Haralick et al., 1973) per band. Texture analysis
Fig. 3. Above: A stand of M. calvescens reaching the forest canopy in the PapenooValley (Tahiti) (Picture R. Pouteau). Below: The viewpoint of the above picture andlocalisation of the same stand invisible on the Quickbird scene because of the reliefshadow.
R. Pouteau et al. / Ecological Modelling 222 (2011) 2631– 2641 2635
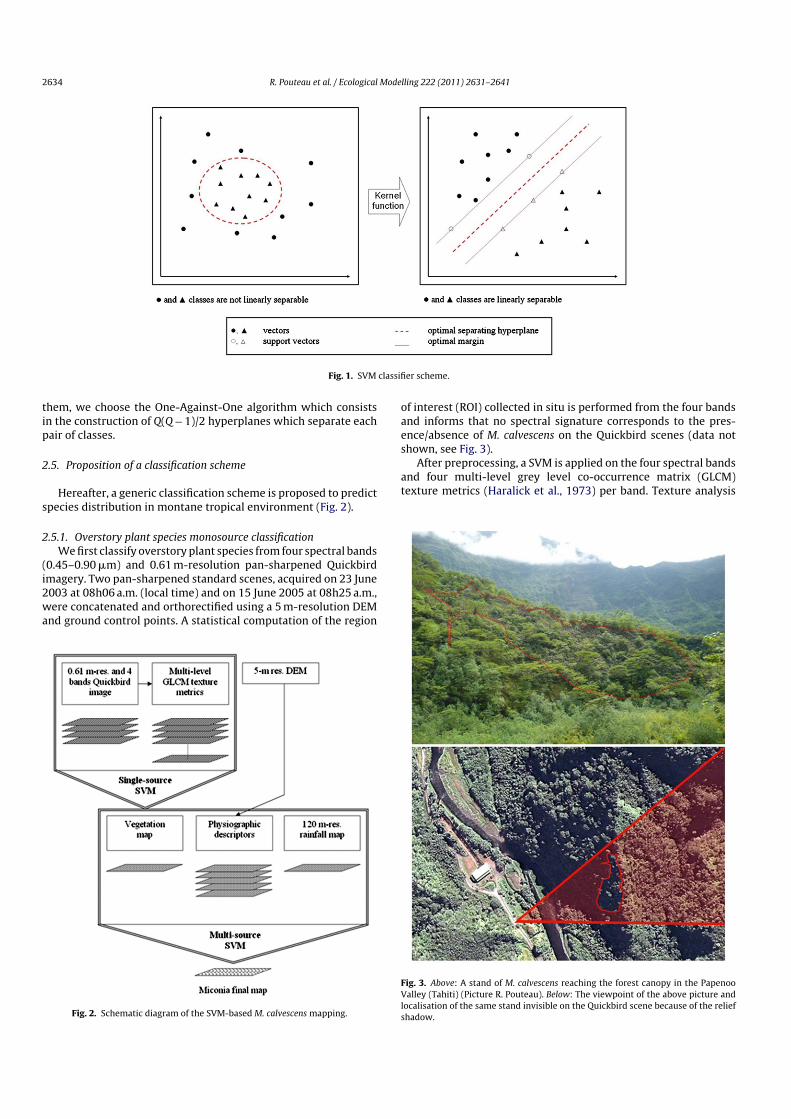
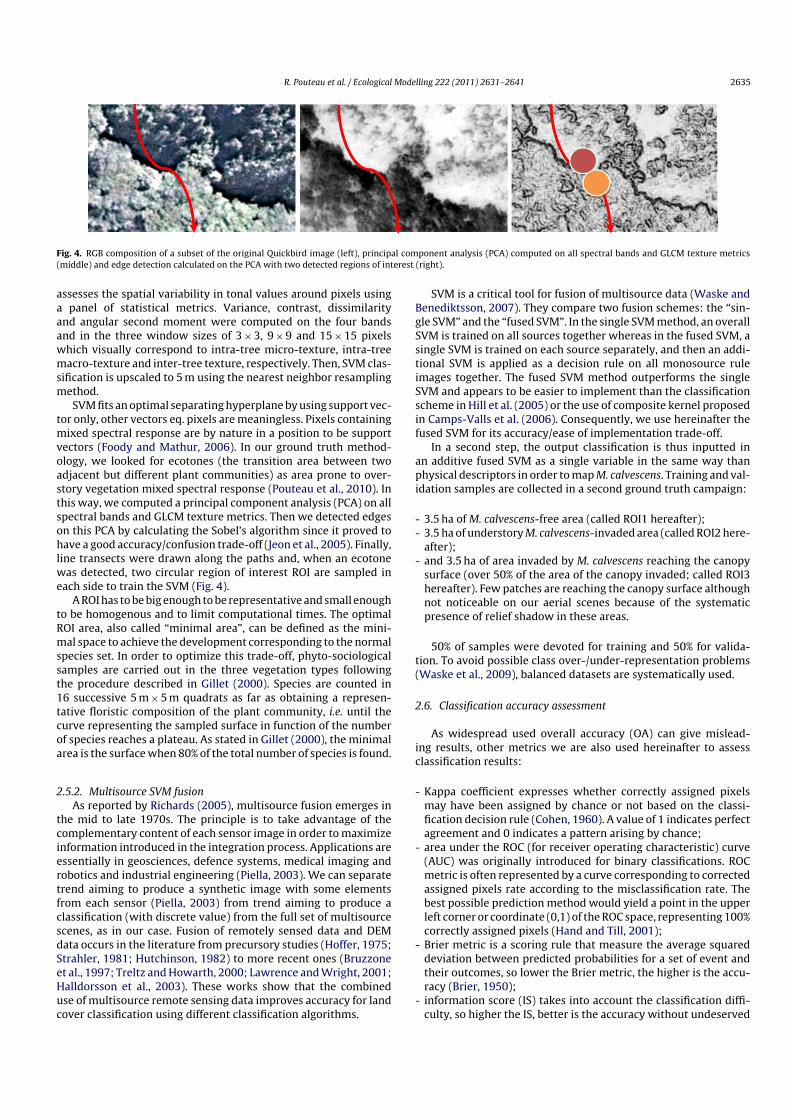
Fig. 4. RGB composition of a subset of the original Quickbird image (left), principal component analysis (PCA) computed on all spectral bands and GLCM texture metrics(middle) and edge detection calculated on the PCA with two detected regions of interest (right).
assesses the spatial variability in tonal values around pixels usinga panel of statistical metrics. Variance, contrast, dissimilarityand angular second moment were computed on the four bandsand in the three window sizes of 3 × 3, 9 × 9 and 15 × 15 pixelswhich visually correspond to intra-tree micro-texture, intra-treemacro-texture and inter-tree texture, respectively. Then, SVM clas-sification is upscaled to 5 m using the nearest neighbor resamplingmethod.
SVM fits an optimal separating hyperplane by using support vec-tor only, other vectors eq. pixels are meaningless. Pixels containingmixed spectral response are by nature in a position to be supportvectors (Foody and Mathur, 2006). In our ground truth method-ology, we looked for ecotones (the transition area between twoadjacent but different plant communities) as area prone to over-story vegetation mixed spectral response (Pouteau et al., 2010). Inthis way, we computed a principal component analysis (PCA) on allspectral bands and GLCM texture metrics. Then we detected edgeson this PCA by calculating the Sobel’s algorithm since it proved tohave a good accuracy/confusion trade-off (Jeon et al., 2005). Finally,line transects were drawn along the paths and, when an ecotonewas detected, two circular region of interest ROI are sampled ineach side to train the SVM (Fig. 4).
A ROI has to be big enough to be representative and small enoughto be homogenous and to limit computational times. The optimalROI area, also called “minimal area”, can be defined as the mini-mal space to achieve the development corresponding to the normalspecies set. In order to optimize this trade-off, phyto-sociologicalsamples are carried out in the three vegetation types followingthe procedure described in Gillet (2000). Species are counted in16 successive 5 m × 5 m quadrats as far as obtaining a represen-tative floristic composition of the plant community, i.e. until thecurve representing the sampled surface in function of the numberof species reaches a plateau. As stated in Gillet (2000), the minimalarea is the surface when 80% of the total number of species is found.
2.5.2. Multisource SVM fusionAs reported by Richards (2005), multisource fusion emerges in
the mid to late 1970s. The principle is to take advantage of thecomplementary content of each sensor image in order to maximizeinformation introduced in the integration process. Applications areessentially in geosciences, defence systems, medical imaging androbotics and industrial engineering (Piella, 2003). We can separatetrend aiming to produce a synthetic image with some elementsfrom each sensor (Piella, 2003) from trend aiming to produce aclassification (with discrete value) from the full set of multisourcescenes, as in our case. Fusion of remotely sensed data and DEMdata occurs in the literature from precursory studies (Hoffer, 1975;Strahler, 1981; Hutchinson, 1982) to more recent ones (Bruzzoneet al., 1997; Treltz and Howarth, 2000; Lawrence and Wright, 2001;Halldorsson et al., 2003). These works show that the combineduse of multisource remote sensing data improves accuracy for landcover classification using different classification algorithms.
SVM is a critical tool for fusion of multisource data (Waske andBenediktsson, 2007). They compare two fusion schemes: the “sin-gle SVM” and the “fused SVM”. In the single SVM method, an overallSVM is trained on all sources together whereas in the fused SVM, asingle SVM is trained on each source separately, and then an addi-tional SVM is applied as a decision rule on all monosource ruleimages together. The fused SVM method outperforms the singleSVM and appears to be easier to implement than the classificationscheme in Hill et al. (2005) or the use of composite kernel proposedin Camps-Valls et al. (2006). Consequently, we use hereinafter thefused SVM for its accuracy/ease of implementation trade-off.
In a second step, the output classification is thus inputted inan additive fused SVM as a single variable in the same way thanphysical descriptors in order to map M. calvescens. Training and val-idation samples are collected in a second ground truth campaign:
- 3.5 ha of M. calvescens-free area (called ROI1 hereafter);- 3.5 ha of understory M. calvescens-invaded area (called ROI2 here-
after);- and 3.5 ha of area invaded by M. calvescens reaching the canopy
surface (over 50% of the area of the canopy invaded; called ROI3hereafter). Few patches are reaching the canopy surface althoughnot noticeable on our aerial scenes because of the systematicpresence of relief shadow in these areas.
50% of samples were devoted for training and 50% for valida-tion. To avoid possible class over-/under-representation problems(Waske et al., 2009), balanced datasets are systematically used.
2.6. Classification accuracy assessment
As widespread used overall accuracy (OA) can give mislead-ing results, other metrics we are also used hereinafter to assessclassification results:
- Kappa coefficient expresses whether correctly assigned pixelsmay have been assigned by chance or not based on the classi-fication decision rule (Cohen, 1960). A value of 1 indicates perfectagreement and 0 indicates a pattern arising by chance;
- area under the ROC (for receiver operating characteristic) curve(AUC) was originally introduced for binary classifications. ROCmetric is often represented by a curve corresponding to correctedassigned pixels rate according to the misclassification rate. Thebest possible prediction method would yield a point in the upperleft corner or coordinate (0,1) of the ROC space, representing 100%correctly assigned pixels (Hand and Till, 2001);
- Brier metric is a scoring rule that measure the average squareddeviation between predicted probabilities for a set of event andtheir outcomes, so lower the Brier metric, the higher is the accu-racy (Brier, 1950);
- information score (IS) takes into account the classification diffi-culty, so higher the IS, better is the accuracy without undeserved
2636 R. Pouteau et al. / Ecological Modelling 222 (2011) 2631– 2641
score obtained by uninformed classifier that classify into a singlemajority class for example (Kononenko and Bratko, 1991);
- producer’s accuracy (PA) represents the number of correctlyassigned pixels for a class divided by the actual number of groundtruth pixels for that class;
- and user’s accuracy (UA) is the number of correctly assigned pix-els for a class divided by the total pixels assigned to that class(Congalton and Green, 2009).
3. Results
3.1. Assessment of minimal areas
The minimal area is more than twice larger in montane cloudforest (260 m2) than in low- to mid-elevation mesic and wet forests(both achieving 125 m2). More than a natural gradient this phe-nomenon may be due to the invasion of alien species transformingintensely low elevation ecosystems. Indeed, the low- to mid-elevation mesic forest counts five naturalized species, namely 18%of the total number of vascular species, the low- to mid-elevationwet forest counts six naturalized species, namely 16% while we onlyfound two naturalized species in montane cloud forest, namely 3%.
As a result, overstory plant species classification was trainedon circular ROI with a 12.60 m diameter for classes occurring inmid-elevation vegetation (H. tiliaceus native forest, Spathodea cam-panulata forest, F. moluccana forest, S. glaucifolium bamboo groveand D. linearis fernland) and with a 18.20 m diameter for the mon-tane cloud forest class. Classification is trained on 5000 pixels andvalidated on 5000 other pixels for each class. Balanced datasets arealso used.
3.2. Classification results
Concerning vegetation classes in the overstory species vegeta-tion map, results are fairly good since PA are from 88% to 98% andUA from 86% to 100% (Table 1).
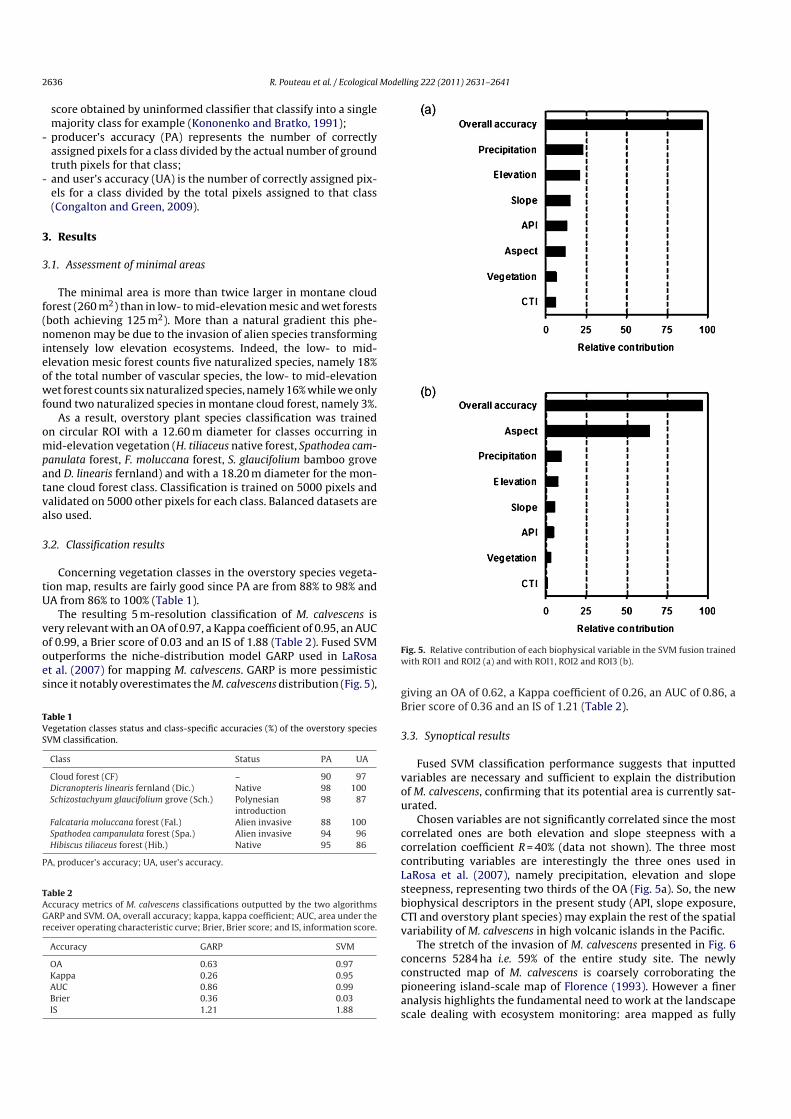
The resulting 5 m-resolution classification of M. calvescens isvery relevant with an OA of 0.97, a Kappa coefficient of 0.95, an AUCof 0.99, a Brier score of 0.03 and an IS of 1.88 (Table 2). Fused SVMoutperforms the niche-distribution model GARP used in LaRosaet al. (2007) for mapping M. calvescens. GARP is more pessimisticsince it notably overestimates the M. calvescens distribution (Fig. 5),
Table 1Vegetation classes status and class-specific accuracies (%) of the overstory speciesSVM classification.
Class Status PA UA
Cloud forest (CF) – 90 97Dicranopteris linearis fernland (Dic.) Native 98 100Schizostachyum glaucifolium grove (Sch.) Polynesian
introduction98 87
Falcataria moluccana forest (Fal.) Alien invasive 88 100Spathodea campanulata forest (Spa.) Alien invasive 94 96Hibiscus tiliaceus forest (Hib.) Native 95 86
PA, producer’s accuracy; UA, user’s accuracy.
Table 2Accuracy metrics of M. calvescens classifications outputted by the two algorithmsGARP and SVM. OA, overall accuracy; kappa, kappa coefficient; AUC, area under thereceiver operating characteristic curve; Brier, Brier score; and IS, information score.
Accuracy GARP SVM
OA 0.63 0.97Kappa 0.26 0.95AUC 0.86 0.99Brier 0.36 0.03IS 1.21 1.88
Fig. 5. Relative contribution of each biophysical variable in the SVM fusion trainedwith ROI1 and ROI2 (a) and with ROI1, ROI2 and ROI3 (b).
giving an OA of 0.62, a Kappa coefficient of 0.26, an AUC of 0.86, aBrier score of 0.36 and an IS of 1.21 (Table 2).
3.3. Synoptical results
Fused SVM classification performance suggests that inputtedvariables are necessary and sufficient to explain the distributionof M. calvescens, confirming that its potential area is currently sat-urated.
Chosen variables are not significantly correlated since the mostcorrelated ones are both elevation and slope steepness with acorrelation coefficient R = 40% (data not shown). The three mostcontributing variables are interestingly the three ones used inLaRosa et al. (2007), namely precipitation, elevation and slopesteepness, representing two thirds of the OA (Fig. 5a). So, the newbiophysical descriptors in the present study (API, slope exposure,CTI and overstory plant species) may explain the rest of the spatialvariability of M. calvescens in high volcanic islands in the Pacific.
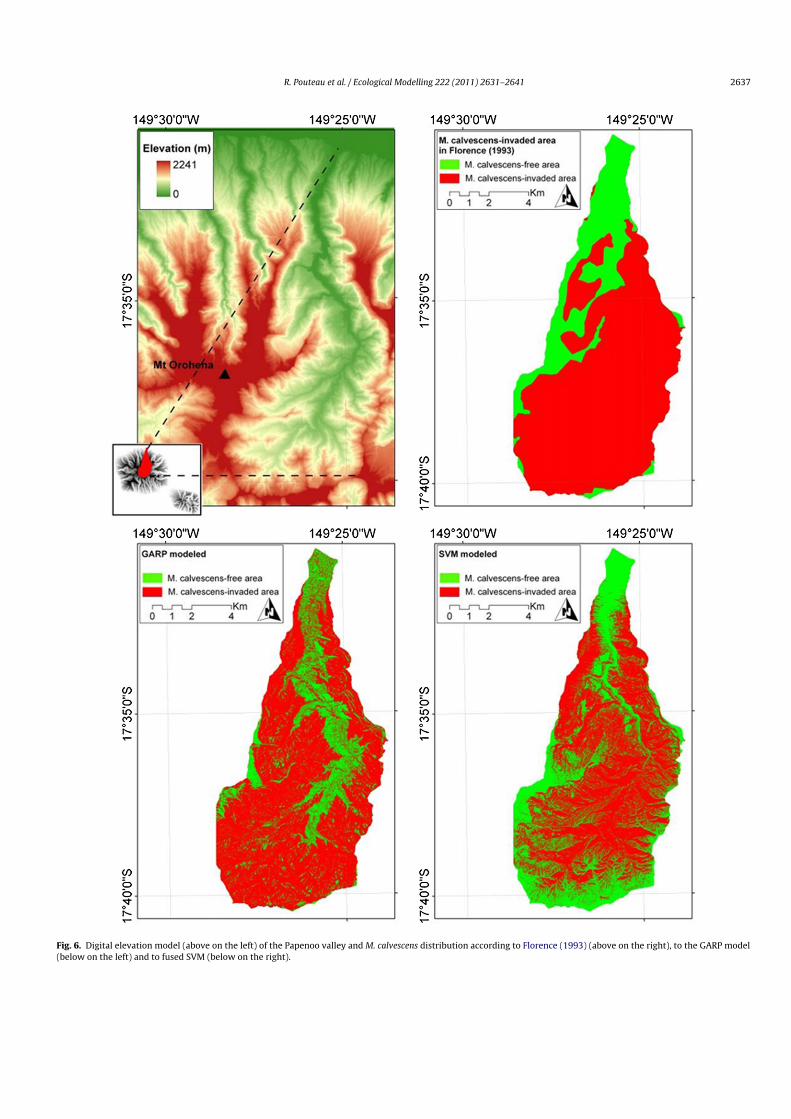
The stretch of the invasion of M. calvescens presented in Fig. 6concerns 5284 ha i.e. 59% of the entire study site. The newlyconstructed map of M. calvescens is coarsely corroborating thepioneering island-scale map of Florence (1993). However a fineranalysis highlights the fundamental need to work at the landscapescale dealing with ecosystem monitoring: area mapped as fully
R. Pouteau et al. / Ecological Modelling 222 (2011) 2631– 2641 2637
Fig. 6. Digital elevation model (above on the left) of the Papenoo valley and M. calvescens distribution according to Florence (1993) (above on the right), to the GARP model(below on the left) and to fused SVM (below on the right).
2638 R. Pouteau et al. / Ecological Modelling 222 (2011) 2631– 2641
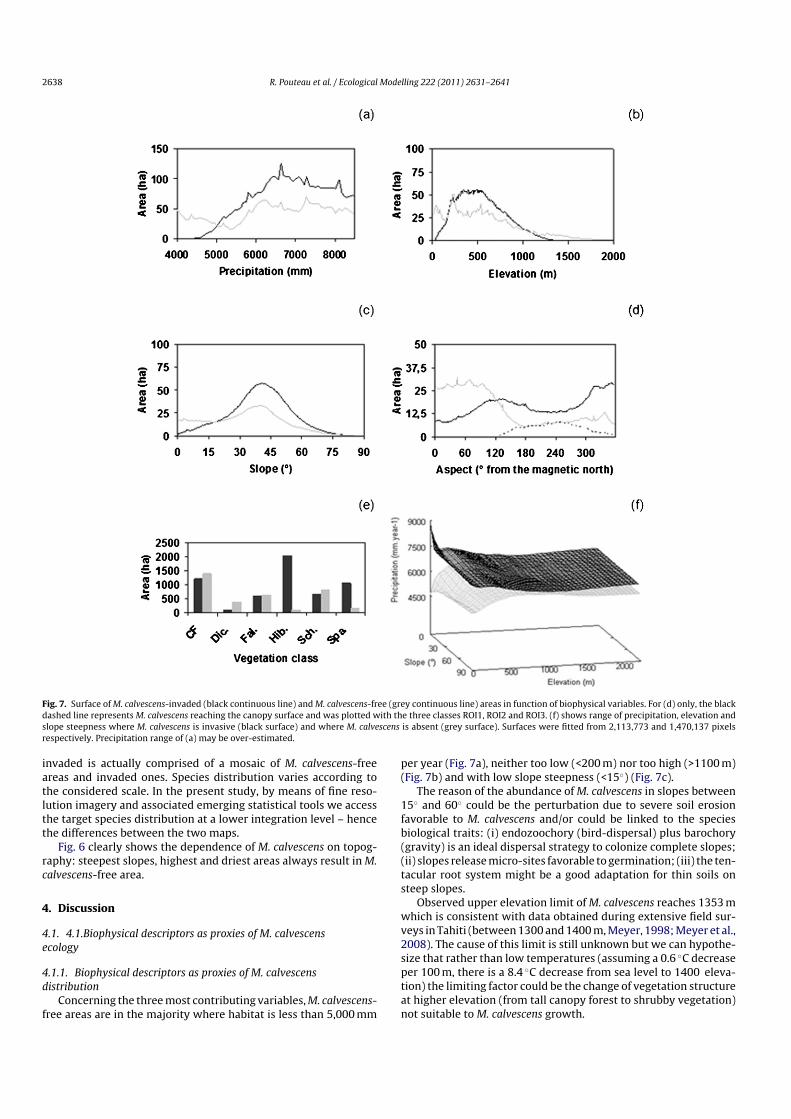
Fig. 7. Surface of M. calvescens-invaded (black continuous line) and M. calvescens-free (grey continuous line) areas in function of biophysical variables. For (d) only, the blackdashed line represents M. calvescens reaching the canopy surface and was plotted with the three classes ROI1, ROI2 and ROI3. (f) shows range of precipitation, elevation andslope steepness where M. calvescens is invasive (black surface) and where M. calvescens is absent (grey surface). Surfaces were fitted from 2,113,773 and 1,470,137 pixelsrespectively. Precipitation range of (a) may be over-estimated.
invaded is actually comprised of a mosaic of M. calvescens-freeareas and invaded ones. Species distribution varies according tothe considered scale. In the present study, by means of fine reso-lution imagery and associated emerging statistical tools we accessthe target species distribution at a lower integration level – hencethe differences between the two maps.
Fig. 6 clearly shows the dependence of M. calvescens on topog-raphy: steepest slopes, highest and driest areas always result in M.calvescens-free area.
4. Discussion
4.1. 4.1.Biophysical descriptors as proxies of M. calvescensecology
4.1.1. Biophysical descriptors as proxies of M. calvescensdistribution
Concerning the three most contributing variables, M. calvescens-free areas are in the majority where habitat is less than 5,000 mm
per year (Fig. 7a), neither too low (<200 m) nor too high (>1100 m)(Fig. 7b) and with low slope steepness (<15◦) (Fig. 7c).
The reason of the abundance of M. calvescens in slopes between15◦ and 60◦ could be the perturbation due to severe soil erosionfavorable to M. calvescens and/or could be linked to the speciesbiological traits: (i) endozoochory (bird-dispersal) plus barochory(gravity) is an ideal dispersal strategy to colonize complete slopes;(ii) slopes release micro-sites favorable to germination; (iii) the ten-tacular root system might be a good adaptation for thin soils onsteep slopes.
Observed upper elevation limit of M. calvescens reaches 1353 mwhich is consistent with data obtained during extensive field sur-veys in Tahiti (between 1300 and 1400 m, Meyer, 1998; Meyer et al.,2008). The cause of this limit is still unknown but we can hypothe-size that rather than low temperatures (assuming a 0.6 ◦C decreaseper 100 m, there is a 8.4 ◦C decrease from sea level to 1400 eleva-tion) the limiting factor could be the change of vegetation structureat higher elevation (from tall canopy forest to shrubby vegetation)not suitable to M. calvescens growth.
R. Pouteau et al. / Ecological Modelling 222 (2011) 2631– 2641 2639
In comparison, upper limit of M. calvescens is lower in the Hawai-ian archipelago (between 300 and 820 m, Maui Invasive SpeciesCommittee, personal communication). Such difference betweenthe Hawaiian archipelago and Tahiti island is not likely to be dueto genetic or ecological differences but more probably to the laterintroduction of M. calvescens in Hawaii (1960s) than in Tahiti (1937)and nearly two decades of containment/eradication efforts (Le Rouxet al., 2008). A more comparable variable is slope steepness reach-ing 73◦ in the Maui Island (Maui Invasive Species Committee,personal communication) which is interesting for its close corre-spondence with our observations in Tahiti (76◦) and stable withininvaded sites.
Meyer (1996, 1998) stated that the lower rainfall limit for M.calvescens distribution is about 2000 mm per year for the islandof Tahiti. In the Papenoo valley, our results show that this limitis 4500 mm per year. Three hypotheses might explain this differ-ence: (i) absolute values of the precipitation map of Tahiti can bebiased because it was interpolated from 43 meteorological stationswith only seven above 500 m elevation and three located in thePapenoo valley at 4, 116 and 350 m elevation. However, relative val-ues seems to be reliable since it is the first explicative descriptor; (ii)affinity of M. calvescens with steep slopes compared to flat areas canexplain its absence in the lower part of the valley; (iii) some areasin the lower part of the valley are dominated by stands of the largealien tree F. moluccana (Fal.) with few M. calvescens in the under-story, and the Polynesian bamboo S. glaucifolium (Sch.), a speciesforming impenetrable layer of rhizomes and almost monospecificgroves characterized by low light incidence.
Site discrepancy in biophysical limits suggests that they shouldnot be considered alone but as a system of interacting factors withsynergistic and antagonistic effects. Such complex interactions areillustrated in Fig. 7f. Precipitation i.e. humidity at the landscape-scale is intensely impacting M. calvescens distribution whereas CTIi.e. local effect of microtopography on humidity not as much.
In regard to the overstory plant species influence, the invasion isgenerally extended and all vegetation classes are concerned. Nev-ertheless, M. calvescens is predominantly present in mixed forests(Hib. and Spa. classes) and less frequent, with more or less 50%occurrence, in F. moluccana (Fal.) mesic forests, in cloud forests(CF), in open and relatively dry D. linearis fernlands (Dic.) and inS. glaucifolium bamboo groves (Sch.) (Fig. 7e).
4.1.2. Biophysical descriptors as proxies of M. calvescens heightAlthough slope exposure does not noticeably contribute to
explain M. calvescens distribution, it is the best proxy of M.calvescens height (Figs. 6b and 7d). Now, considering M. calvescensreaching the canopy surface as a full class, the two thirds of theclassification OA (achieving the same score than with two classesonly: 97%; data not shown) are obtained with the slope exposurevariable lonely.
Slope exposure groups wind and insolation effects together.Wind may not have much influence since the valley is generallyprotected from it by deeply steep-sided slopes. Insolation variesat annual and diurnal temporal scales. Slope exposure is pre-dominantly contributing in the face of API, showing no prevailingcontribution in Fig. 5, and M. calvescens reaching the canopy surfaceis faced from 120◦ to 360◦ i.e. in relief shadow during the morn-ing, which suggests the critical role of diurnal insolation on M.calvescens height. We hypothesize that it is due to light resourceand/or to the fact that M. calvescens favors nocturnal cool tem-perature and high humidity maintained longer during the day inthe shade. Thus, while it is usually benefiting from shadow underthe upper vegetation stratum, M. calvescens would be also capableof morphological plasticity, forming monospecific cover by usingrelief shadow. That could be why M. calvescens reaching the canopy
surface is not visible in our Quickbird scenes taken early in themorning.
4.2. GARP model vs fused SVM
Machine learning algorithms are more adequate to classify mul-tisource data than conventional multivariate statistical classifiersconstrained by the distribution of input data. Machine learningalgorithms are non-parametric and enable the weighting of thedifferent sources (Waske and Benediktsson, 2007) which is criti-cal when using redundant data. Even so, regarding the literature,disparities between machine learning algorithms performances areexisting. SVM, one of the machine learning algorithms, is success-fully used for classifying monosource and multisource remotelysensed data in many application studies and outperforms othermachine learning algorithms in many comparative studies. There-fore we assessed the ability of SVM to integrate a set of biophysicalvariables for predicting distribution of M. calvescens. Fused SVM hasbeen compared with GARP model, another machine learning algo-rithm classically used in species predictive mapping. According toall the comparison metrics we used, GARP model performs worsethan fused SVM in our study case which lead us to the followingobservations.
A major limit of GARP model is its unstable behavior which leadsto various solutions. In contrast, fused SVM has shown to be a stablealgorithm that integrates effectively heterogeneous data and thatcan be trained on relatively small sets of meaningful pixels (Foodyand Mathur, 2006). In this way, fused SVM should be used to maprare endemic species for which, in general, few presence groundcontrol pixels are known. As stated by Anderson et al. (2003), oneof the major limitations of the GARP model (in its Desktop version)is that only presence data are inputted rather than both presenceand absence as for fused SVM. Another significant improvementwith the fused SVM is its ability to integrate the Quickbird imagedirectly whereas the GARP model needs a vegetation map built apriori as input. Finally, GARP model has been designed for speciespredictive mapping. With regard to SVM, originally introduced asa binary classifier, it has been extended to deal with multi-class (Q)problem and become both a classification and a regression classi-fier. In consequence, GARP model can only produce presence area ofthe target species while SVM can also be used for mapping quantita-tive demographic traits of the target species such as height, densityor biomass for example.
5. Conclusion
In this distribution model study, we proposed to integrate bio-physical descriptors from multisource remotely sensed data bymeans of SVM fusion. The latter has led to very accurate analyt-ical results and coherent interpretations. Our integrated synopticalprocedure has permitted to emphasize additional ecological traitsof M. calvescens and factors that determine its distribution havebeen quantified and organized into an hierarchy. The methods andresults presented in this study can contribute to a better under-standing of the dynamics of plant invasions in rainforests, so thatdecision-makers can develop efficient strategies to improve theecological sustainability of vulnerable landscapes in general, as wellas in the Papenoo valley.
The proposed method can be adapted and should be applied toplant or animal, invasive or native species other than M. calvescensin forest ecosystems, particularly in complex terrain. These specieswill be of two types: (i) species with a saturated distribution forwhich the produced map will be an actual distribution map; (ii)species with an unsaturated distribution for which the producedmap will be a potential distribution map or a target species niche
2640 R. Pouteau et al. / Ecological Modelling 222 (2011) 2631– 2641
map. In the latter case, the accuracy is not adapted to evaluate theclassification but provides a useful figure: the percentage of thepotential habitat which is actually inhabited (provided that useddescriptors are sufficient to explain the distribution of the targetspecies).
If the classification accuracy could not be calculated to assess themodel for species which distribution is unsaturated, the presentstudy results underline several successful traits of the model: (i)selected biophysical descriptors are sufficient to explain the distri-bution of M. calvescens; (ii) SVM is an ideal statistical tool to performimage fusion and to integrate such a complex set of descriptors;and (iii) in a generic point of view, the model may be robust forthe reasons mentioned above and because SVM are non-parametricclassifiers and adapted to mixture of qualitative and quantitativevariables.
Regarding the use of the model for other species, several dataare required to train the SVM and can constitute a limitation: (i)sufficient field data is needed which can be restricting in the caseof rare species known in few stations; and (ii) free areas have to beidentified in situ and differentiated from non-inhabited potentialareas which can be hard in the case of species with unsaturateddistribution.
In a future work, it will be interesting to compare the val-ley scale-model presented here with an entire island-scale model(in Tahiti and/or Moorea, where the invasion seems to be alsosaturated). The weight of the biophysical descriptors may varyaccording to the scale of observation as observed for a range ofecological processes such as soil composition or air temperatureand we can suppose that other variables will have to be taken intoconsideration at an island-scale such as windwardness.
The present research is a preliminary but essential step to be ableto model the potential distribution of M. calvescens in area where ithas been recently introduced and is spreading rapidly such as theHawaiian islands, New Caledonia, the tropical region of Queens-land in Australia, or in other French Polynesian islands such asRaiatea and Tahaa (Society archipelago), Fatu Hiva and Nuku Hiva(Marquesas).
Acknowledgements
The authors are grateful to the Government of French Polyne-sia, its Service de l’Urbanisme for providing the Quickbird and theDEM data and its Délégation à la Recherche for financial support.We deeply thank the “Maui Invasive Species Committee” for shar-ing data on the ecological range of M. calvescens on the Hawaiianislands, Lloyd L. Loope (Pacific Island Ecosystems Research Center,USGS) for his relevant comments, Ravahere Taputuarai and VeteaLiao (UC Berkeley R. Gump South Pacific Research Station) for revis-ing the English on an early draft of this paper, and the anonymousreviewers for improving it.
References
Anderson, R.P., Lew, D., Peterson, A.T., 2003. Evaluating predictive models of species’distributions: criteria for selecting optimal models. Ecological Modelling 162,211–232.
Asner, G.P., Jones, M.O., Martin, R.E., Knapp, D.E., Hughes, R.F., 2008a. Remote sensingof native and invasive species in Hawaiian forests. Remote Sensing of Environ-ment 112, 1912–1926.
Asner, G.P., Hughes, R.F., Vitousek, P.M., Knapp, D.E., Kennedy-Bowdoin, T., Board-man, J., Martin, R.E., Eastwood, M., Green, R.O., 2008b. Invasive plants transformthe three-dimensional structure of rain forests. Proceedings of the NationalAcademy of Sciences of the USA 105, 4519–4523.
Atherton, J., et al. (Eds.), 2007. Polynesia-Micronesia biodiversity hotspot. Criticalecosystem profile. Ecosystem Partnership Fund, International-Melanesia Centerfor Biodiversity and Conservation, Arlington, Virginia.
Baruch, Z., Goldstein, G., 1999. Leaf construction cost, nutrient concentration, andnet CO2 assimilation of native and invasive species in Hawaii. Oecologia 121,183–192.
Brier, G.W., 1950. Verification of forecasts expressed in terms of probability. MonthlyWeather Review 78, 1–3.
Bruzzone, L., Conese, C., Maselli, F., Roli, F., 1997. Multisource classification of com-plex rural areas by statistical and neural-network approaches. PhotogrammetricEngineering and Remote Sensing 63, 523–533.
Burges, C.J.C., 1998. A tutorial on support vector machines for pattern recognition.Data Mining and Knowledge Discovery 2, 121–167.
Camps-Valls, G., Gomez-Chova, L., Munos-Marí, J., Vila-Francés, J., Calpe-Maravilla, J.,2006. Composite kernels for hyperspectral image classification. IEEE GeoscienceRemote Sensing Letters 3, 93–97.
Chen, J., Saunders, S.C., Crow, T.R., Naiman, R.J., Brosofske, K.D., Mroz, G.D., Brook-shire, B.L., Franklin, J.F., 1999. Microclimate in forest ecosystem and landscapeecology. Bioscience 49, 288–297.
Cohen, J., 1960. A coefficient of agreement for nominal scales. Educational Psycho-logical Measurement 20, 37–46.
Congalton, R.G., Green, K., 2009. Assessing the Accuracy of Remotely Sensed Data:Principles and Practices. CRC Press, Boca Raton, FL.
Drake, J.M., Randin, C., Guisan, A., 2006. Modelling ecological niches with supportvector machines. Journal of Applied Ecology 43, 424–432.
Duncan, R.A., Fisk, M.R., White, W.M., Nielsen, R.L., 1994. Tahiti: geochemical evo-lution of a French Polynesian volcano. Journal of Geophysical Research 99,24,341-24, 357.
Ebeling, S.K., Welk, E., Auge, H., Bruelheide, H., 2008. Predicting the spread of aninvasive plant: combining experiments and ecological niche model. Ecography31, 709–719.
Florence, J., 1993. La végétation de quelques îles de Polynésie. Planches 54–55. In:Dupon, F. (Coord. Ed.), Atlas de la Polynésie franc aise. ORSTO, Paris, France.
Florence, J., Lorence, D.H., 1997. Introduction to the flora and vegetation of theMarquesas Islands. Allertonia 7, 226–237.
Franklin, J., 1995. Predictive vegetation mapping: geographic modeling of biospatialpatterns in relation to environmental gradients. Progress in Physical Geography19, 474–499.
Foody, G.M., Mathur, A., 2004. A relative evaluation of multiclass image classifica-tion by support vector machines. IEEE Transactions on Geoscience and RemoteSensing 42, 1335–1343.
Foody, G.M., Mathur, A., 2006. The use of small training sets containing mixed pixelsfor accurate hard image classification: training on mixed spectral responses forclassification by a SVM. Remote Sensing of Environment 103, 179–189.
Fourdrigniez, M., Meyer, J.-Y., 2008. Liste et caractéristiques des plantes introduitesnaturalisées en Polynésie franc ais. Contribution à la Biodiversité de Polynésiefranc aise no.17, Délégation à la Recherche, Papeete, French Polynesia.
Fu, P., Rich, P.M., 2002. A geometric solar radiation model with applications in agri-culture and forestry. Computers and Electronics in Agriculture 37, 25–35.
Gessler, P.E., Chadwick, O.A., Chamran, F., Althouse, L., Holmes, K., 2000. Modelingsoil-landscape and ecosystem properties using terrain attributes. Soil ScienceSociety of America Journal 64, 2046–2056.
Gillet, F., 2000. La phytosociologie synusiale intégrée – Guide méthodologique. Tech-nical report, Laboratoire d’écologie végétale et de phytosociologie, NeuchâtelUniversity, France.
Guo, Q., Kelly, M., Graham, C.H., 2005. Support vector machines for predicting dis-tribution of Sudden Oak Death in California. Ecological Modelling 182, 75–90.
Halldorsson, J.H., Benediktsson, J.A., Sveinsson, J.R., 2003. Support vector machinesin multisource classification. IEEE International Geoscience and Remote SensingSymposium 3, 2054–2056.
Hand, D.J., Till, R.J., 2001. A simple generalisation of the area under the ROC curvefor multiple class classification problems. Machine Learning 45, 171–186.
Haralick, R., Shanmugam, K., Dinstein, I., 1973. Textural features for image classifi-cation. IEEE Transactions on Systems Man and Cybernetics 3, 610–621.
Hill, M.J., Ticehurst, C.J., Lee, J.-S., Grunes, M.R., Donald, G.E., Henry, D., 2005. Inte-gration of optical and radar classifications for mapping pasture type in WesternAustralia. IEEE Transactions on Geoscience and Remote Sensing 45, 1665–1681.
Hoffer, R.M., 1975. Natural resource mapping in mountainous terrain by computeranalysis of ERTS-1 satellite data. Technical Note, Laboratory for Applications ofRemote Sensing, Purdue University, USA.
Hsu, C.W., Chang, C.C., Lin, C.J., 2009. A practical guide to support vector classification.Technical Note, Department of Computer Science and Information Engineering,National Taiwan University, Taiwan.
Hutchinson, C.F., 1982. Techniques for combining Landsat and ancillary data fordigital classification improvement. Photogrammetric Engineering and RemoteSensing 48, 123–130.
Invasive Species Specialist Group (ISSG), 2010. Available on line at www.issg.org/database/.
Jeon, M., Alexander, M., Pedrycz, W., Pizzi, N., 2005. Unsupervised hierarchical imagesegmentation with level set and additive operator splitting. Pattern RecognitionLetters 26, 1461–1469.
Joshi, C., De Leeuw, J., van Duren, I.C., 2004. Remote sensing and GIS applications formapping and spatial modelling of invasive species. In: Proceedings of the Inter-national Society for Photogrammetry and Remote Sensing , Istambul, Turkey(CD-ROM, unpaginated).
Joshi, C., De Leeuw, J., van Andel, J., Skidmore, K.A., Lekhak, H.D., van Duren, I.C.,Norbu, N., 2006. Indirect remote sensing of a cryptic forest understorey invasivespecies. Forest Ecology and Management 225, 245–256.
Kononenko, I., Bratko, I., 1991. Information-based evaluation criterion for classifier’sperformance. Machine Learning 6, 67–80.
Krantz, T.P., 1997. Results of the Miconia calvescens color infrared aerial photog-raphy detection project, Moorea, French Polynesia. With imagery by Mr T.
R. Pouteau et al. / Ecological Modelling 222 (2011) 2631– 2641 2641
Norris, with assistance from Dr. J.-Y. Meyer and the Office of the Ministèrede l’Environnement, and the Richard B. Gump Research Station, University ofCalifornia at Berkeley.
Kueffer, C., Daehler, C.C., Torres-Santana, C.W., Lavergne, C., Meyer, J.-Y., Otto, R.,Siolva, L., 2010. A global comparison of plant invasions on oceanic islands. Per-spectives in Plant Ecology, Evolution and Systematics 12, 145–161.
Lardeux, C., Frison, P.-L., Tison, C., Souyris, J.-C., Stoll, B., Fruneau, B., Rudant, J.-P.,2009. Support vector machine for multifrequency SAR polarimetric data classi-fication. IEEE Transactions on Geoscience and Remote Sensing 47, 4143–4152.
LaRosa, A.M., Purrell, M., Franklin, J., Denslow, J., 2007. Designing a control strategyfor Miconia calvescens in Hawaii using spatial modelling. In: 9th InternationalConference on the Ecology and Management of Alien Plant Invasions (poster) ,Perth, Australia.
Lawrence, R.L., Wright, A., 2001. Rule-based classification systems using classifi-cation and regression tree (CART) analysis. Photogrammetric Engineering andRemote Sensing 67, 1137–1142.
Laurent, V., Maamaatuaiahutapu, K., Maiau, J., Varney, P., 2004. Atlas climatologiquede la Polynésie franc aise. Météo-France, Direction interrégionale de Polynésiefranc aise, Papeete, French Polynesia.
Lennon, M., Mercier, G., Hubert-Moy, L., 2002. Classification of hyperspectral imageswith nonlinear filtering and support vector machines. IEEE International Geo-science and Remote Sensing Symposium, 1670–1672.
Le Roux, J.J., Wieczorek, A.M., Meyer, J.-Y., 2008. Genetic diversity and structure ofthe invasive tree Miconia calvescens in Pacific islands. Diversity and Distribution14, 935–948.
Linderman, M.A., Liu, J., Qi, J., An, L., Ouyang, Z., Yang, J., Tan, T., 2004. Using artificialneural networks to map the spatial distribution of understory bamboo fromremotely sensed data. International Journal of Remote Sensing 25, 1685–1700.
Loo, S.E., Mac Nally, R., Lake, P.S., 2007. Forecasting New Zealand mudsnail inva-sion range: model comparisons using native and invaded ranges. EcologicalApplications 17, 181–189.
Loope, L.L., Mueller-Dombois, D., 1989. Characteristics of invaded islands, with spe-cial references to Hawaii. In: Drake, et, al. (Eds.), Biological Invasions: a GlobalPerspective. John Wiley and Sons, Chichester, UK.
Meyer, J.-Y., 1996. Status of Miconia calvescens (Melastomataceae), a dominant inva-sive tree in the Society Islands (French Polynesia). Pacific Science 50, 66–76.
Meyer, J.-Y., Florence, J., 1996. Tahiti’s native flora endangered by the invasion ofMiconia calvescens DC. (Melastomataceae). Journal of Biogeography 23, 775–781.
Meyer, J.-Y., 1998. Observations on the reproductive biology of Miconia calvescens(Melastomataceae), an alien invasive tree on the island of Tahiti (South PacificOcean). Biotropica 30, 609–624.
Meyer, J.-Y., 2004. Threat of invasive alien plants to native flora and forest vegetationof Eastern Polynesia. Pacific Science 58, 357–375.
Meyer, J.-Y., 2007. Conservation des forêts naturelles et gestion des aires protégéesen Polynésie franc aise. Bois et Forêts des Tropiques 291, 25–40.
Meyer, J.-Y., Taputuarai, R., Killgore, E.M, 2008. Dissemination and impact of the fun-gal pathogen Colletotrichum gloeosporioides f. sp. miconiae on the invasive alientree Miconia calvescens (Melastomataceae) in the rainforests of Tahiti (FrenchPolynesia, South Pacific). In: Julian, M.H., Sforza, R., Bon, M.C., Evan, H.C., Hatcher,P.E., Hinz, H.L., Rector, B.G. (Eds.), Proceedings of the XII International Sympo-sium on Biological Control of Weeds, La Grande Motte, France. CAB International,Wallingford.
Meyer, J.-Y., 2009. Flore et végétation du plateau marécageux de Anaori’i (vallée dela Papeno’o, Tahiti): une zone humide unique en Polynésie franc aise. Technicalreport. French Polynesian Department of Research, Papeete, French Polynesia.
Meyer, J.-Y., 2010. Montane cloud forests on remote islands of Oceania: the exam-ple of French Polynesia (South Pacific Ocean). In: Bruijnzeel, L.A., Scatena, F.N.,Hamilton, L.S. (Eds.), Tropical Montane Cloud Forests. Cambridge UniversityPress.
Millennium Ecosystem Assessment, 2005. Ecosystems and Human Well Being: Cur-rent State and Trends. Island Press.
Moore, I.D., Grayson, R.B., Ladson, A.R., 1991. Digital terrain modelling: a review ofhydrological, geomorphological and biological applications. Hydrological Pro-cesses 5, 3–30.
Moore, I.D., Gessler, P.E., Nielsen, G.A., Peterson, G.A., 1993. Soil attribute predic-tion using terrain analysis. Soil Science Society of America Journal 57, 443–452.
Nagy, L., Grabherr, G., Körner, C., Thompson, D.B.A. (Eds.), 2003. Alpine Biodiversityin Europe. Springer Verlag, Berlin, Germany.
Nemmour, H., Chibani, Y., 2006. Multiple support vector machines for land coverchange detection: an application for mapping urban extensions. ISPRS Journalof Photogrammetry and Remote Sensing 61, 125–133.
Pal, M., Mather, P.M., 2004. Assessment of the effectiveness of support vectormachines for hyperspectral data. Future Generation Computer Systems 20,1215–1225.
Paulay, G., 1994. Biodiversity on oceanic islands its origin and extinction. AmericanZoologist 34, 134–144.
Papy, R.H., 1951–1954. Tahiti et les îles voisines. La végétation des îles de la Sociétéet de Makatea (Océanie franc aise), 2e partie. Travaux du laboratoire forestier deToulouse, tome V, 2e sect. vol. I. art. III, Toulouse, France.
Peterson, A.T., Scachetti-Pereira, R., Kluza, D.A., 2003. Assessment of invasive poten-tial of Homalodisca coagulata in Western North America and South America.Biota Neotropica 3, 2–7.
Piella, G., 2003. A general framework for multiresolution image fusion: from pixelsto regions. Information Fusion 4, 259–280.
Pouteau, R., Stoll, B., Chabrier, S., 2010. Ground truth method assessment for SVMbased landscape classification. IEEE International Geoscience and Remote Sens-ing Symposium, 2715–2718.
Richards, J.A., 2005. Analysis of remotely sensed data: the formative decades andthe future. IEEE Transactions on Geoscience and Remote Sensing 43, 422–432.
Riegel, G.M., Miller, R.F., Krueger, W.C., 1992. Competition for resources betweenunderstory vegetation and overstory Pinus ponderosa in Northeastern Oregon.Ecological Applications 2, 71–85.
Roura-Pascual, N., Suarez, A.V., Gómez, C., Pons, P., Touyama, Y., Wild, A.L., Peterson,A.T., 2004. Geographical potential of Argentine ants (Linepithema humile Mayr)in the face of global climate change. Proceedings of the Royal Society London B271, 2527–2535.
Roura-Pascual, N., Brotons, L., Peterson, A.T., Thuiller, W., 2008. Consensual pre-dictions of potential distributional areas for invasive species: a case study ofArgentine ants in the Iberian Peninsula. Biological Invasions 11, 1017–1031.
Sánchez-Flores, E., 2007. GARP modelling of natural and human factors affecting thepotential distribution of the invasives Schismus arabicus and Brassica tournefortiiin “El Pinacate y Gran Desierto de Altar” Biosphere Reserve. Ecological Modelling204, 457–474.
Schölkopf, B., Smola, A., 2002. Learning with Kernels. Cambridge, MA, MIT Press.Stockwell, D., Peters, D., 1999. The GARP modelling system: problems and solutions
to automated spatial prediction. International Journal of Geographical Informa-tion Science 13, 143–158.
Strahler, A.H., 1981. Stratification of natural vegetation for forest and rangelandinventory using Landsat digital imagery and collateral data. International Journalof Remote Sensing 2, 15–41.
Treltz, P., Howarth, P., 2000. Integrating spectral, spatial, and terrain variables for for-est ecosystem classification. Photogrammetric Engineering and Remote Sensing66, 305–317.
Vapnik, V., Chervonenkis, A., 1998. Statistical learning theory. In: Support VectorMachines for Pattern Recognition. John Wiley & Sons, New York.
Walsh, S.J., McCleary, A.L., Mena, C.F., Shao, Y., Tuttle, J.P., Gonzalez, A., Atkinson, R.,2008. Quickbird and Hyperion data analysis of an invasive plant species in theGalapagos Islands of Ecuador: implications for control and land use manage-ment. Remote Sensing of Environment 112, 1927–1941.
Waske, B., Benediktsson, J.A., 2007. Fusion of support vector machines for classifica-tion of multisensor data. IEEE Transactions on Geoscience and Remote Sensing45, 3858–3866.
Waske, B., Benediktsson, J.A., Sveinsson, J.R., 2009. Classifying remote sensing datawith support vector machines and imbalanced training data. In: Multiple Clas-sifiers Systems. Springer, Berlin/Heidelberg.
Wibaux, B., 1990. Etude sur les potentialités de l’outil télédétection à contrôler lesétats d’évolution de la prolifération du genre miconia à Tahiti. Délégation àl’environnement/Station Polynésienne de Télédétection. Convention 89/1653,Unpublished report.
Wilson, J.P., Gallant, J.C., 2000. Terrain Analysis: Principles and Applications. JohnWiley & Sons, New York.
Xie, Y., Sha, Z., Yu, M., 2008. Remote sensing imagery in vegetation mapping: areview. Plant Ecology 1, 9–23.