ecological site f128xy001tn - edit
TRANSCRIPT

Natural ResourcesConservation Service
Ecological site F128XY001TNThermic Cherty Dolomite Upland Oak-Hickory Forest
Accessed: 10/31/2021
General information
Figure 1. Mapped extent
MLRA notes
Areas shown in blue indicate the maximum mapped extent of this ecological site. Other ecological sites likely occurwithin the highlighted areas. It is also possible for this ecological site to occur outside of highlighted areas if detailedsoil survey has not been completed or recently updated.
Major Land Resource Area (MLRA): 128X–Southern Appalachian Ridges and Valleys
Major Land Resource Area (MLRA) 128, shown as the area shaded in gray on the accompanying figure, falls intothe East and Central Farming and Forest Region. This MLRA is in Tennessee (36 percent), Alabama (27 percent),Virginia (25 percent), and Georgia (12 percent). It makes up about 21,095 square miles (54,660 square kilometers).
Most of this MLRA is in the Tennessee section of the Valley and Ridge province of the Appalachian Highlands. Thethin stringers in the western part of the area are mostly in the Cumberland Plateau section of the AppalachianPlateaus province of the Appalachian Highlands. A separate area of the MLRA in northern Alabama is in theHighland Rim section of the Interior Low Plateaus province of the Interior Plains. The western side of the area isdominantly hilly to very steep and is rougher and much steeper than the eastern side, much of which is rolling andhilly. Elevation ranges from 660 feet (200 meters) near the southern end of the area to more than 2,400 feet (730meters) in the part of the area in the western tip of Virginia. Some isolated linear mountain ridges rise to nearly4,920 feet (1,500 meters) above sea level.
The MLRA is highly diversified. It has many parallel ridges, narrow intervening valleys, and large areas of low,irregular hills. The bedrock in this area consists of alternating beds of limestone, dolomite, shale, and sandstone ofearly Paleozoic age. Ridgetops are capped with more resistant carbonate and sandstone layers, and valleys havebeen eroded into the less resistant shale beds. These folded and faulted layers are at the southernmost extent ofthe Appalachian Mountains. The narrow river valleys are filled with unconsolidated deposits of clay, silt, sand, andgravel.

Classification relationships
Ecological site concept
Table 1. Dominant plant species
This site falls into the "Southern Limestone/Dolomite Valleys and Low Rolling Hills" ecoregional classificationdeveloped by the Environmental Protection Agency (Authors: Glenn Griffith, James Omernik, Sandra Azevedo).
The USGS-based Southeast GAP Analysis Project classifies this area under two major forest types: South-CentralInterior Mesophytic Forest (CES202.887) and Southern Ridge and Valley/Cumberland Dry Calcareous Forest(CES202.457).
The Cherty Dolomite Upland Oak-Hickory Forest ecological site (in red) constitutes a high percentage of this MLRA.This site is primarily forested with mixed hardwoods, currently dominated by oak and hickory. It is characterized byrolling topography with gently sloping to very steep upland hills. Ridges are typically wider and lower in elevationthan other ridges in the MLRA. Some of the oldest and most highly leached soils of the MLRA occur on thisecological site.
Tree
Shrub
Herbaceous
(1) Quercus alba(2) Carya glabra
(1) Cercis canadensis(2) Oxydendrum arboreum
(1) Vitis rotundifolia(2) Polystichum acrostichoides
Physiographic features
Figure 2. Example Block Diagram for Cherty Dolomite Upland
Table 2. Representative physiographic features
This ecological site occurs on summits, shoulders, and backslopes on dissected uplands weathered from chertydolomitic limestone. Slopes are 2 to 60 percent. Elevation ranges from 500 to 2,130 feet. The topography rangesfrom ridges to rolling hills.
This site can generate runoff to adjacent, downslope ecological sites. This site does not flood.
Landforms (1) Ridge
(2) Hill
Flooding frequency None
Ponding frequency None
Elevation 500 – 2,130 ft

Slope 2 – 60%
Water table depth 60 in
Aspect SE, SW, NW
Climatic features
Table 3. Representative climatic features
This area falls under the humid, mesothermal climate classification (Thornwaite, 1948). Precipitation is fairly evenlydistributed throughout the year, with little or no water deficiency during any season. The average annualprecipitation in most of this area is 45 to 55 inches. It increases to the south. Maximum precipitation occurs inmidwinter and midsummer, and the minimum occurs in autumn. Most rainfall occurs as high-intensity, convectivethunderstorms. Snowfall may occur in winter. Average annual temperatures range from 46 to 70 degrees F,increasing to the south. The freeze-free period averages 205 days and is longest in the southern part of the areaand shortest at higher elevations to the north. The growing season corresponds to climate. Local climate can bevariable and microclimates factor into the distribution of plants. In general, topographic features such as slopeaspect, landform, steepness, and position of the ridges and valleys are important site variables in the distribution ofvegetation across the landscape (Martin, 1989).
Frost-free period (average) 172 days
Freeze-free period (average) 195 days
Precipitation total (average) 53 in
Influencing water featuresThis site is not influenced by water from a wetland or stream.
Soil featuresThis ecological site is represented by soils in the Ultisols soil order. Major soil series for this ecological site arePailo, Bodine, Fullerton, and Minvale. Map units having these soils as both major and minor components, either inconsociations or complexes, make up the majority of the ecological site. These soils have a thermic temperatureregime and an udic moisture regime. They are extremely deep, well drained, highly weathered, and acidic. Soilsassociated with this ecological site formed in colluvium or soil creep, over the underlying residuum from chertydolomitic limestone and from residuum from cherty dolomitic limestone.
In general, Ultisols are formed from parent materials that contain small amounts of basic cations. The Ultisols in thisecological site description are derived from cherty dolomitic limestone. In weathering, the dolomite produces silica.The silica accumulates in the soil as chert. Chert produced during weathering is generally porous and cavernous,but in some areas, it is massive. Water availability generally goes down as the percentage of chert goes up (Martin1989). This can affect the local distribution of plant species within this site. Being silica based, the reaction of soilsweathered from cherty dolomitic limestone range from strongly acid to extremely strongly acid in the particle sizecontrol section. Soils weathering from the cherty dolomitic limestone have mineralogy from siliceous to kaolinitic.The particle size family for these soils includes fine-loamy, loamy-skeletal, and fine. Drainage classes for theselected soil series are well drained and somewhat excessively drained.
The parent materials and landforms in this physiographic province are geologically old. These soils have becomehighly weathered and leached over time due to the age of parent materials, thermic temperature regime and udicmoisture regime, leaving soils with a naturally low nutrient content, low base status, and high subsoil acidity. Thesebecome limitations from an agricultural and timber standpoint but can be easily overcome by adequate applicationof lime, fertilizer, and use of best management practices (Buol et al., 1997).

Figure 7. Fullerton series soil profile
Table 4. Representative soil features
Parent material (1) Residuum – chert
(2) Colluvium – dolomite
(3) Creep deposits – cherty limestone
Surface texture
Family particle size
Drainage class Well drained to
somewhat excessively drained
Permeability class Moderate to
rapid
Soil depth 60 – 203 in
Surface fragment cover <=3" 6 – 40%
Surface fragment cover >3" 0 – 18%
Available water capacity(0-40in)
1 – 8.1 in
Soil reaction (1:1 water)(0-40in)
4 – 6
Subsurface fragment volume <=3"(Depth not specified)
13 – 58%
Subsurface fragment volume >3"(Depth not specified)
0 – 23%
(1) Gravelly silt loam(2) Very gravelly loam(3) Extremely gravelly silty clay loam
(1) Clayey
Ecological dynamicsThe information contained in the state and transition model (STM) and the ecological site description wasdeveloped using archeological and historical data, professional experience, and scientific studies. The informationpresented is representative of a very complex set of plant communities. Not all scenarios or plants are included.Key indicator plants, animals, and ecological processes are described to inform land management decisions.
The historic reference plant community phase of the Cherty Dolomite Upland is perceived to be a mixed hardwoodforest, dominated by oaks and hickories now. Prior to the decimation of the American chestnut (Castanea dentata)by the chestnut blight, that species would have been important. White oak (Quercus alba), pignut hickory (Caryaglabra), northern red oak (Quercus rubra) and tuliptree (Liriodendron tulipifera) most commonly occur in the canopyof forest stands although a multitude of other hardwood and some pine tree species can occur to varying degreesacross the landscape. For example, chestnut oak (Quercus prinus) commonly assumes dominance on drierridgetop positions (Condley 1984). Loblolly pine (Pinus taeda) can be important toward the southern extent of theMLRA.

The forests of today are likely the result of a series of complex disturbances including the loss of American chestnutin the 1930s (Thor and Summers 1971) (Nelson 1955), broad-scale and intense land-use change, fire and firesuppression, highly dynamic wildlife populations and a substantial climatic shift toward increased moistureavailability (McEwan et al. 2011). They are forests in transition as the often dense mid-story of sugar maple (Acersaccharum), red maple (Acer rubrum) and American beech (Fagus grandifolia) indicates (McEwan et al. 2011).These mesophytic species are capable of achieving dominance and that species composition shift has become aconcern, especially in relation to forestry and wildlife impacts. Other mid-story trees include flowering dogwood(Cornus florida), pawpaw (Asimina triloba), sourwood (Oxydendrum arboreum ), and eastern redbud (Cerciscanadensis).
The forest understory includes native vines, ferns, and herbs including Virginia creeper (Parthenocissusquinquefolia), eastern poison ivy (Toxicodendron radicans), muscadine (Vitis rotundifolia), greenbriar (Smilax spp.),littlebrownjug (Hexastylis arifolia), mayapple (Podophyllum peltatum), feathery false lily of the valley ( Maianthemumracemosum), yellow wakerobin (Trillium luteum), and Christmas fern (Polystichum acrostichoides). Treeregeneration also represents a percentage of the understory, with the maples and American beech occurring mostcommonly (Hart et al. 2008).
Most species associated with this site are generalists and demonstrate wide ecological amplitude to tolerate avariety of environmental conditions but a few are more limited. In general, soil moisture is the single most importantfactor for plant growth and plant species occur along a moisture gradient determined by topographic factors such asaspect, slope shape, slope inclination, and slope position (Martin 1971). Typically, chestnut oak forest communitiesdominate ridgetops; white oak – black oak (Quercus velutina) communities are found on drier, exposed slopes.Tuliptree prefers small depressions and receiving positions; shortleaf pine (Pinus echinata) and Virginia pine (Pinusvirginiana) occur sporadically, typically on more exposed positions. Northern red oak seems to prefer midslopepositions. Scarlet oak (Quercus coccinea) is found often on warmer, drier positions. Understory diversity tends toincrease on north-facing slopes (contingent on past land use) and on lower slope positions and decrease on ridgesand exposed south-facing slopes.
South of this site, equivalent soils produce oak-pine dominated forests indicating that latitude does affect speciesdistribution (Martin 1989) and production (Condley 1984) within the major land resource area.
There is strong evidence to suggest that humankind has occupied the ridge and valley and interacted with the landfor the past 10,000 years or more (Chapman, 1982). Native American population demographics changed over time,as did the type and intensity of their land use practices. It is likely that land clearance and cultivation over the lastseveral thousand years increased the amount of forest edge considerably (Chapman, 1982). The exactmechanisms of this change prior to European settlement are unclear, but there is little doubt that American Indianswere cultivating crops, cutting trees to use for fuel wood and building materials, planting orchards for fruit and nutproduction, and using prescribed fire to clear land for settlement and open the forest for hunting. The effects of theirmanagement practices were probably highly variable across the landscape and intermediate in scale. The bestavailable studies suggest that due to the land use practices of Native Americans in this general region, oaks andchestnuts became dominant on upper slopes, fire-adapted pines established on ridges, and disturbance-adaptedhardwoods colonized old fields (Delcourt, 1998).
After European settlement and expansion in the early 1800’s, land use changed drastically both in terms of type andintensity. The early pioneers used the forests for food for themselves and their livestock in addition to cutting woodfor fuel, shelter, etc. A common practice was to use forested ridges for pasture. They also cleared forests forhabitation, pastures, and fields. As industrialization occurred and people moved into more urban areas, many of thepastures and fields were abandoned and reverted to forest. These forests are now largely occupied by low-quality,mixed hardwood-pine and small-sawtimber size hardwood stands (Smith, 1995).
In addition to forest clearing for small settlement farms, the forests of this area were extensively logged in the latenineteenth and early twentieth century, before the advent of modern forestry and soil conservation practices. Duringthis time, boomtowns sprang up around lumber mills and railroads were built to accommodate the trade. Termed“the Big Cut” by local foresters, this period in history resulted in probably the most significant forest disturbance todate. Almost all forests in this region were impacted to some degree and stands which exhibit old-growthcharacteristics are extremely rare today.
Destructive fires often followed poor logging practices, killing young stands, damaging older tree trunks and causing

State and transition model
heavy losses in soil fertility. However, while fire prevention and suppression programs in the 1930’s decreased theloss of forest resources to wildfire, it also impacted forest dynamics significantly (Smith, 1995). The role of fire in thegreater Southern Appalachian Hardwood region as a whole (which encompasses this ecological site) is not wellunderstood and research into the complex relationship between fire and oak forests is emerging (Arthur et al. 2012).
Another important disturbance in the eastern forest was the loss of the American chestnut to the exotic chestnutblight fungus in the early 1900’s. It had moved through Tennessee, killing most chestnut trees by 1930 (Hart, 2008).It is widely accepted that chestnut was replaced by oak and hickory species, especially in upland areas; although,other species including red maple would also have benefited (Keever, 1953; Stephenson et al., 1991).
Most oak species would likely also have responded favorably to the heavy disturbances caused by logging and firein the early years of settlement. The combined result is the heavily oak-hickory dominated forests common onupland sites today.
Present-day disturbances include poor logging practices such as high-grading or diameter-limit cutting, whichselects higher-quality trees for extraction and leaves defective or unhealthy trees. This results in forest stands thatare degraded in terms of genetics, species composition, forest health, and timber quality. Most stands in thisecological site have been high-graded multiple times.
Invasive exotic pest plant species are negatively impacting the overall health of forested stands. Plant species ofconcern in forests include tree of heaven (Ailanthus altissima), Asian bittersweet (Celastrus orbiculatus), autumnolive (Elaeagnus umbellate var, parviflora), bicolor lespedeza (Lespedeza bicolor), the exotic privets (Ligustrumspp.), princess tree (Paulownia tomentosa), kudzu (Pueraria montana var. lobata), multiflora rose (Rosa multiflora),and the exotic honeysuckles (Lonicera spp.). Forests are particularly susceptible to exotic plant invasion after adisturbance, which further complicates management decisions. In general, in the South, invasive exotic plantsshould be considered in nearly every management scenario.
The Tennessee Division of Forestry lists four major areas of concern for forest pests: gypsy moth, southern pinebeetle, oak decline, and dogwood anthracnose. All of these could be significant threats to the health of forestsassociated with this ecological site. The recently detected thousand cankers disease and emerald ash borer posenew threats to black walnut (Juglans nigra) and ash species (Fraxinus spp.), respectively.
A state and transition model for the Thermic Cherty Dolomite Upland ecological site follows this narrative. Thoroughdescriptions of each state, transition, plant community, and pathway follow the model. Experts base this model onavailable experimental research, field observations, professional consensus, and interpretations. It is likely tochange as knowledge increases.
Plant communities will differ across the major land resource area because of the naturally occurring variability inweather, soils, and aspect. The Reference Plant Community is not necessarily the management goal. The biologicalprocesses on this site are complex. Therefore, representative values are presented in a land management context.The species lists are representative and are not botanical descriptions of all species occurring, or potentiallyoccurring, on this site. They are not intended to cover every situation or the full range of conditions, species, andresponses for the site.
The following diagram suggests pathways that the vegetation on these sites will most likely take, given the abovegeneral descriptions of climate, soils, and disturbance histories. Specific areas with unique soils and disturbancehistories may have alternative pathways not shown on this diagram. This information is intended to show what mighthappen given average site conditions and a history of repeated disturbances as described above. Localprofessional guidance should always be sought before pursuing a treatment scenario.

Figure 8. Thermic Cherty Dolomite Upland

Figure 9. Thermic Cherty Dolomite Upland STM Legend
State 1Reference State - Upland Oak/Hickory Forest
Community 1.1White oak - pignut hickory
The reference state for this ecological site is characterized by a closed-canopy hardwood forest dominated by oaksand hickories. In order for this reference state to be maintained, the oak/hickory species must be present in multipleage classes. In most cases red maple, sugar maple and American beech are colonizing the midstory andunderstory. A species composition shift toward these more mesophytic species is widely recognized throughout theeastern United States (McEwan et al., 2011).
The reference state described here represents a condition dependent on complex, multiple disturbances, some ofwhich are human caused. In order to get oak to succeed and recruit into the next stand, advanced oak regenerationmust be present before a major canopy disturbance. Oaks must be able to reach a size that is competitive (throughsmaller-scale disturbances such as fire or herbicide of midstory, or tree planting with vigorous seedlings orsaplings), then there needs to be a canopy disturbance. There may need to be additional disturbances to get rid ofcompetition.

Figure 10. Oak-Hickory state
Figure 11. Canopy cover
Figure 12. Overstory in spring

Figure 13. Overstory in winter
Figure 14. Spring understory
This phase is dominated by oaks and hickories in the overstory currently, but mid-story composition is shiftingtoward more shade and moisture-loving species. The understory is relatively rich in herbaceous diversity (includingvines) but tree regeneration overwhelmingly favors the shade-tolerant species.
For this phase to regenerate back to oak and hickory, numerous complex and site-specific factors may benecessary. These include acorn production, seedling establishment, advanced regeneration from seedlings, andtimely release (Brose et al., 2013). Several types of management can be employed to this end including prescribedfire, mechanical and chemical competition control, site preparation, and planting. However, depending on the standand its history, management for oak/hickory is typically intensive and often requires multiple treatments over time(~10 - 25 years), (Loftis, 2004).
Without intensive management, in most cases, stands will naturally succeed to a more mesophytic forest typedominated by shade tolerant species (the maples and American beech). Dendroecology studies in nearby, verysimilar old-growth forest stands indicate that oak species have dominated stands for the past 300 years. Theyspeculate that the recent proliferation of maples in the understory will inhibit regeneration of oak and pine under thecurrent disturbance regime (Hart et al., 2012). Oak and hickory can regenerate in canopy gaps formed by uprootedtrees, but only on very dry sites, indicating that gap-phase dynamics will favor maple overall (Hart and Kupfer,2011).
The American chestnut was an important part of this ecological site prior to decimation by the chestnut blight, but itis unclear how abundant it would have been. Colloquial estimates based on local names like "Chestnut Ridge"indicate that it may have been prolific. Sprouts from old chestnut stumps were noted often during field sampling.Sprouts rarely survive to flowering age, but can often reach as much as 8 inches diameter at breast height (DBH)before they succumb to the blight. Rarely, an American chestnut sprout will reach larger size classes and survive toflower.
Forest overstory. The overstory of this community is dominated by oak and hickory species, most commonly whiteoak and pignut hickory. Other species include tuliptree, black oak, northern red oak, chestnut oak, blackjack oak,

Table 5. Soil surface cover
Table 6. Woody ground cover
shagbark hickory (Carya carolinae-septentrionalis), mockernut hickory (Carya alba), scarlet oak (Quercus coccinea)and blackgum (Nyssa sylvatica), among others.
Midstory species include sourwood (Oxydendrum arboreum), sassafras (Sassafras albidum), eastern redbud(Cercis canadensis), flowering dogwood (Cornus florida), Carolina buckthorn (Frangula caroliniana), and commonserviceberry (Amelanchier arborea). Shade tolerant hardwoods are a natural part of the dynamic of this ecologicalsite, but have become more dominant in the midstory of most stands than they might naturally be due to lack ofdisturbance over time. Shade tolerant species include American beech, sugar maple and red maple.
Please note that species are reported by height class. Some species occur in multiple height classes, andaccordingly, have multiple entries.
Forest understory. Herbaceous diversity is high overall, but not as high as in other associated ecological sites (notyet described). Occurrence and abundance vary based on topography and are lowest on ridges and south-facingshoulders and side slopes and highest on lower north-facing side slopes. Commonly occurring species includefeathery false lily of the valley (Maianthemum racemosum), littlebrownjug (Hexastylis arifolia), mayapple(Podophyllum peltatum), cutleaf toothwort (Cardamine concatenata), the bellworts (Uvularia spp.), American cancerroot (Conopholis americana), trefoil (Desmodium spp.), jack in the pulpit (Arisaema triphyllum), sweet cicely(Osmorhiza spp.), trailing arbutus (Epigaea repens), the violets (Viola spp.), wood sorrel (Oxalis montana), blackcohosh (Actaea racemosa), forest licorice bedstraw (Calium circaezans), and yellow wakerobin (Trillium luteum).
Native vines are important in this ecological site; although, it is unclear how much disturbance plays a role in theirabundance. Poison ivy (Toxicodendron radicans), for example, tends to do better in disturbed areas and can oftenbe an indication of a past disturbance, such as grazing, if found in proliferation. Other important vines includegreenbriar (Smilax spp.), muscadine (Vitis rotundifolia), Virginia creeper (Parthenocissus quinquefolia), andcrossvine (Bignonia capreolata).
Tree basal cover 3-5%
Shrub/vine/liana basal cover 1-2%
Grass/grasslike basal cover 0-1%
Forb basal cover 0-1%
Non-vascular plants 0-1%
Biological crusts 0%
Litter 60-89%
Surface fragments >0.25" and <=3" 0-5%
Surface fragments >3" 2-15%
Bedrock 0%
Water 0%
Bare ground 0%
Downed wood, fine-small (<0.40" diameter; 1-hour fuels) 0-5%
Downed wood, fine-medium (0.40-0.99" diameter; 10-hour fuels) 0-5%
Downed wood, fine-large (1.00-2.99" diameter; 100-hour fuels) 0-7%
Downed wood, coarse-small (3.00-8.99" diameter; 1,000-hour fuels) 0-7%
Downed wood, coarse-large (>9.00" diameter; 10,000-hour fuels) 0-6%
Tree snags** (hard***) –
Tree snags** (soft***) –

* Decomposition Classes: N - no or little integration with the soil surface; I - partial to nearly full integration with the soil surface.** >10.16cm diameter at 1.3716m above ground and >1.8288m height--if less diameter OR height use applicable down wood type; forpinyon and juniper, use 0.3048m above ground.*** Hard - tree is dead with most or all of bark intact; Soft - most of bark has sloughed off.
Table 7. Canopy structure (% cover)
Community 1.2Maple species - American beech
Tree snag count** (hard***) 0-10 per acre
Tree snag count** (hard***) 0-20 per acre
Height Above Ground (Ft) Tree Shrub/VineGrass/
Grasslike Forb
<0.5 – 11-20% 0-1% 0-5%
>0.5 <= 1 – 1-20% 0-2% 1-5%
>1 <= 2 – 0-5% – –
>2 <= 4.5 1-5% 1-5% – –
>4.5 <= 13 1-5% 1-5% – –
>13 <= 40 2-25% – – –
>40 <= 80 2-45% – – –
>80 <= 120 30-75% – – –
>120 20-30% – – –
Figure 15. Maple midstory

Figure 16. Maple regeneration
Figure 17. Gap dynamics
This community phase has not yet been attained in most cases because forests currently dominated by oaks andhickories are in transition. Without management or large-scale disturbance, stands will naturally succeed to moremesophytic species composition in the overstory and the oaks and hickories will lose their dominance over time.Small-scale gap dynamics caused by tree throws would likely be a natural part of this state and would favor themaple component in forest stands (Hart et al. 2012).
A recent study of red maple on the nearby Cumberland Plateau found that canopy accession strategy and climate-growth relationships are critical factors in the shift from state 1.1 to state 1.2 (Hart et al., 2012). Red maples aregap-opportunists and can take advantage of smaller-scale disturbances such as tree-throws. Oaks in contrast,seem to have needed high frequency, intense disturbances to establish their current dominance in the forest.
Red maples do best in times of cool, wet springs preceded by wet autumns and warm winters (Hart et al. 2012).Depending on climate conditions in the coming years, the weather may or may not favor their continuedestablishment. Red maple might also cause local environmental changes that facilitate perpetuation of favorable

Pathway 1.1ACommunity 1.1 to 1.2
Pathway 1.2ACommunity 1.2 to 1.1
Conservation practices
conditions for regeneration such as modification of understory light levels and soil characteristics (Nowacki andAbrams 2008). The denser canopies might reduce understory temperature and increase relative humidity, whichwould also favor the more shade-tolerant, moisture loving state (Alexander and Arthur 2010).
Prescribed fire has been suggested as a management tool to reverse the trend. While it may be a useful tool insome cases and most likely in combination with other management approaches, using fire alone is unlikely toproduce the desired results in most stands (Clark and Schweitzer 2013).
Forest overstory. The forest overstory is dominated by mature maples and American beech. Tree throws createsmall-scale gap dynamics in the forest, which favor recruitment of the maples and in some cases, yellow poplar.Oaks and hickories will always be a part of the species composition in this state, but will not be dominant.
Forest understory. Forest understory composition will be similar to community phase 1.1, dominated by nativeherbs, forbs, and vines. Shade tolerant trees will be present in the regeneration. Spring ephemeral wildflowers willbe prolific in places.
White oak - pignut hickory Maple species - Americanbeech
Time (typically >100 years) with little or no large-scale disturbance will favor shade tolerant, late successionalspecies including sugar maple, red maple and American beech.
Maple species - Americanbeech
White oak - pignut hickory
Establishment of advanced oak regeneration (natural or planted) is critical to recruiting oak back into the overstory.If that is desirable, a combination of natural and managed steps will likely be required to favor oak. Depending onthe residual stand, management recommendations might include timber stand improvement, mechanical orchemical treatment of unwanted species, and prescribed fire.
Consultation with a professional forester is recommended prior to implementation of any management practice,especially the use of prescribed fire. Arthur et al. (2012) discusses conditions when fire should and should not beused in oak management.
Prescribed Burning
Tree/Shrub Site Preparation
Tree/Shrub Establishment
Upland Wildlife Habitat Management
Forest Trails and Landings
Forest Stand Improvement

State 2High-graded Forest State
Community 2.1American beech - Sugar maple/Sourwood - Sassafras
Fuel Break
Forest Management Plan - Written
Forest Management Plan - Applied
Forests in the high graded state have been logged using diameter-limit cut methods multiple times in most cases.This results in a stand with undesirable species composition, low vigor, and poor health. The genetic quality of theforest has been depleted due to the best trees being taken out over time.
While oak and hickory species are often still present in this state, individual trees are often "wolfy" and defective.These are the trees that would have been undesirable from a timber perspective and so left after multiple entries oflogging. Notably, hickory has often been left because sawmills historically did not have the capability to processthem.
Figure 18. High graded forest
Figure 19. Mid-story

Table 8. Ground cover
Table 9. Canopy structure (% cover)
Figure 20. High graded forest in the fall
Canopies in the high graded state are generally thick enough to prevent adequate oak regeneration; more shadetolerant species such as red maple, sugar maple and American beech will predominate. Oak and hickory speciesthat remain are typically of low genetic quality in terms of timber. Stands that have been high graded multiple timesoften show a conspicuous lack of white oak and northern red oak.
Forest overstory. The overstory is dominated by American beech, sugar maple, and red maple. Tuliptree and redand white oak species can be present but individuals are typically not high quality and do not represent the geneticpotential of the stand, nor will they occur in large numbers. Blackgum, sourwood, sassafras, and dogwood can beimportant midstory species in addition to smaller maples and American beech.
Forest understory. The understory can be diverse across stands. Species noted include buckeye (Aesculus spp.),Virginia creeper (Parthenocissus quinquefolia), greenbrier (Smilax glauca, Smilax rotundifolia), grapevine (Vitisspp.), ebony spleenwort (Asplenium platyneuron), little brown jug (Hexastylis ruthii), nakedflower ticktrefoil(Desmodium nudiflorum), fragrant bedstraw (Galium triflorum), Christmas fern (Polystichum acrostichoides), etc.Forest understories will also include large numbers of regenerating tree seedlings, largely representing theoverstory dominants.
Tree foliar cover 10-25%
Shrub/vine/liana foliar cover 0-1%
Grass/grasslike foliar cover 0%
Forb foliar cover 0-1%
Non-vascular plants 0%
Biological crusts 0%
Litter 60-70%
Surface fragments >0.25" and <=3" 0%
Surface fragments >3" 2-5%
Bedrock 0%
Water 0%
Bare ground 0%
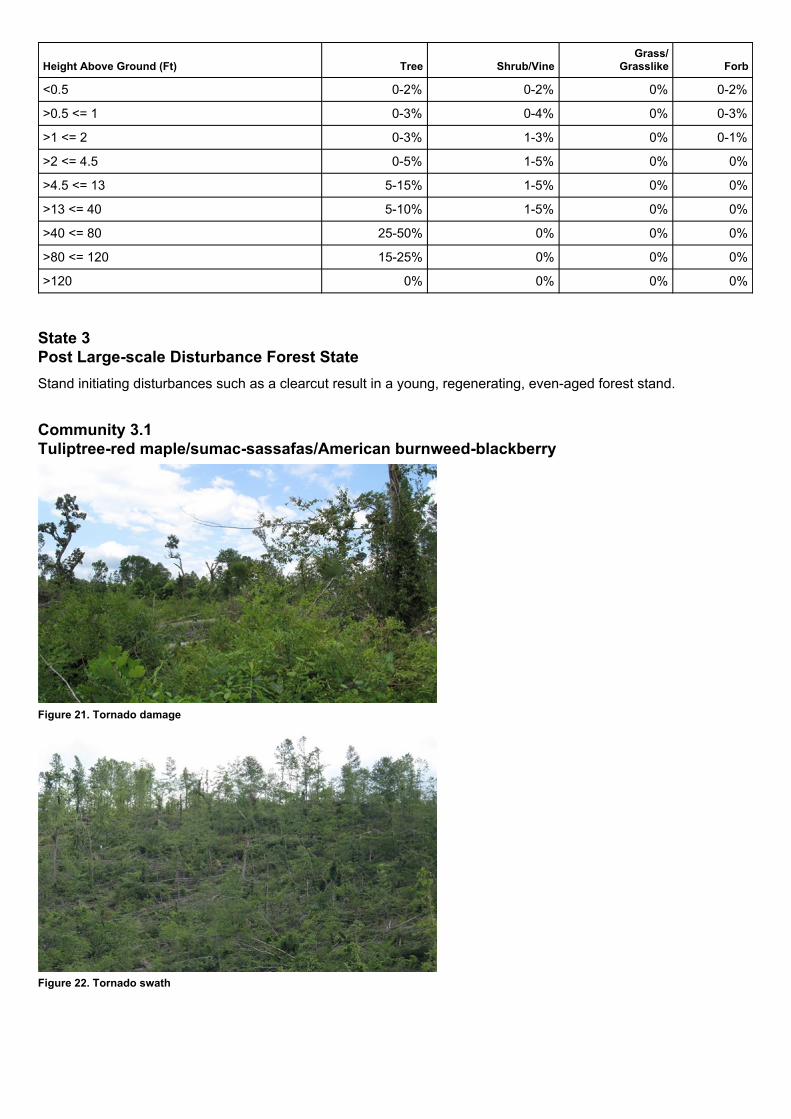
State 3Post Large-scale Disturbance Forest State
Community 3.1Tuliptree-red maple/sumac-sassafas/American burnweed-blackberry
Height Above Ground (Ft) Tree Shrub/VineGrass/
Grasslike Forb
<0.5 0-2% 0-2% 0% 0-2%
>0.5 <= 1 0-3% 0-4% 0% 0-3%
>1 <= 2 0-3% 1-3% 0% 0-1%
>2 <= 4.5 0-5% 1-5% 0% 0%
>4.5 <= 13 5-15% 1-5% 0% 0%
>13 <= 40 5-10% 1-5% 0% 0%
>40 <= 80 25-50% 0% 0% 0%
>80 <= 120 15-25% 0% 0% 0%
>120 0% 0% 0% 0%
Stand initiating disturbances such as a clearcut result in a young, regenerating, even-aged forest stand.
Figure 21. Tornado damage
Figure 22. Tornado swath

Figure 23. Small clearcut (recent)
Figure 24. Tuliptree stump sprout
Figure 25. Litter and downed wood

Table 10. Soil surface cover
Figure 26. American burnweed, 18 months post tornado
Early after a stand-initiating disturbance, dense stands of Erechtites hieraciifolius (American burnweed) canbecome established and are a natural part of succession on this site. Blackberry and sumac also occur early insuccession and will naturally give way to hardwoods over time.
Species composition of canopy trees in young stands varies, but generally includes abundant tuliptree (McGrathand Clatterbuck, 2013). If the maples are not controlled with herbicide in the early stages of stand development,they may also be prevalent in the canopy.
Other woody species include sassafras, redbud, flowering dogwood, white ash, sourwood, black gum, and Carolinabuckthorn, among others. Oak species will generally regenerate by sprouting. White oak can live for long periods asan overtopped tree. It responds to quick release and so can eventually recover its dominant position in the standcanopy. Other advanced-succession species, which will become important in older stands include most of the otherupland oaks, blackgum, red maple, and American beech.
Maple and beech are natural components of upland mixed hardwoods. However, if they are not controlled in theearly stages of stand development, oaks will have difficulty competing in stands that were severely high-graded. Ifnatural regeneration does not produce enough oaks, artificial regeneration (i.e., planting) may be needed.
Forest overstory. Depending on the successional stage and the stand composition prior to disturbance, yellowpoplar will dominate young stands giving way to mixed hardwoods over time. In disturbances where some standingtrees remain, such as a typical tornado swath, they will influence the future composition of the stand.
Forest understory. Dense American burnweed can dominate this site early after a disturbance. Pokeberry, poisonivy, muscadine, sumac species, and blackberry are also important in this very early successional stage. Over time,shrub and tree seedlings and sprouts will become more important, eventually pushing into the overstory andassuming dominance of the site.
Tree basal cover 5-10%
Shrub/vine/liana basal cover 5-15%
Grass/grasslike basal cover 0-1%
Forb basal cover 5-50%
Non-vascular plants 0%
Biological crusts 0%
Litter 5-50%
Surface fragments >0.25" and <=3" 15-25%
Surface fragments >3" 3-5%
Bedrock 0%

Table 11. Woody ground cover
* Decomposition Classes: N - no or little integration with the soil surface; I - partial to nearly full integration with the soil surface.** >10.16cm diameter at 1.3716m above ground and >1.8288m height--if less diameter OR height use applicable down wood type; forpinyon and juniper, use 0.3048m above ground.*** Hard - tree is dead with most or all of bark intact; Soft - most of bark has sloughed off.
State 4Grazed Forest State
Community 4.1White oak-sweetgum/Eastern red cedar/blackberry-broomsedge
Water 0%
Bare ground 1-10%
Downed wood, fine-small (<0.40" diameter; 1-hour fuels) 0-5%
Downed wood, fine-medium (0.40-0.99" diameter; 10-hour fuels) 0-10%
Downed wood, fine-large (1.00-2.99" diameter; 100-hour fuels) 0-10%
Downed wood, coarse-small (3.00-8.99" diameter; 1,000-hour fuels) 0-20%
Downed wood, coarse-large (>9.00" diameter; 10,000-hour fuels) 0-5%
Tree snags** (hard***) –
Tree snags** (soft***) –
Tree snag count** (hard***)
Tree snag count** (hard***)
This state represents a condition resulting from uncontrolled access to a forest by livestock and is not meant toaddress plant community changes as a result of prescribed grazing, which can be quite different.
Figure 27. Grazed forest state

State 5
Figure 28. Eastern red cedar and privet in the mid-story
Figure 29. Broomsedge, greenbriar and blackberry understory
Grazing in forested stands results in a reduction of native ground cover plants (Johnson, 1952). Cattle willselectively graze on the plants they find most palatable. Often they leave little in the understory. Plants they avoidinclude greenbriar, blackberry, broomsedge (Andropogon virginicus), the privets (Ligustrum spp.), Eastern redcedar (Juniperus virginiana), and Christmas fern. Additionally, livestock find seedlings and saplings of the morevaluable timber species (such as the oaks) more palatable and lower quality trees will proliferate as a result (SCS,1992). Eastern red cedar can become invasive in grazed forest stands because cattle do not eat it. Over time, thiscan result in an overstory dominated by the trees that were present prior to grazing, usually including oaks,hickories, sweetgum, black cherry, tuliptree, and American beech (among others) with an Eastern red cedar (andsometimes privet) dominated midstory and very little understory. Over time if cattle are not removed overstory treeswill not regenerate, which will negatively impact the future stand.
Depending on the concentration of animals and frequency of grazing, trampling can expose soil which may result inerosion. Storm runoff may increase (Johnson, 1952). Compaction of the soil surface can damage the fine surfacefeeder tree roots. Invasive exotic plants like Japanese honeysuckle and multiflora rose are known to follow grazingdisturbance into woodlands once grazers are removed. Exotic plants including the privets, honeysuckle, andmultiflora rose are a problem and will persist and expand if not controlled.
Forest overstory. Overstory canopies will consist of whatever tree species were present prior to grazing. Typicallywhite oak, scarlet oak, black oak, tuliptree, American beech, sweetgum, honeylocust, black cherry and hickoryspecies will be present, among others.
Forest understory. Understories in this state are not diverse because most plants (including tree seedlings) arebeing consumed by grazing animals. Depending on the animal (cattle, goats, sheep, etc.), there is selection for thespecies they do not prefer to eat. Blackberry, greenbriar, broomsedge, Christmas fern, Eastern red cedar and privetare typical.

Post Agricultural Abandonment Forest State
Community 5.1Pine spp. - tuliptree/poison ivy
This state results from natural succession to forest after abandonment of agricultural fields. The resulting forest willvary depending on the amount of time the land was in cultivation, the type of agricultural practice that was used(e.g., row crops, pasture, type of crop, etc.), and the degree of impact to the soil.
In Georgia, parts of this state have been converted to loblolly pine (Pinus taeda) plantations, but that acreage is ofrelatively small extent and so it is not included as a community phase.
Figure 30. Young pine stand
Figure 31. Older mixed pine-hardwood stand 1 in Georgia
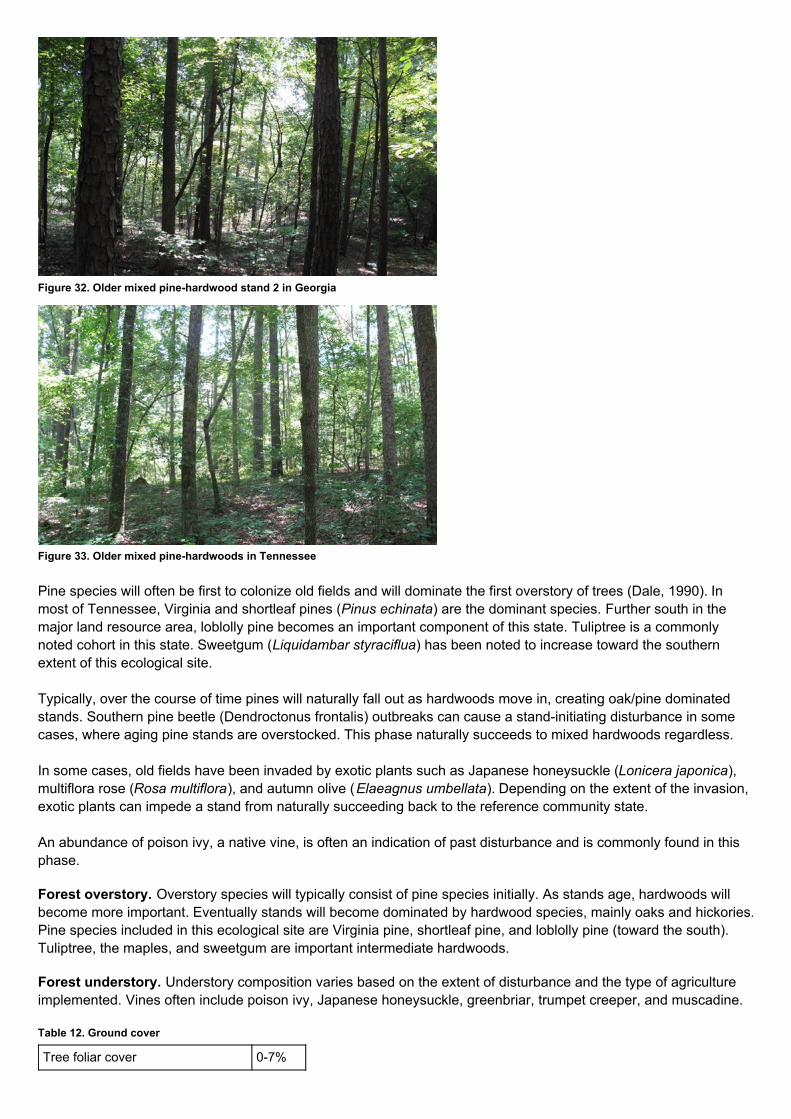
Table 12. Ground cover
Figure 32. Older mixed pine-hardwood stand 2 in Georgia
Figure 33. Older mixed pine-hardwoods in Tennessee
Pine species will often be first to colonize old fields and will dominate the first overstory of trees (Dale, 1990). Inmost of Tennessee, Virginia and shortleaf pines (Pinus echinata) are the dominant species. Further south in themajor land resource area, loblolly pine becomes an important component of this state. Tuliptree is a commonlynoted cohort in this state. Sweetgum (Liquidambar styraciflua) has been noted to increase toward the southernextent of this ecological site.
Typically, over the course of time pines will naturally fall out as hardwoods move in, creating oak/pine dominatedstands. Southern pine beetle (Dendroctonus frontalis) outbreaks can cause a stand-initiating disturbance in somecases, where aging pine stands are overstocked. This phase naturally succeeds to mixed hardwoods regardless.
In some cases, old fields have been invaded by exotic plants such as Japanese honeysuckle (Lonicera japonica),multiflora rose (Rosa multiflora), and autumn olive (Elaeagnus umbellata). Depending on the extent of the invasion,exotic plants can impede a stand from naturally succeeding back to the reference community state.
An abundance of poison ivy, a native vine, is often an indication of past disturbance and is commonly found in thisphase.
Forest overstory. Overstory species will typically consist of pine species initially. As stands age, hardwoods willbecome more important. Eventually stands will become dominated by hardwood species, mainly oaks and hickories.Pine species included in this ecological site are Virginia pine, shortleaf pine, and loblolly pine (toward the south).Tuliptree, the maples, and sweetgum are important intermediate hardwoods.
Forest understory. Understory composition varies based on the extent of disturbance and the type of agricultureimplemented. Vines often include poison ivy, Japanese honeysuckle, greenbriar, trumpet creeper, and muscadine.
Tree foliar cover 0-7%

State 6Cleared Grassland State
Community 6.1Orchardgrass - tall fescue
Shrub/vine/liana foliar cover 0-3%
Grass/grasslike foliar cover 0%
Forb foliar cover 0-1%
Non-vascular plants 0%
Biological crusts 0%
Litter 50-70%
Surface fragments >0.25" and <=3" 0-1%
Surface fragments >3" 0%
Bedrock 0%
Water 0%
Bare ground 0%
This state represents a once-forested area now cleared for pasture. Most pastures are very old and have beenestablished for a long time. Management practices focus primarily on maintaining healthy pasture conditions ratherthan new pasture establishment, although that is certainly an option. Balancing stocking rates, grazing rotation, andnutrient inputs are the primary management concerns.
In general, pasture management recommendations focus on maximizing desirable forage species to outcompeteundesirable or weedy species. Production practices that result in overgrazing and low fertility levels favoremergence, propagation, and growth of weeds (Green et al., 2006). Effective pasture management includes thefollowing practices:
- maintaining proper soil pH and fertility levels
- using controlled grazing practices
- mowing at proper timing and stage of maturity
- allowing new seedlings to become well established before use, and
- renovating pastures when needed (Green et al. 2006).
Tennessee has developed a list of desirable species, intermediate species and undesirable species for use in aPasture Condition Scoresheet, which can be used to develop management recommendations on a site by sitebasis. District Conservationists as well as the State Grazing Specialist can be consulted to assist in developingmanagement recommendations.
Perilla (Perilla frutescens) mint is an exotic, invasive weed that has become a major problem in many pastures. Itcauses more cattle deaths (in Tennessee) than any other toxic plant (Steckel and Rhodes, 2007). Keeping a readysupply of quality feed available for farm animals in the late summer and early fall will help to minimize the risk tolivestock. Cattle will not normally feed on perilla unless there is a shortage of other feed.

Figure 34. Pasture
Figure 35. Pasture landscape

Table 13. Ground cover
Community 6.2Tall fescue - nimblewill
Community 6.3Multiflora rose - blackberry spp.
Pathway 1.1ACommunity 6.1 to 6.2
Pathway 2.2BCommunity 6.2 to 6.1
The dominance of orchardgrass (Dactylis glomerata), red clover (Trifolium pratense), and tall fescue (Schedonorusarundinaceus) in this community phase indicate that nutrient levels are adequate, and grazing rotations are longenough to allow pasture plants to recover. Overstocking and infrequent pasture rotation will allow weedier speciesto invade, such as nimblewill and rush.
Forest overstory. The overstory in the grassland state is minimal and consists of a few trees growing along theparameter of pastures, and scattered shade trees within pastures.
Forest understory. Ideally, pastures in the grassland state would be primarily composed of tall fescue, red clover,and orchardgrass. Numerous other plants could be present in varying numbers depending on the objectives andmanagement approaches of the landowner.
Tree foliar cover 0-2%
Shrub/vine/liana foliar cover 0-2%
Grass/grasslike foliar cover 60-70%
Forb foliar cover 20-30%
Non-vascular plants 0%
Biological crusts 0%
Litter 0-5%
Surface fragments >0.25" and <=3" 0-3%
Surface fragments >3" 0-15%
Bedrock 0%
Water 0%
Bare ground 0-2%
This community phase is transitional to a more degraded phase. While some desirable pasture plants are stillpresent [tall fescue, white clover (Trifolium repens)], undesirable species such as nimblewill (Muhlenbergiaschreberi), rush (Carex spp.), cinquefoil (Potentilla spp.), thistle (Cirsium spp.) and little barley (Hordeum pusillum)will begin to proliferate. Heavy grazing pressure may favor weedy species over grass (Rhodes and Phillips, 2012).Just removing or reducing livestock will not always be enough to restore desirable conditions after a point. Sometype of nutrient improvement may also be needed.
Pastures with a history of overgrazing can be susceptible to invasion by weedy plants, brambles, and small trees ifgrazing pressure is reduced and nothing further is done to improve the site. Indicator plants for this phase includeblackberry, broomsedge, and multi-flora rose. Clipping undesirable plants and adding nutrient input can helppastures in this phase recover. Goats, mowing and herbicide can be useful for clearing unwanted plants.
Overstocked pasture with infrequent rotation.

Pathway 2.2ACommunity 6.2 to 6.3
Pathway 3.3ACommunity 6.3 to 6.2
Transition T1AState 1 to 2
Transition T1BState 1 to 3
Transition T1CState 1 to 4
Transition T1DState 1 to 6
Restoration pathway R2AState 2 to 3
Conservation practices
Rotational grazing with a longer recovery period and higher grazing height; improved fertility.
Overgrazed; low fertility
Clipping pasture with nutrient improvement or controlled grazing.
Selective harvesting and high grading multiple times results in degradation of forest stand quality in terms of alteredspecies composition, forest structure, and genetic fitness. Diameter limit cuts, incorrectly implemented, remove thebiggest and best trees and leave those of lowest quality in terms of both timber and ecology.
Large-scale, stand replacing disturbance (natural or human-caused) such as a catastrophic fire, tornado, ice stormor management practices such as clearcutting will result in the majority of the overstory being removed. Thiseffectively hits the reset button on natural succession and the stand begins to regenerate.
Advanced oak regeneration must be present for oak to be well represented in the next stand. In some cases,competition control will also be necessary.
Uncontrolled access by livestock and subsequent browsing and selective removal of desirable trees can result inloss of hardwood tree species and invasion by invasive, exotic plants. In some cases, soil compaction and erosioncan become a problem.
Forest clearing, herbicide application, and establishment of pasture plants, hay or crops will convert forested standsto a grassland state. Most pastures in this site are old and were converted many years ago.
Stand initiating disturbance such as a silvicultural clearcut, tornado, major ice storm or in rare cases, a really hotwildfire, will effectively push the "reset" button on succession, allowing superior stock to regain dominance in mostcases. Disturbance loving species like the oaks will typically respond well to this. However, where seed banks andseed sources are severely depleted, oaks may need to be planted if they are desirable. Fire has varying effects,depending on the intensity of the fire and stand conditions prior to burning. Typically, pine species would initiallycolonize burned areas before other species.
Early Successional Habitat Development/Management
Forest Stand Improvement

Restoration pathway R3AState 3 to 1
Conservation practices
Restoration pathway R4AState 4 to 1
Conservation practices
Transition T4AState 4 to 6
Restoration pathway R5BState 5 to 1
Transition T5AState 5 to 3
Forest Management Plan - Written
Forest Management Plan - Applied
Favor desirable species such as the oaks by treating sprouts and seedlings or saplings of undesirable species (i.e.,red maple) with herbicide. Multiple herbicide treatments may be merited. Follow-up treatments such as thinning orcrop tree release might be needed, depending on management objectives and stand conditions.
Forest Stand Improvement
Forest Management Plan - Written
Forest Management Plan - Applied
Remove livestock, control weedy species, and conduct site-based forest management over time. In most cases,natural succession will occur if invasive plants, including Eastern red cedar, are controlled. Tree planting withdesirable species may often be merited. In most cases, time and natural processes will heal any soil compactioncaused by grazing.
Fence
Tree/Shrub Site Preparation
Tree/Shrub Establishment
Forest Stand Improvement
Invasive Plant Species Control
Forest Management Plan - Written
Forest Management Plan - Applied
Mechanical vegetation control and herbicide application will likely be needed to keep exotic plant species frombecoming problematic in newly established pastures. Seeding with desirable species and fertilizing will benecessary to establish pasture conditions. Rotational grazing can be used as a management tool to achieve goals.
Allowing natural succession to take place over time will most often result in a mixture of oak and pine, which willeventually turn into an oak/hickory mixed stand. In some cases, exotic plant control (mechanical, chemical, etc.)may be merited. Where necessary, oak planting or planting some other desirable species could be beneficial. Ifplanting is done, control of competition through several mechanical and chemical treatments may be necessary forthe best results.

Restoration pathway R5AState 5 to 6
Transition T6AState 6 to 5
When pine naturally colonizes abandoned agricultural land, the result can be establishment of overstocked pinestands (~40 years). These stands are attractive to southern pine beetle, which has naturally occurring outbreaks inthe Southeast periodically. Pine beetle kills result in loss of pine in the overstory (Dale 1990) and can be standreplacing in some cases.
Land clearing, seeding, fertilizing, and prescribed grazing on a site by site basis will help push the phase back topasture. Control of invasive exotic plant species and poison ivy may be merited. Control methods typically includeherbicide application and mechanical control, such as mowing.
Abandonment
Additional community tablesTable 14. Community 1.1 forest overstory composition
Table 15. Community 1.1 forest understory composition
Common Name Symbol Scientific Name NativityHeight
(Ft)Canopy Cover
(%)Diameter
(In)Basal Area (Square
Ft/Acre)
Tree
pignut hickory CAGL8 Carya glabra Native 30–65 5–50 4.2–20 –
white oak QUAL Quercus alba Native 50–100 1–50 7–32.1 –
tuliptree LITU Liriodendron tulipifera Native 50–85 1–40 9.6–22.5 –
northern redoak
QURU Quercus rubra Native 50–100 5–25 21–27 –
sugar maple ACSA3 Acer saccharum Native 20–60 10–25 3.4–25 –
black oak QUVE Quercus velutina Native 50–105 1–20 9.8–25 –
Americanbeech
FAGR Fagus grandifolia Native 40–80 6–20 6.5–23.4 –
sourwood OXAR Oxydendrumarboreum
Native 20–40 5–20 4.3–9.5 –
red maple ACRU Acer rubrum Native 20–50 1–10 2–25 –
blackgum NYSY Nyssa sylvatica Native 20–45 1–5 2.6–13.2 –
sassafras SAAL5 Sassafras albidum Native 5–20 0–2 3.8–4.2 –
easternredcedar
JUVI Juniperus virginiana Native 5–20 0–1 0–2.9 –
Common Name Symbol Scientific Name NativityHeight
(Ft)Canopy Cover
(%)
Grass/grass-like (Graminoids)
panicgrass PANIC Panicum Native 0–0.5 0–1
Forb/Herb
littlebrownjug HEAR6 Hexastylis arifolia Native 0–0.5 1–5
mayapple POPE Podophyllum peltatum Native 0–1 1–5
feathery false lily of thevalley
MARAR Maianthemum racemosum ssp.racemosum
Native 0–1 1–2
sweetroot OSMOR Osmorhiza Native 0–1 0–1

mountain woodsorrel OXMO Oxalis montana Native 0–0.3 0–1
cankerweed PRSE Prenanthes serpentaria Native 1–2 0–1
trillium TRILL Trillium Native 0–0.5 0–1
bellwort UVULA Uvularia Native 0–0.5 0–1
Jack in the pulpit ARTR Arisaema triphyllum Native 0–0.5 0–1
ticktrefoil DESMO Desmodium Native 0–0.5 0–1
trailing arbutus EPRE2 Epigaea repens Native 0–0.1 0–1
licorice bedstraw GACI2 Galium circaezans Native 0–0.5 0–1
violet VIOLA Viola Native 0–0.5 0–1
black bugbane ACRAR Actaea racemosa var. racemosa Native 0–1 0–1
Fern/fern ally
Christmas fern POAC4 Polystichum acrostichoides Native 0–2 1–3
Shrub/Subshrub
paper mulberry BRPA4 Broussonetia papyrifera Introduced 1–13 0–1
farkleberry VAAR Vaccinium arboreum Native 2–4.5 0–1
farkleberry VAAR Vaccinium arboreum Native 4.5–13 0–1
farkleberry VAAR Vaccinium arboreum Native 0.5–1 0–1
farkleberry VAAR Vaccinium arboreum Native 1–2 0–1
red buckeye AEPA Aesculus pavia Native 1–4 0–1
Chinese privet LISI Ligustrum sinense Introduced 0–0.5 0–1
Tree
red maple ACRU Acer rubrum Native 0–0.5 1–10
eastern redbud CECA4 Cercis canadensis Native 0–0.5 1–5
eastern redbud CECA4 Cercis canadensis Native 4.5–13 1–5
sugar maple ACSA3 Acer saccharum Native 1–2 1–5
sugar maple ACSA3 Acer saccharum Native 2–4.5 1–5
sugar maple ACSA3 Acer saccharum Native 4.5–13 1–5
red maple ACRU Acer rubrum Native 4.5–13 1–4
American beech FAGR Fagus grandifolia Native 2–4 2–4
black oak QUVE Quercus velutina Native 1–2 2–4
pignut hickory CAGL8 Carya glabra Native 0–0.5 1–3
pignut hickory CAGL8 Carya glabra Native 4.5–13 1–3
sugar maple ACSA3 Acer saccharum Native 0–0.5 1–3
sugar maple ACSA3 Acer saccharum Native 0.5–1 1–2
sourwood OXAR Oxydendrum arboreum Native 0–0.5 0–2
white ash FRAM2 Fraxinus americana Native 0.5–1 1–2
pignut hickory CAGL8 Carya glabra Native 1–2 0–2
blackgum NYSY Nyssa sylvatica Native 4.5–13 1–2
American beech FAGR Fagus grandifolia Native 0.5–1 1–2
American beech FAGR Fagus grandifolia Native 4.5–13 1–2
black oak QUVE Quercus velutina Native 0–0.5 0–1
black oak QUVE Quercus velutina Native 0.5–1 0–1
elm ULMUS Ulmus Native 5–13 0–1
common hackberry CEOC Celtis occidentalis – 0.5–1 0–1

common hackberry CEOC Celtis occidentalis – 0.5–1 0–1
pawpaw ASTR Asimina triloba Native 5–13 0–1
white oak QUAL Quercus alba Native 0–0.5 0–1
black cherry PRSE2 Prunus serotina Native 0–0.5 0–1
American beech FAGR Fagus grandifolia Native 1–2 0–1
pignut hickory CAGL8 Carya glabra Native 2–4.5 0–1
blackgum NYSY Nyssa sylvatica Native 0–0.5 0–1
red maple ACRU Acer rubrum Native 0.5–1 0–1
red maple ACRU Acer rubrum Native 1–2 0–1
red maple ACRU Acer rubrum Native 2–4.5 0–1
sourwood OXAR Oxydendrum arboreum Native 0.5–1 0–1
sourwood OXAR Oxydendrum arboreum Native 2–4.5 0–1
sourwood OXAR Oxydendrum arboreum Native 4.5–13 0–1
sassafras SAAL5 Sassafras albidum Native 0–0.5 0–1
sassafras SAAL5 Sassafras albidum Native 0.5–1 0–1
sassafras SAAL5 Sassafras albidum Native 1–2 0–1
sassafras SAAL5 Sassafras albidum Native 2–4.5 0–1
sweetgum LIST2 Liquidambar styraciflua Native 0–0.5 0–1
sweetgum LIST2 Liquidambar styraciflua Native 1–2 0–1
sweetgum LIST2 Liquidambar styraciflua Native 2–4.5 0–1
white ash FRAM2 Fraxinus americana Native 0–0.5 0–1
white ash FRAM2 Fraxinus americana Native 1–2 0–1
white ash FRAM2 Fraxinus americana Native 2–4.5 0–1
tuliptree LITU Liriodendron tulipifera Native 0–0.5 0–1
tuliptree LITU Liriodendron tulipifera Native 0.5–1 0–1
tuliptree LITU Liriodendron tulipifera Native 1–2 0–1
yellow buckeye AEFL Aesculus flava Native 2–4.5 0–1
flowering dogwood COFL2 Cornus florida Native 0–0.5 0–1
flowering dogwood COFL2 Cornus florida Native 0.5–1 0–1
flowering dogwood COFL2 Cornus florida Native 1–2 0–1
flowering dogwood COFL2 Cornus florida Native 2–4.5 0–1
northern red oak QURU Quercus rubra Native 0–0.5 0–1
Carolina buckthorn FRCA13 Frangula caroliniana Native 4.5–13 0–1
slippery elm ULRU Ulmus rubra Native 0.5–2 0–1
Vine/Liana
muscadine VIRO3 Vitis rotundifolia Native 0–2 1–5
Virginia creeper PAQU2 Parthenocissus quinquefolia Native 0–13 1–3
greenbrier SMILA2 Smilax Native 0–5 1–2
Japanese honeysuckle LOJA Lonicera japonica Introduced 0–1 0.5–2
crossvine BICA Bignonia capreolata Native 0–5 1–2
Oriental bittersweet CEOR7 Celastrus orbiculatus Introduced 0–1 0–1
winter creeper EUFO5 Euonymus fortunei Introduced 0–1 0–1
eastern poison ivy TORA2 Toxicodendron radicans Native 0–13 0–1
Nonvascular
American cancer-root COAM Conopholis americana Native 0–0.5 1–5

Table 16. Community 2.1 forest overstory composition
Table 17. Community 3.1 forest overstory composition
Table 18. Community 3.1 forest understory composition
Table 19. Community 5.1 forest overstory composition
American cancer-root COAM Conopholis americana Native 0–0.5 1–5
Common Name Symbol Scientific Name NativityHeight
(Ft)Canopy Cover
(%)Diameter
(In)Basal Area (Square
Ft/Acre)
Tree
tuliptree LITU Liriodendron tulipifera Native 50–80 – 10–15 –
American beech FAGR Fagus grandifolia Native 35–90 – 25–35 –
sugar maple ACSA3 Acer saccharum Native 20–30 – 2–5 –
American beech FAGR Fagus grandifolia Native 15–30 – 5–10 –
floweringdogwood
COFL2 Cornus florida Native 15–20 – 2–3 –
sourwood OXAR Oxydendrumarboreum
Native 15–20 – 2–5 –
Common Name Symbol Scientific Name NativityHeight
(Ft)Canopy Cover
(%)Diameter
(In)Basal Area (Square
Ft/Acre)
Tree
white oak QUAL Quercus alba Native – – 2–5 –
tuliptree LITU Liriodendrontulipifera
Native – – – –
pignut hickory CAGL8 Carya glabra Native – – 2–5 –
floweringdogwood
COFL2 Cornus florida Native – – 2 –
Common Name Symbol Scientific Name Nativity Height (Ft) Canopy Cover (%)
Forb/Herb
American pokeweed PHAM4 Phytolacca americana Native – –
common mullein VETH Verbascum thapsus Introduced – –
Shrub/Subshrub
blackberry RUBUS Rubus Native – –
winged sumac RHCO Rhus copallinum Native – –
sumac RHUS Rhus Native – –
Tree
black cherry PRSE2 Prunus serotina Native – –
sassafras SAAL5 Sassafras albidum Native – –
white ash FRAM2 Fraxinus americana Native – –
Carolina buckthorn FRCA13 Frangula caroliniana Native – –
black oak QUVE Quercus velutina Native – –
Vine/Liana
Virginia creeper PAQU2 Parthenocissus quinquefolia Native – –
eastern poison ivy TORA2 Toxicodendron radicans Native – –
muscadine VIRO3 Vitis rotundifolia Native – –

Table 20. Community 5.1 forest understory composition
Table 21. Community 6.1 forest overstory composition
Common Name Symbol Scientific Name NativityHeight
(Ft)Canopy
Cover (%)Diameter
(In)Basal Area (Square
Ft/Acre)
Tree
loblolly pine PITA Pinus taeda Native 70–80 – 8–15 –
southern red oak QUFA Quercus falcata Native 60–80 – 13–20 –
northern red oak QURU Quercus rubra Native – – – –
red maple ACRU Acer rubrum Native – – 2–5 –
tuliptree LITU Liriodendron tulipifera Native – – – –
flowering dogwood COFL2 Cornus florida Native – – 4 –
Virginia pine PIVI2 Pinus virginiana Native – – – –
shortleaf pine PIEC2 Pinus echinata Native – – – –
black oak QUVE Quercus velutina Native – – – –
sweetgum LIST2 Liquidambar styraciflua Native – – – –
southern shagbarkhickory
CACA38 Carya carolinae-septentrionalis
Native – – – –
Common Name Symbol Scientific Name Nativity Height (Ft) Canopy Cover (%)
Tree
sourwood OXAR Oxydendrum arboreum Native – –
red maple ACRU Acer rubrum Native – –
northern red oak QURU Quercus rubra Native – –
pignut hickory CAGL8 Carya glabra Native – –
serviceberry AMELA Amelanchier Native – –
Tree Fern
cat greenbrier SMGL Smilax glauca Native – –
Vine/Liana
trumpet creeper CARA2 Campsis radicans Native – –
muscadine VIRO3 Vitis rotundifolia Native – –

Table 22. Community 6.1 forest understory composition
Common Name Symbol Scientific Name NativityHeight
(Ft)Canopy Cover
(%)Diameter
(In)Basal Area (Square
Ft/Acre)
Tree
blackgum NYSY Nyssa sylvatica Native – – – –
tuliptree LITU Liriodendrontulipifera
Native – – – –
post oak QUST Quercus stellata Native – – – –
sugar maple ACSA3 Acer saccharum Native – – – –
eastern redcedar JUVI Juniperus virginiana Native – – – –
southern red oak QUFA Quercus falcata Native – – – –
pignut hickory CAGL8 Carya glabra Native – – – –
shagbark hickory CAOV2 Carya ovata Native – – – –
commonpersimmon
DIVI5 Diospyrosvirginiana
Native – – – –
sassafras SAAL5 Sassafras albidum Native – – – –
Virginia pine PIVI2 Pinus virginiana Native – – – –

Common Name Symbol Scientific Name Nativity Height (Ft) Canopy Cover (%)
Grass/grass-like (Graminoids)
tall fescue SCAR7 Schedonorus arundinaceus Introduced – –
creeping bentgrass AGST2 Agrostis stolonifera Introduced – –
orchardgrass DAGL Dactylis glomerata Introduced – –
sedge CAREX Carex Unknown – –
rush JUNCU Juncus Unknown – –
field brome BRAR5 Bromus arvensis Introduced – –
panicgrass PANIC Panicum Unknown – –
broomsedge bluestem ANVI2 Andropogon virginicus Native – –
Kentucky bluegrass POPR Poa pratensis Introduced – –
Nepalese browntop MIVI Microstegium vimineum Introduced – –
Forb/Herb
red clover TRPR2 Trifolium pratense Introduced – –
suckling clover TRDU2 Trifolium dubium Introduced – –
white clover TRRE3 Trifolium repens Introduced – –
blue-eyed grass SISYR Sisyrinchium Native – –
lyreleaf sage SALY2 Salvia lyrata Native – –
wingstem VEAL Verbesina alternifolia Native – –
Queen Anne's lace DACA6 Daucus carota Introduced – –
Virginia strawberry FRVI Fragaria virginiana Native – –
cinquefoil POTEN Potentilla Unknown – –
Shrub/Subshrub
blackberry RUBUS Rubus Native – –
Vine/Liana
winter vetch VIVI Vicia villosa Introduced – –
cat greenbrier SMGL Smilax glauca Native – –
Japanese honeysuckle LOJA Lonicera japonica Introduced – –
eastern poison ivy TORA2 Toxicodendron radicans Native – –
Animal communityThe oak-hickory forests that represent the reference state provide important mast production for a variety of wildlifespecies. Acorns in particular are an extremely important food source for birds and mammals during the dormantseason (McShea et al., 2006). Ninety-six species of birds and mammals are known to consume acorns, especiallyin fall and winter (Martin, 1961). Acorns produced from white oak tree species (white oak, chestnut oak, etc.) aretypically more palatable than acorns from the red oak group, although red oak acorns are still an important foodsource, particularly in the winter season when acorns from white oak species have already been consumed.Examples of animals that consume acorns within this ecological site include insects such as the acorn weevil, birds(e.g. wild turkeys, northern bobwhite quail, woodpeckers, blue jays, crows), small mammals (e.g., chipmunks, foxsquirrels, flying squirrels, rabbits, mice, voles, raccoons and opossums), and large mammals (e.g., white-taileddeer, red and gray foxes, black bear), (Dickson, 2004). Prior to its extinction, the passenger pigeon would havebeen an important consumer and distributor of acorns as well (Frelich and Reich, 2002).
Oak is considered a foundation species for wildlife in the eastern forest (McShea et al., 2006). However, oakspecies have considerable variability in acorn production (crop size from year to year), which can substantiallyaffect the availability of mast for wildlife. Providing variety in hard and soft mast producing species can help toensure that food is available from season to season and from year to year. Hickory nuts can also be important mast

Hydrological functions
Recreational uses
for wildlife. In fact, hickory makes up 10 to 20 percent of squirrel diets in similar systems (Apsley and Gehrt, 2006).
From a habitat perspective, oak-hickory forests are extremely important. For example, numerous birds depend ondifferent stages of these forest systems to survive. The Appalachian region, the location of this ecological site, isthe center of the summer breeding range of neotropical migratory birds. Neotropical migrants include forest-interior,forest-edge, and early-successional species and comprise 65 to 85 percent of breeding birds (Smith, 1995). TheIndiana bat is the primary threatened and endangered bat species. Shaggy bark (e.g., shagbark hickory) and scalybark (white oak) species provide excellent roosting sites for this species. The Northern long eared bat is not listedyet, but is expected to be and would also use associated trees as roosting sites.
Young (1 to 10 year post-disturbance) upland oak forests function as high-quality food patches for myriad wildlifespecies. Fruit producing early successional plants such as pokeweed and blackberry, young shrubs, and treesprouts play an important role in the diets of several bird species, arthropods, and small mammals that serve asprey for numerous snake, bird, and mammal predators (Greenberg, et al. 2011). Mature stands serve as habitat forwild turkey in fall and winter where they utilize acorns as an important part of their diet. Additionally, most forest-dwelling amphibians, reptiles, birds, and mammals required at least a sawtimber stage of maturity in similar forestsystems in New England (Healy, 2002).
Snags, cavity trees, and downed logs provide habitat for a wide variety of wildlife species; as such, they areimportant components of oak-hickory forests on this ecological site. Snags are standing dead or dying trees, anddowned logs are simply logs that are on or near the forest floor. Cavity trees are live trees with holes big enough toshelter animals. This includes trees with cavities in the limbs, which can actually be more important to some wildlifespecies than larger hollow trees. Snags are created by lightning, storm breakage, fire, disease, insects, drought,flooding, cultural practices, among other factors that contribute to tree mortality.
Wildlife species are affected by ecological dynamics in upland oak forests to varying degrees. Management mustconsider all factors that could impact wildlife populations and be site-based in application. A balance of successionalstages in sustainable proportions across the landscape (multiple forest age classes) with consideration for snagsand cavity trees will sustain high quality food patches and habitat for wildlife overall.
Soils in forests have well developed structure, which is maintained by many factors of the forest environment. Thesurface of the soil is protected from raindrop impact by the forest canopy and the surface organic layers (Carmean,1957), infiltration is generally good and runoff is low.
Long-term research on mixed hardwood forests in this region indicates that there is little long-term effect ofclearcutting and other logging practices on hydrologic and water quality sustainability, especially at smaller scales(Swank et al., 2001). Harvesting increases annual water yield typically only during the first 4 to 5 years after cutting.However, harvesting practices vary and have an impact on the severity of impact to hydrologic function. Forexample, clear-cut size, logging techniques, and the density and condition of logging roads can all create moresurface soil disturbance which results in more runoff. Following best management practices (BMPs) is a good wayto avoid the negative impacts of logging to soil and water resources both in the short and long term.
Unlike the short-term effect of most forestry practices, conversion of forest land to pasture or lawn (urban use) canresult in higher bulk densities and lower infiltration rates and water holding capacities in soils, which can beattributed to higher compaction associated with land management practices (Price et al., 2010). This leads toincreased runoff and can negatively influence water quality. Good pasture management can reduce negative effectsto some extent and should always be employed to protect soil and water quality wherever possible.
Most of the Thermic Cherty Dolomite Uplands is under private ownership so public recreation opportunities arelimited. However, some of the western part of the Conasauga Ranger District (Chattahoochee-Oconee NationalForest) falls within this ecological site. The opportunities there include bicycling, camping and cabins, hiking, horseriding, nature viewing, off-highway vehicle riding, picnicking, and scenic driving.

Wood products
Table 23. Representative site productivity
Similar opportunities can be found on smaller parcels of land owned by the Tennessee Valley Authority. Several oftheir Small Wild Areas (SWAs) on this ecological site have hiking trails and scenic overlooks. The University ofTennessee Forest Resources AgResearch and Education Center almost entirely falls within this ecological site.There are numerous hiking trails, an Arboretum and outdoor classroom and educational nature trails available to thepublic, among other opportunities.
This ecological site is dominated by forests in varying stages of succession. Most forestland is held by small, privatelandowners. Only a small extent of this ecological site occurs on public land. Important wood products includehardwood sawlogs (red oak, white oak, ash, tuliptree, walnut, cherry, sugar maple, and hickory), crosstie logs,hickory handle logs, white oak stave logs, hardwood pulpwood, softwood logs and veneer logs (Tennessee ForestProducts Bulletin, 2013).
CommonName Symbol
Site IndexLow
Site IndexHigh
CMAILow
CMAIHigh
Age OfCMAI
Site Index CurveCode
Site Index CurveBasis Citation
white oak QUAL 65 75 0 0 – 810 –
tuliptree LITU 70 85 0 0 – 355 –
Inventory data references
Other references
30 tier 1-2 plots; 1 pasture plot (NRI); 7 tier 3 reference plots; 10 site index plots.
Alexander, Heather D. and M.A. Arthur. 2010. Implications of a predicted shift from upland oaks to red maple onforest hydrology and nutrient availability. Canadian Journal of Forest Research 40: 716-726.
Apsley, David and S. Gehert. 2006. Enhancing food (mast) production for woodland wildlife in Ohio. Extension FactSheet F-60-06, Ohio State University Extension, School of Natural Resources, Columbus, OH.
Arthur, Mary A., H.D. Alexander, D.C. Dey, C.J. Schweitzer, and D.L. Loftis. 2012. Refining the oak-fire hypothesisfor management of oak-dominated forests of the eastern United States. Journal of Forestry 110: 257-266.
Braun, E. Lucy. 1947. Development of the Deciduous Forests of Eastern North America. Ecological Monographs17(2): 211 - 219.
Brose, Patrick H., D.C. Dey, R.J. Phillips, and T.A. Waldrop. 2013. A meta-analysis of the fire-oak hypothesis: Doesprescribed burning promote oak reproduction in eastern North America? Forest Science 59(3): 322 – 334.
Buol, Stan W., F.D. Hole, R.J. McCracken, R.J. Southard. 1997. Soil Genesis and Classification (4th ed.). Ames,Iowa: Iowa State University Press. Pp. 353 - 359.
Carmean, Willard H. 1957. The structure of forest soils. The Ohio Journal of Science 57(3): 165-168.
Case, Earl C. 1925. The valley of east Tennessee: The adjustment of industry to natural environment. Bulletin 36.Division of Geology, Nashville, Tennessee.
Chapman, Jefferson, P.A. Delcourt, P.A. Cridlebaugh, A.B. Shea, and H.R. Delcourt. 1982. Man-land interaction:10,000 years of American Indian impact on native ecosystems in the lower little Tennessee River valley, easternTennessee. Southeastern Archaeology 1: 115–121.
Clark, Stacy L. and C.J. Schweitzer. 2013. Red maple (Acer rubrum) response to prescribed burning on the WilliamB. Bankhead National Forest, Alabama. In: Guldin, James M., ed. 2013. Proceedings of the 15th biennial southernsilvicultural research conference. e-Gen. Tech. Rep. SRS-GTR-175. Asheville, NC: U.S. Department of Agriculture,Forest Service, Southern Research Station. 271-276.

Condley, Brandon C. 1984. The ridge top chestnut oak forest community of the Ridge and Valley PhysiographicProvince and adjacent areas. M.S. Thesis. The University of Tennessee, Knoxville.
Dale, Virginia H., L.K. Mann, R.J. Olson, D.W. Johnson, and K.C. Dearstone. 1990. The long-term influence of pastland use on the Walker Branch forest. Landscape Ecology 4(4): 211-224.
Delcourt, Paul. A. and H.R. Delcourt. 1998. The influence of prehistoric human-set fires on oak-chestnut forests inthe southern Appalachians. Castanea 63: 337–345.
DeSelm, Hal. R. 1984. Potential national natural landmarks of the Appalachian ranges natural region: Ecologicalreport. University of Tennessee, Knoxville.
Dickson, James G. Wildlife and upland oak forests. In: Spetich, Martin A., ed. 2004. Upland oak ecologysymposium: history, current conditions, and sustainability. Gen. Tech. Rep. SRS-73. Asheville, NC: U.S.Department of Agriculture, Forest Service, Southern Research Station. 311 p.
Evans, Richard M. 1992. Soil and water conservation plan for: The University of Tennessee Forestry ExperimentStation.
Green, Jonathan D., W.W. Witt, and J.R. Martin. 2006. Weed management in grass pastures, hayfields, and otherfarmstead sites. University of Kentucky Cooperative Extension Service publication AGR-172.
Greenberg, Catherine H., R.W. Perry, C.A. Harper, D.J. Levey, J.M. McCord. 2011. The role of recently disturbedupland hardwood forest as high quality food patches. In: Sustaining Young Forest Communities: Ecology andmanagement of early successional habitats in the Central Hardwood Region, USA. Managing Forest Ecosystems.pp. 121–141.
Hart, Justin L., S.L. van de Gevel, and H.D. Grissino-Mayer. 2008. Forest dynamics in a natural area of thesouthern Ridge and Valley, Tennessee. Natural Areas Journal 28: 275–289.
Hart, Justin L. and J.A. Kupfer. 2011. Sapling richness and composition in canopy gaps of a southern Appalachianmixed Quercus forest. Journal of the Torrey Botanical Society 138(2): 207-219.
Hart, Justin L., S.L. Clark, S.J. Torreano, and M.L. Buchanan. 2012. Composition, structure, and dendroecology ofan old-growth Quercus forest on the tablelands of the Cumberland Plateau, USA. Forest Ecology and Management266: 11-24.
Hart, Justin L., M.L. Buchanan, S.L. Clark., and S.J. Torreano. 2012. Canopy accession strategies and climate-growth relationships in Acer rubrum. Forest Ecology and Management 282: 124-132.
Johnson, E.A. 1952. Effect of farm woodland grazing on watershed values in the southern Appalachian Mountains.Journal of Forestry 50(2): 109 – 113.
Keever, C. 1953. Present composition of some stands of the former oak-chestnut forest in the southern Blue RidgeMountains. Ecology. 34: 44-54.
Loftis, David L. 2004. Upland oak regeneration and management. In: Proceedings of the Upland oak ecologysymposium. USDA Forest Service, Gen. Tech. Rep. SRS-73, Southern Research Station, Asheville, NC. pp 163 -167.
Lorimer, Craig G. 2001. Historical and ecological roles of disturbance in Eastern North American forests: 9,000years of change. Wildlife Society Bulletin 29: 425–439.
Martin, Alexander C., H.C. Zim, and A.L. Nelson. 1961. American wildlife and plants: A guide to wildlife food habits.Dover, New York, New York, USA.
Martin, William H. 1971. Forest communities of the dissected uplands in the Great Valley of east Tennessee and

their relationship to soil and topographic properties. PhD Dissertation. The University of Tennessee, Knoxville.
Martin, William H. 1989. Forest patterns in the Great Valley of Tennessee. Journal of the Tennessee Academy ofScience 64(3): 137 – 143.
McEwan, Ryan W., J.M. Dyer, and N. Pederson. 2011. Multiple interacting ecosystem drivers: Toward anencompassing hypothesis of oak forest dynamics across eastern North America. Ecography 34: 244-256.
McGrath, J.C., and W. K. Clatterbuck. 2013. Assessing anthropogenic and natural disturbances: Vegetationalresponse to similarly aged clearcut and tornado disturbances in an East Tennessee oak-hickory forest. In:Proceedings of 15th Biennial Southern Silvicultural Research Conference, Hot Springs, AR, November 18-20, 2009.e-Gen. Tech. Rep. SRS-175. Asheville, NC: USDA Forest Service, Southern Research Station. pp. 81-90.
McShea, William J., W.M. Healy, P. Devers, T. Fearer, F.H. Koch, D. Stauffer, and J. Waldon. 2007. Forestrymatters: Decline of oaks will impact wildlife in hardwood forests. Journal of Wildlife Management 71(5): 1717-1728.
Nelson, Thomas C. 1955. Chestnut replacement in the southern highlands. Ecology 36(2): 352-353.
Nowacki, Gregory J. and M.D. Abrams. 2008. The demise of fire and ‘‘mesophication’’ of forests in the easternUnited States. BioScience 58: 123–138.
Olson, David F. , Jr. 1959. Site index curves for upland oak in the southeast. USDA, Forest Service. SoutheasternForest Experiment Station Research Note 125.
Price, Katie, C.R. Jackson, and A.J. Parker. 2010. Variation of surficial soil hydraulic properties across land uses inthe southern Blue Ridge Mountains, North Carolina, USA. Journal of Hydrology 383: 256-268.
Rhodes, G. Neil Jr., and W.P. Phillips Jr. 2012. PB1801 Weed Management in Pastures and Hay Crops,http://trace.tennessee.edu/utk_agexcrop/157.
Schlaegel, Bryce E., D.L. Kulow, and R.N. Baughman. 1969. Empirical yield tables for West Virginia yellow poplar.West Virginia University Agriculture Experiment Station Bulletin 574T.
Smith, David W. 1968. Vegetational changes in a five county area of east Tennessee during secondary succession.M.S. Thesis. The University of Tennessee, Knoxville.
Smith, David W. 1995. The southern Appalachian hardwood region. Regional Silviculture of the United States. JohnWiley & Sons, Inc. New York, NY, 643, 173-225.
Steckel, Larry and N. Rhodes. 2007. Perilla mint. University of Tennessee Extension Service publication W135.
Stephenson, Steven L., H.S. Adams, and M.L. Lipford. 1991. The present distribution of American chestnut in theupland forest communities of Virginia. Bulletin of the Torrey Botanical Club 118:24-32.
Swank, Wayne T., J.M. Vose, and K.J. Elliott. 2001. Long-term hydrologic and water quality responses followingcommercial clearcutting of mixed hardwoods on a southern Appalachian catchment. Forest Ecology andManagement 143: 163 - 178.
Tennessee Forest Products Bulletin. July - September, 2013. Volume 39(3).
Thor, Eyvind and D.D. Summers. 1971. Changes in forest composition on Big Ridge Natural Study Area, UnionCounty, Tennessee. Castanea 36: 114-122.
Thornthwaite, Charles W. 1948. An approach toward a rational classification of climate. Geographical Review 38(1):55-94.
United States Department of Agriculture, Soil Conservation Service. 1992. Hardwood forest grazing. Woodland FactSheet No. 7. Columbia, Missouri.

Contributors
Williams, Samuel C. 1928. Early travels in the Tennessee country, 1540-1800: With introductions, annotations andindex. The Watauga Press, Johnson City, Tennessee.
Belinda Esham
Rangeland health reference sheet
Indicators
1. Number and extent of rills:
2. Presence of water flow patterns:
3. Number and height of erosional pedestals or terracettes:
4. Bare ground from Ecological Site Description or other studies (rock, litter, lichen, moss, plant canopy are notbare ground):
5. Number of gullies and erosion associated with gullies:
6. Extent of wind scoured, blowouts and/or depositional areas:
7. Amount of litter movement (describe size and distance expected to travel):
8. Soil surface (top few mm) resistance to erosion (stability values are averages - most sites will show a range ofvalues):
Interpreting Indicators of Rangeland Health is a qualitative assessment protocol used to determine ecosystemcondition based on benchmark characteristics described in the Reference Sheet. A suite of 17 (or more) indicatorsare typically considered in an assessment. The ecological site(s) representative of an assessment location must beknown prior to applying the protocol and must be verified based on soils and climate. Current plant communitycannot be used to identify the ecological site.
Author(s)/participant(s)
Contact for lead author
Date
Approved by
Approval date
Composition (Indicators 10 and 12) based on Annual Production

9. Soil surface structure and SOM content (include type of structure and A-horizon color and thickness):
10. Effect of community phase composition (relative proportion of different functional groups) and spatialdistribution on infiltration and runoff:
11. Presence and thickness of compaction layer (usually none; describe soil profile features which may bemistaken for compaction on this site):
12. Functional/Structural Groups (list in order of descending dominance by above-ground annual-production or livefoliar cover using symbols: >>, >, = to indicate much greater than, greater than, and equal to):
Dominant:
Sub-dominant:
Other:
Additional:
13. Amount of plant mortality and decadence (include which functional groups are expected to show mortality ordecadence):
14. Average percent litter cover (%) and depth ( in):
15. Expected annual annual-production (this is TOTAL above-ground annual-production, not just forage annual-production):
16. Potential invasive (including noxious) species (native and non-native). List species which BOTH characterizedegraded states and have the potential to become a dominant or co-dominant species on the ecological site iftheir future establishment and growth is not actively controlled by management interventions. Species thatbecome dominant for only one to several years (e.g., short-term response to drought or wildfire) are notinvasive plants. Note that unlike other indicators, we are describing what is NOT expected in the reference statefor the ecological site:
17. Perennial plant reproductive capability: