econ 216 economy of ghana ii - wordpress.com · income. for instance, poverty is measured on a...
TRANSCRIPT

College of Education
School of Continuing and Distance Education2014/2015 – 2016/2017
ECON 216
Economy of Ghana II
Session 7 - Poverty and Inequality I:
Definition and Measurement
Lecturer: Dr. Frank Agyire-TetteyDepartment of Economics, UG
Contact Information: [email protected]

Session Overview
This session explains the multidimensional nature of poverty as
well as the various measures of poverty. The reduction of poverty
has for years attracted the attention of governments and
international donors, as well as researchers, yet there is no
common consensus on guidelines for measuring and estimating
poverty. The session also provides definition for income inequality
and its measurements.
The elimination of widespread poverty and increasing inequality is
at the core of global development efforts.
Slide 2

Session Overview
At the end of the session, the student will
Be able to identify and explain the different definitions of poverty used in the
literature.
Identify the various characteristics of poverty and be able to determine who can
be term as poor.
Analyse the weakness and strength of the various measurement of poverty.
Understand the definition and measurements of income inequality.
Identify strength and weakness of these measurements.
Be able to explain the concept of poverty, equity, equality and inequalitySlide 3

Session Outline
The key topics to be covered in this session are as follows:
Topic One: Definition of Poverty
Topic Two: Measurements of Poverty
Topic Three: Definition of Inequality
Topic Four: Measurements of Inequality
Slide 4

Reading List
Ghana. Statistical Service. (2014). Poverty Profile in Ghana, 2005
- 2013. Ghana Statistical Service.
Ghana. Statistical Service. (2007). Pattern and trends of poverty in
Ghana, 1991-2006. Ghana Statistical Service.
Slide 5

DEFINING POVERTY
Topic One
Slide 6
How do we define poverty?
Traditionally, poverty has been defined in terms of individual’s level of
income.
For instance, poverty is measured on a scale, with the most extreme
form of poverty being measured as those who live on $1.25 per day
or less.
In response to this, development programmes have always been
centred on job creation, GDP growth and other economic policies that
could be measured through changes in income.
Poverty is a multidimensional phenomena. Poverty is therefore
difficult to operationalise.
Slide 7

How do we define poverty?
However, a basic definition of poverty is that: A person is poor if he/she
lacks or has low level of the basic essentials of life, food, shelter and
clothing.
Thus, poverty refers to the lack of basic conditions necessary for
dignified human living. This definition is based on the ability of
persons to meet their basic needs.
Other definitions of poverty are based on a capabilities approach put
forward by Amartya Sen – renowned Development Economist
Slide 8

How do we define poverty?
Sen’s capabilities approach points that development should focus on
maximising what an individual can choose to achieve in life, such as the
ability to choose the many different cultural values and practices to
adopt etc.
Choices made by an individual affect his/her well-being which is defined
as the actual enjoyment from those choices derived from the range of
options available to them.
Unlike other approaches, the capability and well-being approach look at
the range of options available for the individual to choose from and the
freedom to exercise that choice.
Slide 9

How do we define poverty?
If assessed in this manner, then our approach to poverty will be holistic and far-reaching. It will not be viewed just from the economic point of view but include measures of human rights and access.
Sen proposed that there are five general freedoms which underpins capabilities, the derogation of which will give rise to deprivation or poverty: Political freedom including civil rights;
Economic facilities which includes access to credit;
Social opportunities which include arrangements for access to health care, education and other social services;
Transparency in relations between people, as well as between people and governments; and
Protective security which includes social and economic safety nets such as unemployment benefits and famine and emergency relief.
Slide 10

How do we define poverty?
Poverty in terms of the ability to live a life characterised by active
participation in society and a sense of security.
It has a political implications - governments are supposed to deal with it.
It has social implications - poverty can be a source of shame and low
status for individuals (Low self esteem).
Slide 11

How do we define poverty?
Using this assessment, poverty is no longer confined to the issue of
income and education but rather examines whether an individual
derives benefits from the full range of choices and has the actual ability
to realise the choice that the individual has made.
Using the capability approach, poverty is now seen as deprivation of
choices available for an individual to live the life they have reason
to value and also the deprivation of the individual’s abilities to
exercise that choice.
Slide 12

Absolute vs Relative Poverty
Poverty can be viewed: Absolute or relative
Objective or subjective
Absolute poverty is based on a measurement of the absolute minimum expenditure a person requires for biological survival. Refers to a set standard which is the same in all countries and which does not change over time
Based on an absolute measure, the World Bank identifies:
Extreme poverty applies to individuals living on less than US$1.25 per day in PPP terms. Moderate poverty as living on less than $1.90 a day
Slide 13
Absolute vs Relative Poverty
Refers to a standard which is defined in terms of the society in which an
individual lives and which therefore differs between countries and over time.
It can include lack of:
Educational opportunity
Material possessions
Health care
Good quality housing
Civil Rights
Social opportunity
Relative poverty is frequently used to measure wealth disparities in wealthier
nations.
Slide 14

MEASUREMENTS OF POVERTY
Topic Two
Slide 15
Measurements of Poverty
In this session, we shall understand the ways poverty can be
measured
The measurements of poverty include:
- Headcount ratio
- The poverty gap
- The square poverty gap
Slide 16

Headcount Ratio
The headcount ratio (H) is the ratio of the population who are poor. H is
dependent on knowing the poverty line, the level of income below
which an individual is considered to be poor.
This is the share of the population whose income or consumption is
below the poverty line
H = q/n, where 0<=H=<1
q = the number of people whose income falls below the poverty line,
say 50
n = is the total number of people in the economy, say 100
H = 50/100 = ½ Slide 17
While H is easy to measure it does not tell us the depth of poverty,
that is, the extent of poverty
To be able to do this, we make a critical assumption that all
household members enjoy the same level of well-being. This
assumption may not hold in many situations.
Slide 18
The Poverty Gap
The Poverty Gap addresses some of the challenges of the headcount ratio.
This measures the total income necessary to raise everyone who is below
the poverty line up to that line. The indicator measures the average income
shortfall of all the poor as a proportion of the poverty line.
It is the mean shortfall of the total population from the poverty line expressed
as a percentage of the poverty line. This measure reflects the depth of
poverty as well as its incidence.
Slide 19

The Poverty Gap
The poverty gap is measured as
𝑃𝐺 =1
𝑁 1𝑁[(𝑍 − 𝑌𝑖)/𝑧], where
Yi = income of the individual i.
Z = the poverty line
N = total number of people
The sum of these poverty gaps gives the minimum cost of eliminating poverty, if transfers were perfectly targeted.
The poverty line is the minimum income required to meet the basic requirements for biological survival.
Slide 20
The Squared Poverty Gap
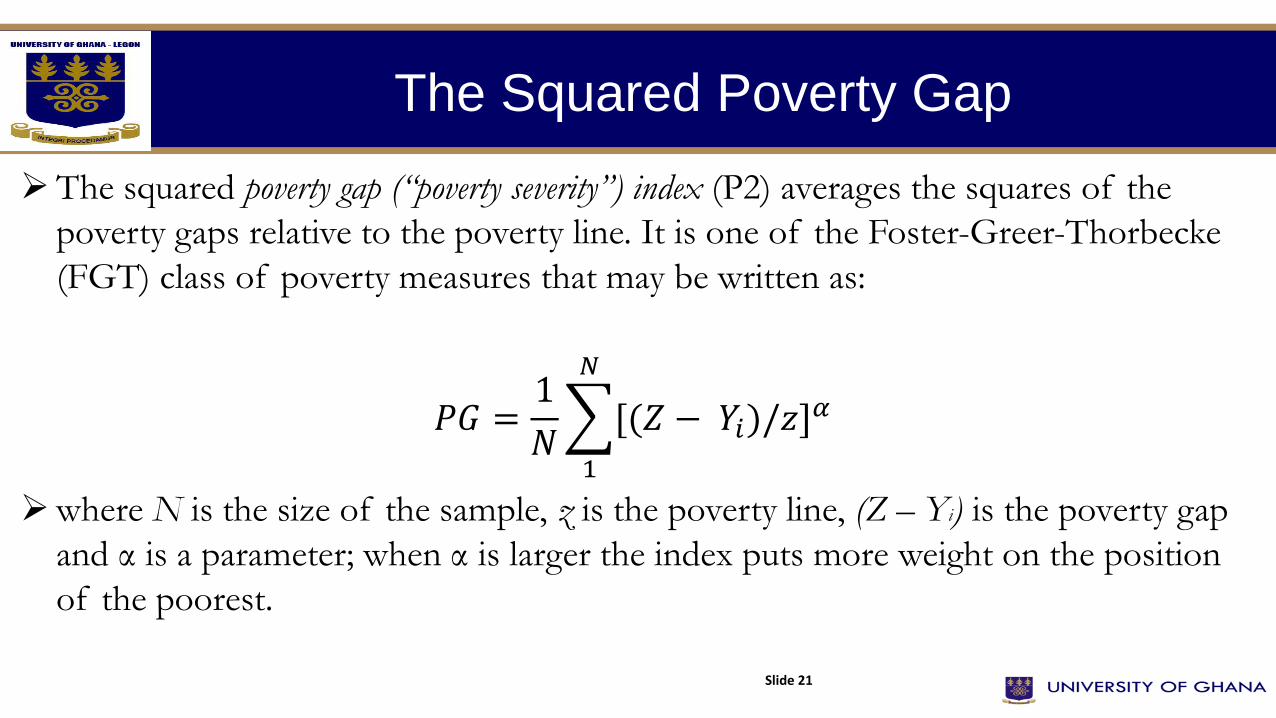
The squared poverty gap (“poverty severity”) index (P2) averages the squares of the
poverty gaps relative to the poverty line. It is one of the Foster-Greer-Thorbecke
(FGT) class of poverty measures that may be written as:
𝑃𝐺 =1
𝑁
1
𝑁
[(𝑍 − 𝑌𝑖)/𝑧]𝛼
where N is the size of the sample, z is the poverty line, (Z – Yi) is the poverty gap
and α is a parameter; when α is larger the index puts more weight on the position
of the poorest.
Slide 21
DEFINITION OF INEQUALITY
Topic Three
Slide 22

What does Inequality mean?
So far, we have understood the meaning and measurement of poverty.
We will now look at the meaning and measurement of inequality.
Economic Inequality refers to difference in how assets, wealth, or
income are distributed among individuals and/or populations. It is also
described as the gap between rich and poor.
Income inequality is also referred to as wealth disparity, wealth and
income differences, or the wealth gap.
Slide 23

Why should we be concerned with Inequality?
There are three major reasons why economists are concerned
with inequality
High income inequality leads to economic inefficiency
Extreme income disparities undermine social stability and solidarity.
Finally, extreme inequality is generally viewed as unfair. High
inequality reduces social welfare
Slide 24

MEASUREMENT OF INEQUALITY
Topic Four
Slide 25

Measurement of Inequality
In the previous topic, we defined inequality and learnt how to use deciles and
quintiles to measure income inequality.
In this topic, we will discuss other measures of inequality. The measures include
Absolute Inequality
Relative Inequality
Lorenz Curve
Gini Coefficient
Slide 26

Quintiles and Deciles
The distribution of the incomes can be grouped into five called quintiles or into
ten called deciles. This will assist in knowing what proportion of income is
received by each group. In Table 1, the first column shows the 20 persons, col.
2 shows their incomes, col 3 shows incomes grouped into 5 cumulatively while
the last shows incomes groups into 10 cumulatively.
If incomes of 20 persons are grouped into 5, it means we group 4 people
separately. If the 20 incomes are grouped into 10, it means we group 2 persons’
incomes. From Table 1 the sum of the first 4 poorest persons make 5. This
group is called the 5th quintile. The next sum 9 is the 4th quartile.
Slide 27

Distribution of income

Measurement of Inequality
Relative inequality is the ratio of the bottom 40% of the population to the top 20%. This is a measure of the degree of inequality between the two extremes of the very poor and the very rich in society. From Table 1, this is (14/51) = 0.27
If the top 20% is divided by the bottom 40%, we get 3.62 = 51/14. This is the same. The first ratio, 0.27 implies that every GHC 1 that a rich person in the first quintile gets, a poor person in the bottom 40% gets GHc 0.27.
The second ratio, 3.62 implies that every GHc 1 a poor person in the bottom 40% gets, a rich person in the 1st quintile gets GHC 3.62. The two interpretations are equivalent.
Slide 29

Measurement of Inequality
The absolute inequality measure compares the aggregate income of the lowest quintile with those in the highest quintile. Sometimes the income of the lowest 40% (4th and 5th quintiles) is compared with the highest quintile (1st quintile). From Table 1, the poorest 40%of the population have about 14% (5 + 9)/100 * 100 = 14 of the income of the 20 people.
Also the richest 20% of the population have about 51% (51/100 *100=51) of the income of the 20 people.
These income comparisons of the poor and the rich give an idea on income inequality of the country.
Slide 30

Measurement of Inequality
The Lorenz Curve
The Lorenz Curve is the graphical measurement of inequality in an economy. This is shown in Fig. 1. The vertical axis measures the percentage of income while the horizontal measures the percentage of income recipients.
From Gig. 1, as the Lorenz curve moves away from the diagonal perfect equality, the degree of inequality increases and vice versa. If the Lorenz curve coincides with the diagonal then there is perfect equality in the economy or every person has the same amount of income. In the situation where one person receives all the income with all the others receiving nothing, perfect inequality, the Lorenz curve coincides with the lower and right-hand borders of the diagram.
Slide 31

Measurement of Inequality
Slide 32

Measurement of Inequality
Gini Coefficient
It is the quantitative measurement of income inequality. It is the
ratio of the area between the diagonal and the Lorenz curve
divided by the total area of the triangle in which the curve lies
shown in Fig 2. In Fig 2, it is the area A divided by the triangle
BCD. It varies from 0, perfect equality, to 1 perfect inequality.
The higher the value of the Gini coefficient, the higher the curve
sags away from the line of equality and the higher the level of
inequality.
Slide 33

Measurement of Inequality
Slide 34

References
TODARO, M. P., & SMITH, S. C. (2009). Economic
development. Boston, Pearson Addison Wesley.
Slide 35