economic analysis for the proposed definition of 'waters ... · the effects of a proposed rule...
TRANSCRIPT

1
Economic Analysis
for the
Proposed Definition of “Waters of the
United States”
– Recodification of Pre-existing Rules

ii
[This page intentionally left blank]
EPA-XX/R-XX-XXXX
June 2017

iii
Table of Contents 1. Introduction ...................................................................................................................................... 1
2. Methodology and Approach ............................................................................................................ 2
2.1. Purpose of Economic Analysis ........................................................................................................ 2
2.2. Base Case and Year of Analysis ...................................................................................................... 3
2.3. Methodology .................................................................................................................................... 4
3. Results .............................................................................................................................................. 8
3.1. Avoided Costs and Forgone Benefits............................................................................................... 8
3.3 Distributional Impacts .................................................................................................................... 12
3.3.1 Distribution of Avoided Costs ........................................................................................................ 13
3.3.2 Distribution of Forgone Benefits of Improved Water Quality and Wetlands Protection ............... 14
3.3.3 Impact on Landowners ................................................................................................................... 15
3.3.4 Employment Impacts ..................................................................................................................... 16
4. Related Acts and Executive Orders ............................................................................................... 19
4.1. Small Business Regulatory Enforcement Fairness Act (SBREFA)/ Regulatory Flexibility Act
(RFA) 19
4.2. E.O. 13771: Present Value of Net Benefits to 2030 ..................................................................... 19
5. Limitations and Uncertainties ........................................................................................................ 22
6. References ...................................................................................................................................... 23
A. Appendix ...................................................................................................................................... A-1

1
1. Introduction
The Environmental Protection Agency (EPA) and the Department of the Army (Army),
(“the agencies”) are publishing a proposed rule to initiate the first step in a comprehensive, two-
step process intended to review and revise the definition of “waters of the United States,”
consistent with Executive Order 13778 signed on February 28, 2017, “Restoring the Rule of
Law, Federalism, and Economic Growth by Reviewing the ‘Waters of the United States’ Rule.”
For this first step, the agencies propose to revise the Code of Federal Regulations to re-codify the
definition of “waters of the United States,” which currently governs administration of the Clean
Water Act (CWA), pursuant to a decision issued by the U.S. Court of Appeals for the Sixth
Circuit staying a definition of “waters of the United States” promulgated by the agencies in 2015.
See In re US Dep’t. of Def. and US EPA Final Rule: Clean Water Rule, No. 15-3751 (lead) (6th
Cir. Oct. 9, 2015). The agencies would apply the definition of “waters of the United States” as it
is currently being implemented, that is, informed by applicable agency guidance documents and
consistent with Supreme Court decisions, and longstanding practice. Proposing to re-codify the
regulations that existed before the 2015 Clean Water Rule (CWR) will provide continuity and
certainty for regulated entities, the states, agency staff, and the public. In a second step, the
agencies will pursue a notice-and-comment rulemaking in which the agencies will conduct a
substantive re-evaluation of the definition of “waters of the United States.”

2
2. Methodology and Approach
2.1. Purpose of Economic Analysis
In accordance with Executive Order 12866, Executive Order 13563, Office of
Management and Budget (OMB) Circular A-4, and the EPA’s “Guidelines for Preparing
Economic Analyses,” the agencies prepared this economic analysis (EA) for this “significant
regulatory action.”
The agencies prepared an illustrative economic analysis to provide the public with
information on the potential changes to the costs and benefits of various CWA programs that
could result if there were a change in the number of positive jurisdictional determinations. The
2015 CWR is used as a baseline in the analysis in order to provide information to the public on
the estimated differential effects of restoring the pre-2015 status quo relative to the 2015 CWR.
However, as explained previously, the 2015 CWR has already been stayed by the Sixth Circuit,
and the proposed rule wouldmerely codify the legal status quo, not change current practice.
The proposed rule is a definitional rule that affects the scope of “waters of the United
States.” This rule does not establish any regulatory requirements or directly mandate actions on
its own. However, by changing the definition of “waters of the United States,” the proposed rule
changes the waters where other regulatory requirements that affect regulated entities come into
play, for example, the locations where regulated entities would be required to obtain certain
types of permits. The consequence of a water being deemed non-jurisdictional is simply that
CWA provisions no longer apply to that water. There are no avoided costs or forgone benefits if
similar state regulations exist and continue to apply to that water. The agencies estimated that
the 2015 CWR would result in a small overall increase in positive jurisdictional determinations
compared to those made under the 1986 regulation as currently implemented (e.g., informed by
the 2003/2008 guidance). When the 2015 CWR is compared exclusively to the 1986 regulation
(uninformed by the 2003/2008 guidance), the agencies estimated fewer waters would be within
the scope of the CWA. Because this rulemaking contemplates returning to the prior regulations
as currently implemented, resulting in an overall reduction in positive jurisdictional
determinations relative to the 2015 CWR, the agencies estimated the avoided costs and forgone
benefits of repealing the 2015 CWR.

3
In evaluating the impacts of the proposed action, a number of uncertainties have been
identified. For example, the quantitative analysis takes as its starting point the estimates of the
costs and benefits of the 2015 CWR.1 Rescinding that rule suggests that the costs of that rule
would now be avoided costs and the benefits of that rule would now be forgone benefits.
However, one key uncertainty is predicting the response of states when the scope of
jurisdictional waters under the CWA is reduced. For example, if states regulate these waters and
wetlands beyond the extent assumed in this EA, both the avoided costs and forgone benefits
based on the 2015 CWR EA estimates would be overestimates.
2.2. Base Case and Year of Analysis
As noted in Circular A-4 (OMB, 2003), the agencies need to establish a baseline against
which to analyze the economic effects of the proposed rule. Normally, the baseline for analyzing
the effects of a proposed rule is a description of the world that would exist without the rule.
Without this proposed rule, the Code of Federal Regulations (CFR) would continue to reflect the
definition of “waters of the United States” as promulgated in the 2015 CWR. The 2015 CWR
was implemented for several weeks, except in 13 states, until litigation on that rule resulted in a
nationwide stay of the rule by the U.S. Court of Appeals for the Sixth Circuit, instituting the
“pre-Rule regime, pending litigation.” Although the stay created a situation in which the prior
regulations (the language this proposal would reinsert in the CFR) are in effect, that could be
altered at any time by factors beyond the control of the agencies. If the court were to take future
action to lift that stay, the 2015 CWR would again be the state of the world without this proposed
rule.2 Thus, the agencies are interpreting the baseline for this economic analysis to be the 2015
CWR. The policy scenario analyzed in an EA should reflect the world with the proposed rule.
As the agencies propose to reinstate the regulations that existed just prior to the 2015 CWR, the
1 “Economic Analysis of the EPA-Army Clean Water Rule,” (U.S. EPA and Dept. of Army 2015a)
2 Prior to the Sixth Circuit’s stay order, the District Court for North Dakota had preliminarily enjoined the rule in 13
States (North Dakota, Alaska, Arizona, Arkansas, Colorado, Idaho, Missouri, Montana, Nebraska, Nevada, South
Dakota, Wyoming and New Mexico). Therefore, if the Sixth Circuit’s nationwide stay were to expire, the 2015
rule would be enjoined under the North Dakota order in States covering a large geographic area of the country,
but the rule would be in effect in the rest of the country pending further judicial decision-making or substantive
rulemaking under the Executive Order.

4
economic analysis of the 2015 CWR (“Economic Analysis of the EPA-Army Clean Water Rule,”
EPA-HQ-OW-2011-0880-20866) provides much of the information necessary for an economic
analysis of this proposed rule.
The estimates reported in the 2015 CWR EA were reported in 2014 price levels.3 This
economic analysis updates those estimates to 2016 price levels, using the Gross Domestic
Product (GDP) Deflator, which measures changes to GDP driven by changing prices rather than
changing production. It is also called the GDP Implicit Price Deflator (GDP-IPD).
EPA is aware that, under the court stay of the 2015 rule, the legal status quo is governed
by the regulations that existed prior to the 2015 rule, and informed by guidance and longstanding
practice. EPA considered this as a possible alternative baseline to augment the analysis with the
main baseline articulated above. However, given past practice implementing Executive Order
12866 of incorporating all relevant regulations that are finalized into the baseline, this economic
analysis only examines the 2015 rule in the baseline.
2.3. Methodology
This economic analysis is based on the assumption that the 2015 CWR has been fully
implemented even though this rule is merely codifying the existing status quo. However, this
analysis is based on many of the conditions characterized by the baseline assumed in the 2015
CWR EA (U.S. EPA and Dept. of Army 2015a). Thus, as noted in Section 2.1 above, the costs of
the 2015 CWR serve as the starting point for estimates of the avoided costs of this proposed rule,
while the benefits of the 2015 CWR serve as the starting point for estimates of the forgone
benefits of this proposed rule. A brief description of how those costs and benefits were
estimated follows; for additional detail, see U.S. EPA and Dept. of Army (2015a).
The 2015 CWR EA estimated the costs and benefits from the increased positive
jurisdictional determinations of waters under the 2015 CWR relative to practices at the time [80
FR 37053, June 29, 2015]. In addition, the 2015 CWR EA noted that certain assumptions were
made to be analytically conservative, leading to a likely overestimate of costs and benefits. As an
3 Note that the 2015 CWR EA describes the methodology behind its estimates as producing 2014 price levels;
however, in several places, tables reporting those estimates mislabel the estimates as being in Fiscal Year (FY)
2014 price levels (“FY14”). In fact, all calculations there were done in calendar year 2014 price levels. The FY
2014 label is appropriate for some of the jurisdictional impact estimates.

5
example, the 2015 CWR EA made the assumption that all newly positive jurisdictional
determinations under the 2015 CWR would trigger new CWA requirements, and acknowledged
that it would not hold uniformly (see p. vii of U.S. EPA and Dept. of Army, 2015a: “No costs
would apply if no discharge or dredge/fill activity occurs.”). The programs analyzed in the 2015
CWR EA included:
CWA Section 311 Oil Spill Prevention (benefits were not quantified)
CWA Section 401 Certification (benefits were not quantified)
CWA Section 402
o Stormwater Permitting
o Concentrated Animal Feeding Operation Permitting
o Pesticide General Permit (benefits were not quantified)
CWA Section 404 Permits and Stream and Wetland Mitigation (stream mitigation
benefits were not quantified)
The estimates in the 2015 CWR EA (U.S. EPA and Dept. of Army 2015a) relied
primarily on public data regarding recent approved jurisdictional determinations (JDs) issued
under the CWA Section 404 program. The EPA reevaluated a sample of recent negative
jurisdictional determinations (i.e., determinations of no jurisdiction) and estimated the extent of
jurisdictional determinations for aquatic resources that would have become positive under the
2015 CWR. The percentage of the sample of negative jurisdictional findings that were
determined to become positive under the 2015 CWR was taken as the lower bound on the change
in jurisdiction. However, it was noted that the lower bound jurisdictional estimate may
underestimate the change in jurisdiction because some landowners may have assumed their
waters were non-jurisdictional and therefore never applied for an approved jurisdictional
determination. To account for these types of situations, an upper bound jurisdictional change
was created by counterfactually assuming a doubling of the number of requested approved
jurisdictional determinations for an appropriate subset of jurisdictional determinations (see
Section 4 of U.S. EPA and Dept. of Army 2015a, for a more complete description). The 2015
CWR EA (U.S. EPA and Dept. of Army 2015a) estimated a change in positive approved
jurisdictional determinations of 2.84% and 4.65% under these “low end” and “high end”
scenarios, respectively.

6
Absent data to denote how changes in jurisdiction translate into changes in permitting
activity, the agencies assumed that the change in costs and benefits of the 2015 CWR would be
proportional to the range of changes in positive approved jurisdictional determinations.
For the CWA 311 program on Spill Prevention, Control and Countermeasure (SPCC)
plans related to oil storage facilities, the agencies estimated the number of facilities lacking
SPCC plans based on the assumption that the waters they are located near were not jurisdictional
waters (and became jurisdictional under the 2015 CWR), and multiplied by an average cost
associated with complying.
Under CWA Section 401, the agencies estimated the costs associated with states’ review
of federal permits to certify if they will meet applicable CWA standards using estimates of
review time and average wages of employees in occupations with the necessary expertise.
The costs and benefits of the CWA section 402 permitting program as related to
Stormwater (construction permitting under the Phase II rule), Concentrated Animal Feeding
Operations (CAFO), and the Pesticides General Permit were calculated by multiplying the
jurisdictional changes by the total costs and benefits estimated in each programs’ most recent
economic analysis. The costs and benefits of each program were also adjusted up or down to
account for program growth or decline since the rules were promulgated.
For permits under the CWA Section 404 Permit program for the discharge of dredged
and/or fill material, permit application costs were estimated by multiplying the expected
additional permits due to changes in jurisdiction by estimates of the unit cost of a permit
application. Two estimates of unit permit application costs were evaluated resulting in high and
low application cost estimates. Compensatory mitigation costs for streams and wetlands were
calculated using estimates of state-specific costs. CWA section 404 benefits associated with
wetlands mitigation were calculated by multiplying estimates of household willingness to pay for
each wetland acre by the number of households and by the number of acres mitigated.
Based on the 2015 CWR EA (U.S. EPA and Dept. of Army 2015a), the current EA
examines the avoided costs and forgone benefits of repealing the 2015 CWR, and does so under
many similar assumptions, with exceptions described below. [See Table 3 in Section 5 for a
description of the uncertainties and limitations associated with maintaining those same
assumptions.] Changes to the estimates from the 2015 CWR EA, besides the aforementioned

7
relabeling, include converting estimates from 2014 price levels to 2016 price levels, using the
GDP-IPD. The corresponding tables from the 2015 CWR EA are replicated as Tables A-1 and
A-2 in the appendix, for easy reference. In addition, the agencies have also added a qualitative
discussion of distributional impacts (in Section 3.3).

8
3. Results
3.1. Avoided Costs and Forgone Benefits
Tables A-3 and A-4 in the appendix show the annual costs and annual benefits as
estimated in the 2015 CWR EA, expressed in 2016 price levels, for the two predicted changes in
jurisdiction that were part of the 2015 CWR analysis. As described below, the agencies do not
have enough information to estimate the extent to which states would move to regulate waters
that are no longer jurisdictional under the CWA.
The agencies summarize the estimates in Tables A-3 and A-4 as a range, reporting the
low estimate of the low-end scenario and the high estimate of the high-end scenarios, based on
the total row. The subtotal row focuses on comparing costs and benefits for only those programs
for which both costs and benefits were estimated; the total row includes all estimated costs and
benefits. As the categories not estimated all fall in the benefits column, comparing the quantified
totals may potentially lead to a lower estimate of net benefits, depending on any regulatory
response by the states. The reported ranges capture both the low and high estimates for each
program cost or benefit category (generally driven by ranges for unit costs or benefits in analyses
of previous rules), and the low-end and high-end estimates of the change in jurisdiction.
A number of assumptions are embedded in the 2015 CWR EA, and these assumptions
may no longer be appropriate assumptions to make in estimating the avoided costs and forgone
benefits for this proposed rule. Conducting an economic analysis of a regulation requires
making analytical assumptions in the face of uncertainties and/or incomplete data. Relying on
previously conducted analyses can introduce additional uncertainty due to changes in
information or baseline conditions since the time when the original analysis was conducted.
Therefore, the agencies reviewed the previous analysis in the 2015 CWR EA to determine its
appropriateness and applicability to the current context.
The largest and most uncertain estimates from the 2015 CWR EA are associated with the
benefits of the CWA 404 program. The 2015 CWR wetland benefits were derived through a
benefit transfer exercise using 22 estimates from 10 studies, examining households’ willingness
to pay for wetland preservation. The studies were published between 1986 and 2000, although
the agencies attempted to find more recent studies. More recent wetland studies were not
available. The age of these studies introduces uncertainty, because public attitudes toward nature

9
protection could have changed. The past 30 years have also seen tremendous advances in
statistical and economic methods that have improved the ability to collect and analyze data on
the willingness to pay for changes in environmental amenities. The wetland valuation studies
available for use in the benefits transfer in the final 2015 CWR EA may not have benefited from
those advances, introducing greater uncertainty as to their robustness and applicability to current
conditions. In addition to the age of the studies, the limited number of studies available also
restricts the application of common tests for theoretical consistency that are necessary to validate
the results. For example, issues of scope are not examined or taken into account.
As previously noted, states’ responses to this proposed rulemaking could have a
significant impact on the avoided costs and forgone benefits. For example, some of the waters
covered by newly positive jurisdictional determinations under the 2015 CWR were already
protected by states through their pollutant discharge permit programs, and thus would not
generate incremental costs and benefits as estimated in 2015 CWR EA. The agencies were
unable to factor the magnitude of this effect into the analysis leading to increased uncertainty.
This additional uncertainty applies to both the avoided costs and the forgone benefits. In the
case of the forgone benefits of wetland protection the agencies believe the cumulative
uncertainty in this context is too large to include quantitative estimates in the main analysis for
this proposed rule. However, the agencies are confident that the forgone benefits of wetlands
protection are greater than zero, and therefore present these as unquantified benefits in the tables
below.

10
Table 1. Estimates of Avoided Costs and Forgone Benefits, Derived from the 2015 CWR
Economic Analysis: Low End Scenario.
Annual Avoided Costs
(millions 2016 $)
Annual Forgone Benefits
(millions 2016 $)
Low High Low High
CWA 402 CAFO Administration $0.17 $0.17 $3.9 $6.8
CWA 402 CAFO Implementation $6.21 $6.21
CWA 402 Stormwater Administration $0.29 $0.29 $29.7 $37.7
CWA 402 Stormwater Implementation $29.9 $37.3
CWA 404 Permit Application $29.4 $50.2
not quantified CWA 404 Mitigation – Wetlands $55.7 $156.0
SUBTOTAL $121.7 $250.2 $33.6 + $B* $44.5 + $B*
CWA 311 Compliance $13.0 $13.0 not quantified
CWA 401 Administration $0.8 $0.8 not quantified
CWA 402 Pesticide General Permit
Implementation $3.4 $3.7 not quantified
CWA 404 Mitigation – Streams $23.3 $46.2 not quantified
TOTAL $162.2 $313.9 $33.6 + $B* $44.5 + $B*
Source: Figure ES-1 in 2015 CWR EA (U.S. EPA and Dept. of Army 2015a). Revised to be in 2016 price levels, rather than the
2014 price levels in the 2015 CWR EA, and for this repeal proposal “annual costs” in the 2015 CWR EA are reported here as
“avoided annual costs”, and likewise for “benefits” and “forgone benefits”.
* It should be noted that not all benefit categories are fully quantified. $B is a stand-in for the unquantified benefits, and would
not necessarily represent the same value in the total row as the subtotal row.

11
Table 2. Estimates of Avoided Costs and Forgone Benefits, Derived from the 2015 CWR
Economic Analysis: High End Scenario.
Annual Avoided Costs
(millions 2016 $)
Annual Forgone Benefits
(millions 2016 $)
Low High Low High
CWA 402 CAFO Administration $0.28 $0.28 $6.4 $11.1
CWA 402 CAFO Implementation $10.17 $10.17
CWA 402 Stormwater Administration $0.48 $0.48 $48.6 $61.7
CWA 402 Stormwater Implementation $49.0 $61.0
CWA 404 Permit Application $48.2 $82.2
not quantified CWA 404 Mitigation – Wetlands $91.2 $255.4
SUBTOTAL $199.3 $409.5 $55.0 + $B* $72.8 + $B*
CWA 311 Compliance $13.0 $13.0 not quantified
CWA 401 Administration $1.3 $1.3 not quantified
CWA 402 Pesticide General Permit
Implementation $5.5 $6.1 not quantified
CWA 404 Mitigation – Streams $23.3 $46.2 not quantified
TOTAL $242.4 $476.2 $55.0 + $B* $72.8 + $B*
Source: Figure ES-2 in 2015 CWR EA (U.S. EPA and Dept. of Army 2015a). Revised to be in 2016 price levels, rather than the
2014 price levels in the 2015 CWR EA, and for this repeal proposal “annual costs” in the 2015 CWR EA are reported here as
“avoided annual costs”, and likewise for “benefits” and “foregone benefits”.
* It should be noted that not all benefit categories are fully quantified. $B is a stand-in for the unquantified benefits, and would
not necessarily represent the same value in the total row as the subtotal row.
As shown above, based on compounded uncertainty as applied to estimates from the 2015
CWR EA, the annual avoided costs of the proposed rule would range from $162 million to $476
million, while the annual quantified forgone benefits of the proposed rule would range from $34
million to $73 million, plus the forgone benefits that could not be quantified.
3.2. Benefits from Removing Uncertainty about the Future Regulatory Regime
With frequent changes in interpretation and implementation of which waters are
jurisdictional under the CWA, landowners, potential manufacturing plants, and other land
developers face an uncertain regulatory environment. Such uncertainty can cause firms to make
strategic decisions that are efficient from a private standpoint but socially inefficient, for
example, by delaying project implementation to wait for uncertainty to be resolved. Firms may

12
also respond by building strategic flexibility into their operations, which can increase costs
(Engau and Hoffmann 2009).4 By proposing to repeal the 2015 CWR, the agencies intend to
improve the consistency and stability of the definition of “waters of the United States.” An
important goal of this action is for landowners to have increased certainty about the future
regulatory environment and for their decisions to develop specific land parcels or build specific
manufacturing operations to proceed with greater certainty, and with a reduced need for devoting
resources to maintaining operational flexibility. The agencies note, however, that uncertainty
about states’ responses to this rulemaking and the outcome of the forthcoming substantive re-
evaluation of the definition of “waters of the United States” will persist. Absent a great deal
more data concerning how various land developers and manufacturers make decisions about new
projects and in light of remaining jurisdictional uncertainty, the agencies are unable to quantify
the benefits of the reduced uncertainty.
3.3 Distributional Impacts
The avoided costs and forgone benefits presented earlier are not expected to be felt
uniformly across the population, and may not accrue to the same individuals or communities.
OMB recommends including a description of distributional effects as part of a regulatory
analysis “so that decision makers can properly consider them along with the effects on economic
efficiency [i.e., net benefits]. Executive Order 12866 authorizes this approach.” (U.S. Office of
Management and Budget 2003). Understanding the distribution of the avoided compliance costs
and forgone benefits among people and communities can aid in understanding the distributional
impacts associated with this action.5 This section discusses the general expectations regarding
how avoided costs and forgone benefits might be distributed across the population, relying on a
4 Engau and Hoffman (2009) found that in the case of regulatory uncertainty following the Kyoto Protocol, some
firms responded by increasing their strategic flexibility but not postponing decisions, which they hypothesize
might have been an effort to add credibility to lobbying activities directed at influencing future regulation.
5 Executive Order 12989, Federal Actions to Address Environmental Justice in Minority Populations and Low-
Income Populations, directs agencies to address impacts on minority and low-income populations, particularly
those that may be considered disproportionate. EPA developed guidance, both in its Guidelines for Preparing
Economic Analyses (U.S. EPA 2010) and Technical Guidance for Assessing Environmental Justice in Regulatory
Analyses (U.S. EPA 2016) to provide recommendations for how to consider distributional impacts of rules on
vulnerable populations.

13
review of recent literature. For example, Fullerton (2011) discusses six potential distributional
impacts related to environmental policy, some of which could be relevant to this action.
Specifically, Fullerton (2011) describes impacts on consumers (e.g., higher prices); impacts on
producers (e.g., lower returns to capital); scarcity rents (e.g., value of permits); benefits
associated with pollution reduction; and transition costs (i.e., due to changes in employment or
capital mix). The agencies did not conduct a quantitative assessment of these distributional
impacts for the proposed rescission, but the qualitative discussion in this section provides a
general overview of the types of impacts that could result from this action.6
3.3.1 Distribution of Avoided Costs
While the 2015 CWR did not require specific control costs for any particular source
category, it did define what waters (including wetlands) were jurisdictional. The estimated
increase in positive jurisdictional determinations under the CWA in the 2015 CWR as compared
to prior practice (and the status quo) would necessarily increase compliance costs by applying all
the regulations that are already promulgated under the CWA to these waters covered by newly
positive jurisdictional determinations. These higher costs would, in part, be expected to filter
through to consumers in the form of higher prices. The estimated compliance costs for the 2015
CWR consisted of costs associated with CAFO administration and implementation, stormwater
administration and implementation, CWA 404 permit applications, and wetland mitigation. Each
of these categories could yield higher prices, to consumers for agricultural goods (associated
with CAFOs), or to property market participants for buildings and housing (due to stormwater
implementation or wetland mitigation in construction projects). Expenditures on agricultural
goods (e.g., food) and housing usually are a larger share of low-income household income
compared to other households, and this share falls as income increases. Therefore, policies that
increase prices for these goods and services could be regressive, placing a greater burden on low
income households. By proposing to rescind the 2015 CWR this action would therefore reduce
the potential burden on low income households, to the extent those households would have faced
6 See Environmental Justice Report for the Clean Water Rule: Definition of “Waters of the United States” Under
the Clean Water Act; Final Rule, May 2015” for a discussion of how environmental justice was considered in the
2015 CWR (U.S. EPA and Dept. of Army 2015b).

14
higher prices as a result of the 2015 CWR, as the compliance costs would no longer be imposed
for waters that are no longer jurisdictional.
Compliance costs could also lower labor earnings and returns to capital in the affected
sectors, including agriculture. Changes in employment associated with lower labor earnings can
have distributional consequences depending on a number of factors (see Section 3.3.4 below).
Capital income tends to make up a greater proportion of overall income for high income
households. As a result, the costs passed through to households via lower returns to capital tend
to be progressive, placing a greater share of the burden on higher income households in these
instances. As such, by repealing the 2015 CWR, higher income households would avoid lower
returns to capital, to the extent that 2015 CWR costs were passed through in this manner.
3.3.2 Distribution of Forgone Benefits of Improved Water Quality and Wetlands
Protection
The 2015 CWR EA assumed that the costs and benefits of the Corps’ permitting program
and EPA’s regulatory programs would increase proportionately with the increase in positive
jurisdictional determinations from preexisting practice (U.S. EPA and Dept. of Army 2015a). If
jurisdictional waters increased by 2.84% and 4.65% percent (estimated by the percentage
increase in determinations that would have been jurisdictional) then the costs and benefits of all
relevant CWA programs would increase by 2.84% and 4.65% percent as well. The 2015 CWR
EA estimated that up to $572.3 million in benefits (at 2014 price levels) would have been
realized with the 2015 CWR. The regulations that would be applied to new sources on waters
covered by newly positive jurisdictional determinations produced benefits associated with
improved surface and ground water quality, (e.g., improved commercial and recreational
fishing).
Often the baseline incidence of negative health outcomes is greater among low-income or
minority populations due to a variety of factors, including a greater number of polluting sources
located where low-income and minority populations live, work, and play (Bullard et al. 2007;
United Church of Christ 1987); greater susceptibility to a given exposure to pollutants due to
physiology or other triggers (Akinbami 2012); and pre-existing conditions (Schwartz et al.
2011). Because the manner in which the health benefits of a rulemaking are distributed is based
on the correlation of housing and work locations to changes in the distribution of pollutants, or

15
more specifically for the current rule, changes in water quality, it is difficult to fully know the
distributional impacts. Furthermore, the overall distribution of benefits will depend on whether
and how any households or individuals change their choice of housing or work locations in
response to water quality changes (Sieg, et al. 2004). The distribution of fishing, recreation, and
other water quality benefits, including flood control, depends on the distribution of willingness to
pay for these benefits, information which is typically not available.
The proposed rescission of the 2015 CWR would result in forgone benefits to affected
populations, but it is difficult to know how those forgone benefits would be distributed across the
population without more detailed information regarding changes in water quality and willingness
to pay for those benefits. Nonuse or existence value benefits, which dominate the estimation of
wetlands benefits, tend to grow with income, for example. Therefore, the forgone benefits could
be progressive (i.e., greater loss in benefits for higher income households). Alternatively, low-
income populations may have experienced a larger share of health benefits due to their higher
baseline incidence, in which case the forgone benefits would be regressive (i.e., greater loss for
low-income households).
3.3.3 Impact on Landowners
With the proposed rule, the agencies expect to avoid some impacts on landowners and
land users. The value of land containing waters that would be considered newly jurisdictional
under the 2015 CWR, as compared to current practice, would potentially have been lowered if
anticipated uses of the land would have required compliance with regulations promulgated under
the CWA. Users of that land for such activities would have had to absorb costs to comply with
the CWA. The increased costs would have been capitalized into and resulted in lower land
values. For example, assume there is a tract of land that would be ideal for building new homes
once the wetlands on that tract of land were drained and filled. The price of that land would have
been reduced if the builder had to pay to mitigate that wetland loss. The amount of the reduction
would have corresponded to the magnitude of the mitigation costs7 which were expected to vary
widely nationwide and would have been determined by such items as:
7 For more details see Figure 8 in the 2015 CWR RIA, “Economic Analysis of the EPA-Army Clean Water Rule”
(U.S. EPA and Dept. of Army 2015a).

16
Permit Application Costs (expected to vary with size of project and size of impacts to
jurisdictional waters)
Permitting Time Costs
Impact Avoidance and Minimization Costs (costs of project redesign to avoid impacts on
jurisdictional waters)
Compensatory Mitigation Costs (costs of implementing the Corps-approved
compensatory mitigation plan)
At the same time, by causing additional waters to be determined to be jurisdictional under the
CWA as compared to current practice, the 2015 CWR may have increased property values that,
for example, benefited from additional flood protection provided by protected wetlands or from
higher quality recreational opportunities and increased tourism from protected waterways. There
would also have been an increase in the social value of wetlands that may have been produced
for compensatory mitigation as a result of the 2015 CWR. These increased property and social
values will be forgone under the proposed rule.
3.3.4 Employment Impacts
Executive Order 13777 directs federal agencies to consider the effect of regulations on
jobs, among other regulatory issues and concerns (Executive Order 13777, 2017). Employment
impacts of environmental regulations are composed of a mix of potential declines and gains in
different areas of the economy over time. Typically, regulation affects the distribution of
employment among industries rather than the general employment level.8 When the U.S.
economy is at full employment, the removal of an environmental regulation is unlikely to have a
noticeable impact on aggregate employment.9 With well-functioning labor markets, workers will
move from one job to another relatively quickly and may experience short-term unemployment
during the transition. On the other hand, when the economy is operating at less than full
employment, or if there are significant unemployment issues in concentrated geographic areas or
8 Arrow et al. 1996; see discussion at beginning of Part Two. In practice, distributional impacts on individual
workers can be important, as discussed in this section
9 Full employment is a conceptual target for the economy where everyone who wants to work and is available to do
so at prevailing wages is actively employed. The unemployment rate at full employment is not zero.

17
specific industries, displaced workers may experience longer unemployment spells and
difficulties finding new employment. If a regulation’s potential impact on employment appears
to be significant, and there are important unemployment issues facing groups of potentially
affected workers, there may be important distributional effects for further consideration. OMB
recommends including a description of distributional effects, as part of a regulatory analysis
(U.S. Office of Management and Budget 2003).
Localized reductions in employment may occur due to increased permitting and pollution
control costs resulting from a discharge into a newly jurisdicational water. Such reductions may
adversely affect individuals and communities in areas or industries with significant
unemployment, just as localized increases in employment may have positive effects. For the
proposed recission of the 2015 CWR, we do not have information on where changes in the
number of positive jurisdictional determinations may occur, and therefore are unable to
undertake analysis of employment effects specific to this action. We describe qualitatively
general issues of concern related to potential distributional impacts, without drawing specific
conclusions. If potentially dislocated workers are vulnerable because they are located in
communities or industries facing significant unemployment issues they may experience
persistent job loss, earnings may be permanently lowered, and the wider community may be
negatively affected. Discussion and consideration of the distribution of potential employment
impacts can shed light on whether the rulemaking exacerbates or ameliorates preexisting
inequalities in wealth and income.
In considering distributional employment impacts, there may be important differences
across potentially affected workers in areas or industries affected by significant unemployment.
Individuals may be relatively more affected if they work in industries, occupations, or
geographic areas with weak labor markets, with significant unemployment. For example, if
displaced workers face limited options for re-employment, or if re-employment has lower
earnings and/or reduced returns to human capital, they may experience longer durations of
unemployment than otherwise and possibly also greater reductions to future earnings, as well as
a greater likelihood of additional transaction costs to migrate to other areas or obtain additional
education to acquire skills. On the other hand, dislocated workers operating in tight labor
markets may experience relatively brief periods of transitional unemployment. Some job seekers

18
may find new employment opportunities due to regulation, for example, if their skill set qualifies
them for new environmental protection jobs.
With the proposed rule, workers in the construction industry could find expanded
opportunities associated with new construction, new plants, or development projects if they are
located in areas that would have been negatively affected by the 2015 CWR. On the other hand,
there is a potential for fewer job opportunities in industries such as the recreation industry, as the
proposed rule no longer increases the number of waterways protected, as compared to the 2015
CWR.
The distributional impacts of workforce disruptions may extend beyond impacts on
earnings. Sociological studies examine different effects than those that are typically examined in
economic studies. Workers experiencing unemployment may also experience negative health
impacts. The unemployed population is observed to be less healthy than those who are
employed, and the differences in health across these groups can be significant (see, for example,
Roelfs et al. 2011). Several recent papers have attempted to identify a causal relationship
between unemployment and health. These papers examined the health effects of involuntary job
loss by focusing on displaced workers; that is, those who have lost their jobs due to layoffs or
other firm-level employment reductions. For example, Sullivan and von Wachtner (2009) found
increased mortality rates among displaced workers in Pennsylvania; and in a study of displaced
Austrian workers, Kuhn et al. (2007) found that job loss negatively affected men’s mental health.
This literature also describes difficulties in identifying the cause of poorer health for the
unemployed population. Associations between unemployment and poorer health may be driven,
in part, by the possibility that workers in poorer health may be more likely to
become unemployed, and estimates of the magnitude of the association may be biased, in part,
by factors not easily observed or addressed by researchers that contribute both to
unemployment risk as well as poorer health (Jin 1995, Sullivan and von Wachtner 2009).
In general, if potential employment impacts are significant and persistent and there are
important differences in potential vulnerabilities for groups of workers related to local areas with
significant unemployment, distributional employment impacts may also have community-wide
effects, such as effects on the local tax base, the provision and quality of local public goods, and
changes in demand for local goods and services.

19
4. Related Acts and Executive Orders
4.1. Small Business Regulatory Enforcement Fairness Act (SBREFA)/ Regulatory
Flexibility Act (RFA)
This proposed rule to repeal the 2015 CWR would codify the legal status quo. As such,
the estimates of avoided compliance costs in Section 3.1 demonstrate that this proposed rule will
not have a significant economic impact on a substantial number of small entities, and therefore no
regulatory flexibility analysis is required.
4.2. E.O. 13771: Present Value of Net Benefits to 2030
Under E.O. 13771, the agencies calculated the present value of avoided costs – following
OMB guidance, we present the present value of avoided costs in 2016 dollars. A present value
analysis was not performed for the 2015 CWR EA, which presented annual benefit and cost
impacts as discussed in Section 3.
The calculation of a present value requires an annual stream of avoided costs and forgone
benefits for each year of the timeframe for which the 2015 CWR would have been binding. For
the purpose of this proposed rule analysis, that annual stream of avoided costs and forgone
benefits was estimated based on the projections of annual costs presented in the 2015 CWR EA.
Assuming the economic and regulated activities in the impacted programs (e.g., CWA sections
311, 401, 402, and 404) are relatively constant from year to year and the compliance costs are
also stable, then the resulting cost-savings and forgone benefits of rescinding the 2015 CWR are
also relatively constant. The time horizon used in calculating present value is through 2030, for
a total of thirteen years, based on a number of factors. Given that an approved jurisdictional
determination is typically valid for five years, this time horizon should be at least that long.
NPDES permits are for 5 years and renewable, so a time horizon of at least 10 years would cover
two permit cycles. In its analysis for the Active Construction effluent guideline regulation, using
14 years of dredging permit data from the Corps, EPA estimated that redredging – an activity
requiring a CWA 404 permit – occurs with a frequency that ranges from 4.7 to 10 years (noting

20
that the range is limited by the years of available data).10 On the other hand, development often
occurs after a change in ownership of land and predicting land use change is a notoriously
difficult exercise, suggesting that a time horizon as long as 20 or 30 years is likely to introduce
significant uncertainty. Thus, for purposes of E.O. 13771 for this proposed rule, the agencies
have used a time horizon through 2030. Using a three percent and a seven percent discount rate,
the agencies calculated the present value of avoided costs and forgone benefits in 2016. The
estimates of annual avoided costs and forgone benefits were adjusted to represent present values
in 2016, and are expressed in terms of 2016 price levels, per E.O. 13771 implementation
guidance. To do this, we applied the GDP deflator recommended in the implementation
guidance.11
Under the aforementioned assumptions, the proposed rulemaking is expected to have a
present value of cost-savings of $2.7 billion to $5.2 billion under a 3% discount rate, and $1.8
billion to $3.5 billion under a 7% discount rate. The present value estimates are sensitive to the
assumption that the economic conditions and regulated activities pertaining to these programs
(e.g., the number of permits, acres of wetland mitigation, etc.) will be relatively constant.
Increasing development demand associated with economic growth could lead baseline regulated
activities to increase over time, in which case the current proposed rule to rescind the 2015 CWR
would yield higher cost-savings and forgone benefits. But such baseline activities could also
decrease over time based on the sectoral shifts in economic activity and the spatial pattern of
land use, in which case the current proposed rule would yield lower cost-savings and forgone
benefits.
The present value estimates are also sensitive to the assumption that the marginal
compliance costs of avoided regulatory activities are stable over the time horizon. These
activities could become more or less expensive over time, which could also lead to higher or
lower cost-savings, respectively. One example, where baseline costs to regulated entities could
10 For more details, see U.S. EPA, 2009, “Economic Analysis of Final Effluent Limitation Guidelines and Standards
for the Construction and Development Industry”.
11 For GDP-IPD figures used in this analysis, see
https://www.bea.gov/iTable/print.cfm?fid=ED8379E3B870D35D721D155A07EDCC602C8B75B9F62BF3144F0
AD5C40B910F675527EA67256537B0B861F837692ADA4863A36A58B7AA75B2536A5A8352E74CE6.
Accessed 5/30/17.

21
increase is the CWA Section 404 permit application and mitigation programs. The opportunity
cost of land used for wetland mitigation will likely increase over time since land is in fixed
supply. Even if the number of new development projects each year remains constant, the supply
of usable land for mitigation will diminish over time, thus increasing the marginal cost of
wetland mitigation in the baseline. If baseline costs are increasing over time, then the realized
cost savings would be higher than those quantified in this EA.

22
5. Limitations and Uncertainties
The quantitative analysis takes as its starting point the estimates of the costs and benefits
of the 2015 CWR, as documented in the EA for that rule (U.S. EPA and Dept. of Army 2015a).
As such, the same limitations and caveats that apply to the 2015 CWR EA apply to the
quantitative analysis in this EA as well (see, for example, Section 3 of U.S. EPA and Dept. of
Army 2015a). The estimates of avoided costs and foregone benefits also do not reflect any
changes in baseline conditions since the analysis for the 2015 CWR was conducted (e.g.,
developments in state regulations, changes in economic activity, or other factors affecting the
cost of compliance activities).
The use of results from the 2015 CWR analysis makes implicit assumptions about how
state regulators would respond to this proposed rulemaking. Specifically, the current EA
assumes states would not change existing laws and regulatory programs. However, it is possible
that some states may respond to a re-codification of the regulations in place prior to the 2015
CWR by continuing to regulate as waters of the state those waters that are no longer considered
“waters of the United States.” The particulars of individual state laws and regulations vary
greatly. States have a range of options, from relying on the proposed federal definition, to
choosing to remain at the 2015 CWR jurisdiction levels, to asserting state jurisdiction to waters
beyond those covered by the 2015 CWR. To the extent that states regulate waters and wetlands
beyond the levels assumed in the 2015 CWR EA, realized cost savings and forgone benefits will
be lower. A 2013 Environmental Law Institute report estimated that approximately two-thirds
of all states place some legal constraint on the authority of state and local government officials to
adopt aquatic resource protections beyond the CWA definition of “waters of the U.S.” These
may be straightforward stringency limitations, property-based limitations, or combinations of the
two. The provisions may be partial limitations, affecting only some applications. These states
would have to change their current laws before adopting more stringent requirements; therefore,
such a response is less likely among those states.

23
6. References
Akinbami, L.J., J.E. Mooreman, C. Bailey, H. Zahran, M. King, C. Johnson, and X. Liu. 2012.
Trends in Asthma Prevalence, Health Care Use, and Mortality in the United States, 2001-
2010. NCHS data brief no. 94. Hyattsville, MD: National Center for Health Statistics.
Retrieved from http://www.cdc.gov/nchs/data/databriefs/db94.htm.
Arrow, K. J.; M. L. Cropper; G. C. Eads; R. W. Hahn; L. B. Lave; R. G. Noll; Paul R. Portney;
M. Russell; R. Schmalensee; V. K. Smith and R. N. Stavins. 1996. “Benefit-Cost
Analysis in Environmental, Health, and Safety Regulation: A Statement of Principles.”
American Enterprise Institute, the Annapolis Center, and Resources for the Future; AEI
Press. Available at <http://www.hks.harvard.edu/fs/rstavins/Papers/Benefit Cost Analysis
in Environmental.AEI.1996.pdf>. Accessed June 5, 2015.
Bullard, R.D., P. Mohai, R. Saha, and B. Wright. 2007. Toxic Wastes and Race at Twenty: 1987-
2007 Grassroots Struggles to Dismantle Environmental Racism in the United States.
Cleveland, OH: United Church of Christ Justice and Witness Ministries.
Engau, Christian and Volker H. Hoffmann. 2009. “Effects of regulatory uncertainty on corporate
strategy-an analysis of firms’ responses to uncertainty about post-Kyoto policy.”
Environmental Science & Policy 12 (2009) 766-777.
Environmental Law Institute. 2013. State Constraints: State-Imposed Limitation on the Authority
of Agencies to Regulate Waters Beyond the Scope of the Federal Clean Water Act.
Environmental Law Institute, Washington, DC.
Executive Order 13777. 2017. Presidential Executive Order on Enforcing the Regulatory Reform
Agenda. February 24.
Jin, Robert L., Chandrakant P. Shah, and Tomislav J. Svoboda. 1995. “The Impact of
Unemployment on Health: A Review of the Evidence.” Canadian Medical Association
Journal. 153(5): 529-40.
Kuhn, Andreas, Rafael Lalive, and Josef Zweimuller. 2007. “The Public Health Costs of
Unemployment,” Cahiers de Recherches Economiques du D´epartement d’Econom´etrie
et d’Economie politique (DEEP) 07.08, Universit´e de Lausanne, Facult´e des HEC,
DEEP.
Roelfs, David J., Eran Shor, Karina W. Davidson, and Joseph E. Schwartz. 2011. Losing Life
and Livelihood: A Systematic Review and Meta-Analysis of Unemployment and All-
Cause Mortality. Social Science & Medicine, 72(6): 840-54.
Schwartz, J., D. Bellinger, and T. Glass. 2011a. Exploring Potential Sources of Differential
Vulnerability and Susceptibility in Risk From Environmental Hazards to Expand the
Scope of Risk Assessment. American Journal of Public Health, 101 Suppl 1, S94-101.

24
Sullivan, D. and T. von Wachter. 2009. “Job Displacement and Mortality: An Analysis Using
Administrative Data.” The Quarterly Journal of Economics, 124(3): 1265-1306.
United Church of Christ. 1987. Toxic Waste and Race in the United States: A National Report on
the Racial and Socio-Economic Characteristics of Communities with Hazardous Waste
Sites. United Christ Church, Commission for Racial Justice.
U.S. Office of Management and Budget. 2003. “Circular A-4, Regulatory Analysis”. Available
at: <https://obamawhitehouse.archives.gov/omb/circulars_a004_a-4/>. Accessed May 23,
2017.
U.S. Environmental Protection Agency. 2009. Economic Analysis of Final Effluent Limitation
Guidelines and Standards for the Construction and Development Industry. EPA- 821-R-
09-011.
U.S. Environmental Protection Agency and Department of the Army. 2015a. Economic Analysis
of the EPA-Army Clean Water Rule. EPA-HQ-OW-2011-0880-20866.
U.S. Environmental Protection Agency and Department of the Army. 2015b. Environmental
Justice Report for the Clean Water Rule: Definition of “Waters of the United States”
Under the Clean Water Act; Final Rule. EPA-HQ-OW-2011-0880-20863.
A-1
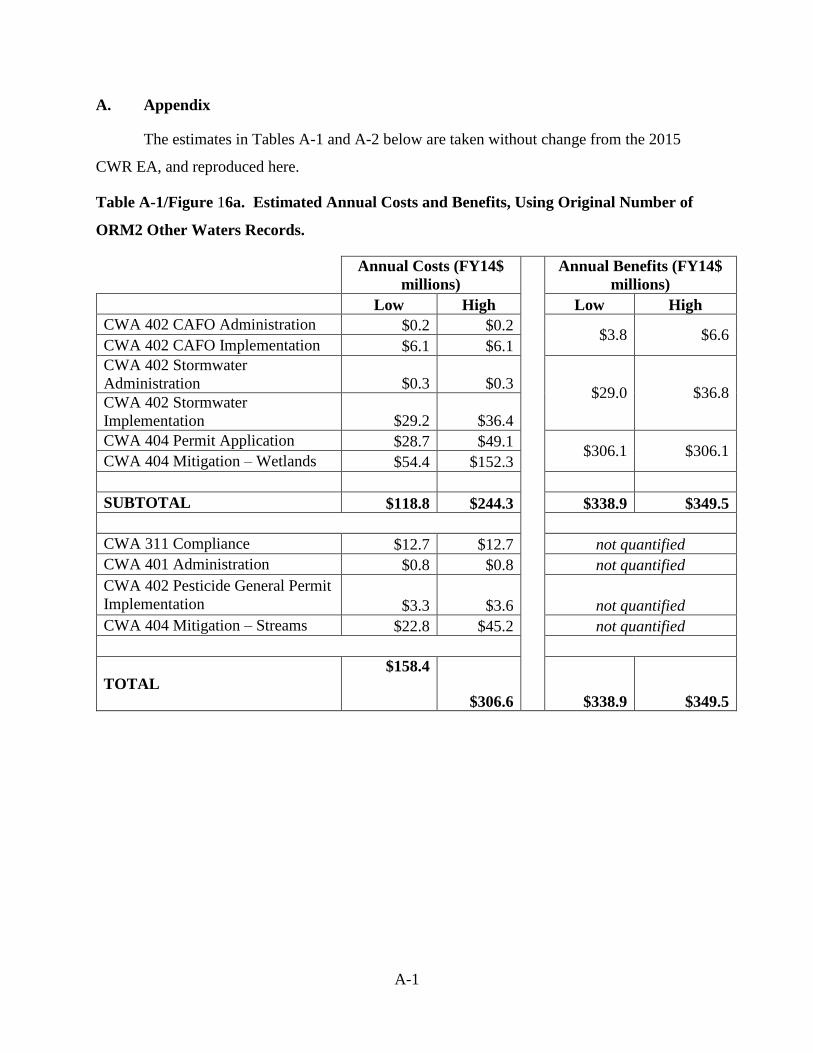
A. Appendix
The estimates in Tables A-1 and A-2 below are taken without change from the 2015
CWR EA, and reproduced here.
Table A-1/Figure 16a. Estimated Annual Costs and Benefits, Using Original Number of
ORM2 Other Waters Records.
Annual Costs (FY14$
millions)
Annual Benefits (FY14$
millions)
Low High Low High
CWA 402 CAFO Administration $0.2 $0.2 $3.8 $6.6
CWA 402 CAFO Implementation $6.1 $6.1
CWA 402 Stormwater
Administration $0.3 $0.3 $29.0 $36.8
CWA 402 Stormwater
Implementation $29.2 $36.4
CWA 404 Permit Application $28.7 $49.1 $306.1 $306.1
CWA 404 Mitigation – Wetlands $54.4 $152.3
SUBTOTAL $118.8 $244.3 $338.9 $349.5
CWA 311 Compliance $12.7 $12.7 not quantified
CWA 401 Administration $0.8 $0.8 not quantified
CWA 402 Pesticide General Permit
Implementation $3.3 $3.6 not quantified
CWA 404 Mitigation – Streams $22.8 $45.2 not quantified
TOTAL $158.4
$306.6 $338.9 $349.5

A-2
Table A-2/Figure 16b. Estimated Annual Costs and Benefits, Using Double the Number of
ORM2 Other Waters Records.
Annual Costs
(FY14$ millions)
Annual Benefits
(FY14$ millions)
Low High Low High
CWA 402 CAFO Administration $0.3 $0.3 $6.2 $10.8
CWA 402 CAFO Implementation $9.9 $9.9
CWA 402 Stormwater
Administration $0.5 $0.5 $47.5 $60.2
CWA 402 Stormwater
Implementation $47.8 $59.6
CWA 404 Permit Application $47.0 $80.3 $501.2 $501.2
CWA 404 Mitigation – Wetlands $89.0 $249.4
SUBTOTAL $194.6 $383.3 $554.9 $572.3
CWA 311 Compliance $12.7 $12.7 not quantified
CWA 401 Administration $1.3 $1.3 not quantified
CWA 402 Pesticide General Permit
Implementation $5.4 $5.9 not quantified
CWA 404 Mitigation – Streams $22.8 $45.2 not quantified
TOTAL $236.0 $465.0 $554.9 $572.3
To calculate the numbers in Tables A-3 and A-4, the values in the above tables are
multiplied by 1.024, which represents the GDP deflator for 2016 divided by the GDP deflator for
2014, in order to convert from 2014 price levels to 2016 price levels.

A-3
Table A-3. Estimates of Costs and Benefits, As Quantified in 2015 CWR Economic
Analysis: Low End Scenario.
Annual Costs (millions 2016
$)
Annual Benefits (millions 2016
$)
Low High Low High
CWA 402 CAFO Administration $0.17 $0.17 $3.9 $6.8
CWA 402 CAFO Implementation $6.21 $6.21
CWA 402 Stormwater Administration $0.29 $0.29 $29.7 $37.7
CWA 402 Stormwater Implementation $29.9 $37.3
CWA 404 Permit Application $29.4 $50.2 $313.5 $313.5
CWA 404 Mitigation – Wetlands $55.7 $156.0
SUBTOTAL $121.7 $250.2 $347.0 $357.9
CWA 311 Compliance $13.0 $13.0 not quantified
CWA 401 Administration $0.8 $0.8 not quantified
CWA 402 Pesticide General Permit
Implementation $3.4 $3.7 not quantified
CWA 404 Mitigation – Streams $23.3 $46.2 not quantified
TOTAL $162.2 $313.9 $347.0 $357.9
Source: Figures ES-1 and 16a in 2015 CWR EA (U.S. EPA and Dept. of Army 2015a). Revised to be in 2016 price levels, rather
than the 2014 price levels in the 2015 CWR EA, and for this repeal proposal “annual costs” in the 2015 CWR EA are reported
here as “avoided annual costs”, and likewise for “benefits” and “forgone benefits”.

A-4
Table A-4. Estimates of Costs and Benefits, As Quantified in 2015 CWR Economic
Analysis: High End Scenario.
Annual Costs (millions 2016
$)
Annual Benefits (millions 2016
$)
Low High Low High
CWA 402 CAFO Administration $0.28 $0.28 $6.4 $11.1
CWA 402 CAFO Implementation $10.17 $10.17
CWA 402 Stormwater Administration $0.48 $0.48 $48.6 $61.7
CWA 402 Stormwater Implementation $49.0 $61.0
CWA 404 Permit Application $48.2 $82.2 $513.2 $513.2
CWA 404 Mitigation – Wetlands $91.2 $255.4
SUBTOTAL $199.3 $409.5 $568.2 $586.0
CWA 311 Compliance $13.0 $13.0 not quantified
CWA 401 Administration $1.3 $1.3 not quantified
CWA 402 Pesticide General Permit
Implementation $5.5 $6.1 not quantified
CWA 404 Mitigation – Streams $23.3 $46.2 not quantified
TOTAL $242.4 $476.2 $568.2 $586.0
Source: Figures ES-2 and 16b in 2015 CWR EA (U.S. EPA and Dept. of Army 2015a). Revised to be in 2016 price levels, rather
than the 2014 price levels in the 2015 CWR EA, and for this repeal proposal “annual costs” in the 2015 CWR EA are reported
here as “avoided annual costs”, and likewise for “benefits” and “forgone benefits”.