economic analysis of a basic and applied research …/media/files/activity files...economic analysis...
TRANSCRIPT

Economic Analysis of a Basic and Applied Research Agenda:
Strategies for Prioritization
January 16, 2009
Institute of Medicine Roundtable on Environmental Health Sciences, Research and Medicine
Gary Yohe
Woodhouse/Sysco Professor of Economics
Wesleyan University

I will be Taking the Charge Seriously
• Economics – accept a risk-based approach: risk analysis, communication and management
• Basis and applied – more of a tactic than a strategy or agenda, per se; builds from discussions with actual decisionmakers (NYC)
• Prioritization research topics – sorting through the litany of issues and working through the time dimension
• Research – design to support decisions rather than serendipity
• Focus on adaptation but include sensitivity to mitigation

Context: Major Lessons from the Fourth Assessment Report (2007)
• Adaptation is unavoidable because the planet would be committed to more warming even if emissions of
greenhouse gases were halted today (Kevin yesterday).
• Responding to climate change involves an iterative risk management process that includes both adaptation and mitigation and takes into account climate change damages, co-benefits, sustainability, equity, and attitudes to risk.

Underlying Themes for Thinking Practically
about Applied Research into Responding
• Uncertainty is ubiquitous – risk is what matters
• Risk is Probability times Consequence
• Risk expressed in terms of vulnerabilities (not just exposures) is the common denominator even if the metrics are not the same
• Risk management is the most appropriate policy lens and can provide methods for prioritization research initiatives
• Focusing on risk broadens the perspective beyond “high confidence” vulnerabilities and can incorporate the truth that timing is important.

Some Fundamental Concepts
• When we know a lot about both probability andconsequence, “expected value” of risky outcomes can be used to communicate information to decision-makers –this is approach used in most benefit-cost analyses.
• Risk management approaches are useful when we need to look at probabilities and consequences in greater detail – especially when consequences are non-linear with respect to exposure and/or exposure is non-linear with respect to the driving forces.
• Risk management uncovers the economic efficiency of diversification and insurance.

Comparative Strengths of “Risk Management” Approach
• Risk management approaches are particularly helpful when:
– There is substantial uncertainty (temporal, spatial, or otherwise) even about the probabilities of events.
– Actors are risk-averse – so simple expected value calculations and/or representations of “most-likely” scenarios do not adequately inform appropriate decisions.
– There are fundamental uncertainties that will simply not be resolved in a timely fashion (e.g., climate sensitivity, socio-economic site specific development pathways, etc…).

An Illustration:Nonlinearity and Aversion to Risk
Exposure
Co
nseq
uen
ce
Consequence at
expected exposure
Expected consequence
Low exposure
50% likelyHigh exposure
50% likely
Expected
exposure
Certainty
equivalent
Risk Premium

Another Illustration:Linearity and Risk Neutrality
Exposure
Co
nseq
uen
ce
Certainty
Equivalent
Expected
Exposure
Expected consequence
Consequence at
expected exposure
Low exposure
50% likely
High exposure
50% likely

Interpreting the Graphs
• Especially useful when consequences are measured in specific and malleable units (like currency).
• Certainty equivalence and the associated risk premia are then appropriate comparative metrics that support estimates of the value of information (research results).
• The efficacy of adaptation and/or mitigation to alter relative likelihoods and/or ameliorate consequences (reduce harm or enlarge benefits by changing exposures and/or sensitivities).

Identifying Thresholds can be Productive when Units are not particularly Malleable
Exposure
Co
nseq
uen
ce
Expected Consequence
Certainty
equivalent
Low exposure
50% likely
High exposure
50% likely
Consequence at
Expected exposure
THRESHOLD
Expected
exposure

Identifying Thresholds can Simplify the Application of a Risk-Management
Approach
• Estimate chances of crossing a “high consequence” threshold under alternative scenarios.
• Examples of relevant climate-related thresholds include:
– Temperature thresholds
– Storm event intensities and/or return-times
– Drought
– All and more are drivers of health risk
• Key outcomes: evaluate how climate change alters the risk of a clearly definable event occurring in any given period of time regardless of how it is defined.

A “Real World” Example
• The 100-year flood in New York City:
– It is difficult to characterize all of the consequences of the event.
– It is possible to think rigorously about probability of this event.
– Key questions involve how and when to invest in adaptive measures (building sea walls, enhancing pumping capacities, changing building codes).

Risk Management Example – NYC and
the 100-Year Flood
Credit: Applied Science Associates, Inc.. Source: Google, Sanborn Map Company, Inc.. NECIA, 2007 (see: www.climatechoices.org/ne/).

Risk Management Example – NYC and
the 100-Year Flood
y = 76.218e-0.1019x
R2 = 0.9764
0
10
20
30
40
50
60
70
80
90
100
110
0 5 10 15 20 25 30 35 40
Sea Level Rise
Re
turn
Tim
e f
or
Cu
rre
nt
10
0 F
loo
d

Risk Management Example – NYC and
the 100-Year Flood
0
10
20
30
40
50
60
70
80
90
100
0 5 10 15 20 25 30 35 40 45
Return Time Threshold
Lik
elih
oo
d t
hat
Retu
rn T
ime is S
maller
than
th
e In
dic
ate
d
Th
resh
old
(S
ub
jecti
ve P
erc
en
tag
e)
2025
2030
2035
2040
2045
2050

Risk Profiles…
• show the need for adaptation over time
• show the need for contemplating tolerable risk levels
• can show sensitivities of risk to mitigation – the value of mitigation
• are unitless, so they can be compared across multiple metrics and therefore across multiple manifestations of climate change.
• require enormous amounts of information. What if it is not available?

A Prioritization Method from NYC
Identify at-risk infrastructure Conduct an inventory of critical infrastructure using the NPCC’s
Climate Risk Information to determine which assets and
operations could be at risk from climate change.
Rank the magnitude and
likelihood of impacts on
critical infrastructure
Using the qualitative definitions included in the Prioritization
Framework, categorize:
• the potential magnitude (insignificant/low; moderate; high) of the climate change impact and
• the likelihood (not relevant or insignificant; low; moderate; high; certain/nearly certain) that it will occur
Determine location on the
Risk Matrix (RM)
Using the categories assigned in Step 2, determine the climate
change impacts’ location on the Risk Matrix to identify
infrastructure for which adaptation strategies should be
developed
Draft adaptation strategies Leverage NPCC tools and internal expertise to develop
adaptation strategies for prioritized risks, including but not limited
to maintenance and operations; retrofits; investments in new
infrastructure; and policy changes.
Determine location of
strategies on the Prioritization
Matrix (PM)
Assess adaptation strategies and determine the location of
strategies on the Prioritization Matrix to create an implementation
plan.

Risk is Likelihood times Consequence
Definition V
irtu
all
y
ce
rta
in/
alr
ea
dy
oc
cu
rrin
g Nearly certain likelihood of a climate variable impact occurring over the useful life of the
infrastructure (i.e. increased temperatures between 4 and 7.5 F by the end of the century
will increase stress on HVAC systems) and/or variable may already be impacting
infrastructure (i.e. subways flood during heavy rains)
Hig
h
lik
elih
oo
d
High likelihood of the impact occurring over the useful life of the infrastructure.
Mo
de
rate
lik
elih
oo
d
Moderate likelihood, with some uncertainty remaining, that the impact will occur over the
useful life of the infrastructure.
Lo
w
lik
elih
oo
d
Low likelihood of the impact occurring over the useful life of the infrastructure.

Risk is Likelihood times ConsequenceW
orke
r
Safe
ty
• No employees put in danger • Some danger to employees may exist
• Employees put in danger
Med
ical/
Inju
ries
• No to small number of potential injuries
• No long-term health impacts
• Moderate number of injuries
• Potential for fatalities
• Some long-term health impacts
• Significant number of injuries
• Significant fatalities
• Significant long-term health impacts
City
-wide
Econ
omy • Insignificant impact on NYC's
economy • Localized or sector-specific
impacts on NYC's economy • Significant impact on NYC’s
economy or on many sectors of NYC's economy
Clea
n-
up
Cost
s • No or minor clean up costs • Moderate clean up costs, easily absorbed
• Significant clean up costs
Price
of
Serv
ice
• No impact on price of services
• Some incremental costs associated with services
• Significant incremental costs associated with utilities/services
Low Medium High
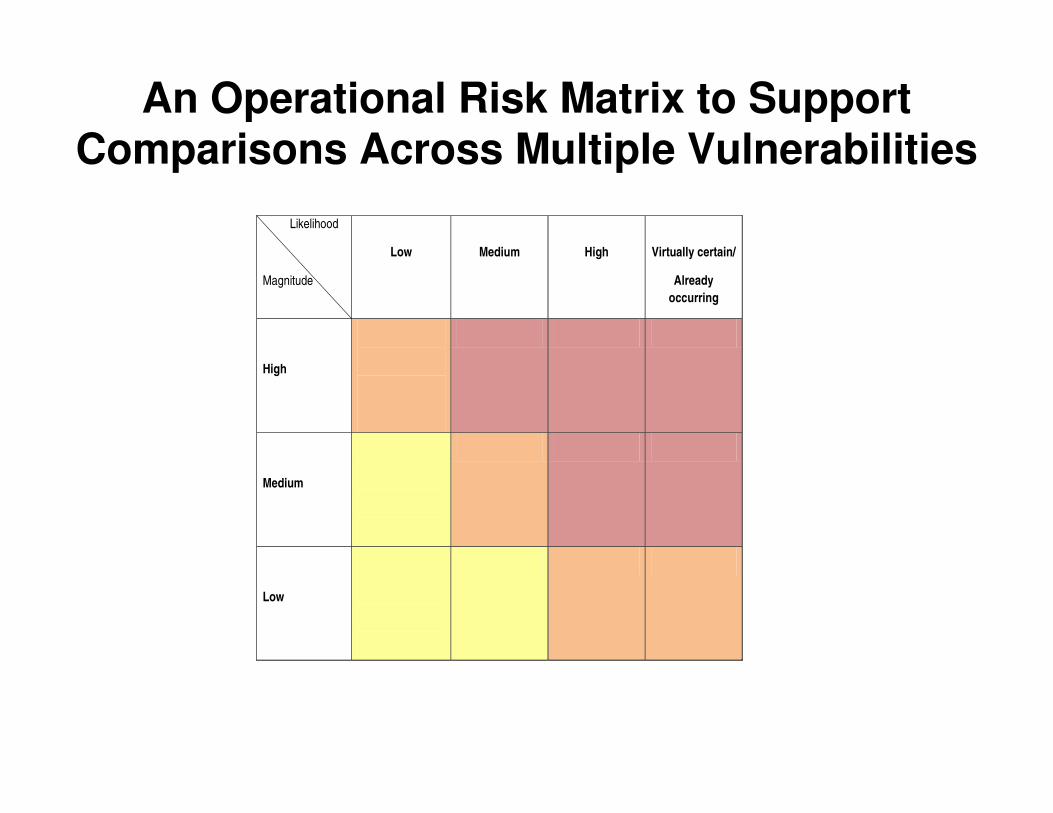
An Operational Risk Matrix to Support Comparisons Across Multiple Vulnerabilities
Likelihood
Magnitude
Low
Medium
High
Virtually certain/
Already
occurring
High
Medium
Low
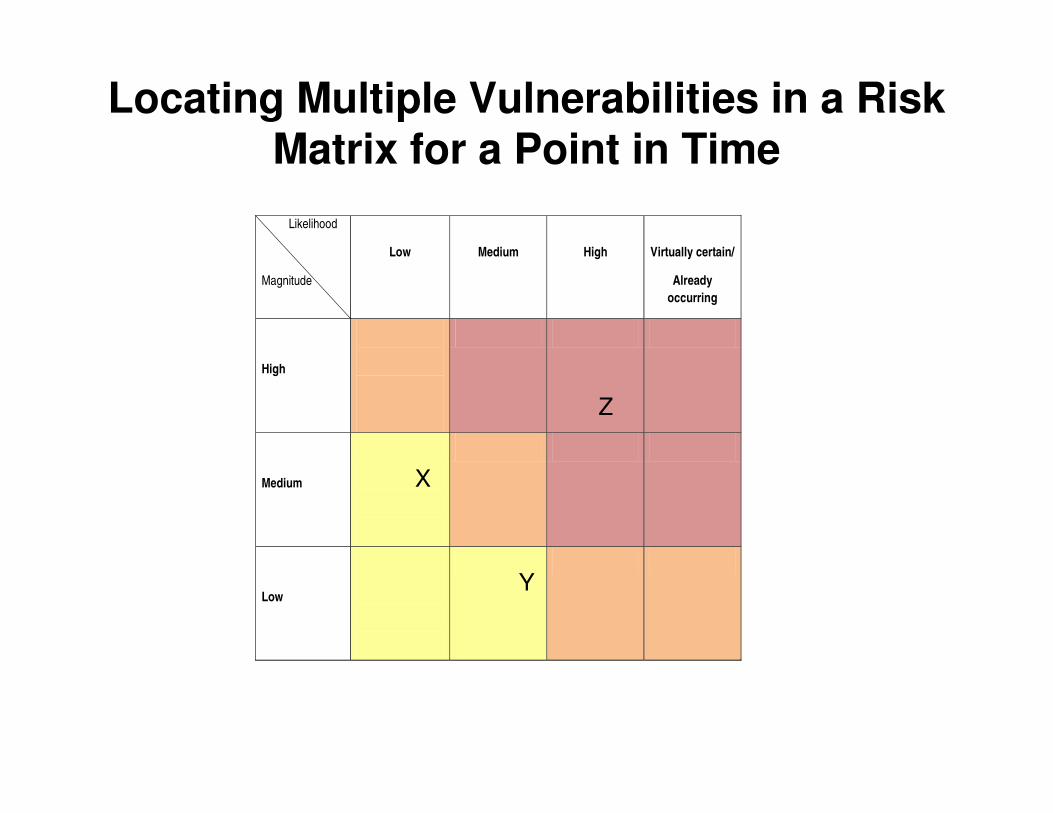
Locating Multiple Vulnerabilities in a Risk Matrix for a Point in Time
Likelihood
Magnitude
Low
Medium
High
Virtually certain/
Already
occurring
High
Medium
Low
X
Y
Z
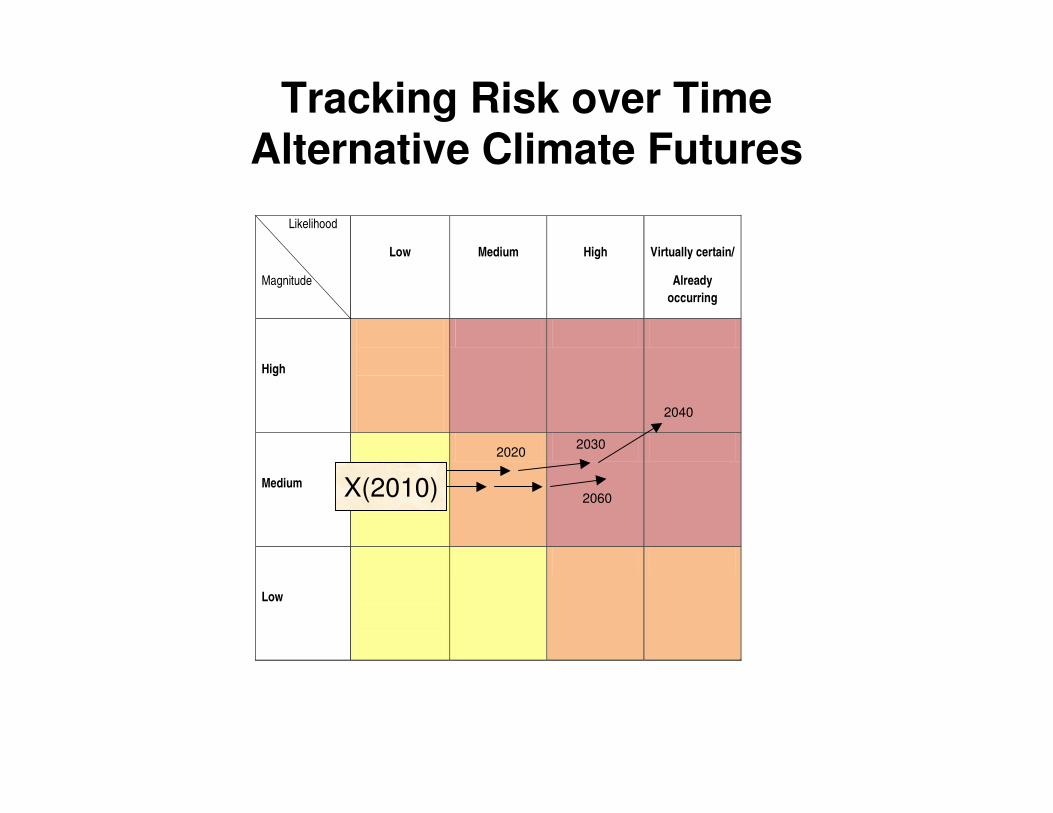
Tracking Risk over TimeAlternative Climate Futures
Likelihood
Magnitude
Low
Medium
High
Virtually certain/
Already
occurring
High
Medium
Low
X(2010)
20202030
2040
X(2010) 2060

Tracking Exposure, Sensitivity, and Adaptation over Time
Likelihood
Magnitude
Low
Medium
High
Virtually certain/
Already
occurring
High
Medium
Low
(2050)
(2050)
(2050a)(2050a)
X(2010)

Something Iterative over TimeFlexibility is generally Desirable
2005 2025 2045 2065 2085 2105
Year
Ris
k
Acceptable Risk
Risk Trajectory
Risk Trajectory w ith
Mitigation
Risk w ith Adaptation
Alone
Risk w ith Adaptation
and Mitigation

Calibration to the NYC Example:Noting the Value of Mitigation
0
10
20
30
40
50
60
70
80
90
0 5 10 15 20 25 30
Return Time Threshold (2050)
Lik
elih
oo
d t
ha
t R
etu
rn T
ime
is S
ma
ller
tha
n t
he
Ind
ica
ted
Th
res
ho
ld (
Su
bje
cti
ve
Pe
rce
nta
ge
)
Unabated
WRE (450)
IPCC (450)

London’s on the Ground Version of Iterative Decisions

Issues in Designing Adaptive Responses
• What to monitor?
– Type I errors
– Type II errors
– Type III errors
• What to do when triggers are crossed?
– Transparency of monitoring
– Transparency of adjustments
• Lead time for responses?
• Panic Intelligently given variability

Portraits of Anticipated Climate Change and
Impacts – The TAR (2001)

A Summary Image

Thanks for your atttention