economic analysis of frozen food locker plants in kansas ... · ill typeofownership 36...
TRANSCRIPT

AN ECONOMIC ANALYSIS OF FROZEin FOOD LOCKS.il PLANTS INKANSAS WITH EMPHASIS ON THOSE OFFERING
SLAUGHTERING FACILITIES
by
GEORGE NOLAN MCKENZIE
B. S., Kansas State Collegeof Agriculture and Applied Science, 1941
A THESIS
submitted in partial fulfillment of the
requirements for the degree of
MASTER OF SCIENCE
Department of Agricultural Economics
KANSAS STATE COLLEGEOF AGRICULTURE AND APPLIED SCIENCE
1947

bcax-menV
IWTABLE OF CONTENTS fY\3<f
PageINTRODUCTION 1
LlalTxlIONS OF SiUOl 2
.- PBOC BQRI 2
REVIEW Of 111 3
Survey of Email Livestock Slaughter Plants
Minimum Essential Needs of Small SlaughterHouses • A
Effect of Cold £torti-;e Lockers Upon MeatDistribution . 5
Sanitation Requirements 6
RECENT Dfcv bOPl ITa OF TH£ FROZEN FOOD IOCINDUSTRY IN KANSAS 8
Scope of Study 8
Developments oy Districts in Kansas 10
Rate of Development 15
Conclusion 19
TRENDS IN FARM AND LOCAL SLAUGHTER IN KANSAS 22
Farm Slaughter • 22
Local Slaughter • 23
Comparison of Farm and Local Slaughter byClasses of Livestock 28
SLAUGHTER ESTABLISHMENTS IN KANSAS ..... 29
SURVEY OF LOCKER PLAVIS IN KANtAS OFfBAXZIO IN CON-JUNCTION V.IIH A SMALL SLAUGHTER PLANT 33
Introduction 33
11

ill
Type of Ownership 36
Year of Plant Opening 38
Location of Plant 41
Facilities 43
Investment 45
Labor $4
Owner-Operator Labor 64
Volume of Slaughter . . 65
Source of Livestock Slaughtered for Resale 81
Delivery of Livestock to Slaughter Plant 85
Source of Slaughter of Uect in Locker Box ...... 87
Slaughtering Charges 90
Processing Charges 93
Disposition of Beat Slaughtered by Plant 98
Disposition of Inedible Slaughter By-products .... 103
Suggested Improvements in Utilization ofInedible By-products 109
Contemplated Changes 110
Insurance 110
Problems Confronting Individual Plants Ill
CONCLUSIONS 113
ACKHOWLEDGHEWT 115
BIBLIOGRAPHY 116

IhTftOi/UCiluN
The purpose of this study was to determine the role of
sm;.ll slaughter plants operate) In conjunction with frozen
food looker olants In the general structure of the nest pock-
ing Industry in Kansas and to analyze certain phases of their
operations.
Eefore undertaking the major study of analyzing the
frozen rood locker plants operating their own slaughtering
facilities, preliminary and related date were gathered and
studied on the growth of the frozen iood locker industry,
the trends in fara and local slaughter which represent the
major source of slaughter for locker patrons, an: the general
structure of the slaughter or pecking industry existing in
Kansas.
Frozen food lockers have made a rapid growth In Kansas
in the last deca le and locker plants operating a smell
slaughter plant have made e rapid growth in the last five
years. The Industry has experienced unusual success with
Its maximum point of expansion apparently not yet retched.
It has become an important industry to the state in terms of
lini_nclal success, source of ;aployment, and In the service
it is performing for the farmers and, to & lesser deg;ee,
the urban people of Kansas.

LIMITATIONS OF STUDY
This study was limited by the fact that accurate and
detailed data were not readily available. Little inform* tion
has been gathered end published concerning this Industry, and
in cases where information had been gathered, It was often
obsolete by the time it was published. The nature of th«
industry, its complexity, and its evor-changing conditions
retard the compilation of accurate statistical data.
The only practical method of securing the desired infor-
mation concerning operation figures an; policies was to deal
directly with the individual plants of the Industry. It
was not practical to obtain complete information of all the
plants and it »as necessary to depend upon sample data
supplied by the individual pl&nts &s being accurate and
representative of that particular plant.
METHODS OF PROCEDUHE
Tills study has been divided into four major partsi
(1) recent developments in the frozen food locicer Industry
in Kansas, (2) trends in farm end local slaughter In Kansas,
(3) slaughter establishments in Kansas, and (4) a survey of
locker plants in Kansas operating in conjunction with a smell
slaughter plant.

J
The first three parts »ore not t: ei.ted in great detail.
They v.ere developed only to the extent of providing en under-
standing and a basis lor the last part of this thesis, which
constituted the major portion of this study.
REVIKV* OF LIliihATUR*
Survey of Small Livestock Slaughter Plants
The smt.ll livestock slaughter plant has not yet received
adequate attention in most states. R. C. ^.shby1 in a pre-
liminary report on small livestock llattfbter plants In
Illinois, visited ten small slaughter plants, six of which
were operated in conjunction iritk cold storage locker plants.
Various problems of operating these plants were analyzed.
Some of his findings and views are expressed in the following
statements:
Plant Investment . Total investment of the tenplants varied widely. Six plants had a total invest-ment of $9,999 or loss, two bad butween 810,000 end$19,999 and two plants had an investment of $40,000or more.
tapsrlence of Operators . In the ariter'sopinion, the -Host important factor In the success-ful operation of any slaughter oli.nt is the skill ofthe management and of the plant personnel. Themanagers of five plants sai<i they had no experiencein a slaughter or packing house before their presentposition. The other five have had extensive ex-perience.
^-R. C. Ashby, "Small Livestock Slaughter Plants inIllinois." University of Illinois Agricultural ExperimentStation. A Preliminary he port , September, 1945.

Blggysal £l iLOii. Only one pUnt is processingblood. All plants remove *;ut fats. Only one plantrealizes any return from the offal, selllnt it to arendering plant lor one-fourth cent t pound for hot-offal.
Stertln.fi A £laa£. The basic questions to beanswered before operation of a slaughter or packingplant are stated ass (1) location, type and size ofplant, (2) management and personnel, (3) aster supply,U; sewage facilities, (5) power, (6) offal disposal,and (7; inspection and sanitary requirements.
Ashby's study indicated some of the operating problems
facing the operators of the small slaughter plsnts. Many of
the saae problems analyzed in his study, were also considered
in the surrey of the cold storage locker plants v,ith slaughter
facilities in Kansas.
Minimum Essential Needs of Small Slaughter Houses
The Oregon Agricultural Experiment Station2 has
•unmarized whet it considers as the minimum essentiul needs
of small slaughtor plants as follows
»
A cement floor is the yjrime necessity. Woodfloors are not tight and ere not easily cleaned.Cement may crack but these cracks can be sealed withasphaltum or ordinary solder melted and run into theholes.
A septic tank und a settling tank for disposalof run-off aater. The settling tank is essential tosuccessful operation of the septic tank, Without it,the tallow, lard, and grease which is washed away runsinto the septic tank, chills, forms a scum over thewater and prevents the bacterial f.ction which is thework of the septic tank. The drain to the settlingand septic tanks should contain a trap which will prevent
"'Oregon Department of Agriculture, "Minimum Essential Needs
LfT^rJIi??!^ Houses." grsfpn Agrlculturel '.x»qrlBi»nttUJMB bulletin No. 77, p. 9, April, 1933.

the gases from backing up Into the slaughter house.
Facilities for hot water. This is highly essential.Larger plants can use the steam toiler bat smallerplants ftill find that a small oil hecter is economicaland practical. One can be installed lor as little as$35. Hot water is essential to proper sanitation be-cause v.lthout it, grease and tallow cannot be meltedoff the floors and utensils.
A refrigeration plant. Ihe plant in the largerslaughter house can also serve as a storage plant.
Kails of the slaughter house should be of concreteor be covered «itb metal to a height of four feet onthe inside. This permits cleaning of the walls.
A few other suggestions: The old bone pile thatgrew larger and larger ought to be a thing of the past,and it is in the larger plants. Waste may be kept downby burning bones or tilling to rendering plants. Allbuildings snould be adequately screened. Hide housesand swill pots should be kept separate from the restof the plant.
These recommendations are in accord with the thinking of
other authorities on the subject. There are other additional
needs such as adequate plant facilities, volume of slaughter,
experienced management and personnel, and fair slaughter and
processing charges.
Effect of Cold Storage Lockers upon Meat Distribution
The effect of the cold storage locker industry upon meat
distribution has received considerable study by research per-
sonnel at the University of Minnesota. A study made by K. J.
Eggerfr^ was among the earliest studies made of the effects of
3•'R. J. Eggert, "How Cold Storage Lockers Hay Affect Live-
stock Meat Distribution." ls£. aaA Refrigeration , AUfOft, 1933.

the cola storage locker Industry upon the meet packing In-
dustry and meat distribution system In its present form.
The results of his study are summarized in the following
statements:
If we assume continued success for cold storagelockers, there is some indication thot they maypossibly result in: causing a shift in meat consumptionfrom pork to beef and veal, increase in total aestconsumption per capita, decrease in number of butchershops, telling packaged frozen meat direct to the con-sumer, end development of local commercial slaughter-ing plants.
The specific nature of changes which might occurere not yet known. Vie can be certain that many factorsother than cold storage lockers will affect the long-time picture.
Sanitation Requirements
The early development of the small slaughter plants in
Kansas found many plants operating undei unsanitary and un-
wholesome conditions. The State vsss compelled to pass laws
that would curb unsanitary practices and to establish rules
and regulations which the plant was forced to follow if it
were to remain open for operation. The Kansas 15eat and
Poultry Inspection Law and Regulations^ outlined the need for
such a law and defined the plants which were affected by the
law as follows:
TLsfltliS. Session b;»s of 19A5 P Chapter 254. "The Kr.nsasMeat and Poultry Inspection Law and Regulations, 1945."

rORESsOliDt Nearly four years ago the attention ofthe State Board of Health was directed to certainpractices In the meat Industry whleh were dangerous andrepulsive. Slaughterers were found dressing out thecarcasses of animals which had died of disease. Thiswork was being done under unsanitary conditions andthe products were being sold in competition *lth thoseof legitimate establishments. At that time the StateBoard of Health adopted regulations which served, withproper enforcement, to clean up the conditions in theeat industries.
Section 1 of Kansas Meat and Poultry InspectionAct. As used in this acti (1) "Slaughterhouse" meansen establishment in which &ninu:ls other than poultryare slaughtered and dressed for human food. (2) "Pack-inghouse" means an establishment in which animals areslaughtered and dressed In which products are canned orotherwise processed or packed for shipment or storage.
The passage of this act in 1941 caused the closing of
mere than 200 small slaughter plants In Ktnsas.^ These were
plants which could not possibly meet the requirements of the
Act alth any amount of alterations, aany other plants which
w«ra operating outside the limitations of the Act, were able
to make the necesstry changes to comply with the Law. Today
every slaughter plant in Kansas, not under federal Inspection,
Is required to pay a registration fee to the state, which in
turn licenses the plant and inspects it to see thet it is
meeting all sanitary requirements, as specified by law.
5Data supplied by interview with Evan Wright, Director ofFood and Drug Division, Kansas State Eoard of Health, Topeka,Kansas, October 20, 1946.

RECitfJl DBVELOPkEMTfl OFTHE FKOZEN FOOD LOCKER INDUSTRY lit Ki.NtAS
Scope of Study
So attempt has been made In this manuscript to trace the
history end development of the locker industry in Kansas.
This was adequately covered by Eggert6 and others in their
unpublished study made in 1941. Neither was an effort made
to study locker plants on the basis of their internal organi-
zation, capacity, and operational methods. These factors
were studied by Otto7 and others.
It is the purpose of this phase of the study to merely
summarize the geographical distribution end the rate of de-
velopment of the locker industry in Kf>nsas. A basic under-
standing of this development is essential to grasp the full
significance of later sections of this study concerning the
rapid growth of locker plants with slaughter facilities in
Kansas.
Uuch interest has been aroused concerning the changes
end development trends which have occurred in the industry
during World «ar II. Year by year figures are not available
°R. J. Eggert. Unpublished data. Department of EconomicsMM Sociology, Kansas State College, 1941.
7M. L. Otto and E. B. Phelps, "The Locker Plant Industry inKansas." A mimeographed report. Kansas /griculturel Experi-ment Station, June, 1946.

and such *a cnalysis is, therefore, Impossible. Ho*ev r,
the directory of locker plants in Kansas compiled by George A.
Fillnger, Secretary of the Kansas Frozen Food Locker
Association was revised in 1939, 1941, 1944 and 1946. These
lists tabulated the number end location of cold storage
locker plants in Kansas, and were sufficiently uniform in
their periodic analysis to serve as a basis to analyze the
trends in development of this industry in Kansas from 1939
to 1946.
These lists of locker plants compiled in 1939, 1941,
1944 f-na 1946 are not entirely free from error. An accurate
picture at any one time is difficult to obtain because of the
constant changes in ownership, name of plant, location of new
plants, and location of plants discontinued. This condition
is accentuated by the fact that each individual locker plant
is not required to become e member of the State Locker
Association, nor is it required to register Viith the Kansas
State Loard of Health unless it has slaughtering facilities.
An official directory of locker plants in Kansas is, therefore,
not available and the unofficial lists compiled by Filinger
are as complete and correct as is possible to obtain. The
data used were assumed to be sufficiently accurate for obser-
vations in general trends in the development of the industry.
For cake of convenience and ease of comparison, the
State was divided into nine districts which are analogous with
the crop reporting districts of the state. This division
facilitates the study of the rate of development of the

10
locker industry by various sections of the state.
Developments by Districts in Kansas
In Fig. 1 the number of lockers per county in 1939 i»
indicated as well as the general geographical location in
which the early development took place and made its greatest
progress. Although the entire eastern two-thirds of the
state wes fairly well represented in 1939, it was evident
that the industry had become most firmly established in the
central, south central and east central sections of the state.
In addition to ascertaining the extent of development by
counties and districts, the counties in which tnere had not
yet been any locker plants established ere readily seen.
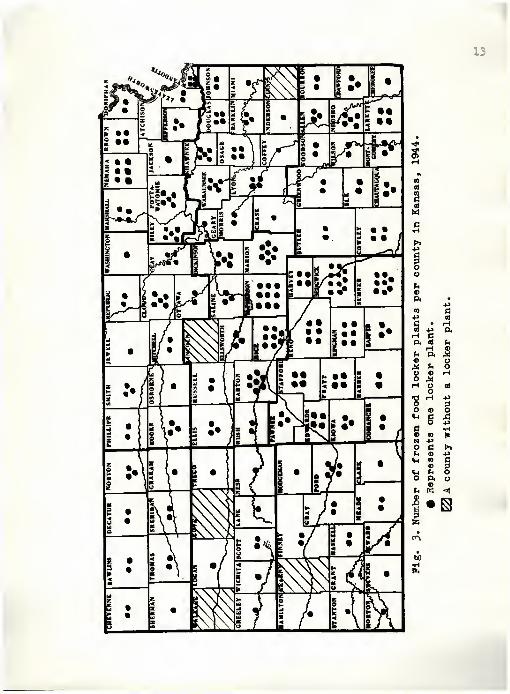
By observing Figs. 2, 3, and A respectively, t± pictorial
summary can be gained of the rate of development by sections
of the state. The western one-third of Kansas had a slow and
retarded development of frozen food lockers. An interesting
fact shov.n in Fig. 3 is that Lincoln tnd Linn counties still
had not established their first locker plant, yet were in the
midst of parts of the state that led in the development of
locker plants throughout the entire period. Figure A indicates
that all of the 105 counties in Kansas had one or more locker
plants In operation in 1946. The significant fact of thl«
development of the industry, was its steady and rapid growth
throughout the war years when materials and labor were at a
premium and difficult to obtain.

11


H

15
Rate of Development
Table 1 show* the total number of plants In etch district
for the years 1939, 1941, 19<W and 1946 with the percentage
Increase from one period to the next. Central Kancas had 28
locker plants in 1939 for the leading district, by numbers
of plants. At the time the 1939 list of locKers was compiled,
the state had t total of 105 locker plants. In 1941, Kansas
had a total of 181 locker plants with the central section of
the state still leading with a total of 41 plants, closely
lollowed by south central Kansas with 39 plants. In 1944,
the Kansas total increesed to 289 with the south central dis-
trict taking the lead with a total of 60 plants while central
Kansas had increased only to 49 plants. Figures as of Septem-
ber 1, 1946, indicate Kansas has a total of 379 locker plants
with the south central district still leading with a total of
70 plants, followed by east central with 55 plants. East
central Kansas Increased from a total of 34 plants in 1944
to 55 plants in 1946. This is a large numerical increase as
well as a large percentage increase.
The last three columns of Table 1 indicate the percent
Increase that occurred in each district and in the state as a
whole in 1941 over 1939, in 1944 over 1941, and in 1946 over
1944. To get a clear picture of these comparisons, the numer-
ical increase should be noted as well as the percentage

16
increase. For Instance, In 1944 the »est central district
incrfused 700 percent over its total in 1941 but this »as e
numerical increase from only one altnt in 1941 to a total of
eight in 1944* In 1941 two districts had no increase in
locker plant numbers from the 1939 total, these being west
central and north central. In the north central district,
Osborne county lost the plant it had In 1939 and in 1941 re-
ported no locker plants. This »as offset by an increase of
one plant in Cloud county to make the district total in 194-1
the same a 6 in 1939.
Table 2 enumerates the average number of lockers per
county in the nine different districts for each of the four
years studied. The same conclusions that were derived in
the preceding analysis of the rate of growth by districts,
apply to the rate of growth of average number of lockprs per
county in each of the nine districts. In all cases, the
average number of lockers per county isas calculated on the
basis of all the lockers comprising the district and not Just
those counties reporting one or more locker plants. The
central and south central sections of Kansas dominate in
average number of locker plants per county in each of the
four years studied. The northeast district in 1946 gained
from 2.75 locker plants per county In 1944 to 4.91 in 1946.
The totals for the state as a whole reflected a steady and
progressive development from an average of one locker plant
per county in 1939 to 1.71 in 1941, 2.75 in 1944, "id 3.61
in 1946.

17
-.5 ««
fej 4o a > t^ o c- >n o C-- o -o c~ -* u
1
o o cm H cm -o o c»- \T\ H s*»
3JJ o f- *£ O >0 o -I rH M H
a- <n CM -* t-t H lf\ sO r^ (^ 3(h o
H Ho h •P
§o h<n , o
-J '08*> «?
8 O 4 o o sf o o O vOo VI o> o o <c. to o IN O -40 <««H a H • • • • • • • • • oh I o o -t K\ o <^ o > O 0**»
Sa•H
mft
o SMH H UA >r> rH o <n
n kj •• h
5 .-i
a
M *J -* o o t~ o <n in «0 CN (M tok 1 o< o o in o -* IV fA N to i*\ a
I Hk 1 1
§ 8DO o A m «0 r-t M CM •t
I- CM o -* -4- H 00 to t~ k
h<0 41 « M M r-(
-t c t» HO,0n •
5OH(4 M • •* HO T) •H1 <4 o CM «0 Q •^ O -4 >T\ o CT- ii
(4 1 -: w H CM -* in l>- W\ m in tv1 4-» - O f
a. » u r-4 <«•» ^-t
w -J- !-< •
+»o> 9 «* ofl-l oj
at H •
^ •> "J1
m to IX t- 0» o •& -«• «0 <?hO.H *-4 iN CM •>* sO HN c\ <^ to
-* | i" CMfcCT> I r-{ a •
HI r-t a OvOjfi l4~*u « in — uoO t> 4-> r-(
Hr^ •oCT> VI 3 vO H O CM
s|<> •* o o t-l »
T3H H H i^\ IN CM CM <U a (4
O D lj> .-1
o » MVh 01 Vh ^ a
4 a AC -1 .• o*>
| cv,
o !«3
1•J- c-\ M t- CM «o sO
dvO H in PtQ
G 1 P\ -? Ci M r-t .-t O 1vh C 1 "> rH T> »w | -i
N S MO 0) O
0) •• • ,, kHh -0 *4)r-t
&> ** r-l oa u a IB tlCJCJ H r4 H m
3 <3 4-> 4J H <0 a r-( P <2
se»H h O U h n mma u *> 3 >
4->
a*>a •p 4> *• m ^^
• <v «> «§
M I « d m a o w^ « m « o H o (0 * a VI rH•H # o .--- o 01 «
a
3D.-0O 5 4J 8 5 E 5 5 4J 5 U «
i-4 to
ti (4 a 3 d a 3 h in 3§i O o O o I o o
ip 2! ..; CO SI CJ CO SB 00 w

18
1 «l 410) •J bu •r-t
3b o <"\ O -* r-l to H <^ c~- f-tQt p o c*\ o vO o c\ O t> «s sO r-lo (7- • 1 • • * • • • t 3u —i <->t M Ol r"\ -* US 4 PS <n m uo •H
a ao H oH H
>>
aP
oa 35 o 4 to 0* 1<S •-0 4 CM <a en H «r\ *•
a 1 to <r> ~t o c^ -* t* r- at4 & • • • • • • • • • £
•M M -1 o ^ OJ ~1- -* w CM cv <M 5
>vo a hto
P-*30 0) a3r-t h »•
a>O aO T) Ma O *
fa a O-1 -t m H -* o <*\ 1"\ to r- fS r-t
a, » j c- H xO o t~ o r-l o • C-- Mw 5P C>
rr« O • • • I • I
•HrH•rl
o H o O O r-l <*\ c* N w H rH
CH (-.
a jt
an%
•• I
ho a«>h i.* t uo •» M » to r-l o o* m t^ o -* CT> oo O 1 c\ l»\ r-4 IA o m (M o r-l r- o ir-n»\ •a o liotJ r-t >
4
-J o O O r-l w r-l m M o r-l Q
8 .•-i
«
I *
4a <» 4s> a •o
0) •
-H 4)
OKK
i•rl +»p o
§£X) (I'
Vt +>O J-1 u n to O -* rH H t'* iH -* -* m o •»->
•rl r-l r-1 r-l r-t r-< ^t i-t or-t
a10 4)
4> r4J3 +J
oc
UC/J
1a m
§5 Oco
Ma£3 -H
«• •• at
M t-4
O O
Vnr-Io
•ou«-p 0>
Mi D,
1i-t I r-4
1PO
(4 uO-rtah p Ep P
Us
*> *»
« pwU CO
• P a N 4> « n a n «BCM r« O *l a> u r-l o a D m *i HV a.•«
o *s
a)
x: X!o a
a •j ...
-^ +» p p P +3 » *J +j M r-l vl£ h h n 3 (4 C 3 u « 3 cft
o o 9) o o 41 o 31 1 8BB » (0 SB O CO IS w CO fl
19
Table 3 indicates the rate of development in each district
by total number of counties reporting locker plants, and con-
versely, the total number of counties which did not report
locker plants. The state totals Indicate 62 counties having
one or more locker plants in 1939, 76 in 19-41, 100 in 19U,
and the entire 105 counties in 1946.
Figure 5 is a graphic presentation of the rate of growth
by each section of the state from 1939 to 1946. The results
are comparable to those in Table 1.
Conclusion
Starting with the locker industry in Kansas as it existed
in 1939, it was found that the industry was concentrated in
the central, south central and east central sections of the
state. However, as early as 1939 the industry had been intro-
duced to all areas of the state. Subsecuent years brought a
rapid rate of expansion and growth in the face of World War II
with its resulting shortage of labor, materials, and equip-
ment. Although the Industry was initially concentrated in
the center of the state extending east and south, its de-
velopment in all sections of the state was steady and con-
tinuous and was in proportion to the population concentration
in different ptrts of the state.
The Industry still appears to be in a period of expansion,
the possible extent of which is unknown. Nearly every locker
plant in the state has a large waiting list of prospective

20
a «1
i> h •*
u p1 fl . o O o o o o o o o o
5h o 9U o -> *->
M 1-1
•• ia «i o-rl 3 •H«J O v +J
ll £ 1 o M r-< o rH o o r-l o w\ hV> o
a. H Hmm
to
••
oa41 •H H +»
8
1 1
j
1
Htn «0 c- -o r-l r-l r-l rH H oM d
»
3u
^ 4-1
at
o,
O IT »n <n to w\ <"\ CM •n C* >n c\ 01
(A b -* a«J • .-j
t>H •»
H • h
ft*aM
W O i a O -* H H O M -* -t if\
5,HrH § r-l H rH r-l rA rH rA otJ X a H r*
T> 'J H •rl
o 1H »•
•H •
4-1 « 5H
» r- l«N r-l O O H fn -* O "i
S3rH H rH r-l r-l r-l rH o
rH •
0.&- H o0)rHE « >
• I y
S3 rl4->
HIT* rH r~ >f\ O Oi o t^t rr, < Q
»<0 C :* rH 1-4 r-| r-l rH r- a •
l)rl 3 -i 2^d » .. *iOHO5S V*
o m <^\ H N0 O CO r-l vO M o cv 41 •>
•HH 9 H rH vO d u• H -H 0)
H o 4] XI
n n ss £ fl«>4-l ^5•h a If) -->
,-. a) u o o Bj
g£O -H -H
to o -» H rH <*\ r-l -* -t >Am 0)
O . d-H -»J H H r-l l-l rH rH rH o iO
U M o 3 n -H •o »I a o -h ,
"J
4-i.S* o •o Mo u 01
o U MVi-H
11
9I rH r-l t i4J*> -1 « «t rH o «j o>
fi BO -H
Kex t, p «j *> d a *> *> •U ID
• 0) W a s 1/1 0> 4) a§
0) 01 U CO(<% r. M « 1> o r-l o a a a rH
•H • u • 19 V o 01 «i a«a G."0 5 *->
J3 5 p jd 3 p 5 92 E h n 3 (4 C 3 h n 3 d• o o 01 o « O O
iSo a
H 95 ^ to ss o to CO «

joqumn

22
petrous who are unable to rent a locker box. This condition
has been an incentive for many plants to expand their facll-
ltles. Hisay locker boxes have been rented to city patrons
during the War, who rented the box primarily to combat the
shortage of meet supplies. Many of these patrons now find
the locker box economical and a convenient method of storage
for their fruits and vegetables. The future action of this
group of patrcns may have considerable effect upon l'uture
expansion of the locker plant industry in Kansas.
TRENDS IH TAHH AflD LOCAL SLAUGHT1J-. IB KAHSAB
Farm Slaughter
Farm slaughter Is the estimated slaughter on the farm for
home use and for the sale of meat. 8 yearly farm slaughter in
Kansas Is sho*n in Table 4 for each class of livestock for the
period 1930 to 19*5 inclusive. The average yearly farm
slaughter for the entire period of 1930 to 1945 also Is indi-
cated In Table 4. The most significant thing indicated by
Table 4 is the relatively constant number of head slaughtered
in til classes of livestock from 1935 to 1915.
Figure 6 Indicates the trend of f&rm slaughter in Kansas
for the period 1930-1945 by classes of livestock. Yearly
aBureau of Agricultural Economics, United ttates Department
?£«*?, ulture»
"u«a t Animals, Farm Production end Income."1935-41 fcummary. p. 2. April, 1942.

23
fern slaughter totals of Table 4 mere combined In Fig. 6
Into three classes of livestock. This represented the com-
bining of cattle and calves together in one class and sheep
and lambs together in another clf.ss.
A significant feature of Fig. 6 is the large volume of
farm slaughter of hogs during the early 1930' s. Slaughter
of sheep and lambs appeared to be relatively constant during
the entire period. Farm slaughter of cattle I nu calves In-
creased during the later 1930' s reaching a peek of 35,000
heed in 1938 and decreasing thereafter to 28,000 head in 1945.
Local Slaughter
Local slaughter includes both wholesale and retail
slaughter of livestock originating within the state. 9
Table 5 indicates the yearly local slaughter in Kansai
for the period 1930 to 1945 for each class of livestock.
There *ere extreme fluctuations in the loci.1 slaughter of
hogs from year to year. Local slaughter of other classes of
livestock was rather constant up to 1941*
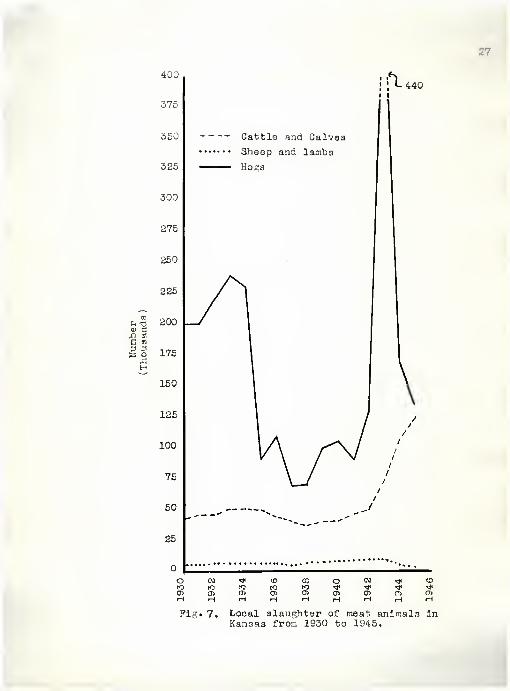
Figure 7 Indicates the trend of local slaughter in Kansas
for the period 1930-45 by classes of livestock. Yearly local
slaughter totals of Table 5 were combined for cattle end
calves and for sheep and lambs to Eake up the three classes of
livestock aho*.n in Fig. 7.
'Bureau of Agricultural Economies, loc. clt.

24
Table 4. Farm slaughter of rseat tnimcls in Kansas (bythousand head) , 1930-194*.*
Sear Cattle Calves B*| I Sheep '. Lambs
1930 10 12 360 2 31931 12 14 400 2 31932 15 11 424 3 5
1933 10 20 420 3 51934 10 20 400 3 51935 13 21 275 2 31936 13 20 255 2 31937 15 19 215 2 31938 15 20 215 2 31939 14 17 243 2 31940 13 17 255 2 31941 13 16 225 2 31942 13 16 235 2 31943 13 14 265 3 11944, 13 15 225 2 319452 13 15 225 2 3
Average1930-1945 12.8 16.7 289.8 2.3 3.2
^-Bureau of Agricultural Economics, United BtatM i Departmentof Agriculture, "Meet Animals, Form Production and Income."1930-1945.
Preliminary estimate of figures for 1945.

25
Table 5. Local slaughter of meat animals In Kansas (bythousand head), 1930-1945. *•
Year Cattle Ci.lvesI
; rfOgS Eh°ep Lambs
1930 30 12 200 2 21931 33 12 200 2 21932 34 11 220 2 41933 35 15 240 2 41934 35 15 230 2 41935 35 14 90 •
41936 32 12 110 2 41937 28 12 70 2 31933 26 11 70 2 41939 27 13 100 3 41940 28 13 105 3 51941 32 14 89 3 61942 35 15 130 4 61943 53 16 440 4 61944, 72 35 170 1 419452 93 32 135 1 2
Average1930-1945 39.6 15.3 162.4 2.3 4.0
^-Bureau of /gricultural Economics, United States Departmentof Agriculture, "Meat Animals, Farm Production and Income."1930-1945.
Preliminary estimate of figures for 1945.

26
Cattle and calves
Sheep and lambs
Hogs
oj <« a
3 9 3 3
Fig. 6. Farm slaughter of meat animals InKansas from 1930 to 1945.
IT
B
e n
K O
400
jjL 440
3751 1
350 Cattle and Calves
325 ^-^— Hosts
300
275|
250
225
j
200
175
150
\125
\
/
/ // /
100 / /
75
50"' **»-. __--
/
25
o0>H
CV)
lO1934 1936 1938 1940 1942 1944 1946
Pig. 7. Local slaughter of meat aniraal3 inKansas from 1930 to 1945.

28
Several significant facts are indicated in Fig. 7. In
the esse of hogs, the high slaughter peak in 1933 was not
surpassed until 19-43 when the local slaughter rose abruptly
to MO, 000 head. A sharp decline in 1944 followed when
170,000 head were locally slaughtered. These two years mark
extreme fluctuations in the local slaughtering of hogs in
Kansas.
Local slaughter of cattle and calves began to increase
in 1942 and made a steady and continued increase up to the
last available figures in 1945. Sheep and lamb slaughter was
rather constant throughout the entire period up to 1943,
when the local slaughter of sheep and lambs started to decline.
Comparison of Farm and LocalSlaughter by Classes of Livestock
Cattle and Cclves. The trends in firm and local
slaughter of cattle and calves are indicated in Fig. 8. Th«
significant feature was their inverse relationship from 1938
to 1945. Several factors may have contributed to this ten-
dency. As the locker Industry and the small slaughter plant
industry developed, it probably became more convenient and
more econocicj.1 for the farmer to hire the plant to slaughter
his animtl and prepare It for the locker, thus causing •
gradual decrease in the amount of farm slaughter and en in-
crease in local slaughter.
MtAM* Ihe relative trends of farm and local slaughter

29
of hog* are indicated in Fig. 9 for the period 1930-1945.
The wide fluctuations in local slaughter of hogs have al-
ready been discussed. Farm slaughter of hogs reached a record
of 424,000 head in 1932. Since 1935, the farm slaughter of
hogs has fluctuated evenly botfteen rather narrow limits.
Sheep and Lambs . Farm slaughter and local slaughter of
sheep and lambs is not important in Kansas. Figure 10 indi-
cates the relative trends of farm and local slaughter of
sheep and lambs in Kansas for the period 1930-1945. Due to
the large scale used in Fig. 10, the fluctuations appear to
be exaggerated. The most significant trend wks the steady
increase in local slaughter of sheep and lambs from 1937 to
1942, fchen it leveled off at 10,000 head per year and then
started to decline sharply in 1944.
SLAUGHTER ESTAJiLIfsnlUHTS LH KAHSAS
On September 1, 1946, Ktnses had a total of 282 slaughter
and packing plants licensed tnd in operation. Twenty-one of
these plants were federally inspected. 10 The remaining 261
plants consisted of 48 plants operating under state in-
spection and 213 small slaughtering plants which mere licensed
^Correspondence with Mr. C. A. Jerand, Bureau of AnimalIndustry, United States Department of Agriculture, LivestockExchange Building, Kansas City, Missouri, November 19, 1946.

30
<M * d* * •*
3 0>H a
Pig. 8. Farm slaughter and local slaughter
of cattle and calves In Kansas,
1930-1945.

31
...... ^arm slaughter
jooal slaughter
Pig. 9. Farm slaughter and local slaughterof hogs In Kansas, 1930-1945.

10
9
8
7
§3
S 4
3
2
1
o
Fig
Farm slaughter
Local slaughter
•* <o co O 01 •tf <on to to * « ^< *n> CT; o> 0> Ol 0> o>H ^ H H H H H
10. Farm slaughter and local slaughterOf sheep and lambs In Kansas, 1930-45.

33by the state end issued a permit to slaughter. ll
Of the 379 locker plants In Kansas, 102 operated a
slaughter plant in conjunction with the locker plant. Of
these 102 locker plants with slaughter facilities, 20 plants
wore under state inspection, 68 plant* sere licensed and
issued a permit to slaughter by the state, and 1A plants
were not listed on the records of the Kansas State Board of
Health. Soae of these plants were only recently opened,
end it is possible that they are now slaughtering under
license and permit of the State of Kansas. Thus, the total
packing and slaughtering establishments in Kansas on Septem-
ber 1, 1946, was unofficially 296 plants. The major portion
of study of this manuscript was concerned with those
slaughter plants that were operated in connection with a
frozen food locker plant.
SURVEY OF LOCKER PUNTS IN KANSAS OPERATING IN CONJUNCTIONRBI A SMALL SLAUGHTER PLANT
Introduction
The major portion of this study was concerned *lth cold
storage locker plants in Kansas which operated their own
slaughtering facilities. In an ecrlier section of this
Correspondence with Jir. Evan Wright, Director of Foodand Drug Division, Kansas State Board of 'Health, Topeto.Ktnsas, September 30, 19*6. 'iwpel"-»

34
study. It ets pointed out that there were 379 cold storage
locker plants operating In Kancas as of September 1, 1946.
It was found that 102 of these cold storage locker
plants operated their own slaughter olant. This figure was
derived from several composite sources: (1) Mr. F.van fright.
Director of Food end Drug Division, Kansas State Board of
Health, Topeka, Kansas} (2) Mr. H. L. Collins, State Agri-
cultural Statistician, Bureau of Agricultural Economics,
United States Department of Agriculture, Topeka, Kansas;
(3) a previous survey conducted by Mr. M. L. Otto, Depart-
ment of Economics un. Sociology, Kansas State College, and
(4) by direct correspondence with the plant operators.
A questionnaire was mailed to each of the lOi. plants
and was followed In two weeks by a tracer to those plants
not yet reporting. Thirty-six plants returned ques-
tionnaires with varying degrees of completeness. Fourteen
additional plants were visited and similar information was
gathered as on the mailed questionnaires. This represented
a return of 35.29 percent by cuestionnaire and 13.73 percent
visited for a total sample of 49.02 percent.
This survey cannot be considered as a true random and
statistical sample because of the method and procedure of
obtaining the sample. However, the sample is sufficiently
large to indicate a representative cross-section of the
Industry.
Figure 11 indicates the geographical location of the 102

3J
p cJ3 fH •u PS -P3 •p •HCl <l> m-t Kh •Hin • >
T! 0)
fl Q) U rH+> > i-\ Cl
•H •H el nft 0} C o
r> n mCO <i> o ^H-> ^ •H Q>
c P ool fl> UJ
rH Jh 0) ^U 3 J>
ft o*Jh Tiri d t>> 0),SJ +' ,U fi
o (71 •Ho •n 01 01
rH +J •Pn 01 £
*n c T* OC)
o n bU 01
4-t o C *»
f-t O J^ (D
O P *3 P
o®#

36
plants studied in Kansas. The majority of the plants are
concentre ted in south central end northeastern Kansas. The
field trip »«.s planned to cover a section of the state ahich
was not iide -uately represented by the return of mailed
questionnaires.
Due to the fact that many plants did not completely fill
out the mailed questionnaires, the number of Dltnts included
in each phase of the study varied and summaries for each
phase did not necessarily include identical plants. For
each Individual sub-topic, only those plr.nts providing
complete data on that particular phase, wore considered as
plants reporting.
This fact «ill prevent an accurate comparison of re-
sults of one phase of study with that of some other phase.
Considering each subject in its entirety, according to the
plants reporting on that particular phase, it is possible
to draw conclusions for each individual subject considered.
Type of Ownership
The fifty plants surveyed reported their types of owner-
ship as shown in the following illustration!
Ty:..e of ownership : Muster :Percent of
': of glints i plants reporting
Individual proprietorship 25 50Partnership 20 40Corporation 5 10

37
The nature of this type of business lends its adapt-
ability Roll to all three types of ownership. However, it
is significant that only 50 percent of the total number
surveyed were operated under individual proprietorship.
The reletively large proportion of partnerships may be
due to two contributing factors. First, a locker plant ttlth
slaughter facilities represents a rather large investment
in plant facilities and overhead end operating expenses are
high. In most small communities where these plants were
located, it was undoubtedly necessary in some instances for
a partnership to be iormed to finance the project. Second,
this type of business lends itself to partnership because of
the varying skills or degree of experience which each partner
is able to contribute. In some cases, one of the partners
had been a country butcher all of his life; thus, he wes in
charge of the slaughtering end of the business. In other
coses one of the partners may not have had experience but
was able to furnish the capital and became a "silent partner".
Still other cases found one partner particularly experienced
in locker plant and refrigeration problems.
Four of the five plants that *vere corporations originated
as small country packers that gradually grew and eventually
added locker plants. The one plant not in this category is
a cooperative. Although there ere a considerable number of
cooperatively owned and operated locker plants in Kansas,
there are only three cooperative plants which operate complete
locker plants end slaughter facilities.
38
Year of Plant Opening
The year the locker plant was opened Tor operation was
tabulated separately from the year the slaughter plant was
opened. This enabled a study of the Individual plant to
see if it establlsned its locker plant first and later
added a slaughter house as the demand for complete process-
ing increased or whether the locker plant was added as an
additional function of an established small country packer,
or whether the plant *»s constructed for both types of
facilities when the plant was opened for operation. The
latter Is particularly true of the new plants that have
been constructed since 1940.
Table 6 shows the opening year of the locker plant and
of the slaughter plant of 45 plants reporting. It is ap-
parent that the two phases of the business have developed
hand In hand. The locker industry's growth is largely con-
tained in the last ten years. With the exception of four
slaughter plants, which had been in operation for a number
of years, the slaughter plants have also largely developed
in the last ten years, with particular emphasis on the de-
velopment of slaughter plants in the last five years.
The 45 plants reporting were classified on the basis
of facilities in the plant at its original opening. The
following tabulation shows by number of plants, the
39
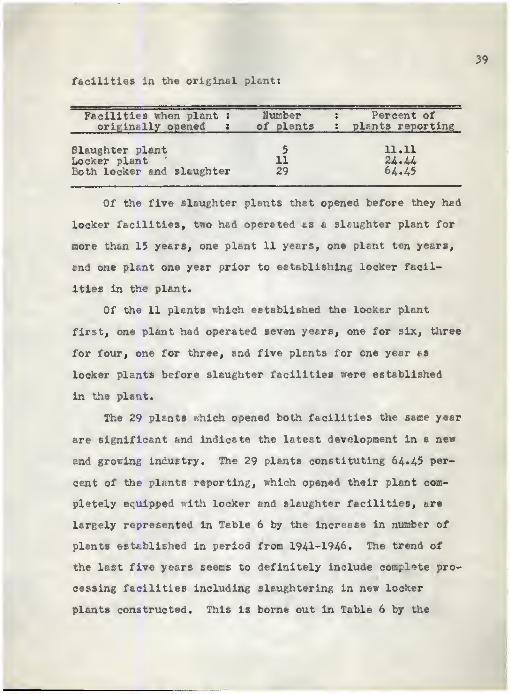
facilities in the original plantj
Facilities when plant J Number : Percent oforiginally opened t of plants ; pl;:nt3 reporting
Slaughter plant 5 11.11Locker plant 11 24. 44Both locker end slaughter 29 6,4.45
Of the five slaughter plants that opened before they had
locker facilities, two had operated as a slaughter plant for
more than 15 years, one plant 11 years, one plant ten years,
and one plant one year prior to establishing locker facil-
ities in the plant.
Of the 11 plants which established the locker plant
first, one plant had operated seven years, one for six, three
for four, one for three, and five plants for one year as
locker plants before slaughter facilities mere established
in the plant.
The 29 plants which opened both facilities the same year
ere significant and indicate the latest development in a new
and groeing industry. The 29 plants constituting 64.45 per-
cent of the plants reporting, which opened their plant com-
pletely equipped ".1th locker and slaughter facilities, are
largely represented in Table 6 by the increase in number of
plants established in period from 1941-1946. The trend of
the last five years seems to definitely include comj.l»te pro-
cessing facilities including slaughtering in new locker
plants constructed. This is borne out in Table 6 by the

40
Table 6. Frequency distribution of locker plants withslaughter facilities In Kanss s, based on the open-lng year of operation of theof the locker plant.
1
slaughter plant and
: number of t Nuir.b-.-r of1 •
ir 1 slaughter t locker plants
1 plants ouened : opened
1929 (and earlier) 31930 11931193219331934 119351936 2 21937 21938 219391940 21941 31942 31943 5
1944 51945 71946 10
Total 45 45
^Data obtained from survey of locker plants withslaughter facilities in Kansas, 1946.

41
fact that of the 45 plants, 35 of them, or 78 percent,
established their slaughter facilities since 1940.
Location of Plant
Slaughter PUnt . The location of the slaughter plant
may reflect greatly upon its efficiency. Of 4? plants re-
porting, 31 had their slaughter plant within city limits, 16
were on the edge of town or city and two were In the country.
The large proportion located in town reflects upon the ability
of the operator to meet city sanitary requirements and not be
a health detriment to the community. The operator who has
his slaughter plant located in town, in most cases, enjoys the
advantages of city v.s-ter, electricity, and sewage disposal.
It Is interesting to note that of ell plants reporting In this
survey, none of the recently constructed slaughter facilities
was located In the country. In some cases local city regu-
lation prohibits the slaughter of meat animals within the city
limits, In which case the plant was forced to the edge of
to*n for operations.
Loc-ker Plant In Respect to SlfeW.hter Plant . Of 47 plants
reporting, the location of their locker plant in respect to
their slaughter plant Is summarized as follows:
i Same« building
i Adjoining :
i building i
Dlstancre of separationup to t mile: f - 1 nile
No. of plants 24 3 6 9

42
Nearly 50 percent of the plfnts reporting hcd their
locker plant en& slaughter plant in the same building. Jin
additional eight plants had their locker plant in an attached
or adjoining building to their slaughter plant. These two
groups represent those plants which are located in town or on
the edge of town. The 15 plants which tre not located in
the same or adjoining building are those plants in which the
slaughter plant was in the country or at the edge of town.
One plant had both its lockor and slaughter plant under one
roof una. located at the ed^e of town. This explains the dis-
crepancy of one plant in the preceding co&parlson.
In a majority of the cases, the locker plant was a fore-
runner of the slaughter plant and it was natural to locate
the locker plant vithln the city limits so as to be convenient
to the patrons and to allow the plant the use of city
utilities. *ith the rapid development of the slaughtering
facilities in many of these plants, the ideal location was on
the same building lot as the locker plant, providing city
regulations did not prohibit such a location. Plants so lo-
cated are more adaptable to better sanitary practices as
water and electricity are plentiful) in most cases, city sew-
age disposal is available; and lastly, the plant is close to
the scrutiny of the public eye, which can be a compelling
factor in causing the operator to use sanitary practices and
to slaughter livestock of desirable condition and health.
Slaughter plants located in the country, in most cases.

43
have to operate without service of complete utilities.
Abundant water is an absolute necessity in slaughtering; in
many cases in the country it is not sufficient. Drtinage of
water and refuse from the slaughter premise in the country
is often woefully inadequate, thus contributing to an unsani-
tary environment for the slaughtering of meet animals. A
plent located in the country without the benefit of an abun-
dant supply of hot and cold water and sufficient drainage to
keep the plant cad surrounding grounds in a dry condition, has
difficulty in achieving the desired sanltf.ry standards in
slaughtering.
Facilities
Hot V.a.ter. The importance of hot v.ater in a slaughter
plant can not be over emphasized, ftlthout hot water to melt
the grease and tallow, the floors and walls cannot be
adequately cleaned, regardless of the nature of their con-
struction. Forty of the 49 plants reporting had hot water,
while nine plants had only cold water. Plants not having
such facilities will undoubtedly find it increasingly diffi-
cult to meet the sanitary standards required to Keep their
permit to slaughter from the State Sanitary Commission.
Rwment Floor . The floor of the slaughter plunt must
be made of concrete If it is to resist the decaying action
of slaughter refuse and be cleaned easily at the end of the

uday. This feet was v.ell appreci;. ted by the plants in Kansas
reporting in this survey. Of the 49 plants reporting, 48
had a concrete floor, and one plant reported part of its
floor being concrete, the extent of which was not determined.
Although the material in the construction of the walls was
not studied among the plants surveyed, it is important. In
the killing and skinning room especially, the walls should
be made of a smooth and rather impervious material ivhich can
be easily cleaned.
Settllnr Tank. Only 23 of 49 plants reporting, had a
settling tank or a blood trap in their slaughter plant.
This included plants using both the city sewer and the septic
tank for sewage disposal. It is advisable for some sort of
a blood trap or settling tank to be used in either form of
sewage disposal, but it is especially important for those
plants using a septic tank for sewage disposal. The waste
grease and tallow which are washed into the drain when the
floor and walls are cleaned, a ill soon clog a septic tank if
most of the solid and greasy refuse are not settled out be-
fore the sewage reaches the septic tank. Plants that have a
septic tank without proper traps and settling tanks, find it
necessary to have their septic tank cleaned cut often. This
is expensive, a disagreeable Job, time consuming, and shuts
down slaughtering operations.
Se<.ai:e . Of the 49 plants reporting, 17 used a septic
tank system, 30 were connected to city sewer, and two

45
reported they had neither type of sewage disposal. The kind
of system used is, of course, dependent upon the location
of the slaughter plant. However, it is undesirable for cny
slaughterer to continue to operate .vithout some sort of
sewage disposal. Without such, sanitary conditions would be-
come intolerable, especially in the summer months. The two
plants that reported no sewage disposal were both located on
the edge of tovsn, one of them doing an average volume of
business. It is possible that all blood and waste of these
two plants are trapped and hauled away. This would still
leave the floors dirty, or the yards in undesirable con-
dition from flushing out the slaughter house.
Kefrjuration. The plants surveyed were asked whether or
not their slaughter plant contained a chill room or any kind
of a refrigerated house. Thirty-nine plants reported their
slaughter house had refrigeration, while ten plants reported
they did not. These results are not too significant as such,
because several of the pltnts which ere located under one
roof, have a chill room in the locker plent which also can
serve their slaughter plant. Thus, plants not having a chill
room in their slaughter house may use the chill room facil-
ities of their locker plant.
Investment
Locker ?l^nt . Twenty-nine pltnts reported their

*6
investment In locker plrnt and facilities, by investment
in the building and lot and investment in the plant equip-
ment. Table 7 shows the frequency of plants reporting which
fell .-.'lthin different Investment intervals for building end
lot and for plant equipment. It Is noted In this table that
under building and lot, the mode is in the 45,000 to £10,000
interval. Thirteen of the 29 plants reporting fell slthin
this interval. There Is a wide range of investment in
locker building and lot, ranging from four plants having an
Investment of 51,001 to $2,000 up to one pleat In the invest-
ment interval of $35,000 to $40,000.
Investment In locker pUnt equipment is also shown in
Teble 7. The mode Is again within the Interval of $.5,001 to
510,000. The range of the 29 plants reporting varied from one
having locker equipment Investment of 4500 to 81,000 to one
plant having between *30,000 and 140,000. By referring to
column one of Table 9, the fr< quency of locker plants in
varying investment intervals Is obtained for total Invest-
ment In locker plant, lot, and equipment. Using the data fur-
nished by the 29 plants who reported their Investment in
building and lot and in equipment, and supplemented by seven
additional plants *ho reported one total figure for their
locker plant Investment, the total Investment in locker
plant and locker plant equipment for 36 plants was obtained.
This investment in locker plant end equipment, exclusive of
the slaughter plant and equipment, ranged from $5,000 to one

47
plant having en investment of £70,000 to $80,000. The
node is in the group having a total locker investment of
$10,001 to $15,000.
Table 10 indicates the average investment of each
locker plant reporting for the building end lot, the equip-
ment, and the total locker plant investment. The 29 plants
reported a total investment in building and lot of $288,085
or an average of $9,933.96 per plant. The 29 plants re-
ported • total Investment in locker plant equipment, which
included refrigeration equipment, of $282,900 or an averagw
of $9,755.17 per plant. One cannot help but note ho* close
the investment in building end lot is to the investment in
equipment, both for the total of 29 plants and for the av-
erage plant. By calculating the data of the total of 36 plants
furnishing investment data on their locker plant and equip-
ment, the total investment of 36 plants reporting is $719,085
for an average of $19,974.58 per plant for locker plant
building and lot and locker plant equipment.
fighter plant . Twenty-one plants reported their in-
vestment in slaughter plant building and lot. Many plants
were unable to break this figure down as their locker and
slaughter plant were contained in the same building; however,
their investment figures are later calculated in the total
investment figures. The frequency of plants having varying
investment in slaughter plant and lot and in slaughter equip-
ment is given in Table 8. Of the 21 plants reporting, the

48
Table 7. Frequency distribution of locker plants In Kansasbased on estimated Investment in buildings, in-cluding lot, end in equipment.
1
;
"
Jluic'ucr of I li.uts
Investment Interval I Building : Hurti f.nd lot : eculpment
« 500 1,000 11,001 2,000 4 12,001 3,000 13,001 4, 000 4 2
4,001 5,000 45,001 10,000 13 11
10,001 15,000 2 415,001 20,000 1 A20,001 25,000 2
25,001 30,00030,001 35,000 2 1
35,001 40,000 1
Number of plants reporting 29 29
^Dtsta obtained from survey of locker plants with slaughterfacilities in Kansas, 1946.

49
Table 3. Frequency distribution of slaughter plants in XensaBoperated in connection v.ita a locker plant, based onestimated investment in building including lot, andin equipment.
Investment IntervalNumber of slants
Building i Plantand lot i equipment
i 100251501751
1,0012,0013,0014,0015,00110,00115,00120,001
250500750
1,0002,0003,0004,0005,000
10,00015,00020,00025,000
1
2
10
Number of plants reporting 21
2
5
3
32
113
19
Data obtslned from survey of locker plants with slaughterfacilities in Kansas, 1946.

50
Table 9. Free uency di strlbution of locker plt-nts withslaughtering facilities in Kansas, b» sed on es-tiiaated lnve itraent in total locker plant facil-Ities, total slaughter plant, facilities, and com-blned Investment of the two i.
: Busbar of plr.nts
t : I Locker and> Locker t Slaughter « slaughter
Investment Interval : plant and 1 plant and i plant and« facilities t facilities J facilities: : : combined
| 100 500 5501 1,000 5
1,001 2,000 62,001 3,000 63,001 4,000 14, ooi 5,000 1 1
5,001 10,000 7 2 410,001 15,000 9 1115,001 20,000 6 3 8
20,001 25,000 5 325,001 30,000 1 1 430,001 35,000 2 335,001 40,000 2 5
40,001 50,000 2 1 250,001 60,00060,001 70,000 170,001 80,000 1 1
30,001 90,00090,001 100,000 1
Number of plants reporting 36 30 U
Data obtained from survey of locker plants v.lth slaughterfacilities in Kansas, L946.

51
Table 10. lotal and average investment of locker andslaughtertlcs.l
plants in Kansas, by types of facili-
: Number : Total : AverageFacility 1 of plants : value of : value
t reporting : all plants : per plant
Locxer plantluildlng and lot 29 6 233,085 # 9,933.96Equipment 29 282,900 9,755.17
Total locker plantinvestment 36 719,085 19,974.58
Slaughter plantBuilding and lot 21 84,900 4,042.85Equipment 19 34,700 1,826.32
Total slaughter plantinvestment 30 185,500 6,183.33
Total investment inlocker and slaughterplant combined 44 1,174,950 26,703.41
Calculated from data obtained froa i survey of lockerplants with slaughter facilltles in Ke nsas, 1946.

52
ode III In the group of ten plant* which had an invest-
ment of $1,001 to $2,000 for the slaughter plant building
and lot. Four plants *ere below 81,000 and six plants
were over #2,000 with t*o plants in the $20,000 and above
class.
Nineteen plants reported their investment in slaughter
plant equipment. The mode group of five plants had en in-
vestment of $251 to $500. This tends to bear out the fact
that a small slaughter plant does not need a lot of expensive
and complicated equipment.
The frequency of plants in varying Intervals of total
investment in slaughter plant and equipment is sho».n in
Table 9 for the 30 plants reporting. There were two mode
groups of $1,001 to £2,000 and $2,001 to $3,000. Twelve of
the 30 pl&nts reporting had a total investment in their slaugh-
ter plant and equipment of tl,000 to 53,000. The effect of
several ltrger country packers can be ascertained from Table
9. Total investment in slaughter plant and facilities of
five plants is more than $15,000 which can hardly be com-
pared with the mode of the 30 plants or the average of all
the plants reporting.
Table 10 indicates the total Investment of ell jlants
reporting and the average plant Investment in slaughter plant
and slaughter equipment. The total investment in slaughter
plant and equipment of 30 plants reporting was $135,500.00
or an average of $6,183.33 per plant. It must be noted

53
again that this relatively high average Investment per pit nt
is due largely to the four or five plants which f<ill within
the high investment Intervals in Table 9.
lotal Investment . In column three of lable 9 the total
Investment of locker and slaughter plants v<ith equipment is
combined. The mode iells in the Interval of 110,001 to
$15,000 with the median In the interval of $15,001 to €20,000.
Of the 44 plants reporting, 11 had a total investment of
$10,001 to $15,000 and 24 of the 44 plants reporting had a
total plant and equipment investment of $20,000 or lees with
20 plants having a total investment in excess of $20,000.
Of these 20 plants, three had a total Investment of $60,000
or higher. Hera again a few plants that were operating on
rather a large scale caused the total investment and the
average plant Investment for the group of plants reporting,
to be considerably higher.
The last item in lable 10 indicates the total invest-
ment of 44 plants reporting and the average Investment per
plant. The total Investment oi 44 reporting plants In their
locker and slaughter plant and facilities combined is
$1,174,950.00 with an average of 826,703.41 total investment
per plant. Even though this average plant Investment is
higher than the majority of the plants because of the in-
fluence of several large plf.nts included in the total end
the average, it can be seen tViat each individual plant has a
considerable investment, ana the industry as a v>hole

54
represents an important segment in the total industry of
IkMUt
Although the 44 plants reporting total Investment figures
were not a true statistical random sample, they may be used
as represents tlve of the industry. On this basis, the 102
locker plants operating with slaughter facilities in Ktnsas
would have approximately $2,723,747.00 total investment. The
investment in this industry is significant in the fact that
its rapid growth is such a recent development and with pros-
pects for even greater end more rapid expansion, especially
in tiie addition of slaughter facilities to the locker plants
already established. Furthermore, many of these plants in
Kansas are located In very small communities hhere they stand
out as the largest and leading business establishment in the
community.
Labor
Number Employed . Data were gathered from plants con-
cerning full-time and part-time employees in the locker and
slaughter plants. Table 11 indicates the frequency of plants
distributed according to the number of full-time and part-
time workers employed per pltnt.
Pull-time employees were reported for 48 plants with 13
plants employing two, which constituted the modal group.
Four plants hired no full-time labor, depending entirely upon

55
the owners together with pert-tine help es needed, to
manage and operate the business. One plant reported 16
employees on a lull-time basis. A few large plants caused
the average number or full-time employees per plant to be
considerably higher than the mode.
Of the 40 plants reporting on part-time employees, 15
had no part-time employees and 13 employed one which con-
stituted the mode for those plants hiring part-time labor.
In o.-.ny cases the slaughterer was hired to butcher two or
three days a week end was thus employed on a part-time basis.
The total number of full-time and part-time employees
and the average number per plant reporting were calculated
es shown in the following summary
t
i Number » Total t Average numberType of employees i of plants : number of : of employees
: reporting » employees : per plant
Full-time 44 159 3.60
Part-time 25 34 1.36
The average of 3.6 full-time employees per plant is con-
siderably higher than the mode of two or the median of three
as found in Table 11. The average of 1.36 part-time employees
compares favorably with the median in Table 11 and the mode
for the plants which did employ part-time labor.
These figures in the preceding summary were calculated
on the basis of all plants that reported numbers of workers
employed, and should not be confused ».lth a liter tabulation

56
Table 11. The frequency distribution of locker plants inKansas employing full-time labor and plants em-ploying pert-time labor based on number. of full-time and part-time employees per plant.
*
: No. plsrits . Mo. plantsNumber of employees s employing given J employing given
per plant t no . of full-time : no . of part-time1 employees : employees
4 151 5 132 13 83 9 1A 6 2
12A 1
7 A8 or more 1
Plants reporting A& 40
Data obtained from survey of locker plants »ith slaughterfacilities in Kansas, 1946.

57
Table 12. Frequency distribution by number of plants andnumber of employees, on part-time ani/or full-time employment at varying weekly wage rates inlocker plants «lth slaughter facilities in Kansas.
Keeklj Number of femoloveos t Number of slant!r ftagest Full-tline : ; Psrt-tlrae '• Full- tine j Pi rt-tlme
t 1.00 — 5.00 1 15.01 — 10.00
10.01 — 15.00 1 115.01 -- 20.00 1 5 1 220.01 — 25.00 10 625.01 — 30.00 9 3 3 130.01 — 35.00 16 535.01 — 40.00 66 4 15 240.01 — 45.00 10 445.01 — 50.00 34 4 3 250.01 — 55.00 3 155.01 — 60.00 2 1 1 160.01 and over 2 1
Total 141 31 33 17
Data obtained from a survey of locKer plants withslaughter facilities in Kansas, 1946.
58
which summarizes similar averages tor those plants which
reported their weekly payroll In rdditlon to numbers em-
ployed.
Ap.eklv V,a.:es . Table 12 indicates the frequency dis-
tribution of total employees according to their weekly wage
rate under full-time and part-time employment, and the fre-
quency of plants reporting according to the average weekly
wage paid both full-time and part-time employees.
One hundred forty-one employees were hired full-time by
38 plants reporting. The modal wage group received $35.01
to $40.00 per week. The range of pay for this group is
somewhat limited with 126 of the 1*1 employees receiving
between 130.01 and $50.00 a week. Several plants employed
help receiving payments from the government as "on-the-job
training" and this may have affected wage scales.
Of a total of 31 part-time employees hired by the 17
plants reporting, the modal group received weekly wages of
$20.01 to t25.00. There was a wide range of pay for the
part-time employees. This is a result of many plants hiring
e skilled man to do the sl?ughterlng and paying a relatively
high wage rate or slaughtering fee. In the latter case, the
weekly pay varied with the volume of livestock slaughtered
at the plant in a week.
Columns 3 and 4 of Table 12 indicate the frequency of
plants according to the average v.eekly wage rate of both
full-time and part-time employees. The modal group for the

59
plants employing full-tine employees is 135.01 to 840.00,
which Is identical to the mode when tabulated on the basis
of total employees. The mode lor part-time labor falls in
the group paid $20.01 to $25.00 per week, vhich is also the
some as vhen tabulated on the basis of average pay for
total part-time employees.
Tills consistency of the mode in two distinctly different
approaches of frequency distribution Is significant. It
would appear that this particular sample »as sufficiently
representative and uniform, to correct the discrepancies
usually ccused by a few abnormally smell or few abnormally
large plants.
Exae-rlence . Proper slaughtering procedures and correct
processing methods rerulre considerable skill, end it is
usually to the advantage of the plant and the patron to have
experienced men employed in the plant to perform these oper-
ations.
Table 13 indicates the frequency of plants according to
the average number of years' experience of the full-time and
pert-time employees. Data were obtained on the experience
of the full-time labor employed in 38 plants. The mode fell
within the class having "some" experience. Seven plants re-
ported their full-time help had no previous experience in the
slaughtering business, /nother seven plants reported their
full-time employees had between one and five years' experience.
Thirteen of the 38 plants reported their full-time labor had

60
Table 13, Frequency distribution of locker plants fcithslaughter facilities in Kansas, based on averageyear's experience of the plant's part-time andfull-tine employees.
*
Years of experience Full-time t Part-timelabor 1 labor
7 87 13 13A 121 2
111 7
1-56-10
11 - 1516 - 2021 - 2526 - 3030 and over"some"
Number of plants reporting 33 21
Data obtained from survey of locker plants withslaughter facilities in Kansas, 1946.

61
more than five years experience. Additional plant* <h
experienced labor undoubtedly fell in the classification of
"some" experience because of the failure of the plants to
report a more complete end specific answer.
Of 21 plants reporting on the experience of their part-
time labor, eight plants reported their part-time help had
no experience in the slaughtering and meat packing business,
seven reported they had "some", while the remaining six
plants had part-tine help svith a wide variation in the number
of years of experience. Undoubtedly may plcnts employing
the services of a local slaughterer with considerable ex-
perience, did not indicate this in their answer to this
cuestlon.
Separate Itaff . Some plants had a stafi of employees for
their slaughter plant %hich was separate from the staff *hich
was employed In the locker plant. Of 48 plants reporting, 19
plants reported employees in the slaughter plant v.ere entire-
ly separated from employees in the locker plants with no
overlaplng of duties between the two plants. Twenty-nine
plants reported they did not have a separate staff for the
locker plant and for the slaughter plant. Their employees,
being trained to aork in either, were shifted about as con-
ditions required.
Summary . The industry is affording a considerable amount
of employment as indicated by the average employment of three
to four full-time employees and one to tow part-time

62
38 17141 31
3.71 1.32
employees per plant.
There was a wide variation of wages for the pert-time
labor. This was to be expected because of the wide range in
the time different part-time laborers were employed by
different plants per week.
A complete summary of the plants which furnished com-
plete information is tabulated below:
s Full-ti&e I Part-timeItem ' employees I employees
Number of plants reportingTotal number of employeesAverage number of employees per plant
Total weekly payroll $5,682.00 $1,023.00Average weekly wage per employee 40.30 33.18Average weekly payroll per plant 149.53 60.50
Thirty-eight plants reported a total of 141 full-time
employees being paid a total of 35,682.00 weekly, or a
weighted average weekly mage of 140.30 per employee. The
plants employed an average of 3.71 full-time employees end
had en average weekly payroll of 4149.53 per plant. The
average of 3.71 employees per plant compares favorably with the
avertge of 3.6 in an earlier analysis of 44 plants v<hich were
tabulated regardless of whether or not full infortae tion was
available on weekly wage rates.
Seventeen plants reported a total of 31 part-tine em-
ployees being paid a total of 11,028 weekly, or a weighted
average weekly wage of $33.18 per employee. The plcnts

63
employed an average of 1.82 pert-time employees rith a
weekly payroll average of 460.50. This summary is tabulated
from a different group of plants than the previous summary in
en earlier discussion of labor. Although the average number
of employees per plant is not identical in the summaries of
the tvo different groups of plants, the figure does indlcete
a close relationship.
On the assumption that the preceding figures, calculated
from the plants reporting, are representative of the 102
locker plants with slaughter facilities in Kansas, the follow-
ing estimate of weekly and annual payrolls nay be calculated:
: Full- time : Ptrt-tiueTotal for 102 plants , employees t employees
Total employees 379 136Average weekly payroll t 15,252.06 $ 6,171.00Total annual payroll 793,107.12 320,892.00
The importance of this growing industry in the welfare
of the state is indicated by a total of 379 full-time em-
ployees receiving a weekly fcage of 15,252.06 and a total
annual aage of $793,107.12 on the basis of 102 plants in
Kansas.
Part-time help in Vbm industry would consist of 186 part-
time employees receiving $6,171.00 weekly or an annual total
of #320,392.00.

64
Owner-Operator Labor
Years JmM or Managed Pi^nt. Data were obtained from
46 plants on the number of years which the o*ner or manager
has been associated »ith his present duties in the plant.
Data for 46 plants reporting are summarized belowi
1 Number ol years o*ned or menaced: 1 2 3 A 5 6 7 g 9 10 Over 10
Number of plants ia 7 3 17 3 1 1 A 5
These data are a further indication of the growth of
this industry in the last five years. The modal number of
years as o.vner or manager was one. Seven owners or managers
have had two years' experience, three have had three, one has
had four, and seven have had five years' experience as owner
or maneger. Thirty of the 46 plants reporting had been owned
or managed by the operator for five years or less. Only five
have owned or managed a plant for 11 years or longer.
In nearly til cases, the party concerned was the owner.
However, to metsure the length of service of the manager of
corporate concerns, the Ista were gathered on the basis of
either owner or manager, whichever the case mlfiht be.
Prior Experience in Packing Industry . Data were ob-
tained from 35 plants on the number of years' experience of
the owner or manager in the slaughtering industry prior to

65
entry in the present business. These dftta ere tabulated in
the summary below:
; Number of yei.rs of pr'vlous f^pr-rlt-ncc
i i !} i 10-15 i 16-20 i n-30 : Over 30
Number of ownersor managers 18
These data indicate thi.t owners and managers of more
than 50 percent of the plants reporting had no previous
slaughtering experience. It is significant thet such a lorge
proportion of the present owners have enjoyed apparent success
in a business in which they had no previous experience.
Several of the plant ov.ners visited, reported they
have had experience in large terminal packing companies.
Others had been country butchers lor a great many years.
Volume of Slaughter
Data were gathered on the number of head and total
pounds of hogs and cattle slaughtered weekly in each plant
reporting, v.hen operating at maximum capacity, average nor-
mal capacity, and the weekly average slaughter during the
month of September, 1946.
Maximum £lau,/hter Capacity. Column one of Table U in-
dicates the frequency of plants slaughtering a varying number
of head of hot;s and cattle weekly, If the plant were to be
operated at maximum capacity. The mode lor the group was

66
21 to 30 hogs and ten heed of cattle per week. The median
maximum capacity of slaughter of cattle and hogs was 16 to
20 head weekly for each. Table 14 indicates that a few plant*
have e rather large maximum slaughter capacity and the in-
fluence of these plants tends to raise the median of the group
and the plant average.
Figure 12 is a graphic analysis of weekly maximum
slaughter capacity for hogs and cattle for 26 plants report-
ing. The frequency of plants vlthin different volumos of
capacity is indicated. Figure 12 corresponds to dates in
column two of Table 14 with some alternations in interval.
Figures 12, 13, and 14 each represent a separately com-
piled group of plants reporting in each case. Although there
is some overlapping of plants in the three figures, the 26
plants reporting for each capacity of slaughter are not
identical. Thus, Figs. 12, 13, and 14 should not be considered
as a comparison of different operating capacities of 26
identical plsnts reporting.
Table 15 indicates the maximum slaughter capacity of 26
plants reporting in terms of total number of head and total
pounds live weight per week. A total capacity of 755 hogs
with a totfal weight of 175,756 pounds and 583 head of cattle
with a total weight of 477,756 pounds live weight would be
slaughtered if the 26 plants reporting were to operate at
their maximum capacity. The average weekly maximum slaughter
per plant of 26 plants reporting vould be 29 head of hogs with

67
a weight of 6,742 pounds end 22.4 heed of cattle with a
weight of 13,374 pounds live weight. The weighted average
weight per head slaughtered in the plants reporting was es-
timated at 232 pounds per head for hogs and 805 pounds per
head for cattle.
The potential of tills industry in Kansas is of con-
siderable importance, If it is assumed that the 26 plants re-
porting are representt tlve of the 102 locker plants In Kansas
with slaughter facilities. On this assumption, the 102
locker plants in Kansas with slaughter facilities would have
a maximum weekly slaughter capacity of 2,958 hoad of hots
weighing 687,684 pounds and 2,285 head of cattle weighing
1,874,148 pounds live weight. These figures do not Include
any date for slaughter of calves or for sheep.
/-veraee Weekly Volume Mauehtered. The column entitled
"average capacity" in Table 14 Indicates the frequency of
plants by number of hoad of cattle and hogs slaughtered week-
ly under average conditions. The mode for this group was
between 11 and 15 head of hogs end five heed of cattle. The
median for hogs of 38 plants reporting, was 11 to 15 head
weekly, or the same as the mode. The median number of head
of cattle slaughtered under average conditions was seven head,
based on 39 plants reporting.
Figure 13 is a graphic analysis of Table 14 indicating
the frequency of plants by number of head of i-eeicly slaughter
of cattle end hogs under average conditions.

68
; »soa vD -
t'H -^ 'i *.
•H t. 5 -H d1 H P PlHr4«nOrt rHW-^PM^rH t<N N >j
V) P p O Ma>xsH DC h dp 3 B •rlH £3 .orHrH 1 ••
•H « i «o p H
Ti ^/ *l» C a; M f\ cmn rH IH rH u-wo <r» N rH •rt
1 u> ««> rHM •-
:
i
•Hm a U*><« •
iSvi H •• • MU>-H3« hB hrH (- c *j m ffl III •h -j Co 5 *> «nO"*^N -*^H-«H o ti
5§ MP n 3
•H '-..: •".) rH
«.-'
t; 1/1
h .
23 H I • .dPa v • y(-3 >« WH o M Hrl cm ~»^ rHrHt~- rH»r\r«> rH COa > rH f\
13 h -<> H Pr. V dO r. - 01
X 4'
9•• • rH
o*> Wkox:
*I hR
*H 0) «H •H .«OH O M W (N l/\ CO CM^ ^0 rH 1T| <N O o.. »j -* o
a a .. H"O --
•rl w o <-4
•p IP o3* ••
hH<M 101
t< o 0i E4> >•- 1 r-l rH rH ~*tf\COOrH -*«t o> iin t- , a r-l r"\ I-H 0) i «i
T)£>
<M BrH n ,. ••u)
o d • 1OKkl >> fiO-Oft <-f <Md +» TJ ;*R M-H a <s> 'O3 d o m id a 1Brit r * «i
5hll a«H'CJ 4O J' H ttf J
N ad ar< «> t-i o
• O -P o <m +>-* J3£! lAO O Q 0"A O r, IDH 3^ o p
1 1 1 1 1 u ;- a. fSB uj I I i i I o a i> a •
rH rH O-H IN P> ^rmsO C"- (0 0>OHx|)rtrlrl > a u rH vO
i41 rH rH rH c\< rr, ,}. Q
I-*
H a rH

69
i-l
fa-O *
-o • «* I O *n OP> >o >o<M +3 O rH 33 OH a> M
XlH J ON «o°w
|.«a % II fa..> o rH c
U fa u o -1 pfa H 1 Pi X!1 S.J *J Mm 1 •• 3x! >>a>m fS
-HCM -*C- m o Ha
0^-*f.0H IT. CM n
.-. 41 O c\ r«i
<-> oj 1» fi 5v.; Ss o t*\ ^J-
[Jj rH •HH K
m-* •• •« • u)
o- <o prHrH •
i« I U-\H OO (• •O«W 4> H OW •OrH n OJ rH
« » no <J i\ W o f- O.4' in .0 ~J » •»
x» a fa fa ij fc f- fa
a a T 4> O9a > P a Mp rf J3 oas B •• o4>-H t>»3 r-t
a rH J oa M H • <X
a «> 4> a tf\r-l 33 N •O OC-H I 1 -*>o «n CM.;P o H(n >n (V &«H pa » ^«rH -H e>
a. t-4 o-3•J O •• •• ••
1 J -t Ifa*H i
1 sOrt -4\m m a a> fa
1>r\«) C- !V O cu #
g) <]) -i >m <r\ ao *>P
3*.p ** h o xt
*x! p p- to fa a§ 3
s X 1 10 !• h vi •H«j *> rJ -* 0)
Q « •o i•HrH .i 1H « >i3 omc\ 3S C4 a
if
9 rH 61 r-4>r\ <n en >ax: MM or>- c- C\J 3kp 4) 03 « a Ik p rH
S'H 4) M «\ >o Xt •
5: e» 9 O.0 44
H a vf O<u a H (OCT-*>p T3 tJ •p -P PrH «
*|• *• • CM 4< CM 41 X! fa a •H
X) fa -D fa B O T5 % a4H-H 41 4> 41 •H P. a
JO O. Hi! U +> 4) 1 S £41 U fi i' X! I fa O m
o fa fa « P hd *> *» M> fa a§
3.83 pr. a
3 'jo a• . 1 a
<n d at« 60 P MrH o a «! 3r-| rH 3rl 1 a •o •aO 1 rJ .1 d O. .i; 1/, fa w £5 V» -H 1 O-i-t i-l s H p
in >o fa « "3 >-o O. afa -I iii 4) i a a H «l rH
• rH « ti O, W (U 41 4-1 3 41 3in 13 "J X) tssi •rtx: O O-H oH p
.1
.
41 SU) 3 •
4) rH P rH•h P fa fa e h1 .h o o -< o o £. <S> « O-H oM o al P. as faC-» UJ o- o rH iH CM
xt p 41 •j3
no
SH IH «; in as ^

70
Pig. 12. Preinane jr distribution of 39 looker plants withslaughter facilities In Kansas, for which dataare available, teased on maximum weekly slaughterOf hogs and cattle, 1946

71
rH1
H 16-2 21-3iH
Number c f Head
I'lg- 13. frequency distribution of 39 looker nlantswith slaughter faollltles In Kansas, forwhich data are available, based on averageweekly slaughter of hogs and cattle, 1946.
Hlogs JO at tie

72
o ON to<DO
10 H > torH CM o
Number of Head
Fig. 14- Frequency distribution of 31 lookerplants with slaughter facilities inKansas, for which data are available,based on average weekly slaughterfor September, 1946
Hogs Ecat tie

73
The total slaughter and the avorage slaughter of plants
reporting, was calculated In Table 15. Under normal con-
dition*, the average weekly slaughter lor 26 plants report-
ing was 361 head of hogs i.lth a total live weight of 91,145
pounds had 281 heed of cattle weighing 207,205 pounds. The
average per plant was 13.9 head of hogs weighing 3,506
pounds snd 10.3 head of cattle weighing 7,969 pounds. The
weighted average weight per head of all hogs and cattle
slaughtered by all plants reporting mas 252 pounds for hogs
and 737 pounds for cattle on live weight basis. It is noted
that the \seighted average weight for hogs was higher and the
weighted average weight ror cattle v>as lower for plants re-
porting average weekly volume than for plants reporting maxi-
mum capacity.
These slaughter figures included custom slaughter as
well as slaughter for resale of meat products. All cattle
and hogs slaughtered in the plant, regardless of their dis-
position, fcere considered as the volume handled by the plant.
On the previous assumption that the 26 plants reporting
were sufficiently representative of the industry for develop-
ing trends and estimates, it would appear that th<> total for
the 102 locker plants in Kansas with slaughter facilities
svould, under normal average conditions, slaughter 1,417 heed
of hogs weighing 357,612 pounds end 1,102 head of cattle
weighing 312,338 pounds per week.
The monthly total federally inspected slaughter of cattle

74
end hogs in Kansas for 1944-1945 »'ts obtained from H. L.
Collins. 12 An average weekly total of federally inspected
slaughter lor this period in tltMl was calculated and found
to be 64,723 head of hogs and 24,366 head of cattle. The
ratio of the average estimated weekly slaughter for the 102
locker plants in Kansas with slaughter facilities, compared
to the weekly total federally Inspected slaughter in Kf.nses,
is summarized below:
Number of headFederally s 102 Locker « PercentInspected I slaughter plants
i
Cattle 24,866 1,102 4-43
Hogs 64,723 1,413 2.19
The above summary indicates thrt the estimated average
weekly slaughter of the 102 plants in Kansas is 4.43 percent
of cattle and 2.19 percent of hogs slaughtered under federal
Inspection, using the monthly figures for 1944-45 to compute
en average weekly federally inspected slaughter in Kansas.
The data for federally inspected slaughter included certi-
fied insnected slaughter and federally inspected slaught- r.
September 19Lb Slaughter. Data .vere gathered for
slaughter during September, 1946 to study the effect of price
controls upon the volume of slaughter in the industry.
^Correspondence with H. L. Collins, State Agricultural
rtatlstician. United States Department of Agriculture, Topcka,
Kansas, December 27, 1946.

75
The last column of Table 14 indicates more nearly a
uniform distribution of plant frequencies, arrayed according
to number of head of cattle &nu hogs slaughtered. Although
the mode for hogs was within the slaughter volume of 16 to 20
heed per Meek, it was not a well defined mode. The median
for hogs was between 11 and 15 head per week. The mode and
median lor slaughter of cattle both fell in the interv&l of
11 to 15 head per week. An examination of Table 14 Indicates
that the slaughter of the plants reporting for September,
1946 was above thi-t of average weekly slaughter.
Figure 14 graphs the frequency of plants reporting ac-
cording to their average ».eekly volume of slaughter for
cattle and hogs during September, 1946. These data are taken
from Table 14, which has previously been discussed.
A summary of slaughter is tebulated in Table 15, *ith
442 head of hogs weighing 113,981 pounds and 445 head of
cattle weighing 309,410 pounds being slaughtered weekly in
September, 1946 by the 26 plants reporting. These flgurei
are considerably higher than the slaughter undor average con-
ditions. The individual plant average was 17 head of hogs
weighing a total of 4»334 pounds and 17.1 head of cattle
weighing e total of 11,900 pounds.
Several observations may be made from Table 15. First,
slaughter of both cattle and hogs was higher during September,
1946 than slaughter under average conditions. Second, the
number of cattle slaughtered weekly during September, exceeded

76
the number or hogs slaughtered by the plants reporting.
Third, the weighted average weight per hoj.; of all hogs
slaughtered by the 26 reporting plants was 258 pounds dur-
ing September, 1946, or the highest average weight hog of
the three slaughtering conditions studied. ¥.hile hogs
slaughtered during September were of highest average vreight,
cattle slaughtered during September averaged only 696 pounds
which aas the smallest average weight of cattle slaughtered
under the three conditions studied.
On the previous assumption that the 26 plants reporting
were sufficiently representative of thf Industry for develop-
ing trends snd estiactes, it would appear that the total
for the 102 locker plants in Kansas with slaughter facilities
under conditions during September, 1946, would have had an
estimated weekly slaughter of 1,734 head of hogs and 1,746
head of cattle.
Data were obtained from H. L. Collins 1^ for the federal-
ly inspected slaughter of cattle nd hogs in Kansas during
September, 1946. An average weekly total of federally in-
spected slaughter for this period in Kansas was calculated
and found to be 5,506 head of hogs and 3,557 head of cattle.
The ratio of the average estimated weekly slaughter for the
102 locker plants in Kansas with slaughter facilities, com-
pared to the v»eekly total federally Inspected slaughter in
•'Correspondence with H. L. Collins, State AgriculturalStatistician, United States Department of Agriculture, Topeka,Kansas, December 27, 1946.

77
Kf.nscs, is hummtrlEed belowi
I Uurr.brr of head :
:
Federtlly I 102 locker and t
ins ected : sl;.u,:htcT Dl;.nts :
Percent
Cattle
Hogs
3,557 1,7^6
5,506 1,734
49.09
31.49
The above summary indicate* a drastic reduction of
federally inspected slaughter during September, 1946, while
the slaughter of the locker plants with slaughter facilities
increased over their cverage operating conditions. These 102
plants in Xtnsas slaughtered an estimated number of head of
cattle equal to 49.09 percent of thst slaughtered under
federal inspection and slaughtered an estimated 1,734 head of
hogs which was 31.49 percent of the weekly slaughter of hogs
during September, 1946 under federal inspection.
This summary indicates thet the small plants were not
hurt by the meat shortage as was the large terminal packerj
in fact, slaughter was greater during September, 1946 for the
small locker and slaughter plant, than under normal average
conditions.
CoiflocrlEon rttios . Table 16 contains ratio calculations
of data *hich were presented in Table 15. Column one of
Table 16 measures the average weekly slaughter as percent of
the average maximum slaughter. Using the weekly totals for
the 26 plants reporting, it est found that the average
slaughter was 51.99 percent of the maximum slaughter of hogs

* 76
J 0i
1 A «h V H f\«0 «51 +» 4J 10 •
Q.x! h «« a om •* 43H 41 to 4) V O ~*-tf\ t> tNn W 3 > *> H^l.c .. ..-1 « bm *, *» H M> 0>m Cimj «1
32 o o io n-\e\ w X!OsO H to O -* <^
~> t-l ^ 10 (0 u • • • 3* 41 0^ 10 o ir\cv CM sO to
«• ft. r-l tf X <N w o (N H« r-).-1 H to
IB 3•4
HMJ 01
OO -h B H >Ot*\ vO
feg• o> 3 ** r- w ~* 10vpg u it 43
M H a^flt. O -*xO vO •OiO u> 01 bOH 41 O -O t> a> enW 9 <*>
o 3xiHH a •• Q.
3 «->H 0>l
<o a a to u a llOt-rt A O .0 OJ-+ H Ol
H o-o h w Oai M d<H ..' M -*'. «. • • » oO BH 01 0^ CO o no H NO o
• a. h * ra ~J} va -* tN HIts r-<
<M
Xi <CHO
B| V. (4 b3H « (BOO I)
«J<-> U 60 «* H C-O <i t»H)l .!«d «-» f\r-l •n kn exi blU «-> • • 3- a <- .< 3 a e^eo H -O to
fe £ I > to o »*•-+ e> <No o+> J J-. < 10a 01 in •« •!•• 4J jj a *>
§S M Cxi h* 103
O XJOH ~* t. tdH • ll O 3 S3 •a oco t> Vi «4OXJ O y a a S> *1 UH X o Hr- eo vO "d )»
•»
"•a x «>-* a t\ 1rillM »>o) ax!• ll
H 5 s
i* r-l•o01 X) •
**: 3 •P 60 OnO mv. dnOH to
llo 5-* o
to oO. T3 +J *J !-• r-l 10
C'C-J 0) £ h CO •Hs«s 0) u-a u ns o TJ •O wrJ
3to 41 •H a to j;
U .o XI•OH* »1 w ~ t) iH +> 4> « » o»xl id h O hifciH 4> (0 fi 4J 10 >- : o2-1 * 01 ffl X! 3 «> in <~ .J oan 1 H Uu CO oo +> Mg O-O o. 3H 40 d -O T3jio <w to n i 0 • d •Ov. ia o vO H 0I.-M h
r-) to xl •« <j> >o aII 1 I -t M r-J
• --4 b m o> I <H 3 41 3"9 i o oxi OX! OH oH D ^§ .
i r-l+J i-t<J <-. u «H «
r-l O O *! 0) « . OH O2 -
x>o.a aa XI H H fHhi
Oo> aP H W » a

79
by weight end 47.31 percent by nuiaber of heed slaughtered.
For cattle, tha average slaughter r.as 43.37 percent of maxi-
mum slaughter by weight ano 48.19 percent by number of head
slaughtered. The average weight per head slaughtered on
average weekly slaughter was 108.74 percent of maximum week-
ly slaughter eon-iitions for hogs, and 91.56 percent lor cattle.
Differences between the percentages measured by number of
head and by total weight are explained by the difference in
the average weight of the animals under maximum, average, and
September, 1946 slaughtering conditions.
Column two of Table 16 Indicates the ratios of September,
1946 slaughter compared to maximum slaughter. These ratios
are higher than those of the preceding analysis, indicating
th«.t September slaughter i.r.s larger than the average
slaughter.
Column three of Table 16 Indicates retios of September,
1946 slaughter to average slaughter. In the ratios computed,
it is noticed that slaughter of cattle end hogs, both by
numbw of head and total pounds, is above 100 percent in til
cases in this particular comparison. This further indicates
that the slaughter for September, 1946 was larger in all
respects than was the slaughter under average operating con-
ditions.
September slaughter was 125.05 percent of average
slaughter for hogs by number of head and 122.43 percent by
total pounds slaughtered. Cattle slaughtered during

80
September, 1946 was 149.33 percent of average slaughter on
basis of number of pounds slaughtered, tnd 158.36 percent
by number of head.
The September, 1946 average weight of hogs killed was
102.33 percent of those slaughtered under average conditions,
while average weight of cattle slaughtered during September
was only 94.43 percent of the average weight of cattle
slaughtered under average conditions. These data indicate
that of the comparisons studied, the heaviest hogs were
slaughtered during September, 1946, while the lightest weight
cattle were slaughtered during this period.
Conclusions . The average slaughter per pltnt was cal-
culi ted slightly higher than one would expect after studying
Table 14. Tills was due largely to the fact that several
plants were operating on a rather large scale which tended to
make the averages higher than those indicated by the mode end
median.
A study of Table 14 reveals that the most representative
plant of those reporting had a weekly average slaughter of
11 to 15 head of hogs and five to seven head of cattle a week.
Table 16 indicates th*>t the plants reporting, had en
average slaughter of between 45 and 50 percent of maximum
capacity. This is significant in that it would permit con-
siderable expansion of the output without further expansion
of existing facilities.
Another significant result of this phase of the study

81
was the comparison of the slaughtering volume during
September under price control, with the slaughtering volume
under maximum and average conditions. During September,
1946, terminal packers were forced to curttil operations for
lock of livestock to slaughter, while the small slaughter
plsnt operated in connection with a locker plant, slaughtered
more than under normal condition*.
Source of Livestock Slaughtered for Resale
Data were gathered pertaining to the source of livestock
purchased, which the plant slaughtered for retail or whole-
sale purposes. Livestock custom slaughtered was not con-
sidered in this particular phase of study. It was iound
that the plants obtained their livestock at four sources:
direct country purchase, auction sales, stockyard or terKinal
market, and livestock owned by the slaughterer which was
produced for slaughter in his plant.
Direct Country Purchase . This represented the source
of livestock supplies in part or in whole for 32 plants.
Many plants had more than one source for their livestock
supplies, thus the total of the four sources of supply will
exceed the 35 plants reporting on this particular c.uestion.
Reference to Table 17 indicates that 11 of the 32 plants
purchased 100 percent of their supplies by direct country
purchase. The remainder of the plants had on evenly

82
distributed proportion of their purchBses from this courca
rtnging from a few percent up to 99 percent. Ihis even dis-
tribution prevents the mode end the median from being very
representative, although the mode, as most representative
class, »as 11 plants listed under 100 percent and the median
was 71 to 80 percent direct country purchase. In a majority
of the Instances, the livestock that were not purchased
direct from country source, v.ere secured at auction sales.
.Auction Seles . Eighteen plants reported purchasing
livestock for slaughter for resale from auction sales. The
reporting plants again had a very even distribution of the
proportion of livestock obtained from this source from a few
percent up to 100 percent.
Table 17 indicates the frequency of plants purchasing
different proportions of their supplies from auction ssles.
It is evident that direct country purchases and auction
sales comprise the major source of supplies for the small
slaughter plant.
Stockvard and Terminal Market . Six plants of those sur-
veyed, purchased part or all of their livestock supplies from
the terminal market. In all instances, these plants were
locf-ted nesr a livestock market center such as Kansas City,
St. Joseph, or Wichita.
Table 17 indicates that one plant purchased betneen 41
and 50 percent, one purchased 51 to 60 percent, t»o pur-
chased 71 to 80 percent and two plants purchased 100 percent

83
of their livestock from the nearby terminal market.
These plants obtaining their supplies from this source
are significant in that they era meeting the terminal pecker
on sn even basis and seem to be competing successfully. It
is a credit to the efficiency of these six small plants that
they can enter the open market and obtain their supplies in
competition with the more efficient large packers, end still
dispose of their wholesale and retail meat at a lev^l of com-
peting prices.
Owned bv SU,u.-:hter Operator . Ten plcnts reported that
they owned part or all of the livestock which was slaughtered
in their plant for retail and wholesale purposes. Four plants
owned between one and ten percent of the total they slaughtered
for resale, one plant owned 100 percent, and the remainder
owned varying proportions of the livestock slaughtered in their
plants for resale, as indicated in Table 17.
Livestock Purchased Outslae Trade Territory. Plants
v.ere asked the proportion of livestock .hich was purchased out-
side their immediate trade territory. The results are sum-
marized belowi
s Percent purchased outside trad* territory1
J 1-20 I 21-40 : 41-60 J 61-30 : 31-99 t 100
Number ofplants 37 3 1 2 2 4
Of 49 plants reporting, 37 did not purchase any of their
livestock outside their immediate local trade territory.

34
Table 17. Frequency ells tributlon 3f locker plants withslaughter fac llltles in Kansas by sources oflivestock supplies for slaughter in plant forwholesale end retail purposes. 1
; Kuaiber of plants» Direct : : Stockyard ! 0v,ned by
Percent i country I Auction : and terminal : slaughter: purchase J sales s laarket S operator
1--10 311—20 121—30 231—40 2U—50 1 151—60 1 1 161—70 271—30 2 2 181—90 191—99 2 2
100 11 1 2 1
Total plantsreporting 32 IS 6 10
1Deta obtained fron a survey of locker olants withslaughter facilities in tansfcs. 1946.

85
Eight plants purchased pert of their supplies outside their
trade territory. Four plants obtained all of their supplies
from sources other than their ov.n immediate trade territory.
These four plants were represented by part of those obtaining
their supplies from the terminal market.
The results of this summary verify the fact that the
majority of the locker plants with slaughter facilities,
purchase their livestock from farmers or nearby auction sale*.
Only those located near the terminal market, use it as a
source for the purchase of their livestock supplies. These
sources are directly related to the distance from the plant,
and thus determine whether or not the livestock is purchased
within or .ithout the immediate trade territory of the plant.
Delivery of Livestock to Slaughter Plant
The party responsible for the delivery of the livestock
to the slaughter plant is dependent upon the source of supplies
and the policy of the individual pltnt.
Table 18 Indicates the frequency of plants in different
percentage intervals of livestock delivered to the slaughter
plant by the producer or customer and by the slaughter operator.
In 24 of 44 plants reporting, the customer or producer delivered
100 percent of the. livestock to the slaughter plant. The other
20 plants had varying number delivered to the plant by the
producer. The percent of livestock delivered to the plant by
the slaughter operator wss practically complementary to the

86
Table 18. Frecuency distribution of locker plants *lthslaughter facilities in ."tenses showing percen-tage of livestock delivered by customer and byslaughter operator,!
Percent delivered
Nuab«r of plants
Produceror customer
Slaughteroperator
1—1011—2021—3021—40U—5051—6061—7071—8081—9091—99
100
Total plants reporting
4211
2211
42
uu
243
4122
211
4
44
^Date obtained from a survey of locker plants withslaughter facilities in Kansas, 1946,

87
delivery of the producer. Without discrepancies in reports
of £ few plants, the deliveries of the two parties v.ould be
In en Inverse mathematical ratio.
Twenty-four plant operators do not deliver any of the
livestock, which is complementary to the 24 plants inhere the
producer delivers 100 percent. Four plants deliver 100 per-
cent by the operator himself, and the remaining 16 have vary-
ing amounts delivered by the slaughter operator. In several
Instances, plants reported that they would pick up the live-
stock and deliver it to their slaughter plant, but the farmer
or the patron ..as charged a delivery fee for each head of
livestock hauled.
Source of Slaughter of Meat in Locker Box
The meat which the patron has in his locker box, may have
been slaughtered under three different circumstances. The
livestock may haye been slaughtered on the faro, custom
slaughtered by the plant, or slaughtered by the plant and
sold to the patron in vtholesale or retail quantities. A
negligible amount may have been purchased from outside sources
and put in the locker box, but this is so small that it does
not enter into this consideration.
Table 19 Indicates the frequency distribution of plants
for each possible source in percentage lnterv&ls. The impor-
tance of custom slaughter is immediately observed by the fact

88
Table 19. Frequency distribution of locker plants svithslaughter facilities in Kansas, by various sourcesof supply of total beef and pork contents oflocker boxes.
^
i Huab*r of -l.-r.ts
Percent J : : t'laughtoredslaughtered : Custom : Farm s by plant and
: slaughter : slaughter t sold to pc tron
1 2 251—10 2 29 1911—20 4 321—30 1 5 131—40 2 241—50 2 251—60 4 161—70 4 171—30 9 181—90 1191—99 11 2100 2 1
Total pltntsreporting 49 49 49
xData obtained from a survey of locker plants v.ithslaughter facilities in Kansas, 1946.

89
that 22 of 49 reporting plants custom slaughter between 81
and 99 percent of the total Beet contents of the locker
boxes In their plant. One plant did not do custom slaughter,
its facilities being usea only to slaughter for retail end
wholesale purposes. This plant is an exception end falls
within the limits of this study in that it does operate both
a locker plant and a slaughter plant. The large proportion
of plants falling in the higher percentages of custom slaughter
indicates the favor with Rhich patrons look upon custom
slaughter. The charge for slaughter is small and a much better
Job of sleut?htering and dressing of the carcass usually is
done by the experienced man employed in the slaughter pl^nt.
Table 19 indicates e small proportion of farm slaughter}
of 49 plants reporting, 31 report ten percent or less of the
total meat in their locker boxes is slaughtered on the farm
by the patron. The remaining 18 plants report a Vi.ryinf; amount
of slaughter done on the farm.
Column three of Table 19 shows the relative unimportance
of the proportion of the meat which the locker patron pur-
chases in carcass from the slaughter operator. Tv.enty-1'ive
plants did not wholesale or retail any Beet to their patrons
for storage in locker box and 19 sold less than ten percent.
This would seem to indicate that the slaughtering oper-
ations of the plant are directed largnly towards custom
slaughter. It must be emphasized that the above analysis per-
tained only to the raet.t contained in locker boxes. Some meat

90
¥.08 sold over the retc.ll meat counter in the plant, and Is
considered in 6 later analysis.
Slaughtering Charges
Ho«;8 . I wide variation of slaughtering charges was in-
dicated by the different plants reporting. Table 20 indi-
cates the number of plants, arrayed according to the size of
the slaughtering fee and the various methods of charging for
slaughtering.
Charges for slaughtering of hogs were by the head, by
the pound live weight, and by the pound dressed weight. Eight
of 42 plants reporting, charged by the pound on a live weight
basis. Six of these plants charged one cent a pound end two
plants charged one and one-half cents a pound live weight.
One of the plants charging one and one-half cents a pound,
included services of cutting, wrapping, and sharp freezing.
The weighted average charge for the plants in this group was
one and one-eighth cents per pound on live weight basis.
Only two plants charged on dressed weight basis; one
charged tvso cents per pound and one charged tv»o said one-hslf
cents per pound. The weighted average charge per plant for
this group was two and one-quarter cents per pound on dressed
Reirht basis.
Table 20 indicates that 32 of A2 plants reporting, based
their slaughtering charge for hogs on the per-head basis.

91
Table 20. Frequency distribution of locker plants withslaughter facilities in Kansas, according tocharge for slaughtering tnd the overate
•eporting.*slaughter charge per plant i
8 iNunber of ,
i plrnts racking t Weighted avercgeSlaughter charge * cniT&c : ehari* per pint
i Hogs : Ctttle • : Ho^s : Cattle
Per pound, live weight 40.0112 £0.01001 cent 6 21? cents 23 cents
Per pound, dressed weight 0.0225 0.01501 cent 12 cents 1 12i cents 1
Per head 2.33 3.08U.50 4 12.00 U 32.50 10 53.00 1 33.50 1 44.00 1 35.00 1 2
Slaughter for hide 12
Number of plrnts 42 42
xData obtained from t survey of locker plf.nts with slaughterfacilities In Kansas, 1946.

92
The mode for the plfcnts In this class *as a charge of |2.00
per head. The median also was $2.00 per heed. A wide range
exists between the charges reported lor the various plants.
Of the plants tabulated in Table 20, one plent's figures
need further explanation. The one plant charging $4.00 per
head for slaughtering a hog, included with that charge the
cut, wrap, and sharp freeze services. The plant charging
35.00 per head for slaughtering, charged an additional two
and one-half cents a pound for cutting, wrapping, and freez-
ing. The weighted average charge per plant for this group
was $2.33 per heed.
Cattle . Table 20 indicates that in addition to the three
previous categories of charges for hogs, cattle also were
slaughtered for the hide In some cases. Two plants charged one
c»nt a pound, live weight, for the slaughter of cattle. Of
the t%o plants charging on a dressed weight basis, one charged
one cent a pound and one charged two cents pound for an
average of one and one-hAlf cents per pound on dressed weight
basis.
Twenty-six plants charged by the head for the slaughter-
ing of cattle. The mode and median for the plants reporting,
both fell within the charge of 53.00 per head. The range of
charges varied from one and one-half dollars per head up to
five dollars per heed, with a weighted average of 13.08 per
plant for 26 plants.
Twelve plants kept the hide as the slaughtering fee for

cattle. Several plants reported they formerly had slaughtered
tor the hide, but were forced to a unit charge because of the
present high market price of hides. At present hide prices,
the hide from an average beef should return five dollars or
more, which *ts the highest charge on the basis of slaughter
by the head.
Summary . There are several different approaches by which
the slaughtering charge may be computed. Although there is a
considerable variation as indicated in Table 20, the mode and
median for each group ere representative and the weighted
average charge per plant as indicated in Table 20, is approxi-
mately the same as the mode and median.
Processing Charges
Chill. Cut and Urao. Culck Freeze.. Table 21. indicates a
complete leek of uniformity of charges for these services, both
on the basis of the charge and the amount. The charges for
each individual service are of some value to get a picture of
the wide variety of charges, but due to the overlapping of
different combinations of two or more of these services, the
mode and median of each class do not Indicate significant re-
sults. If tills method v.ere to be used, the representative
charge would be one cent s pound for chill, two cents a pound
for cut and wrap, and one cent a pound for quick freeze, or a
total of four cents a pound as shown by Table 21.

94
Table 21. Frecuency number of locker plants with slaughterfacilities in Kanses based on processing chargesfor individual s ervices and for total servicescombined.!
: .ia.-U-' I' of plants
Charge * : Cut and » tuick : All services: Chill : wrap : freeze l coal lni
-
Per pound (dressed weight)
i cent 4 51 cent 5 2 5 1lj cents 3 1 5
2 cent* 1 5 18
2i cents 1 6
3 cents 2
Included in slaughtercharge 6 2 2
Per heed (hog)1 .50 2
.75 11.00 1
Per head (cattle)« 1.00 3
1.50 12.00 1
Plants reporting 25 13 13 32
Data obteined from a survey of locker plants *ith slaughterfacilities in Kansas, 1946.

95
Six plants Included the charge lor chilling in their
slaughter charge and tv.o plants included charges for cut,
wrap, and quick freeze in their fee for slaughtering. Charge*
for chilling indicated considerable variation in rate and
bcs is of charge. Tills *as partially explained by the fact
that some plants allowed wholesalers and other iaeat operators
to use the facilities of their chill room, for which they
were charged by the pound or by the carcass. Many of these
same plants did not charge their patrons separately for
chilling the animal carcass.
A more accurate description of all service charges may
be obtained from column four of Table 21. Many plants re-
ported only one total ligure for the complete service. These
plants, plus those reporting individual charges in such a
manner that they could be totaled, represented 32 reporting
plants. The modal group of 18 plants had a total charge of
tao cents a pound for chill, cut, wrap, end quick: freeze. One
plant *bs performing this service for as low as one cent a
pound and five plants for one and one-half c<mts a pound.
Six plants were charging a total of two and one-half cents a
pound and two plants wore charging e total of three cents a
pound.
Lard. Thirty-one plants reported charges for rendering
lard, as Indicated in Table 22. The charges ranged from one
to four cents a pound with the mode and median both at three
cents a pound. One plant charged one cent a pound, one

Table 22 > Frequencyfacilitiesprocessing
96
number of locker plants with slaughterin Kansas, based on rate of charge lormeat and meat products. 1
Charge per pound
: Hunter oX plantsII II Smoke find: Lard : tU'.mburger s Sausr.ge t cure
Cents
1
U22*
'»
u5
VIncluded v*lth cut,
wrap, find sharpfreeze
Plants reporting
1 13 916 610 11 9 1
1 112 1 1 3
12 1 12
8
1
5 9 8 1
31 U 35 27
Date obtained from survey of locker plants »ith slauchterfacilities in Kansas, 1946.

97
charged one and one-half cents a pound, tnd ten plants charged
two cents a pound, twelve cherged three cents a pound, end two
pUnts charged lour cents a pound. These charges did not in-
clude the container for the lard. Five plants included the
rendering of lard under previous charges for cutting and
wrapping.
The charges of several plants were not included in Table
22, One plant operated on a cotaaisslon basis, keeping ten
percent of all lard for its rendering. Another plant charged
20 cents a gallon, while another plant made a flat charge of
75 cents per hog to render the lard.
Hamburger . Table 22 indicates 41 plants ground hamburger
in their plant. Thirteen plants charged one cent a pound,
constituting the modal group while 11 plants charged trco cents
a pound, constituting the median. One plant charged two and
cne-h&lf cents a pound and another plant charged three cents
a pound to grind meat. Nine plants included the cost of
grinding hamburger under previous costs of processing the moat
and putting it in the locker.
Sausage . Thirty-five plants made sausage in their plant,
nine of them charged one cent a pound, six charged one and
one-half cents a pound and nine charged two cents a pound.
Only three of the 35 plants charged more than two cents a
pound. Eight plants included the cost of making sausage in
previous charges of processing. Twenty-four of 27 plants mak-
ing a charge for sausage, charged between one and two cents a

98
pound, with as many plants charging one cent as there were
plants charging two cents a pound.
Smoked and Cured Keats . Twenty-seven plants reported
their charge for smoking and curing meat combined In one figure.
Table 22 Indicates the range from two to six cents a pound.
Twelve of 27 plants cliarged four cents a pound, constituting
the modal group. Eight plants charged five cents a pound.
Plants charging four and five cents a pound for curing end
smoking, constituted 20 of 27 plunts reporting.
Two plants, not included in Table 22, did not charge by
the pound. One plant charged a flat rite of one dollar per
hog and the other plant charged ten cents a piece of meat
cured or smoked.
Disposition of Beat Slaughtered by Plant
Data were gathered on the disposition of meat resulting
from the slaughter of r.ninsils In the locker plants with slaugh-
ter facilities. The three possible dispositions of meat
slaughtered in the plant arei custom slaughter shore oaner-
shlp of the meet is retained by the customer, meat sold retail,
and meat sold wholesale. The plant operator takes possession
of the meat products in the li-tter tv.o instances and is re-
sponsible for placing it In channels of distribution.
ii2£i. Reference to Table 23 Indicates the frequency of
plants, by percentage Intervals, for slaughter of hogs in the

99
plant for custom slaughter, meat sold wholesale, and meet
sold retail. These three possibilities represented the dis-
position of the entire slaughter of the plant.
Of 42 plants reporting, 13 plants reported custom
slaughter represented the entire slaughter of their plant, or
100 percent. This constituted the mod&l group. The median
group was 71 to 80 percent custom slaughter. These data Indi-
cate that many of the plants do not have 6 retail meat counter
and ere not engaged In supplying wholesale trade channels.
Two plants reported no custom slaughter} their slaughter con-
sisting only of meat which was for retail or wholesale pur-
poses.
Twenty-one of 41 plants reporting did not slaughter any
hogs for wholesale distribution. Fifteen plants reported one
to ten percent of their total plant slaughter of hogs was for
wholesale purposes. One plant reported 61 to 70 percent of
its total plant slaufihter for ftholesele trade. This was the
highest percentage slaughter for wholesale distribution of
any plant reporting. Only six plants reported more than ten
percent of the total slaughter was for v.holesale distribution.
These data indicate that slaughter of hogs for wholesale dis-
tribution is not important on the basis of number of plants.
However, the six plants whose slaughter for wholesale repre-
sented more than ten percent of their total slaughter, were
plants operating on a larger scale than the average plant,
thus the quantity of meat distributed by a few plants through
wholesale channels could be considerable.

100
Table 23. Frequency distribution of locker plants withslaughter facilities in Kansas, bp.ced on percen-tage disposition of meet products from totalslaughter of hogs in the plant. 1
: Number .cjf QLlB&lPercent » Custom
i slaughter: Heat sold t Meet sold: wholesale : retail
21-10 1
11 - 2021-30 531-40 341-50 351-60 261-70 171-80 531-90 391-99 4
100 13
Pltnts reporting 42
21 1915 52 6
11 2
42 1
1 11
42 42
iDeta obtained from a survey offacilities in Kansas, 1946.
locker plants with slaughter

Table 24. Frequency distributionslaughter facilities in
t£fc-e disposition of meoslaughter of cattle in
of locker plants *ithKansas, based on percen-
t products from totalthe plant. 1
101
I Number of pi; ntaPercent 1 Custom
: slcuj-nter: Meat sold : Meat soldi wholesale x retail
31-10 111-20 221-30 431-40 341-50 5
51 - 6061-70 171-80 5
81-90 391-99 4
100 13
Plsnts reporting 44
21 1814 74 5
2 4
2 1
1
3
44 44
Data obtained from a survey of locker plants withslaughter facilities in Kansas, 1946.

Or 42 plants reporting, 19 did not slaughter any hogs
for retail distribution. Six plants reported 11 to 20 per-
cent of the entire slaughter of hogs entered retail channels.
It is noted that 23 of 42 plants reporting did some slaughter
for retail, v,hlle 21 plants of 42 reporting slaughtered for
wholesale distribution. These date indicate only a slightly
higher number of plants engaged in retell distribution of
pork than in wholesale distribution.
Of the plants personally visited, it r; s found that those
slaughtering hogs for wholesale distribution wore largely
selling carcasses to locker patrons and supplying local con-
cerns in the community and were not shipping carcasses out-
side of the immediate trade territory.
Cattle . Reference to iable 24 indicates the frequency of
plants by percentage intervals for custom slaughter, beef sold
retail, and beef sold wholesale. Thirteen of 44 plants report-
ing indicated that custom slaughter constituted 100 perc nt
of the plant slaughter. This was the model group, being the
seme as for slaughter of hogs. The median group reported 71
to 80 percent of total plant slaughter was custom slaughter;
this also is the same median as for slaughter of hogs. Three
plants did not custom slaughter. Twenty-eight of 44 plants
reporting were relatively evenly distributed between a per-
centage of custom slaughter greater than zero and less than
100 percent.
Twenty-one of 44 plants reported no slaughter for whole-
sal* purposes. Fourteen plants slaughtered one to ten percent

103
of csttle for wholesale distribution. One plant slaughtered
M high es 31 to 90 percent of its total slaughter for whole-
sale trade. Only five plants slaughtered more then 20 per-
cent for wholesale distribution, end it was noted that these
plants were those operating on a larger scsle.
Eighteen of 44 plants reporting did not slaughter for re-
tell. Seven plants slaughtered one to ten percent of their
totel slaughter for retail distribution. Three plants re-
ported 100 percent of totel slaughter of cattle was for re-
tail trade.
Summary . These data from plants surveyed indicate that
the large proportion of the animals slaughtered in the plant
were custom slaughtered for patrons. Wholesale slaughter was
small for both cattle and hogs and was an important factor
only in the larger slaughtering plants. Retail slaughter was
closely associated with facilities and location of the plant.
Those plants operating a retail meat counter in conjunction
v-lth their plant, did a proportion of their slaughter for re-
tail channels.
Disposition of Inedible Slaughter By-products
General . Data obtained on the disposition of Inedible by-
products of the small slaughter house were regarded as one of
the most important phases of -tills study. It was Significant
that a vast majority of the plants do not have an outlet for

104
by-products, other then to throw them away or to feed them
to hogs.
The 50 plants surveyed gave only e meager description
of the disposal of Inedible by-proiucts and the returns re-
alized. An attempt was made to study the disposition of
different types of by-products.
Blood. Offal. p| Viscera. Of the 50 plants surveyed,
42 gave an Indication of the disposition of their inedible
by-products. Several of these overlapped into two or more
categories, thus the total of the different methods of dis-
position exceed the total number of 42 plants reporting.
t summary of the disposition of inedible by-products is
listed below:
DispositionjNo. of plants
Fed to hogs (no cash returns) 24Pick-up service (no cash returns) 3Ihrow away as waste (no cash returns) 4Sell to rendering plant 6Bell to farmers (small monthly return) 3Render tankage In plant for resale 4Render Inedible grease in plant for resale 2
The large proportion of the plants which thro* aviay or
give away inedible by-products Is indicated in the above
Illustration. Of 51 dispositions reported by 42 plrnts, 36
received no returns. Many plants gave away by-products to
avoid costs in disposing of them. In other cases, the
slaughter operator was not only unable to obtain any return

105
from the offal, but costs v.ere incurred In hauling it away
from the plint.
Most pltnts reported insufficient volume as the factor
prohibiting the installation of a cooknr to make green tenkage
and render off inedible grease. Of the five plants v.hich
render tankage and inedible grease, only three had a volume
of average neekly kill v.hich exceeded the mode for the entire
group of 50 surveyed plants, whereas two plants fell below
the modal group, /nother plant which has a volume of weekly
kill of ten hogs and four head of cattle is installing a
cooker to render off inedible gr.'-ase.
This would appear to discount the assumption that a large
volume was necessary before additional processing could b«
profitably given inedible by-products by small slaughter
plant. Ihree plants visited had a very small investment in a
cooker, and v.ere rendering out waste fats. Returns from sales
of Inedible grease and pressed cracklings were reported.
The prices received for offal and viscera varied from
50 cents to $1.50 per carcass for a beef and 30 to 50 cents
per carcass for a hog. Other plants reported selling the in-
edible prouucts to farmers for a ssall amount, averaging about
£5.00 per month.
One plant visited has had unusual success with the ren-
dering equipment in its plant. This particular plant has t*o
large cookers in which all fat is cooked off the offal and
viscera and the soap grease, crackling, and green tankage
rendered in the plant are sold for an average of $8.00 per

106
carcass for cattle and U.50 per carcass for hogs. This
represents a large potential profit which the large majority
of plants are not receiving. This particular plant reported
that processing of the inedible by-products more than repre-
sented profits, as slaughtering was done at cost to meet com-
petition of nearby terminal peckers and looker plant income
did not meet expenses.
Bones . Five plants reported that although the animal
offal was not sold, the bones were sold to a rendering company.
Two plants received one cent per pound, one received one and
one-half cents, and two received two cents per pound for
bones sold. Another plant reported selling bones to dog
owners for a few cents a piece and realizing a considerable
return.
Hair . None of the reporting plants made any use of the
hair scraped from hogs. In all cases where the hog was not
skinned, the hair was * total waste and had to be hauled away
and dumped. Six plants reported that hogs were skinned in-
stead of scraped. The hide was sold to the rendering company
at * price between 50 cents end |1.00 each.
nut Fats . This subject was discussed in the consideration
of the disposition of offal. In addition, two plants reported
the gut fat «M stripped and sold to the rendering company.
One reported a return of U0.00 weekly and one reported a
return of 115.00 a month. Tills again emphasizes the amount
of potential value which is present in the offal of the Wilms 1,

107
much of which can be salvaged lor resale with e nominal
smount oi" time, labor, <-nd equipment.
Cattle Hides. Schedules of 43 plants reporting dis-
position of cattle hides Indicated thr.t 28 plants sold the
hide and credited the patron, one plant purchased the hides
from the customer, two plants returned the hides to the patron
and 12 plants kept the hide for the slaughtering fee. Other
plants indicated that formerly hides had been kept as a
slaughter fee, but at present market prices for hides, this
charge was out of proportion.
An extremely »lde range in prices paid for cattle hides
existed In 26 plants reporting. Come variation may be due to
price changes in the hide market during the interval of time
In which some of the plants reported. However, the data from
all the plants reporting were obtained in a period of two
months. Price changes probably Jid not entirely explain the
wide variation of prices which different plants paid their
patrons for cattle hides. The number of plants paying vary-
ing prices to patrons for cfttle hides ere tabulated below:
Prices received for cattle hides Number of plants
Market price 10
Cents per pound101213U151617

108
Prlcps received for cattle hides , Number of plants
Cents per pound (continued)18 1
20 121 2
Dollars -er head, average$6.00 2
8.00 1
Plents reporting 26
Summary . Data obtained indicate that the utilization of
Inedible animal products is far from efficient in the industry.
Too many plants apparently assumed their volume as insufficient
to justify adequate consideration of the matter. Severtl small
plants have shown that Inedible annual products can be util-
ized efficiently without a large amount of expensive equipment.
Inedible groase can be rendered with very little equip-
ment and is in good demand at attractive prices. Another
plant has taken the initiative in attempting to interest several
small plants *hich are located in the same general locality
to *ork out a cooperative plan whereby the animal offal can be
picked up from several plants by a single truck end hauled to
a rendering works, or to establish small rendering works of
their own and operate it on a cooperative basis. This plan
may have possibilities for a group of small slaughtering plants
located in close proximity.
The problem of utilizing inedible products is a challenge
to the industry. In most cases, operators are a; are of the

109
Inefficiency} a few plants regard inedible products as
animal waste. Several plants have reported patrons *ere be-
coming dissatisfied v.lth increased charges for slaughter and
processing meat. If the slaughter plants were able to snake
more efficient use of inedible by-products, it vould be
possible to reduce charges to the patron and increase the
returns of the plant.
Suggested Improvements in Utilization of Inedible By-products
Plants were astied for suggestions as to hov» to improve the
utilization of the inedible by-products which are no* wasted
by a majority of the plants. Of 23 plants reporting, 16 had
no suggestions for improvement. Eight suggested further
processing if volume permitted, two plants favored pick-up
service by a rendering plant, one plant was negotiating with a
rendering plant concerning sale of bones and offal, jnd one
plant suggested a cooperative organization of several small
plants by which the Inedible by-products from the plants
would be pooled. In the latter case, the Increased volume
might permit either pick-up service by a rendering company,
or the installation of coopera tlv^ly-owned rendering ecuipaent
for the plants interested.
In general, there is a lack of interest by the plants in
the problem of utilizing inedible by-products. This problem
deserves considerable study by the lndlviaual plants concerned.

no
Contemplated Changes
Date on contemplated physical changes In the plant
facilities were obtained. Twenty-seven of 41 plants report-
ing did not contemplate making any change in plant facilities
or increase the utilisation of inedible by-products. Eleven
plants were expecting to install a cooker to render off
waste grease. Some were installing a tankage cooker to ren-
der green tankage. Three plants were planning to build a
new rnd modern plant as soon as materials were available.
The fact that 14 out of 41 plants reporting are contem-
plating major alterations In their building or processing
equipment is indicative that these particular plants have be-
come aware of the Importance of more complete utilisation of
the offal and other inedible by-products from the Individual
plant.
Insurance
Thirteen of 46 plants reporting indicated insurance cover-
age on the enimal from the time it was delivered for slaughter
by the customer until the meat was returned to the patrons.
Thirty-eight of 46 plants reporting carried insurance on the
contents of the patron's locker box. Twenty of 44 plants re-
porting carried some type of accident insurance on their

HI
employees.
Problems Confronting Individual Plants
An assorted variety of problens was reported by various
locker plants aith slaughter facilities. Table 25 shows the
various problems and the number of plants reporting each
particular problem.
In studying these problems, it appears that some plants
are operating on a narrow margin. Others are experiencing
difficulty in obtaining supplies and competent labor. In-
sufficient plant facilities to handle the volume of business
demanded, and lack of education of the patrons provide
additional problems lor the operator.
Several problems were listed which indicated that patrons
still hcve much to learn. Customers or patrons have been en-
couraged to learn the correct methods and procedures of prepar-
ation of products for the locker box. It appears that patron-
education along several lines would be helpful to the industry.
One plant visited did not have a sharp freeze unit. The
patrons ».ere putting fresh meet in their locker boxes without
its being pre-frozen. This instance was en exception and the
operator admitted the patrons were not satisfied with the
flavor and quality of the products stored in the box.
Because of the wide diversification of personalities and
educational levels of the great bulk of individuals comprising

Table 25. Problems confronting various locker plants withslaughter facilities In Kansas.
^
112
Problemi Number: of plants: reporting
Shortage of help, equlpcent end suppliesProcessing charges ere InsufficientCustomers overcrowd locker boxesPlants need to expand to handle volume ofbusiness
Customers not educated on subject of slaughterand meat products
Rising prices of paper suppliesPatrons lose keysPatron thinks meat disappears from locker boxCompetition, danger of too many locker plants in
territoryPlcnt needs insurance on contents of locker boxPlant needs higher locker box rentPlant needs city water and- sewageLabor supply Inadequate end high in costHigh power ratesUneven flow of livestock to slaughter, crowds
chill room facilitiesCustomers put unfrozen meat in locker boxCustomers leave lights on and doors openftork is too hard compared to returns of the
business
7
6
I
^Data obtained from a survey of locker plants with slaughterfacilities In Kansas, 1946.

113
this Industry, It can expect to hive its share of problems,
none of which seems to be so serious that they cannot be
solved.
CONCLUSIONS
The frozen food locicer Industry in Kansas has expanded
rapidly in the past decade. Locker plants operating in con-
Junction with t small similiter plant, have experienced a
rapid grotvth in the lest five years. The trend of new con-
struction in Kansas is toward a locicer plant ssith its o*n
slaughter facilities, enabling it to offer complete services
to the patrons.
The locker-slaughter plant industry is a thriving indus-
try in Kansas, offering a substantial number of people em-
ployment, representing a rather large investment in small
communities, and offering many scvlms, economies, and a
vsrlety of services to the people of Kansas.
Many successful plants are operated by personnel who have
not had previous experience in the business. Wille experience
apparently is not essential, it is undoubtedly of erect help.
The volume of slaughter varied widely among plants} most of
them found the limiting factor in their rate of slaughter was
the size of their cooling facilities.
Custom slaughter is increasing and farm slaughter is d«-
cr?t.sing in Kansas. Pr.trons appreciate the convenience end

1U
economies of having (,uelllled plent personnel v.lth adequate
ecuipment to slaughter the animal and prepare the meat for
the locker box.
Slaughtering and processing charge* varied widely in
amount. The basis of the charge also varies greatly between
plants. Some plants have charges that are high, especially
those receiving the hide in return for slaughtering cattl«.
There is a decided lack of standardization of charges through-
out the industry.
The disposition 01 inedible by-products is one of the
major problems lacing the small slaughter plent. Many plants
have assumed their volume of slaughter to be insufficient to
Justify En investment in rendering equipment. Other plants
have disproved this assumption through the installation of in-
expensive and simple ecuipment. Several plants have cookers
to render off waste-fat} partial rendering of offal is done
by others, reducing the bulk and giving it some degree of
value. It Is then sold for hog feed or to a rendering plant
for further processing. At the ->resent time inedible grease
Is in great demand by soap manufacturers.
Undoubtedly one of tne foremost reasons for the success
oi the locker plant industry in Kansas Is the wid« variety of
services rendered to the people of a community. It has es-
tablished Itself as one of the most Important single types of
business in the small conmunlties of Kansas.

115
ACKNOWLEDGEEHT
Acknowledgment Is made to Prof. C. P. l.llson, major
instructor, lor his valuable esslsttnce in. til phases of the
preparation of this thesis} to Prof. Merton L. Otto for his
cooperetion In supplying Information obtained in s previous
survey; to Dr. G. A. Filinger, Department of Horticulture,
Kansas £tt'te College, for supplying names and location of
locker plants In Kansas; to Mr. H. U. Collins, State Agricul-
tural Statistician, United states Department of Agriculture,
Topska, for furnishing slaughter data In Kansas; to Dr. J. A.
Hodges for his suggestions in statistical analysis; to Dr. K.
£. Grimes and to Dr. Hi.rold Howe for their constructive
criticisms and suggestions concerning the final preparation
of this thesis.
116
BIBLIOGRAPHY
Agr. Expt. fete. Prelim. Rpt., September, 1<M5.
g8"How Cold'storage Lockers May AiTect Livestock Meat
Distribution." (Reprint) I&g, ai flolrlK^Ugfl. August,
1938.
Sai^ f:cs£lon ikia ft 12A5-. Chapter 25*. The Kansas Meat
ad Poultry Inspection La* end Regulation, 1945.
Beat Animals . Farm Production «£ lacjaas. Bur. Agr. Econ.,
U. E. Dept. Agr. 1930-45.
Minima EwffltUl Jfegfl* 4 fcjU fii&um^ flausaa. or-gon
Agr. Fxpt. lit. eul. No. 77, April, 193S.
Otto, M. L. and E. B. Phelps .
Y|ie LocKcr Plant Industry In tiaMft* (Mimeo. Rpt.; lians.
Agr. Expt. 8U., June, 194^.