economic analysis of future o shore oil and gas
TRANSCRIPT

in association with
Institute of Social and Economic Research, University of Alaska Anchorage
Economic Analysis of Future O!shore Oil and Gas Development: Beaufort Sea, Chukchi Sea, and North Aleutian Basin
Prepared for
Shell Exploration and Production
March 2009


Economic Analysis of Future Offshore Oil and Gas Development: Beaufort Sea, Chukchi Sea, and North Aleutian Basin
Prepared for
Shell Exploration and Production
March 2009 Prepared by
In association with
Institute of Social and Economic Research, University of Alaska Anchorage

Preparers Team Member Project Role Company Patrick Burden Project Manager Northern Economics, Inc. Leah Cuyno Economist Northern Economics, Inc. Kent Kovacs Economist Northern Economics, Inc. Nancy Mundy Policy Analyst Northern Economics, Inc. Anne Bunger Analyst Northern Economics, Inc. Terri McCoy Editor Northern Economics, Inc. Scott Goldsmith Economist Institute of Social and Economic Research,
University of Alaska

i
Contents
Section Page
Abbreviations ....................................................................................................................................... ix
Executive Summary............................................................................................................................ES-1 Major Findings.............................................................................................................................. ES-1 Background .................................................................................................................................. ES-4 Scenarios Considered ................................................................................................................... ES-5 Potential OCS Oil and Gas Production.......................................................................................... ES-7 Potential Employment Effects........................................................................................................ ES-7 Potential State Population and State Fiscal Effects ....................................................................... ES-13 Local/Regional Population and Fiscal Effects................................................................................ ES-15
1 Introduction........................................................................................................................... 1
2 Background Information and Assumptions ............................................................................... 3 2.1 OCS Oil and Gas Leasing Program 2007-2012.................................................................... 3 2.2 Assumptions and Projections about the Future Economy of the State of Alaska.................... 4
3 OCS Exploration, Development, and Production Scenarios ......................................................... 7 3.1 Beaufort Sea Scenario......................................................................................................... 9 3.1.1 Size and Location of Program Area ................................................................................... 10 3.1.2 Resource Estimates ........................................................................................................... 12 3.1.3 Exploration ....................................................................................................................... 14 3.1.4 Development ................................................................................................................... 15 3.1.5 Transportation of Materials, Supplies, and Personnel......................................................... 17 3.1.6 Production ....................................................................................................................... 18 3.2 Chukchi Sea Scenario ....................................................................................................... 22 3.2.1 Size and Location of Program Area ................................................................................... 23 3.2.2 Resource Estimates ........................................................................................................... 24 3.2.3 Exploration ....................................................................................................................... 26 3.2.4 Development ................................................................................................................... 28 3.2.5 Transportation of Materials, Supplies, and Personnel......................................................... 30 3.2.6 Production ....................................................................................................................... 31 3.3 North Aleutian Basin Scenario .......................................................................................... 35 3.3.1 Size and Location of Program Area ................................................................................... 35 3.3.2 Resource Estimates ........................................................................................................... 36 3.3.3 Exploration ....................................................................................................................... 37 3.3.4 Development ................................................................................................................... 38 3.3.5 Production ....................................................................................................................... 39
4 Results and Findings ............................................................................................................. 43 4.1 Incremental Oil and Gas Production................................................................................. 43
Economic Analysis of Future Offshore Oil and Gas Development: Beaufort Sea, Chukchi Sea, and North Aleutian Basin
ii
4.2 Potential Employment Effects ............................................................................................51 4.2.1 Definition of Employment Categories ................................................................................52 4.2.2 Potential Direct Employment Effects..................................................................................53 4.2.3 Potential Employment Effects of the Beaufort OCS Development ......................................55 4.2.4 Potential Employment Effects of the Chukchi OCS Development ......................................57 4.2.5 Potential Employment Effects in the North Slope: Combined Beaufort and Chukchi
OCS Activities...................................................................................................................60 4.2.6 Potential Employment Effects of the North Aleutian OCS Development.............................63 4.2.7 Potential Total Statewide Employment Effects: All Three OCS Development .....................66 4.3 Potential Statewide Population Effects...............................................................................69 4.3.1 Beaufort OCS ...................................................................................................................70 4.3.2 Chukchi OCS....................................................................................................................72 4.3.3 Combined Beaufort and Chukchi OCS Activity .................................................................74 4.3.4 North Aleutian OCS..........................................................................................................76 4.3.5 Total Potential Population Effects: All Three OCS Development ........................................78 4.4 Potential Local Jobs and Population Effects in Impacted Region.........................................80 4.4.1 Beaufort OCS ...................................................................................................................80 4.4.2 Chukchi OCS....................................................................................................................84 4.4.3 Combined Beaufort and Chukchi OCS Development........................................................88 4.4.4 North Aleutian OCS..........................................................................................................91 4.5 Potential Revenue Effects ..................................................................................................95 4.5.1 Revenue Parameters .........................................................................................................96 4.5.2 Potential Direct Petroleum Revenues ..............................................................................103 4.5.3 Population-Related and Indirect Revenue Effects of OCS Development...........................107 4.6 Potential Fiscal Effects .....................................................................................................108 4.6.1 Potential State Fiscal Effects.............................................................................................108 4.6.2 Beaufort OCS .................................................................................................................112 4.6.3 Chukchi OCS..................................................................................................................113 4.6.4 Combined Beaufort and Chukchi OCS Development......................................................114 4.6.5 North Aleutian OCS........................................................................................................115 4.6.6 Combined All Three OCS Development .........................................................................116 4.6.7 Potential Fiscal Effects for Local Governments .................................................................117
5 Sensitivity Analysis ............................................................................................................. 133
6 References ......................................................................................................................... 135
Table Page
Table ES-1. Potential Future Employment Effects of OCS Development in Alaska .......................... ES-2 Table ES-2. Potential Cumulative Direct Revenue Effects of OCS Development to State and
Local Governments, 2008 to 2057 (in Billions of 2007$)......................................................... ES-2 Table ES-3. Potential State Fiscal Effects of OCS Development: Cumulative Revenues and
Expenditures Under Varying Price Assumptions, 2008 to 2057 (in Billions of 2007$)............... ES-4 Table ES-4. Potential Direct Employment Estimates (Annual Average Employment) by OCS Area... ES-9

Economic Analysis of Future Offshore Oil and Gas Development: Beaufort Sea, Chukchi Sea, and North Aleutian Basin
iii
Table ES-5. Estimated Annual Average Employment Generated from Potential OCS Development by Place of Work and by Place of Residence .................................................. ES-11
Table ES-6. Summary of Potential Cumulative Direct Revenues to the State and Local Governments, 2008 to 2057 (in Billions of 2007$)................................................................ ES-12
Table 1. MMS Lease Sale Schedule for Alaska Planning Areas ............................................................ 4 Table 2. Summary of OCS Development Scenarios............................................................................ 8 Table 3. 2006 Beaufort Sea Resource Assessment: Undiscovered Technically Recoverable Oil
and Gas Resources (UTRR) ........................................................................................................ 13 Table 4. Beaufort Sea: Mean Risked, Undiscovered, Economically Recoverable Oil and Gas
Resources by Play (UERR).......................................................................................................... 14 Table 5. Schedule for Seismic and Exploration Activities in the Beaufort Sea .................................... 15 Table 6. Development and Production Activity Schedule for Beaufort Sea ....................................... 17 Table 7. Vessel and Aircraft Traffic to Support Beaufort Exploration.................................................. 18 Table 8. Volume of Resources Assumed to be Produced in the Beaufort OCS Fields ........................ 18 Table 9. Total Annual Production Volumes of Oil and Gas Assumed in the Beaufort Production
Scenario.................................................................................................................................... 21 Table 10. 2006 Chukchi Sea Resource Assessment: Undiscovered Technically Recoverable Oil
and Gas Resources (UTRR) ........................................................................................................ 25 Table 11. Chukchi Sea: Mean Risked, Undiscovered, Economically Recoverable Oil and Gas
Resources by Play (UERR).......................................................................................................... 26 Table 12. Schedule for Seismic and Exploration Activities in the Chukchi Sea................................... 27 Table 13. Development and Production Activity Schedule for Chukchi Sea...................................... 29 Table 14. Volume of Resources Assumed to be Produced in the Chukchi OCS Fields....................... 31 Table 15. Total Annual Production Volumes of Oil and Gas Assumed in the Chukchi Sea
Production Scenario .................................................................................................................. 34 Table 16. 2006 North Aleutian Basin Resource Assessment: Undiscovered, Technically
Recoverable Oil and Gas Resources (UTRR)............................................................................... 37 Table 17. North Aleutian Basin: Mean Risked, Undiscovered, Economically Recoverable Oil
and Gas Resources by Play (UERR) ............................................................................................ 37 Table 18. Schedule for Seismic and Exploration Activities in the North Aleutian Basin ...................... 38 Table 19. Development and Production Activity Schedule for North Aleutian Basin ......................... 39 Table 20. Volume of Resources Assumed to be Produced in the North Aleutian OCS Fields............. 40 Table 21. Total Annual Production Volumes of Oil and Gas Assumed in the North Aleutian Basin
Production Scenario .................................................................................................................. 42 Table 22. Estimated Direct and Indirect Employment Effects by Sector for All Three OCS Areas
(expressed as Annual Average from 2008 to 2057)..................................................................... 52 Table 23. Historical Percentage of Oil and Gas Sector Jobs by Place of Residence ............................ 53 Table 24. Annual Average Direct Employment by OCS Area, 2008-2057......................................... 55 Table 25. Schedule of Rental Payments ........................................................................................... 97 Table 26. Coastal Impact Assessment Program (CIAP) Fund Alaska Allocations for FY2007 and
FY2008 ..................................................................................................................................... 99 Table 27. Potential Cumulative Direct Petroleum Revenues Accruing to the State of Alaska and
Local Governments, 2008 to 2057(in Billions of 2007$) .......................................................... 104 Table 28. Potential Cumulative Direct Petroleum Revenues, Beaufort OCS Development, 2008
to 2057 (in Billions of 2007$) .................................................................................................. 105

Economic Analysis of Future Offshore Oil and Gas Development: Beaufort Sea, Chukchi Sea, and North Aleutian Basin
iv
Table 29. Potential Cumulative Direct Petroleum Revenues, Chukchi OCS Development, 2008 to 2057 (in Billions of 2007$) ..................................................................................................105
Table 30. Potential Cumulative Direct Petroleum Revenues, Combined Beaufort and Chukchi OCS Development, 2008 to 2057 (in Billions of 2007$) ..........................................................106
Table 31. Potential Cumulative Direct Petroleum Revenues, North Aleutian OCS Development, 2008 to 2057 (in Billions of 2007$) .........................................................................................106
Table 32. Potential Cumulative Direct Petroleum Revenues, All Three OCS Areas, 2008 to 2057 (in Billions of 2007$) ...............................................................................................................107
Table 33. Potential Cumulative Population-Related and Indirect Revenue Effects of OCS Development, 2008 to 2057 (in Billions of 2007$) ..................................................................107
Table 34. Share of OCS Population and Per Capita Cost per Population Category ..........................111 Table 35. Estimated Cumulative State Revenue Balance, Beaufort OCS Development, 2008 to
2057 (in Billions of 2007$) ......................................................................................................113 Table 36. Estimated Cumulative State Revenue Balance, Chukchi OCS Development, 2008 to
2057 (in Billions of 2007$) ......................................................................................................114 Table 37. Estimated Cumulative State Revenue Balance, Combined Beaufort and Chukchi OCS
Development, 2008 to 2057 (in Billion of 2007$)....................................................................115 Table 38. Estimated Cumulative State Revenue Balance, North Aleutian Basin OCS
Development, 2008 to 2057 (in Billions of 2007$) ..................................................................116 Table 39. Estimated Cumulative State Revenue Balance, All Three OCS Development, 2008 to
2057 (in Billions of 2007$) ......................................................................................................117 Table 40. Sensitivity Analysis Results: Cumulative State Revenues under Different Petroleum
Price Levels .............................................................................................................................133 Figure Page
Figure ES-1. Schedule of Activities for Beaufort, Chukchi, and North Aleutian Basins, 2008-2057..ES-7 Figure ES-2. Potential Total Direct Annual Average Employment from OCS Development in
Alaska, 2008 to 2057.............................................................................................................. ES-8 Figure ES-3. Potential Total Employment Effects from OCS Development by Category................. ES-10 Figure 1. Schedule of Activities for Beaufort, Chukchi, and North Aleutian Basins, 2008-2057............9 Figure 2. Program Area, Beaufort Sea, Lease Sale 202 ......................................................................10 Figure 2. Beaufort Sea Existing Leases as of January 2007 .................................................................11 Figure 3. Location of Shell Leases in the Beaufort Sea.......................................................................12 Figure 4. Projected Annual Oil and Gas Production by Field in the Beaufort Sea OCS ......................19 Figure 5. Projected Daily Oil and Gas Production in the Beaufort Sea OCS ......................................20 Figure 6. Program Area, Chukchi Sea, Lease Sale 193 ......................................................................24 Figure 7. Projected Annual Oil and Gas Production by Field in the Chukchi Sea OCS ......................32 Figure 8. Projected Daily Oil and Gas Production in the Chukchi Sea OCS ......................................33 Figure 9. North Aleutian Basin Planning Area ...................................................................................35 Figure 10. Alternative 7 Limited Leasing Area in the North Aleutian Basin Planning Area ..................36 Figure 11. Projected Annual Oil and Gas Production by Field in the North Aleutian Basin OCS........40 Figure 12. Projected Daily Oil and Gas Production in the North Aleutian Basin OCS........................41 Figure 13. Incremental Oil Production from All Three Basins OCS Development..............................44 Figure 14. Incremental Gas Production from All Three Basins OCS Development.............................45

Economic Analysis of Future Offshore Oil and Gas Development: Beaufort Sea, Chukchi Sea, and North Aleutian Basin
v
Figure 15. Incremental Oil Production from Beaufort OCS Development......................................... 46 Figure 16. Incremental Gas Production from Beaufort OCS Development........................................ 47 Figure 17. Incremental Oil Production from Chukchi OCS Development ......................................... 48 Figure 18. Incremental Gas Production from Chukchi OCS Development ........................................ 49 Figure 19. Incremental Oil Production from North Aleutian Basin OCS Development ...................... 50 Figure 20. Incremental Gas Production from North Aleutian Basin OCS Development ..................... 51 Figure 21. Total Annual Average Direct Employment for All Three OCS Areas, 2008-2057............... 54 Figure 22. Estimated Incremental Employment by Sector, Beaufort OCS Development .................... 55 Figure 23. Estimated Incremental Employment by Place of Work, Beaufort OCS Development ........ 56 Figure 24. Estimated Incremental Employment by Place of Residence, Beaufort OCS Development . 57 Figure 25. Estimated Incremental Employment by Sector, Chukchi OCS Development .................... 58 Figure 26. Estimated Incremental Employment by Place of Work, Chukchi OCS Development ........ 59 Figure 27. Incremental Employment by Place of Residence, Chukchi OCS Development ................. 60 Figure 28. Estimated Incremental Employment, Beaufort and Chukchi OCS Development ............... 61 Figure 29. Estimated Incremental Employment by Place of Work, Beaufort and Chukchi OCS
Development ............................................................................................................................ 62 Figure 30. Estimated Incremental Employment by Place of Residence, Beaufort and Chukchi OCS
Development ............................................................................................................................ 63 Figure 31. Estimated Incremental Employment, North Aleutian Basin OCS Development................. 64 Figure 32. Estimated Incremental Employment by Place of Work, North Aleutian Basin OCS
Development ............................................................................................................................ 65 Figure 33. Estimated Incremental Employment by Place of Residence, North Aleutian Basin OCS
Development ............................................................................................................................ 66 Figure 34. Estimated Incremental Employment: Beaufort, Chukchi, and North Aleutian Basin OCS
Development ............................................................................................................................ 67 Figure 35. Estimated Incremental Employment by Place of Work: Beaufort, Chukchi, and North
Aleutian Basin OCS Development ............................................................................................. 68 Figure 36. Estimated Incremental Employment by Place of Residence: Beaufort, Chukchi, and
North Aleutian Basin OCS Development ................................................................................... 69 Figure 37. Estimated Statewide Population Effects, Beaufort OCS Development............................... 71 Figure 38. Estimated Population Effects by Region, Beaufort OCS Development .............................. 72 Figure 39. Estimated Statewide Population Effects, Chukchi OCS Development ............................... 73 Figure 40. Estimated Population Effects by Region, Chukchi OCS Development............................... 74 Figure 41. Estimated Statewide Population Effects, Combined Beaufort and Chukchi OCS Activity... 75 Figure 42. Estimated Population Effects by Region, Combined Beaufort and Chukchi OCS Activity .. 76 Figure 43. Estimated Statewide Population Effects, North Aleutian Basin OCS Development ............ 77 Figure 44. Estimated Population Effects by Region, North Aleutian Basin OCS Development............ 78 Figure 45. Estimated Statewide Population Effects: Beaufort, Chukchi, and North Aleutian Basin
OCS Development .................................................................................................................... 79 Figure 46. Estimated Population Effects by Region: Beaufort, Chukchi, and North Aleutian Basin
OCS Development .................................................................................................................... 80 Figure 47. Projected Employment on the North Slope without Beaufort OCS Development ............. 81 Figure 48. Estimated Incremental Employment on the North Slope with Beaufort OCS
Development ............................................................................................................................ 82
Economic Analysis of Future Offshore Oil and Gas Development: Beaufort Sea, Chukchi Sea, and North Aleutian Basin
vi
Figure 49. Estimated Total Employment on the North Slope with and without Beaufort OCS Development ............................................................................................................................83
Figure 50. Estimated Local Population Effect, Beaufort OCS Development .......................................84 Figure 51. Estimated Employment on the North Slope without Chukchi OCS Development .............85 Figure 52. Estimated Incremental Employment on the North Slope with Chukchi OCS
Development ............................................................................................................................86 Figure 53. Estimated Total Employment on the North Slope with and without Chukchi OCS
Development ............................................................................................................................87 Figure 54. Estimated Local Population Effect, Chukchi OCS Development........................................88 Figure 55. Estimated Incremental Employment on the North Slope with Beaufort and Chukchi
OCS Development ....................................................................................................................89 Figure 56. Estimated Total Employment on the North Slope with and without Beaufort and
Chukchi OCS Development ......................................................................................................90 Figure 57. Estimated Local Population Effect, Combined Beaufort and Chukchi OCS
Development ............................................................................................................................91 Figure 58. Estimated Employment in the North Aleutian Region without OCS Development ............92 Figure 59. Estimated Incremental Employment in the North Aleutian Region with North Aleutian
Basin OCS Development ...........................................................................................................93 Figure 60. Estimated Total Employment in the North Aleutian Region with and without North
Aleutian OCS Development.......................................................................................................94 Figure 61. Estimated Local Population Effect, North Aleutian Basin OCS Development.....................95 Figure 62. State General Fund Revenue, No OCS Case ..................................................................109 Figure 63. Permanent Fund Balance No OCS Case ........................................................................110 Figure 64. State Operations Spending Per Capita and Capital Spending Per Capita.........................111 Figure 65. Projected North Slope Borough Petroleum Revenues without Beaufort OCS
Development ..........................................................................................................................118 Figure 66. Estimated North Slope Borough Incremental Petroleum Revenues, Beaufort OCS
Development ..........................................................................................................................119 Figure 67. Estimated North Slope Borough Petroleum Revenues with and Without Beaufort OCS
Development ..........................................................................................................................120 Figure 68. Projected North Slope Borough Per Capita Local Revenues, Beaufort OCS
Development ..........................................................................................................................121 Figure 69. Projected North Slope Borough Petroleum Revenues without Chukchi OCS
Development ..........................................................................................................................122 Figure 70. Estimated North Slope Borough Incremental Petroleum Revenues, Chukchi OCS
Development ..........................................................................................................................123 Figure 71. Estimated North Slope Borough Petroleum Revenue with and without Chukchi OCS
Development ..........................................................................................................................124 Figure 72. Projected North Slope Borough Per Capita Local Revenues, Chukchi OCS
Development ..........................................................................................................................125 Figure 73. Projected North Slope Borough Incremental Petroleum Revenue, Combined
Beaufort and Chukchi OCS Development................................................................................126 Figure 74. Estimated North Slope Borough Petroleum Revenue with and without Combined
Beaufort and Chukchi OCS Development................................................................................127

Economic Analysis of Future Offshore Oil and Gas Development: Beaufort Sea, Chukchi Sea, and North Aleutian Basin
vii
Figure 75. Projected North Slope Borough Per Capita Local Revenues, Combined Beaufort and Chukchi OCS Development .................................................................................................... 128
Figure 76. Projected Regional Revenue without North Aleutian OCS Development ....................... 129 Figure 77. Estimated Incremental Petroleum Revenue, North Aleutian Basin OCS Development .... 130 Figure 78. Estimated Petroleum Revenues with and without North Aleutian OCS Development..... 131 Figure 79. Projected Aleutians East Borough Per Capita Local Revenues, North Aleutian OCS
Development .......................................................................................................................... 132

Economic Analysis of Future Offshore Oil and Gas Development: Beaufort Sea, Chukchi Sea, and North Aleutian Basin
viii

Economic Analysis of Future Offshore Oil and Gas Development: Beaufort Sea, Chukchi Sea, and North Aleutian Basin
ix
Abbreviations
2D 2-dimensional 3D 3-dimensional ADF&G Alaska Department of Fish and Game AEB Aleutians East Borough AGIA Alaska Gasline Inducement Act ANS Alaska North Slope ANWR Arctic National Wildlife Refuge Bbbl billion barrels BBO billions of oil and condensate BBOE billions of barrels of oil or energy-equivalent basis Bcf billion cubic feet BOE barrels of oil or energy-equivalent bopd barrels of oil per day Btu’s British Thermal Units CIAP Coastal Impact Assessment Program CPS Coastal Political Subdivisions EIA Energy Information Administration EIS Environmental Impact Statement IMPAK Economic Impact Model for Petroleum Activities in Alaska ISER Institute of Social and Economic Research, University of Alaska Anchorage LNG Liquefied natural gas MAP Man in the Arctic Program MMBO million barrels of oil MMBC million barrels of condensate mmcf million cubic feet MMS Minerals Management Service NAB North Aleutian Basin NPDES National Pollutant Discharge Elimination System NPR-A National Petroleum Reserve-Alaska NSB North Slope Borough OCS outer continental shelf OCSLA Outer Continental Shelf Lands Act TAPS Trans-Alaska Pipeline System TCF trillion cubic feet TCFG trillion cubic feet of gas UERR Undiscovered Economically Recoverable Resources UTRR Undiscovered Technically Recoverable Resources

Economic Analysis of Future Offshore Oil and Gas Development: Beaufort Sea, Chukchi Sea, and North Aleutian Basin
x

Economic Analysis of Future Offshore Oil and Gas Development: Beaufort Sea, Chukchi Sea, and North Aleutian Basin
ES-1
Executive Summary
This study describes and quantifies the potential economic benefits to the State of Alaska and local communities from developing oil and gas resources in Alaska’s Outer Continental Shelf (OCS) areas. The findings of this study are not predictions of the future for Alaska, but rather they describe a reasonable approach that one might expect for OCS development. The findings also provide a basis for thinking about potential actions that state and local governments, industry, and other stakeholders might undertake to deal most effectively with the effects that do occur.
While there have been other studies in the past that looked at the potential effects of OCS development, this study is based on more recent information and represents the current state of knowledge in OCS resource estimates, exploration, development, and production activities; recent technology improvements; and state and local government fiscal systems. The economic benefits described here are based on assumptions about when and how OCS development, as well as other economic development in the state, might occur during the next 50 years.
The magnitude of the economic effects of OCS development are contingent on assumptions about petroleum prices, volumes of OCS resources that might be economically recoverable, the levels of investment that the petroleum industry would be willing to spend to develop in the OCS areas, and the fiscal regime or tax structure that would be in effect as OCS oil and gas development occurs. There is a great deal of uncertainty as to whether oil and gas production in the OCS would occur, and if production does occur, it is even more difficult to predict the timing and magnitude of exploration, development, and production activities. This study assumes that development would occur given certain price and cost assumptions and that there will be no major regulatory impediments or delays to OCS development. As with any other large industrial development, there could also be social and environmental considerations associated with offshore oil and gas development. This study is only focused on the economic effects of OCS development.
Major Findings The economic impacts of OCS development are described as incremental effects in relation to a baseline economic projection of the Alaska economy without OCS development. The Alaska economy and population are anticipated to continue to grow in the next 50 years given the development of the natural gas pipeline, new development in the mining sector, and modest growth in tourism, fisheries, and military and civilian federal operations. However, declining oil production from existing onshore fields is expected to pose long-term challenges to Alaska’s economic and fiscal well-being. OCS development, if it were to occur, could be a significant driver of the next generation of economic activity by extending the duration of the petroleum industry in the state.
The following major findings are based on a reasonable set of exploration, development, and production scenarios for three OCS areas: (1) Beaufort Sea; (2) Chukchi Sea; and (3) North Aleutian Basin.
Job and Population Growth ! OCS development could generate an annual average of 35,000 jobs over the next 50 years—a six
percent increase compared to total statewide employment without OCS development.
! These jobs represent a total payroll of $72 billion (2007$) over the 50-year period.

Economic Analysis of Future Offshore Oil and Gas Development: Beaufort Sea, Chukchi Sea, and North Aleutian Basin
ES-2
! OCS-related employment growth could more than offset losses from the decline of petroleum production on state lands and could help sustain the economy for several decades.
! Opportunities would be created throughout the state in both high paying, long-term, year-round jobs and in seasonal and short-term jobs. Of the 6,000 oil and gas sector jobs, about 3,900 could be long-term, year-round jobs.
! The growth in jobs resulting from OCS development could lead to a five percent increase in statewide population. Most of the growth would be concentrated in Alaska’s population centers, but directly impacted regions could experience a much greater percent increase.
Table ES-1. Potential Future Employment Effects of OCS Development in Alaska
Sector Average Annual Employment Oil and Gas (extraction and oilfield services) 6,000 Infrastructure 3,000 Support 22,000 State/Local Government 4,000 Total: 35,000 Note: Employment is rounded and expressed in annual average, 2008 to 2057. It should be noted that it could take several years before OCS employment might reach the annual average of 6,000 direct jobs in the oil and gas sector, and for the other sectors to reach the levels noted above (see Figure ES-1 for the projected direct employment per year and Figure ES-2 for the projected employment by sector per year).
Projected Direct Revenues The potential cumulative direct petroleum revenues to state and local governments is estimated to be $5.8 billion (2007$) with most revenues going to directly impacted local governments from property taxes on onshore petroleum facilities.
Table ES-2. Potential Cumulative Direct Revenue Effects of OCS Development to State and Local Governments, 2008 to 2057 (in Billions of 2007$)
Entity/Source of Revenue Amount State of Alaska 1.4 Property Tax 0.4 Corporate Income Tax 1.0 Shared Lease Payments -- Directly Impacted Local Governments 4.5 Property Tax 4.5
Total Alaska: 5.8 Notes: (1) The sum of the amounts do not equal total due to rounding. (2) For this table, Directly Impacted Local Governments include the North Slope Borough and the Aleutians East Borough. (3) Federal lease payments shared with the state (from 8(g) leases) are estimated to be about $20 million (2007$).
Economic Analysis of Future Offshore Oil and Gas Development: Beaufort Sea, Chukchi Sea, and North Aleutian Basin
ES-3
Fiscal Effects ! Potential total state government revenues (under the current tax system) from OCS-related
activities including direct OCS petroleum revenues, population-related revenues, and indirect petroleum revenues, are projected to be $15.3 billion (2007$) given the base case price level of approximately $65 per barrel of crude oil. As expected, given the results of the sensitivity analysis, state government stands to benefit from higher petroleum prices.
! The estimated population-related revenues would come primarily from a state personal income tax that is assumed in the baseline projection to partially offset falling petroleum revenues from declining onshore production. This is an assumption in the baseline analysis, regardless of OCS development. In the OCS case, the $72 billion (2007$) of wages and salaries augments the personal income tax.
! OCS production reduces the tariffs and other costs of onshore production, which results in an increase in state revenues from this production. These lower costs also lead to a modest increase in production onshore. Together these indirect petroleum revenues are estimated to be $10.1 billion (2007$)
! Incremental state government expenditures for providing public services to support OCS development and the associated population increase are projected to be about $8.8 billion (2007$).
! The projected net revenues to the State of Alaska could be about $6.6 billion (2007$), reflecting a positive fiscal effect of OCS development.
! At the local/regional government level, the projected growth in revenues of directly impacted communities from property taxes on onshore OCS petroleum facilities, estimated at $4.5 billion, would increase the capacity of local governments to respond to public needs generated by OCS developments.
! OCS development will be an important factor in reducing risks for the proposed natural gas pipeline from the North Slope to Lower 48 markets. The Alaska OCS has some of the largest natural gas resources in Alaska and knowledge of the potential development of these resources reduces the financial risk to the shippers that may commit to the natural gas pipeline project.

Economic Analysis of Future Offshore Oil and Gas Development: Beaufort Sea, Chukchi Sea, and North Aleutian Basin
ES-4
Table ES-3. Potential State Fiscal Effects of OCS Development: Cumulative Revenues and Expenditures Under Varying Price Assumptions, 2008 to 2057 (in Billions of 2007$)
Sensitivity Analysis Revenue/Expenditure Category
Base Case Case 1 Case 2 Case 3
Projected State Revenues 15.3 16.0 17.1 18.2 Direct OCS Petroleum Revenues 1.4 1.4 1.4 1.4 Population Related Revenues 3.9 3.9 3.9 3.9 Indirect Petroleum Revenues due to OCS development
TAPS-Fuller Pipeline Enhanced Value of North Slope Production 5.7 5.7 5.7 5.7 TAPS-Fuller Pipeline Additional North Slope Production 2.0 2.4 3.1 3.8 Gas Pipeline Tariff Reduction Effect 1.2 1.2 1.2 1.2 Incremental Production due to OCS Infrastructure 1.2 1.5 1.9 2.3
Projected Incremental State Expenditures (8.8) (8.8) (8.8) (8.8) Projected State of Alaska Net Fiscal Balance: 6.6 7.2 8.3 9.4 Notes: (1) The sum of the amounts may not equal the total due to rounding. (2) Base case estimates are based on the Energy Information Administration’s petroleum price projection with a long-term average price of $65.50 per barrel of oil and $6.40 per million Btu’s of gas (in 2006$). The sensitivity analysis considers the following oil and gas price levels through 2030; prices thereafter are assumed to increase at a rate of 0.5 percent per year (same assumption as the base case):
- Case 1: Oil: $80 per barrel and Natural gas: $7.8 per mmBtu - Case 2: Oil: $100 per barrel and Natural Gas: $9.8 per mmBtu - Case 3: Oil: $120 per barrel and Natural Gas: $11.8 per mmBtu
The sensitivity analysis cases estimate the effects of higher petroleum prices, holding all other factors constant.
Background Increasing petroleum prices in the past five years have renewed interest in exploring for oil and gas in Alaska’s OCS areas. This is evidenced by the recent OCS lease sales in Alaska—Beaufort Lease Sale 195 was the most successful sale in the Beaufort OCS (tracts and high bids) since 1988 and Chukchi Lease Sale 193 held in February 2008, collected $2.66 billion in high bids for 488 tracts (this is the biggest lease sale onshore or offshore in Alaska’s history). More lease sales are planned in the Beaufort Sea, Chukchi Sea, and the North Aleutian Basin as part of MMS’s 5-Year Lease Program for 2007-2012. Exploration drilling is already planned for leases in the Beaufort Sea, covering five prospects in the eastern Beaufort (including Sivulliq, formerly the Hammerhead discovery), and another prospect located about 20 miles north of the Colville River Delta (MMS 2007).
MMS estimates that the OCS areas of the Beaufort Sea, Chukchi Sea, and the North Aleutian Basin have undiscovered technically recoverable resources (UTRR) ranging from 2.8 to 65.8 billion barrels of oil (BBO) and 11.4 to 305 trillion cubic feet (TCF) of natural gas, depending on the likelihood of occurrence. MMS also estimates that the three OCS areas have undiscovered economically recoverable resources (UERR) ranging from 1 to 46 billion barrels of oil and 3.8 to 175.1 TCF of gas. Economically recoverable resources represent the portion of the undiscovered technically recoverable resources that can be explored, developed and commercially produced at given costs and price considerations. MMS assumed market prices of $60 per barrel of oil and $9.07 per thousand cubic feet of gas (in 2006$) for the UERR estimates of the three Alaska OCS areas.

Economic Analysis of Future Offshore Oil and Gas Development: Beaufort Sea, Chukchi Sea, and North Aleutian Basin
ES-5
Scenarios Considered In order to quantify the potential effects of oil and gas development in the OCS, a set of scenarios that reflect possible industry-wide exploration, development, and production activities for each OCS area was developed.1 Of course, this set of scenarios represents only one possible picture of the future. It is likely that different activities and timing will occur in the future, as each company operating in these basins could have unique plans for identifying and recovering the hydrocarbon resources. Furthermore, there is a high level of uncertainty regarding the volumes of oil and gas that could be commercialized in the future, as the estimated resource potential shown in the table above is not yet proven commercial reserves. It is impossible to anticipate what the actual development pattern would be, but the scenarios provide a reasonable basis to begin thinking about potential effects, particularly since they provide employment estimates consistent with historical patterns of petroleum development in the state.
The scenarios used for this study are based in part on the scenarios discussed by MMS in published Environmental Impact Statements (EIS) and other materials.2 The scenarios include assessments of oil and gas resources,3 expected levels of exploration activities, development of oil and gas fields and required infrastructure, and operations and maintenance activities at the assumed production levels.
These scenarios are the basis for determining the level of manpower requirements, as well as the amount of revenues that could potentially accrue to the state and local governments. Summaries of the scenarios are presented below.
Beaufort Scenario ! Exploration drilling occurs over 15 years with 1 to 3 drilling rigs per season.
! Development includes construction of seven offshore production platforms, offshore pipelines, on-shore pipelines that connect to the Trans-Alaska Pipeline System (TAPS) and a future gas pipeline, as well as new on-shore facilities.
! Production assumes first oil in 2019 and first gas in 2029, with seven fields producing a total cumulative volume of about five billion barrels of oil and seven trillion cubic feet of gas through 2057.
1 The Minerals Management Service, the federal agency that manages OCS areas, develops exploration, development, and production scenarios for use in their environmental assessments and environmental impact studies. The scenarios developed by MMS for these OCS areas were used as a starting point for this analysis. Major departures from the MMS assumptions/scenarios include: 1) gas production in the Beaufort and Chukchi; 2) new on-shore facilities in the Beaufort; 3) updated resource estimates using the 2006 MMS Resource Assessment; and 4) adjustments in timing and level of exploration and development activities to reflect changes in technology and resource potential, and to incorporate insights from industry and MMS staff regarding recent experience operating in arctic conditions and in areas of greater water depths.
2 The recent Draft Environmental Impact Statement for the Beaufort and Chukchi Sea Planning Areas, Oil and Gas Lease Sales 209, 212, 217, and 221 was issued after the analysis for this report was completed. The scenarios used in this report are based on earlier scenarios and other material that are broader in scope and duration than the November 2008 draft EIS.
3 The resource assessments are based on analyses of geology, development costs, and timing, as well as oil and gas prices.
Economic Analysis of Future Offshore Oil and Gas Development: Beaufort Sea, Chukchi Sea, and North Aleutian Basin
ES-6
Chukchi Scenario ! Exploration drilling occurs over 24 years with 1 to 2 drilling rigs per season.
! Development includes construction of four offshore production platforms, offshore pipelines, on-shore pipelines across the National Petroleum Reserve – Alaska (NPR-A) to connect to the TAPS and a future gas pipeline from the North Slope. A new shore base4 on the Chukchi coast is assumed to be constructed to support offshore exploration and development; other on-shore facilities are also assumed to be required to support production activities.
! Production assumes first oil in 2022 and first gas in 2036, with four fields producing a total cumulative volume of 4.8 billion barrels of oil and 7.8 trillion cubic feet of gas through 2057.
North Aleutian Scenario ! Exploration drilling occurs over 5 years with 1 to 2 drilling rigs per season.
! Development includes construction of two offshore production platforms, offshore and overland pipelines, a new shore base on the north side of the Alaska Peninsula, and on the south side a marine terminal for oil, as well as a liquefied natural gas (LNG) facility and an export terminal for gas.
! Production assumes first oil in 2021 and first gas in 2022, with two fields producing a total cumulative volume of about 0.394 billion barrels of oil and 5 trillion cubic feet of gas through 2044 when production ceases.
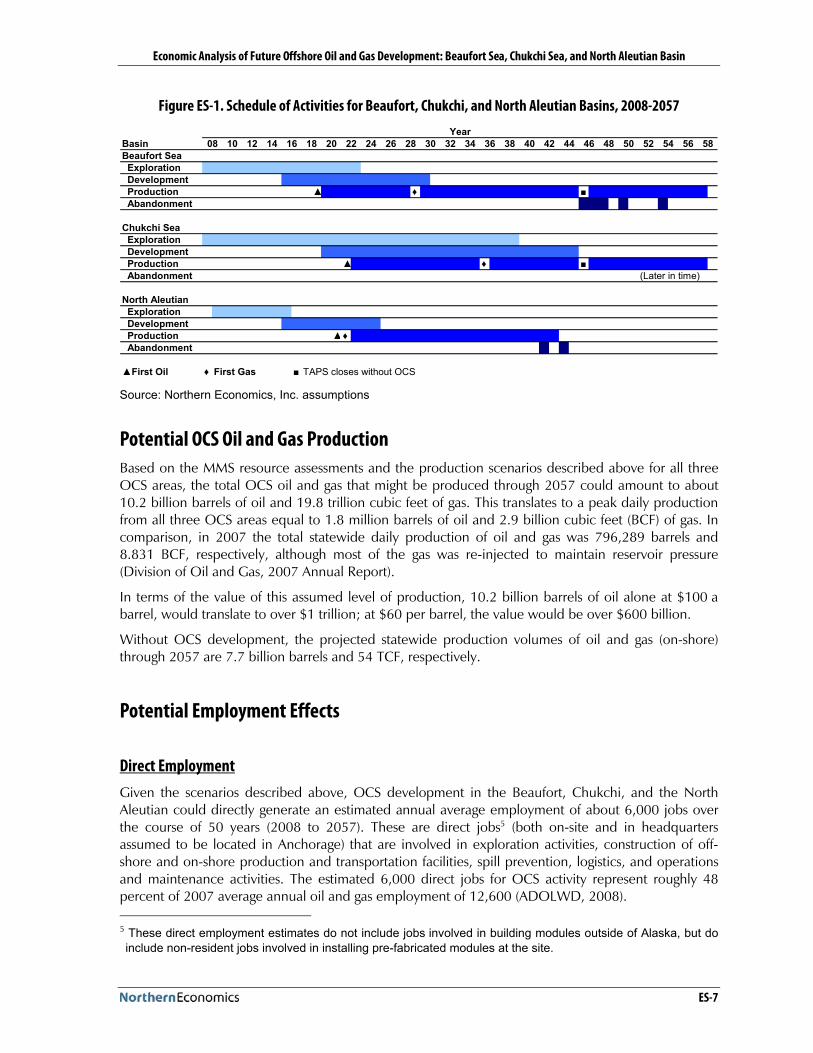
Activity Schedule Figure ES-1 shows a potential schedule for exploration, development, production and abandonment activities from 2008 through 2057. The figure shows the expected years for first oil and gas production under the scenarios for each basin. The first gas production in the Beaufort Sea is assumed to occur with the first expansion of the proposed natural gas pipeline in 2029, nine years after initial throughput of the gas pipeline. First gas production from the Chukchi Sea is assumed to occur in 2036 with the second expansion of the natural gas pipeline. Both of these expansions are anticipated to reduce the gas pipeline tariff.
The Beaufort scenario assumes that production would still be ongoing in 2057 when the study period ceases. The relatively late discovery and production from expected large resources in the Chukchi Sea result in no platforms being abandoned during the study period. The smaller field sizes expected in the North Aleutian Basin result in the fields ceasing production and the platforms being abandoned by 2044.
4 A shore base is an on-shore facility that will be used for staging people and equipment during exploration, and later on to support construction and production activities. The base will likely serve as living quarters for industry workers as well as the transportation, storage, and communication hubs for all of the offshore activities.
Economic Analysis of Future Offshore Oil and Gas Development: Beaufort Sea, Chukchi Sea, and North Aleutian Basin
ES-7
Figure ES-1. Schedule of Activities for Beaufort, Chukchi, and North Aleutian Basins, 2008-2057
BasinBeaufort Sea Exploration Development Production ! " # Abandonment
Chukchi Sea Exploration Development Production ! " # Abandonment (Later in time)
North Aleutian Exploration Development Production !" Abandonment
!First Oil " First Gas # TAPS closes without OCS
5850 52 54 5642 44 46 4834 36 38 4026 28 30 32Year
08 10 12 14 16 18 20 22 24
Source: Northern Economics, Inc. assumptions
Potential OCS Oil and Gas Production Based on the MMS resource assessments and the production scenarios described above for all three OCS areas, the total OCS oil and gas that might be produced through 2057 could amount to about 10.2 billion barrels of oil and 19.8 trillion cubic feet of gas. This translates to a peak daily production from all three OCS areas equal to 1.8 million barrels of oil and 2.9 billion cubic feet (BCF) of gas. In comparison, in 2007 the total statewide daily production of oil and gas was 796,289 barrels and 8.831 BCF, respectively, although most of the gas was re-injected to maintain reservoir pressure (Division of Oil and Gas, 2007 Annual Report).
In terms of the value of this assumed level of production, 10.2 billion barrels of oil alone at $100 a barrel, would translate to over $1 trillion; at $60 per barrel, the value would be over $600 billion.
Without OCS development, the projected statewide production volumes of oil and gas (on-shore) through 2057 are 7.7 billion barrels and 54 TCF, respectively.
Potential Employment Effects
Direct Employment Given the scenarios described above, OCS development in the Beaufort, Chukchi, and the North Aleutian could directly generate an estimated annual average employment of about 6,000 jobs over the course of 50 years (2008 to 2057). These are direct jobs5 (both on-site and in headquarters assumed to be located in Anchorage) that are involved in exploration activities, construction of off-shore and on-shore production and transportation facilities, spill prevention, logistics, and operations and maintenance activities. The estimated 6,000 direct jobs for OCS activity represent roughly 48 percent of 2007 average annual oil and gas employment of 12,600 (ADOLWD, 2008). 5 These direct employment estimates do not include jobs involved in building modules outside of Alaska, but do include non-resident jobs involved in installing pre-fabricated modules at the site.

Economic Analysis of Future Offshore Oil and Gas Development: Beaufort Sea, Chukchi Sea, and North Aleutian Basin
ES-8
Figure ES-2 shows the potential direct annual average employment in the oil and gas industry that could result from OCS development in all three areas across time. The growth in employment in the next decade associated with OCS development could offset the decline in petroleum employment associated with the decline in oil production from state lands and maintain employment levels after the construction of the gas pipeline. Subsequently, for about 2 decades, employment could be relatively stable as fields are developed and produced over that period. Eventually, direct employment will decline as production declines and fields are abandoned. As noted earlier, this is just one possible pattern; OCS development could occur in different locations and different times and the development of multiple fields could tend to smooth out any boom and bust phenomenon.
Figure ES-2. Potential Total Direct Annual Average Employment from OCS Development in Alaska, 2008 to 2057
0
1,000
2,000
3,000
4,000
5,000
6,000
7,000
8,000
9,000
10,000
2008 2012 2016 2020 2024 2028 2032 2036 2040 2044 2048 2052 2056
Source: Northern Economics Inc. estimates.
Peak employment across all OCS areas based on these development scenarios could occur in 2038 with an estimated annual average employment of 9,500; the peaking occurs when major discoveries are being developed and facility construction is underway. Table ES-4 shows the potential direct employment effects that could result from oil and gas development in each of the OCS areas. The peak employment for each OCS area occurs at different times, and the production phases are of different durations so the rows cannot be summed across to arrive at the estimates shown for all areas.

Economic Analysis of Future Offshore Oil and Gas Development: Beaufort Sea, Chukchi Sea, and North Aleutian Basin
ES-9
Table ES-4. Potential Direct Employment Estimates (Annual Average Employment) by OCS Area
Beaufort Chukchi North Aleutian All Areas Annualized Average
Entire time frame 2,800 2,500 900 6,000 Production phase 3,300 3,000 1,100 7,100
Peak Employment 4,800 4,200 2,200 9,500 Year of Peak Employment 2027 2038 2018 2038 Source: Northern Economics Inc. estimates.
The job estimates are expressed in annual average employment, but there would be opportunities for both year-round and seasonal or short-term jobs. As noted earlier, of the 6,000 direct oil and gas industry jobs, about 3,900 could be high paying year-round jobs. The current average annual wage in the oil and gas sector is $108,538—which is more than double the statewide annual average of $43,524.
Seasonal and short-term job opportunities include those associated with oil spill response operations, equipment operations, construction of support facilities, marine mammal observer program, camp support, seismic survey, etc. The number of persons that might be employed for short-term or seasonal jobs could be greater than the number of year-round jobs.
Indirect and Induced Employment Besides the direct jobs in the oil and gas sector, jobs would be created in other sectors of the economy; these jobs are referred to as indirect and induced jobs. These jobs are generated as a result of the multiplier effects of in-state spending—industry purchases from other Alaska businesses, government spending of OCS-related revenues, and household spending of wages and salaries. The potential employment effects of OCS development by sector are shown in Figure ES-3.
The large number of indirect and induced employment6 associated with OCS development is attributable to the following:
! Potential large in-state purchases of goods and services by the businesses directly engaged in exploration, development, and production
! High wages of the oil and gas industry
! Significant revenues paid by the industry to state and local governments
Although direct oil and gas employment would taper off as OCS production declines, total employment could remain high due to the effects on the rest of the economy from the economic expansion associated with OCS development. These effects include increased public and private wealth, the expansion of in-state businesses offering goods and services to other Alaska businesses and households, expansion of local markets creating more competition and lower costs, and enhanced economic stability from reduced seasonality.
6 The ratio of total to direct OCS employment, commonly referred to as the employment multiplier, is approximately 5.9 over the entire period, a level consistent with historical oil and gas activities in the state. If the ratio is calculated as total divided by direct plus government employment, since Alaska government employment is driven by oil revenues, the multiplier is 3.4.

Economic Analysis of Future Offshore Oil and Gas Development: Beaufort Sea, Chukchi Sea, and North Aleutian Basin
ES-10
It is estimated that total annual average employment from OCS development—including all the direct, indirect, and induced employment—could be about 35,000 per year on average through 2057, with a peak employment of over 50,000 in 2038. Total wages and salaries associated with OCS development over the 50-year period are estimated to be about $72 billion (2007$).
Figure ES-3. Potential Total Employment Effects from OCS Development by Category
0
10,000
20,000
30,000
40,000
50,000
2008 2012 2016 2020 2024 2028 2032 2036 2040 2044 2048 2052 2056
Direct Infrastructure Support State-Local
Source: Northern Economics, Inc. and ISER estimates.
As shown earlier in Table ES-1, 35,000 direct, indirect, and induced jobs could be created in different sectors of the economy. The majority of the total employment, about 22,000, would be in the support sector, which includes trade, services, and other related businesses. These businesses provide goods and services to other Alaska businesses as well as Alaska households. Projected infrastructure employment consists of about 3,000 workers in the transportation, communications, public utilities, and business services sectors that work closely with the petroleum industry. State/local government employment includes all the public sector jobs; OCS development is estimated to generate 4,000 public sector jobs.
Employment by Place of Work and by Place of Residence Based on history, workers will come from throughout the state and elsewhere to take the on-site jobs. Given the current distribution of North Slope oil and gas industry workers around the state, it is anticipated that residents of Anchorage, Kenai, and the Matanuska-Susitna (Mat-Su) Borough could capture a large share of the potential employment. The opportunity exists for rural residents of the state, particularly residents of the North Slope Borough and other areas in proximity to the three OCS

Economic Analysis of Future Offshore Oil and Gas Development: Beaufort Sea, Chukchi Sea, and North Aleutian Basin
ES-11
areas, to capture a larger share of these jobs than shown in Table ES-5, which is based on past employment data. Table ES-5 shows the incremental increase in annual average employment by place of work and by place of residence resulting from the development scenarios in all three OCS areas.
Table ES-5. Estimated Annual Average Employment Generated from Potential OCS Development by Place of Work and by Place of Residence
Direct Total Employment
Direct + Indirect + Induced
Place Place of Work Place of
Residence Place of Work Place of
Residence Anchorage 800 2,500 15,000 16,000 Mat-Su Borough -- 500 3,000 3,000 Kenai Peninsula Borough -- 500 2,000 3,000 Fairbanks North Star Borough <100 250 3,000 3,000 Aleutians East and West 600 100 1,000 1,000 North Slope Borough 4,500 <100 6,000 2,000 Balance of State -- <100 5,000 5,000 Outside Alaska -- 2,000 -- 2,000 Total 6,000 6,000 35,000 35,000 Source: Northern Economics and ISER estimates. Distribution of workers by place of residence is based on Alaska Department of Labor and Workforce Development data.
Direct Petroleum Revenues Federal, state, and local governments could directly benefit from offshore oil and gas development with three potential streams of revenues—property tax revenues, corporate income tax revenues, and revenues from OCS leases. The estimated incremental revenues from OCS development accruing to the state and local governments are shown in Table ES-6.

Economic Analysis of Future Offshore Oil and Gas Development: Beaufort Sea, Chukchi Sea, and North Aleutian Basin
ES-12
Table ES-6. Summary of Potential Cumulative Direct Revenues to the State and Local Governments, 2008 to 2057 (in Billions of 2007$)
Entity Amount State of Alaska 1.4 Property Tax 0.4 Corporate Income Tax 1.0 Shared Lease Payments -- Impacted Local Governments 4.5 North Slope Borough
Property Tax 3.5 Aleutians East Borough
Property Tax7 1.0 Total Alaska: 5.8 Source: Northern Economics Inc. and ISER MAP model estimates.
Notes: (1) The sum of the amounts may not equal the total due to rounding. (2) The potential revenue effects shown above reflect the base case analysis that is based on the Energy Information Administration’s price projection; a relatively conservative long-term average price of about $65.50 per barrel of oil and $6.40 per million Btu’s of gas (in 2006 dollars).
Property taxes would primarily be generated from the new onshore facilities that could be built to support the offshore operations of the industry. The state collects a property tax on oil and gas related facilities within its boundaries, which it shares with local political jurisdictions where those facilities are located, if the local government chooses to impose a property tax.
The state also imposes a corporate income tax on petroleum activity within the state.8 The federal government collects revenues from bonus bids, rental payments, and royalty payments from the offshore activity. A portion of these federal revenues is shared with the state, which in turn may distribute a portion to some local governments.
Given the current OCS revenue sharing system in Alaska, all lease revenues from OCS areas directly accrue to the federal government except for a portion of revenues from leases in the 8(g) zone9 and funds allocated through the Coastal Impact Assistance Program (CIAP) that are shared with the state and coastal political subdivisions. Under the current system, Alaska would receive a 27 percent share of OCS lease revenues from the 8(g) zone and a share of the CIAP Funds that are allocated among different producing states based on a formula. The CIAP funds however are temporary and may not
7 For this analysis, the potential revenue benefits accrue to the North Slope Borough (NSB) and the Aleutians East Borough (AEB), assuming that all support base, production, and transportation facilities would be built within the geographic jurisdiction of these two Boroughs. It is of course possible that industry would choose to locate some facilities in other areas such as the Northwest Arctic Borough or the Lake and Peninsula Borough, or the City of Unalaska. Also, it is assumed that the Aleutians East Borough would ultimately levy a property tax similar to the North Slope Borough. Again, the findings presented here are contingent on the assumptions about likely development and production activities as described in the scenarios for each OCS area.
8 A share of world income is attributed to Alaska based upon the share of property, sales, and extraction within the state.
9 This three-mile wide band extends from the 3-nautical mile state-federal demarcation line seaward to 6-nautical miles offshore.

Economic Analysis of Future Offshore Oil and Gas Development: Beaufort Sea, Chukchi Sea, and North Aleutian Basin
ES-13
be available after federal fiscal year 2010. It should be noted that lease sales in 2007 and 2008 are expected to generate a significant increase in CIAP funds to Alaska, especially given the successful Chukchi lease sale held in 2008.10 In the OCS development scenarios developed for this study, the Beaufort Sea would be the only OCS area with 8(g) producing leases.
Without a change in the current revenue sharing arrangement, the state and local governments are expected to receive direct revenues from OCS development of about $5.8 billion (2007$)—mostly from leases located between three nautical miles to six nautical miles offshore (referred to as the 8(g) zone), a share of the Coastal Impact Assistance Program (CIAP) funds, which is due to sunset in 2010, and taxes on corporate income and on-shore properties.
Potential State Population and State Fiscal Effects The new jobs generated by OCS development could lead to an increase in statewide population that averages 49,000 over the projection period—about five percent higher than projected population without OCS activity. The population increase would consist mostly of families, including infants, children, and seniors, although the majority of new Alaskans would be working age adults.
The population increase would place new demands on state government, which funds the majority of public services in Alaska either directly or through transfers to local governments. The most important state-provided public services sensitive to population are education, health and social services, corrections, the University of Alaska, transportation, and public safety.
The cost of OCS development to state government would consist of the cost of providing services to the new population as noted above (estimated at $8.6 billion) as well as the cost of administering OCS programs (estimated at $0.2 billion). In total, the incremental cost to the state of Alaska from OCS development is estimated to be $8.8 billion (2007$).
Total direct and indirect revenues generated by the OCS development scenarios presented here could amount to $15.3 billion (2007$), which could pay for the new public services as well as produce a revenue surplus that could be used by the state for any purpose. Total revenues would include the direct OCS petroleum revenues, plus general tax revenues of $3.9 billion and spinoff or indirect revenues from other petroleum activity of $10.1 billion.
The general tax revenues would come primarily from income taxes paid by the new workers. In the baseline projection (without OCS development), there is a fiscal assumption of a state personal income tax based on the fact that revenues from existing sources are projected to decline in future years, thus requiring new sources of revenues to fund the state budget. To be consistent with that no-OCS assumption, it is assumed that the state government utilizes the potential of the $72 billion (2007$) of wages and salaries generated by OCS activity to help to pay for the new public services.
Indirect or spinoff revenues from other petroleum activity are difficult to quantify, but the history of development at Prudhoe Bay demonstrates their importance. Four sources of indirect revenues are identified that arise from the lower cost of petroleum production and transportation generated by OCS development (Table ES-3 summarizes the estimated indirect revenues from each source):
! It is estimated that $5.7 billion (2007$) in additional revenues to the state could be collected on non-OCS oil production due to the increase in TAPS throughput with OCS oil from the Beaufort and Chukchi Seas. If OCS oil is transported through TAPS, the higher volume of throughput
10 Due to an increase in OCS revenues generated by the recent Chukchi Lease Sale 193, MMS has estimated that the state of Alaska’s annual CIAP allocation will increase from approximately $2.5 million in 2007 and 2008 to be between $29 million and $41.2 million for 2009 and 2010.

Economic Analysis of Future Offshore Oil and Gas Development: Beaufort Sea, Chukchi Sea, and North Aleutian Basin
ES-14
would reduce the TAPS tariff and would extend the life of TAPS. The associated reduction in tariff would in turn raise the wellhead price of North Slope oil. An increase in the wellhead price would increase the tax base and revenues from the state production tax and corporate income tax and also increase state royalties. And, in the absence of OCS oil throughput, TAPS is anticipated to shut down when it reaches the minimum technically viable level of daily throughput—estimated at 200,000 barrels per day—which could be reached in 2046. Because this shut down would leave oil worth billions stranded on the North Slope, some alternative to move the oil to market could be deployed. It is assumed that a marine transport system would be used to move the remaining oil to market at an estimated cost of $15 per barrel ($2007).
! A higher wellhead value resulting from higher TAPS pipeline throughput because of OCS oil is also anticipated to have a stimulating effect on exploration and development of North Slope reserves. The average increase in wellhead value due to higher TAPS throughput is estimated to be six percent. The effect would be similar to an increase in industry activity due to higher oil prices or a reduction in taxes. Based on studies of the sensitivity of North Slope production to the price of oil, as well as observations that higher prices stimulate the development of satellite fields (smaller accumulations of oil that are adjacent to larger fields), it is estimated that this stimulating effect could result in an increase in oil production equal to 141 million barrels over the projection period. This could translate to an increase in state revenues of about $2 billion.
! The addition of OCS natural gas to throughput of the pipeline moving North Slope gas to market is estimated to increase state revenues by $1.2 billion. Although the pipeline capacity would need to be expanded to accommodate this additional throughput, expansion could be done at a cost that would reduce the tariff on all the gas moving through the line. Like the reduced oil pipeline tariff, this would raise the wellhead value of the gas and increase state revenues from the production and income taxes as well as royalties.
! Finally, the presence of additional petroleum infrastructure and its geographic distribution suggests that there could be opportunities for the development of fields that are in close geographic proximity to OCS infrastructure or that could share OCS facilities that would not be developed without those advantages. An expanded support industry due to OCS developments could also be the source of cost savings that could make some marginal fields economically attractive. The potential production and revenues from these latter effects could be very large indeed, but they are virtually impossible to quantify. However, to demonstrate the potential magnitude of these effects on state revenues, it was assumed that cumulative North Slope production is increased by two percent—87 million barrels—as a result of these effects. This could generate $1.2 billion (2007$) in additional state revenues from production and corporate income taxes and royalty payments to the state.
In addition to the benefits noted above, the potential for OCS development will be an important factor in reducing risks for the proposed natural gas pipeline from the North Slope to Lower 48 markets. At this time, there are not sufficient gas reserves to operate the gas pipeline for the 20 to 25 years that will be necessary to finance the pipeline; the natural gas shippers who must commit to moving gas in the pipeline for that period of time will need confidence that other natural gas resources can be found, and studies by the Minerals Management Service and others indicate that the OCS has some of the largest natural gas resources in Alaska. Knowledge of this potential resource reduces the financial risk to the shippers that commit to the natural gas pipeline project.

Economic Analysis of Future Offshore Oil and Gas Development: Beaufort Sea, Chukchi Sea, and North Aleutian Basin
ES-15
Local/Regional Population and Fiscal Effects Local economic impacts will be most significant in the regions adjacent to the basins where OCS activity occurs. As noted earlier, onsite employment in the North Slope Borough could average 45 percent higher with OCS development, while employment in the Aleutians region could be 11 percent higher. Although the percent increases in resident employment and population could be less than the increase in onsite employment, the increases in population as well as other local requirements to deal with the costs associated with development could require considerable new local revenues.
The OCS revenues that flow to the directly impacted regions would come primarily from a share of the state property tax based on the value of petroleum facilities onshore in their region. Under the fiscal regime, where no federal lease revenues are shared with the state and local governments, directly impacted local governments would rely on the property tax to pay for government services. The estimated cumulative OCS-related property tax revenues to the North Slope Borough could be $3.5 billion. This could be in addition to an estimated $7 billion over that same period without OCS development. The OCS revenues could serve to offset the decline in revenues associated with falling onshore oil production. The estimated cumulative OCS-related property tax revenues available to the Aleutians region could be $1 billion. Currently, the tax base of that region is quite modest and so the OCS development would represent a large increase in potential revenue generating capacity.
Given these estimates, directly impacted local governments could have sufficient revenues from property taxes to cover any costs associated with OCS development. However, their ability to adequately fund public services ultimately depends on the specific public costs associated with OCS. Greater sharing of federal lease revenues with the state and local governments, higher prices, and higher production all make it more likely that local costs can be fully offset by OCS revenues.
Much of the population impact from OCS development would be outside the directly impacted regions, and local governments throughout the state would be faced with additional costs associated with that additional population. Most of the population impact would be in urban Alaska where the existing tax base, primarily a combination of local sales and property taxes, is responsive to population growth. Based on the assumptions outlined in this study, the expanded state fiscal capacity (under the OCS development scenarios presented here) should be sufficient to cover these costs.
Finally, as with any other large industrial development, there could be social and environmental effects associated with offshore oil and gas development, and industry as well as state and local governments should continue efforts in developing and implementing programs or regulations designed to mitigate the potential effects of oil and gas development on the environment and social institutions.

Economic Analysis of Future Offshore Oil and Gas Development: Beaufort Sea, Chukchi Sea, and North Aleutian Basin
ES-16
Economic Analysis of Future Offshore Oil and Gas Development: Beaufort Sea, Chukchi Sea, and North Aleutian Basin
1
1 Introduction
Shell Exploration & Production (Shell) contracted with Northern Economics, Inc. and the Institute of Social and Economic Research, University of Alaska Anchorage (ISER) to analyze economic effects that could accrue to the State of Alaska and affected boroughs and communities from development activities in three outer continental shelf (OCS) areas of Alaska:
1) The Beaufort Sea;
2) The Chukchi Sea; and
3) The North Aleutian Basin.
This study quantifies the potential economic benefits of the petroleum industry’s future exploration, development, and production activities in terms of jobs and government revenues, as well as the associated population and fiscal effects on the state.
The first step in the analysis involved developing scenarios, or possible futures, that reflect possible industry-wide exploration, development, and production activities in each of the three Alaska OCS areas. The scenarios include assessments of oil and gas resources, expected levels of exploration activities such as seismic surveys and exploratory drilling, development of oil and gas fields, and required infrastructure, production volumes, and operations and maintenance activities given assumed production levels. These scenarios are the basis for determining the level of manpower requirements, as well as the amount of tax revenues and royalty payments that could potentially accrue to the State of Alaska and local governments. Section 3 of this report discusses in detail the scenarios for OCS development in the Beaufort Sea, Chukchi Sea, and North Aleutian Basin.
The next step involved estimating the direct effects associated with the oil and gas development scenario for each of the OCS areas. To estimate the direct employment and revenues, the Economic Impact Model for Petroleum Activities in Alaska (IMPAK model), which was originally developed for the Minerals Management Service (MMS), was modified for use in this study. The model provided information on input requirements, particularly manpower requirements, for exploration, development, and production activities that are specific to offshore oil and gas development. The model was significantly modified to reflect the OCS development scenarios developed in this study, more current technologies, offshore infrastructure that is more suitable for arctic conditions and greater water depths, and additional onshore infrastructure. A separate model was developed to capture different state and local tax mechanisms and adding local property tax payments. Outputs of direct annual employment in the oil and gas industry, and annual revenues from OCS activity were inputs for a second model. Section 4 of this report discusses the direct employment and revenue estimates for each of the OCS areas.
The third step involved estimating the secondary effects (or the indirect and induced effects) of OCS activities on a statewide and a regional level using the Man in the Arctic Program (MAP) model developed by ISER. The MAP model is an econometric model of the Alaska economy designed to analyze the economic, fiscal, and demographic effects of oil and gas development on the state and its regions. It was originally developed by ISER in the 1970s and has been continuously refined and updated for use in determining future effects of many different types of real and potential economic development activity. The model has also been the basis for several MMS studies of oil and gas development. The results of the MAP model and a discussion of the secondary effects (including state and local fiscal effects) of oil and gas development in each of the OCS areas are presented in Section 4.

Economic Analysis of Future Offshore Oil and Gas Development: Beaufort Sea, Chukchi Sea, and North Aleutian Basin
2
Finally, a sensitivity analysis was conducted to look at the economic effects, particularly the revenue effects, under higher oil and gas price assumptions. The results of the sensitivity analysis are presented in Section 5 of this report.

Economic Analysis of Future Offshore Oil and Gas Development: Beaufort Sea, Chukchi Sea, and North Aleutian Basin
3
2 Background Information and Assumptions
To provide context for the economic analysis, a brief review of the OCS Oil and Gas Leasing Program and general assumptions about the future of the economy of Alaska are discussed in this section. These assumptions about the economy are used in the MAP model as the baseline assumptions without OCS development—the baseline against which the economic effects of OCS development are compared.
In the early 1980s active leasing and exploration in the Alaska Outer Continental Shelf (OCS) was driven by rapidly increasing crude oil prices and access to new, high potential areas. However, after some disappointing failures (Mukluk) and declining oil prices in 1986, the industry retreated from the Alaska OCS and focused on lower risk projects elsewhere. Increasing petroleum prices and acreage availability in the past five years have created renewed interest in exploring for oil and gas in Alaska OCS areas. The Minerals Management Service’s (MMS) Beaufort Lease Sale 195 was the most successful (tracts and high bids) Beaufort Sale since 1988. The MMS Chukchi Lease Sale 193 held in February 2008, collected $2.66 billion in high bids for 488 tracts. Sale 193 was the biggest lease sale (onshore or offshore) in Alaska’s history. More lease sales are planned in the Beaufort Sea, Chukchi Sea, and the North Aleutian Basin as part of MMS’s 5-Year Lease Plan for the 2007-2012 period.
2.1 OCS Oil and Gas Leasing Program 2007-2012 The Secretary of the Interior approved the OCS Oil and Gas leasing program (Five-Year Program) for 2007-2012 on July 1, 2007. The Beaufort Sea, Chukchi Sea, and North Aleutian Basin are 3 of the 26 planning areas covered by the Five-Year Program. The lease sale schedule for the current Five-Year Program is shown along with the previous Five-Year Program in Table 1. The current Five-Year Program includes one planned lease sale in Cook Inlet, but Cook Inlet is outside the geographic scope of this analysis.

Economic Analysis of Future Offshore Oil and Gas Development: Beaufort Sea, Chukchi Sea, and North Aleutian Basin
4
Table 1. MMS Lease Sale Schedule for Alaska Planning Areas
Sale Location and Number Year Scheduled Current 5-Year Program (2007-2012)
Chukchi Sea Sale 193* 2008 Beaufort Sea Sale 209 2009 Cook Inlet Sale 211 2009 Chukchi Sea Sale 212 2010 Beaufort Sea Sale 217 2011 North Aleutian Basin Sale 214 2011 Chukchi Sea Sale 221 2012
Previous 5-Year Program (2002-2007) Month/Year Held Beaufort Sea Sale 202* April 2007 Cook Inlet Sale 199 May 2006 Beaufort Sea Sale 195* March 2005 Chukchi Sea/Hope Basin Sale 193 2004 (delayed to 2008) Cook Inlet Sale 191* May 2004** Norton Basin Sale 188 September 2004 Beaufort Sea Sale 186* September 2003 Sources: Minerals Management Service. Alaska Lease Sales Schedule. http://www.mms.gov/1d/AKsales.htm. and Proposed Final Outer Continental Shelf Oil & Gas Leasing Program 2002-2007, http://www.mms.gov/itd/pubs/NoNumbers/Proposed%20Final%202002-2007.pdf Note: * denotes sale held. ** denotes no bids received.
2.2 Assumptions and Projections about the Future Economy of the State of Alaska
The economic effects that could accrue to the State of Alaska and affected boroughs and communities from development activities in the outer continental shelf (OCS) of Alaska are contingent upon the underlying economic and demographic conditions that will exist at the time of those development activities. Although it is impossible to know exactly what the Alaska economy will look like during the next 50 or more years, an underlying economic and demographic projection that represents a set of reasonably foreseeable conditions can be developed.
The MAP model developed by ISER is used in this analysis. The MAP model is an economic and demographic projection model. This model projects annual state and regional population, employment, fiscal activity and other variables based on assumptions about future activity of the basic industries of the economy as well as other conditions presumed to influence the economy in future years. This model has been used extensively in past MMS studies of the economic and demographic effects of OCS development in Alaska, and is continuously revised and updated to incorporate new information about the economy and population as it becomes available.
The assumptions about future basic industry activity and other economic conditions that produce the projections are summarized in this section. Using the model with different sets of reasonably foreseeable conditions allows the sensitivity of the effects of OCS development to variations in those conditions to be examined. Since the focus of the analysis is on the economic effects of OCS development, a single underlying economic and demographic projection is presented. Additional sets of assumptions were developed to conduct sensitivity analyses.

Economic Analysis of Future Offshore Oil and Gas Development: Beaufort Sea, Chukchi Sea, and North Aleutian Basin
5
The core of the model is a set of assumptions about future conditions for Alaska’s basic industries—in particular petroleum, mining, seafood, tourism, military, and civilian federal operations. The level and characteristics of activity in these industries will largely determine the rate of growth of the economy as well as its characteristics. Continued strength in the petroleum, mining, and tourism sectors as well as stability in seafood, military, and civilian federal operations are assumed.
The long term assumptions about petroleum price are based upon the most recent projections from the 2008 Annual Energy Outlook of the Energy Information Administration of the US Department of Energy. The report projects the price of crude oil to fall in a range between $56 and $83 per barrel (2006$) and the price of gas to fall in a range between $5.8 and $7.4 per mmBtu (2006$) through 2030. Beyond that time a growth rate of 0.5 percent per annum (in real $) is assumed.
The projection of Alaska crude oil production is taken from the Alaska Department of Natural Resources through 2026. Thereafter it is projected to decline at an annual rate of 4 percent. Based on these assumptions, cumulative production between 2007 and 2057 is projected to be 7.7 billion barrels.
The projection of Alaska natural gas production assumes a rate of 4.5 BCF per day beginning in 2020 and continuing through 2057, resulting in a projected cumulative production of over 62 TCF through 2057.
No petroleum activity is assumed for ANWR and in the absence of OCS activity, petroleum employment peaks in 2021 and slowly declines as oil production falls off even as gas production remains constant. Furthermore, the existing Trans-Alaska Pipeline System (TAPS) is anticipated to shut down when it reaches its minimum technically viable level of daily throughput (estimated at 200,000 barrels per day) which could be reached in 2046. It is assumed that a marine transport system would be used to move the remaining oil to market. A natural gas pipeline from Alaska’s North Slope to the Midwest is assumed to be completed in 2020. The current tax and royalty regime is the basis for projecting future state and local revenues from oil and gas activities.
Mining activity in Alaska is projected to expand with the addition of several world-scale projects including the Donlin Creek and Pebble mine prospects. Tourism continues to grow consistent with its historical pattern of expansion. International air cargo operations and the growing population of retirees also contribute to an increase in jobs and income for the state in future years.
Also consistent with past performance, it is anticipated that military spending, seafood harvesting and processing, and federal civilian operations will continue to be important contributors to the economy but will not drive growth in the future.
Employment, income, and population will continue to expand based upon the growth and continued strength in these industrial sectors with most of the growth concentrated in Southcentral Alaska. In contrast, growth of the smaller outlying regions of the state will be slower.
State revenues will continue to be highly dependent upon petroleum, including natural gas in the future, but declining production will gradually erode the ability of the state to finance the state budget entirely from current sources. When that occurs, the fiscal structure of the state government will adjust. Growth in state expenditures will slow as real per capita state expenditures trend downward towards the historical average. A personal income tax, similar in form to the one eliminated in 1980, will be re-imposed. In addition, the portion of the earnings of the permanent fund allocated to the annual dividend will be reduced and a share of the annual earnings will be appropriated to support state spending. The composition of goods and services provided by state and local governments will continue to be the same as today. However, it is expected that the level of support provided from federal sources will decline as entitlements consume an increasing share of the federal budget.

Economic Analysis of Future Offshore Oil and Gas Development: Beaufort Sea, Chukchi Sea, and North Aleutian Basin
6

Economic Analysis of Future Offshore Oil and Gas Development: Beaufort Sea, Chukchi Sea, and North Aleutian Basin
7
3 OCS Exploration, Development, and Production Scenarios
The OCS development scenarios were developed based in part on previous reports prepared by the Minerals Management Service (MMS), as well as on insights provided by industry, MMS staff, and state and local government staff. MMS has developed exploration, development, and production scenarios for environmental impact statements and environmental assessments associated with their lease sales. These MMS scenarios were used as a starting point in developing the scenarios for this study, but modifications were made in light of more recent information regarding resource assessments, petroleum prices, technology, and the prospect of a gas pipeline project in Alaska. When the EIS was written for the Chukchi Sea Lease Sale 193, MMS did not consider construction of a natural gas pipeline on the North Slope as a “reasonably foreseeable event“ and as a result, MMS did not include development of natural gas in their evaluation. Construction and operation of a gas pipeline however, is a major base case assumption in this analysis and therefore, natural gas is assumed to be an economically viable resource in the Chukchi Sea and the Beaufort Sea. This study also assumes more current petroleum price projections provided by the Energy Information Administration (EIA). Furthermore, this analysis considered the most current MMS resource assessment for Alaska OCS areas. In preparation for the 2007-2012 Five-Year Program, MMS revised its assessments of the undiscovered oil and gas resource potential of the Alaska Outer Continental Shelf11. The 2006 resource assessment was used as the basis for the development and production scenarios in this study.
Table 2 summarizes this study’s major assumptions in the scenarios for the Beaufort Sea, Chukchi Sea, and the North Aleutian Basin. The exploration, development, and production scenarios represent one of many possible ways that OCS development in Alaska might occur. A great deal of uncertainty exists about the specific location and timing of future exploration and development activities, oil and gas production volumes, and future prices of oil and gas products. Therefore, it is important to note that future OCS development will not occur in the exact manner described for the next 50 years in these OCS development scenarios. However, in attempting to estimate the magnitude of the economic effects of OCS development, it is necessary to describe a reasonable possible future.
The next sections of this report describe the scenarios for the Beaufort Sea, Chukchi Sea, and North Aleutian Basin, respectively. Each scenario includes a discussion of the size and location of each lease sale, estimates of available resources, descriptions of the facilities and activities required to develop the resources in that location, oil and gas production volumes, specification of transportation options, and location of onshore support bases. These resource estimates and other information in the scenarios feed into the manpower model (IMPAK) and a revenue model and the outputs from these models—direct employment and revenue effects—feed into the MAP (Man-in-the-Arctic Program) model that generates the economic impact findings.
11 These assessments can be found in the MMS document entitled the Alaska OCS, Undiscovered Oil and Gas Resources, Alaska Federal Offshore as of 2006.

Economic Analysis of Future Offshore Oil and Gas Development: Beaufort Sea, Chukchi Sea, and North Aleutian Basin
8
Table 2. Summary of OCS Development Scenarios
Beaufort Chukchi North Aleutian Total Resource Size (Mean) Oil and condensates (billion barrels) 5.97 8.38 0.71 15.06 Gas (trillion cubic feet) 15.94 34.43 7.65 58.02
Exploration Exploration/Delineation Wells 47 43 10 100 Exploration Rig Seasons 31 27 8 66
Development No. of offshore production platforms 7 4 2 13 Offshore/Onshore pipelines (miles) 235 680 300 1,215 Shore bases / facilities
Marine terminal yes yes yes Liquefied Natural Gas (LNG) facility no no yes Production facility yes yes yes Support base yes yes yes
Production Year 1st oil flows 2019 2022 2021 Year 1st gas flows 2029 2036 2022 No. of producing fields 7 4 2 13 Total cumulative volume produced (through 2057)
Oil & gas (billion barrels of oil equivalent) 6.34 6.16 1.29 13.69 Oil & condensates (billion barrels) 5.10 4.79 0.39 10.18 Gas (trillion cubic feet) 6.96 7.78 5.08 19.82
Daily peak production Oil & condensates (barrels per day) 1,165,707 565,472 105,074 Gas (million cubic feet per day) 883 1,421 661
Note: The resource size estimates are from the 2006 MMS Resource Assessment. The numbers shown in the table are the mean undiscovered economically recoverable resource estimates (UERR) assuming resource commodity prices of $60 per barrel of oil and $9.07 per thousand cubic feet of natural gas.
Activity Schedule Figure 1 shows a potential schedule for exploration, development, production and abandonment activities from 2008 through 2057. The figure shows the expected years for first oil and gas production under the scenarios for each basin. The first gas production in the Beaufort Sea is assumed to occur with the first expansion of the proposed natural gas pipeline in 2029, nine years after initial throughput of the gas pipeline. First gas production from the Chukchi Sea is assumed to occur in 2036 with the second expansion of the natural gas pipeline. Both of these expansions are anticipated to reduce the gas pipeline tariff.
The Beaufort scenario assumes that production would still be ongoing in 2057 when the study period ceases. The relatively late discovery and production from expected large resources in the Chukchi Sea result in no platforms being abandoned during the study period. The smaller field sizes expected in the North Aleutian Basin result in the fields ceasing production and the platforms being abandoned by 2044.

Economic Analysis of Future Offshore Oil and Gas Development: Beaufort Sea, Chukchi Sea, and North Aleutian Basin
9
Figure 1. Schedule of Activities for Beaufort, Chukchi, and North Aleutian Basins, 2008-2057
BasinBeaufort Sea Exploration Development Production ! " # Abandonment
Chukchi Sea Exploration Development Production ! " # Abandonment (Later in time)
North Aleutian Exploration Development Production !" Abandonment
!First Oil " First Gas # TAPS closes without OCS
5850 52 54 5642 44 46 4834 36 38 4026 28 30 32Year
08 10 12 14 16 18 20 22 24
Source: Northern Economics, Inc. assumptions
3.1 Beaufort Sea Scenario MMS has held numerous lease sales for this planning area and two more are expected during the 2007-2012 planning period. Beaufort Sea Lease Sale 209 is scheduled for 2009 and Sale 217 for 2011. MMS conducted Beaufort Sea Lease Sales 186, 195, and 202 as part of its 2002-2007 Five-Year Program and additional sales are included in the 2007-2012 Five-Year Program. The most recent sale was held in April 2007 and was the most successful Beaufort Sea Sale in 17 years. Because of all this activity, numerous planning and other types of documents were available to help develop a scenario for the Beaufort. Information regarding Shell Oil’s exploration plan for 2007 to 2009 was also publicly available, as the company had plans to drill during the 2007 open water season.
MMS developed several scenarios for the environmental impacts analysis of the 202 lease sale. MMS based their scenarios on professional judgments about the petroleum resource potential of the area, available technology for offshore development, and historical trends in the oil and gas industry. The MMS scenarios assumed concurrent activities in the Beaufort Sea and the National Petroleum Reserve-Alaska (NPR-A). The scenario presented here for the Beaufort Sea is based in part on MMS’s exploration and development scenarios. However, as mentioned previously, this study adopted a number of assumptions that are different from the MMS scenarios. Some of the major modifications in the scenarios adopted in this study include:
1) Production timing—recent setbacks in exploration activities in the Beaufort OCS and feedback from industry indicated that it would be more realistic to assume a delay in production from the Beaufort; this study therefore assumes a longer lag between exploration and first production, with first oil flowing in 2019 rather than 2014 as assumed in the MMS scenarios for the Beaufort.
2) Resource assessment—this study uses the MMS 2006 resource assessment; this updated resource assessment shows higher recoverable resource estimates in the Beaufort Planning area. This study assumes higher production volumes than what were assumed in the MMS scenarios.
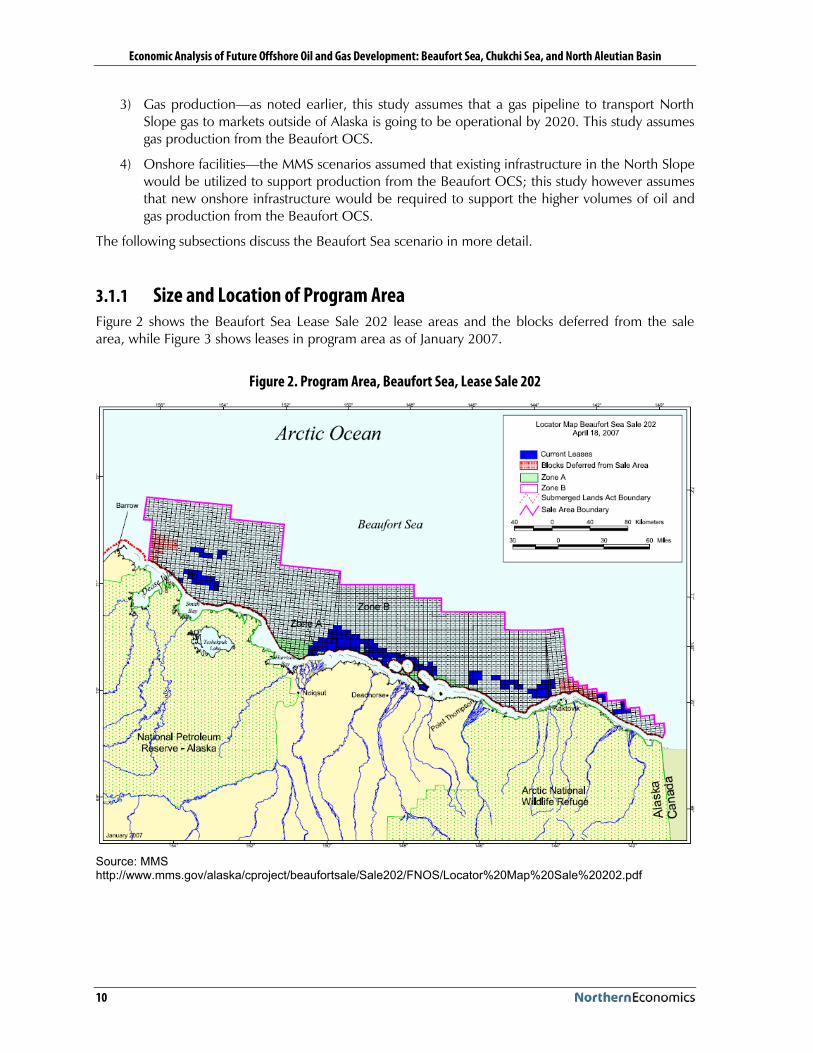
Economic Analysis of Future Offshore Oil and Gas Development: Beaufort Sea, Chukchi Sea, and North Aleutian Basin
10
3) Gas production—as noted earlier, this study assumes that a gas pipeline to transport North Slope gas to markets outside of Alaska is going to be operational by 2020. This study assumes gas production from the Beaufort OCS.
4) Onshore facilities—the MMS scenarios assumed that existing infrastructure in the North Slope would be utilized to support production from the Beaufort OCS; this study however assumes that new onshore infrastructure would be required to support the higher volumes of oil and gas production from the Beaufort OCS.
The following subsections discuss the Beaufort Sea scenario in more detail.
3.1.1 Size and Location of Program Area Figure 2 shows the Beaufort Sea Lease Sale 202 lease areas and the blocks deferred from the sale area, while Figure 3 shows leases in program area as of January 2007.
Figure 2. Program Area, Beaufort Sea, Lease Sale 202
Source: MMS http://www.mms.gov/alaska/cproject/beaufortsale/Sale202/FNOS/Locator%20Map%20Sale%20202.pdf

Economic Analysis of Future Offshore Oil and Gas Development: Beaufort Sea, Chukchi Sea, and North Aleutian Basin
11
Figure 3. Beaufort Sea Existing Leases as of January 2007
Source: MMS http://www.mms.gov/alaska/cproject/beaufortsale/Sale202/bf_leases.pdf
In addition to the leases appearing in the above map, oil companies bid for 127 out of 1,794 whole or partial exploration blocks offered for Sale by MMS in April 2007. The blocks and partial blocks up for sale accounted for 9.4 million acres. Lease sale 195 was the most successful Beaufort Sea lease sale since 1988 when companies bid on 121 out of 338 partial or full blocks. In Lease Sale 186 held in 2003, oil companies bid on 34 out of 1,806 partial or full blocks. In Lease Sale 202 held in 2007, the most intense bidding was around the 1980s Hammerhead offshore discovery. Hammerhead is located approximately 20 miles offshore north of the onshore Point Thomson gas and condensate field.
The near shore area of the Beaufort has an extensive history of exploration with several oil and gas discoveries. The Northstar field that includes mostly state, but some OCS resources started production in 2001. Oooguruk, a more recent discovery in state waters, started production in June 2008 and Liberty, which is an offshore discovery in federal OCS waters, is proceeding to production.
According to the Environmental Assessment for Shell Offshore, Inc., Beaufort Sea Exploration Plan, open-water exploration drilling and testing might occur in any of 12 leases on six specific prospects (See Figure 4 for Shell’s lease blocks). Three of the prospects are located in Camden Bay: Sivulliq, Lonestar, and Olympia. Sivulliq (formerly Hammerhead) is Shell’s first priority and is located in the western part of the bay in 90 to 110 feet of water and about 45 miles east of Cross Island. The fourth

Economic Analysis of Future Offshore Oil and Gas Development: Beaufort Sea, Chukchi Sea, and North Aleutian Basin
12
and fifth prospects are located about 25 and 40 miles east of Baxter Island and are about 10 miles offshore. Cornell—the sixth prospect—is located about 20 miles north of the Colville River Delta.
Figure 4. Location of Shell Leases in the Beaufort Sea
Source: MMS http://www.mms.gov/alaska/cproject/beaufortsale/Sale202/bf_leases.pdf
3.1.2 Resource Estimates Table 3 shows the results of the MMS 2006 resource assessment for the Beaufort Sea OCS. The table shows that the Beaufort Sea planning area has estimated technically recoverable oil and gas resources ranging from 527 million to 36 billion barrels of oil-equivalent energy (BOE). These estimates represent the potential quantities of undiscovered hydrocarbons that can be conventionally produced using existing or reasonably foreseeable technology, without any consideration of economic feasibility.

Economic Analysis of Future Offshore Oil and Gas Development: Beaufort Sea, Chukchi Sea, and North Aleutian Basin
13
Table 3. 2006 Beaufort Sea Resource Assessment: Undiscovered Technically Recoverable Oil and Gas Resources (UTRR)
Resource Commodity F95 Mean F05 BOE (MMBOE) 527.0 13,142.0 36,078.0 Total Gas (TCFG) 0.6 27.6 72.2 Total Liquids (MMBO) 412.0 8,224.0 23,235.0 Free Gas (TCFG) 0.3 23.8 61.0 Solution Gas (TCFG) 0.3 3.9 11.2 Oil (MMBO) 405.0 7,224.0 20,625.0 Condensate (MMBC) 7.0 999.0 2,611.0 Source: Minerals Management Service, 2006 Oil and Gas Assessment: Beaufort Sea Planning Area (Alaska)-Province Summary. Notes: F95= 95% chance that resources will equal or exceed the given quantity. F05= 5% chance that resources will equal or exceed the given quantity. MMBOE= total oil and gas in millions of barrels-of-oil equivalent, where 1 barrel of oil = 5,620 cubic feet of natural gas. MMBO= millions of barrels of oil. TCFG = trillions of cubic feet of gas. MMBC= millions of barrels of condensate.
Table 4 shows the mean undiscovered economically recoverable resource (UERR) estimates by play for the Beaufort Sea OCS. The UERR estimates represent the portion of the undiscovered technically recoverable resources (UTRR) that can be explored, developed, and commercially produced at given costs and price considerations. The UERR estimates shown below assume resource commodity prices of $60 per barrel of oil and $9.07 per thousand cubic feet of gas. At these prices, the mean estimates of commercially producible resources in the Beaufort could be 5.4 billion barrels of oil (or 5.9 billion barrels including condensate) and 12.84 trillion cubic feet of natural gas (or 15.9 TCF including solution gas).
The resource estimates for each play were used to develop the production scenario for the study. The production scenarios are further explained in Section 3.1.6.

Economic Analysis of Future Offshore Oil and Gas Development: Beaufort Sea, Chukchi Sea, and North Aleutian Basin
14
Table 4. Beaufort Sea: Mean Risked, Undiscovered, Economically Recoverable Oil and Gas Resources by Play (UERR)
Oil Gas
Condensate Free Gas Solution Gas Play Name (MMBO) (MMBC) (TCFG) (TCFG) Undeformed Pre-Mississippian Basement 0 0 0 0 Endicott 220 5 0.21 0.24 Lisburne 116 1 0.06 0.13 Upper Ellesmerian 1,102 15 0.81 1.20 Rift 614 19 0.71 0.69 Brookian Faulted Western Topset 108 49 1.06 0.02 Brookian Unstructured Western Topset 310 14 0.3 0.07 Brookian Faulted Western Turbidite 3 6 0.11 0 Brookian Unstructured Western Turbidite 74 5 0.1 0.05 Brookian Faulted Eastern Topset 481 288 6.22 0.11 Brookian Unstructured Eastern Topset 502 8 0.18 0.11 Brookian Faulted Eastern Turbidite 16 36 0.71 0.01 Brookian Unstructured Eastern Turbidite 60 4 0.08 0.04 Brookian Foldbelt 1,811 102 2.29 0.40
Sum of All Plays 5,417 551 12.84 3.09 Source: Minerals Management Service, 2006 Oil and Gas Assessment: Beaufort Sea Planning Area (Alaska)-Province Summary. Notes: The assessment was based on $60 per barrel of oil and $9.07 per mcf of natural gas. MMBO= million barrels of oil. TCFG = trillion cubic feet of gas. Note on the Sum of all Plays—play resource values are rounded and may not sum to totals reported from basin aggregation.
3.1.3 Exploration The following describes the seismic surveys and exploratory drilling activities assumed in the Beaufort OCS.
Seismic Surveys Numerous seismic surveys have been conducted in the federal waters of the Beaufort Sea dating back to the 1960s with peak activity in the 1980s. In 1983, MMS issued 23 permits (11 marine and 123 over-ice 2D (two-dimensional] permits). In 1984, they issued 24 permits including one 3D (three-dimensional) over-ice survey, fourteen 2D over ice surveys, and nine 2D marine surveys. Before the 2006 open water season, more than 100,000 line-miles of 2D and 3D seismic surveys were collected in the Beaufort Sea Planning area. Four seismic permits were issued in the 2006. According to the scenario, an additional 19 surveys are indicated with 26 exploration and 21 delineation wells. Table 5 shows the annual seismic and exploration activities in the Beaufort Sea scenario.

Economic Analysis of Future Offshore Oil and Gas Development: Beaufort Sea, Chukchi Sea, and North Aleutian Basin
15
Table 5. Schedule for Seismic and Exploration Activities in the Beaufort Sea
Year Seismic Activity Exploration/Delineation
Wells Exploration Drilling Rigs 2008 1 2009 2 4 2 2010 1 2 1 2011 2 3 2 2012 1 2 2 2013 1 4 3 2014 2 3 2 2015 1 4 3 2016 2 1 1 2017 1 3 3 2018 1 5 3 2019 1 6 3 2020 1 3 1 2021 1 1 1 2022 1 3 2 2023 3 2
Total 19 47 31 Source: :Northern Economics, Inc. estimates based in part on MMS scenarios in Beaufort Sea Planning Area Oil and Gas Lease Sales 186, 195, and 202 Final Environmental Impact Statement. OCS EIS/EA MMS 2003-01. February 2003.
Exploratory Drilling According to MMS, because of the water depth and remoteness of the area, exploratory drilling operations are likely to use drill ships with ice-breaker support vessels. Bottom-founded drilling platforms are precluded because of water depth and possible pack-ice incursions during the open water season. The use of drill ships allows the operator to temporarily move off the drill site as required. The analysis assumes that because of the short season of open water (July to October) that only one or two wells could be drilled per season per vessel. Drilling at each site is estimated to take 60 to 90 days and is affected by target depth and any difficulties encountered during drilling, and logging/testing operations.
Shell’s planned 2007 program envisioned the use of two drill rigs each open water season—each rig drilling up to two wells between early July and mid-November, weather and ice permitting. Shell’s drilling activities would have included a drill ship and a floating rig with a 12-point anchoring system developed specially for drilling in the arctic with two icebreakers as support vessels each season.
3.1.4 Development The Beaufort development scenario assumes construction of a number of offshore and onshore transportation and production facilities. The MMS scenario assumed that where possible, exploration-drilling operations and construction, development, and production activities would draw on support from existing or upgraded facilities within the Prudhoe Bay or Kuparuk units. This assumption anticipates that commercial discoveries would occur in close proximity to Prudhoe Bay or Kuparuk

Economic Analysis of Future Offshore Oil and Gas Development: Beaufort Sea, Chukchi Sea, and North Aleutian Basin
16
and commercial terms could be reached on cost-sharing. However, a number of the most promising prospects are located some distance from the two units so this analysis assumes that a marine terminal, a support base, and other facilities are constructed to support the offshore platforms.
The timing for the construction and installation of platforms and other facilities, including the timing for various production activities are shown in Table 6.
MMS used an assumption that activities would progressively expand away from the core infrastructure near Prudhoe Bay, and that smaller discoveries located near existing infrastructure could be developed but larger discoveries would be needed as distance from infrastructure increases. Thus the Beaufort Sea OCS development scenario has more fields and smaller fields than the other basins. It is assumed that there will be seven production platforms in the Beaufort with over 200 production wells.
The production scenario assumes approximately 165 miles of new offshore pipeline and 70 miles of new onshore pipelines are built over several years starting in 2016 and this infrastructure ties into the existing crude oil transportation system on the North Slope and to the proposed natural gas pipeline. New onshore facilities include a marine terminal, a support base (shore base), and a production facility. The table below also shows the timing for field abandonment; two fields continue production beyond the 2057 timeframe. Abandonment is an activity that generates direct manpower requirements and is part of the manpower model.

Economic Analysis of Future Offshore Oil and Gas Development: Beaufort Sea, Chukchi Sea, and North Aleutian Basin
17
Table 6. Development and Production Activity Schedule for Beaufort Sea
Year
Install Production Platforms
Drill Production/Injection Wells
Construct Onshore/Offshore Pipelines (Miles)
Construct Onshore Facilities
Abandon Platforms
2016 35 3 2017 1 3 15 2018 10 0 2019 1 13 25 2020 1 26 25 2021 20 0 2022 1 13 25 2023 20 0 2024 1 13 15 2025 20 0 2026 1 13 15 2027 1 23 50 2028 20 15 2029 20 0 2030 10 15 2031
… … … … … … 2044 2045 1 2046 1 2048 1 2049 2050 1 2051 2052 2053 2054 1 Total 7 224 235 3 5
Source: :Northern Economics, Inc. estimates based in part on MMS scenarios in Beaufort Sea Planning Area Oil and Gas Lease Sales 186, 195, and 202 Final Environmental Impact Statement. OCS EIS/EA MMS 2003-01. February 2003. Note: From 2031 through 2044 there is no activity for the items shown in this table.
3.1.5 Transportation of Materials, Supplies, and Personnel Table 7 shows the vessel and air transport activities that MMS developed in its scenario for the Beaufort Sea. The term Permanently in Area indicates that the vessels would be present during drilling operations. The 2007 exploration plan for Shell would have used a small fleet of vessels including the drillship Discover and the Kulluk, a vessel built specifically for drilling offshore in the Arctic. The fleet also would have included two large icebreakers, support vessels for ice management, anchor-handling, a new 300 foot oil spill response vessel and an oil spill response barge, and associated tug to

Economic Analysis of Future Offshore Oil and Gas Development: Beaufort Sea, Chukchi Sea, and North Aleutian Basin
18
carry spill containment and clean-up equipment (Bradner 2007). Shell’s plans also included the operation of another vessel working on marine subsea hazards and geotechnical soils surveys.
Table 7. Vessel and Aircraft Traffic to Support Beaufort Exploration
Type Maximum Number in Area
at any Time Trip Frequency or Duration Offshore Support Vessels 12 Permanently in Area Tug Boats 1 Permanently in Area Anchor Handling/Supply Vessels 3 Permanently in Area Ice Breaker 2 Permanently in Area Oil Spill Response Vessel 1 Permanently in Area Diesel Oil Supply Vessel 1 Once per Season Fixed Wing Aircraft 3 Once per Day Helicopter 3 Twice per Day
Source: Minerals Management Service. Environmental Assessment – Beaufort Sea OCS-Y-1743, 1805, 1807, 1808, 1809, 1817, 1828, 1834, 1841, 1842, 1845, and 1849. OCSEISIEA MMS 2007-009.
3.1.6 Production The production scenario for the Beaufort Sea assumes six oil fields, as assumed in the MMS scenarios, and 1 gas field. The gas field was added in this study, and is assumed to result from Lease Sale 217 (scheduled in 2011) and come on line in 2029 several years after a gas pipeline is built.
The scenario includes production of oil, condensates, free gas, and associated gas from OCS fields at volumes that are based on the 2006 MMS resource assessment of economically recoverable resources in the Beaufort Sea (assuming $60 per barrel of oil and $9 per MCF of natural gas). These resource estimates are shown in Table 4. The production scenario for this study assumes that the plays with the highest economically recoverable estimates of oil and gas would be developed; the assumption is that one field would be developed to produce the economically recoverable resources available in a selected play. The following plays were selected for the Beaufort scenario: Upper Ellesmerian (oil field), Rift (oil field), Brookian Faulted Eastern Topset (oil field and gas field), Brookian Unstructured Eastern Topset (oil field), Brookian Foldbelt (oil field), Brookian Unstructured Western Topset (oilfield). Total production volumes from the 7 fields for the various resources are shown in Table 8. Since two fields could continue producing after the timeframe of the analysis, total volumes produced do not exactly correspond to the estimated amount of economical recoverable resources for the plays identified above.
Table 8. Volume of Resources Assumed to be Produced in the Beaufort OCS Fields
Resource Volume Oil (MMbo) 4,821.08 Free Gas (Tcf) 6.03 Solution Gas (Tcf) 0.93 Condensate (MMbc) 0.29
Figure 5 shows the timing of production and annual production volumes per field in the Beaufort Sea. First oil is assumed to come on line in 2019 and first gas is assumed to flow in 2029. The first gas

Economic Analysis of Future Offshore Oil and Gas Development: Beaufort Sea, Chukchi Sea, and North Aleutian Basin
19
could be associated with an expansion of the proposed natural gas pipeline from the North Slope to other North American markets. Figure 6 shows the total daily production volumes and Table 9 shows the total annual production volumes of oil and gas across all fields in the Beaufort OCS. The second increase in gas production starting in 2043 is related to production of associated gas from the oil fields. Prior to that time the natural gas is re-injected to maintain reservoir pressure for oil production until such time as the oil volumes are minimal.
Figure 5. Projected Annual Oil and Gas Production by Field in the Beaufort Sea OCS
0
50
100
150
200
250
300
350
400
450
2019 2023 2027 2031 2035 2039 2043 2047 2051 2055Year
Oil
Equi
vale
nt P
rodu
ctio
n(M
illio
ns o
f Bar
rels
per
yea
r)
Field 1 Field 2 Field 3 Field 4 Field 5 Field 6 Field 7 (Gas)
Source: Northern Economics, Inc. estimates based in part on MMS scenarios in Beaufort Sea Planning Area Oil and Gas Lease Sales 186, 195, and 202 Final Environmental Impact Statement. OCS EIS/EA MMS 2003-01. February 2003.

Economic Analysis of Future Offshore Oil and Gas Development: Beaufort Sea, Chukchi Sea, and North Aleutian Basin
20
Figure 6. Projected Daily Oil and Gas Production in the Beaufort Sea OCS
0
100,000
200,000
300,000
400,000
500,000
600,000
700,000
800,000
900,000
1,000,000
1,100,000
2017
2021
2025
2029
2033
2037
2041
2045
2049
2053
2057
Year
Bar
rels
of O
il an
d C
onde
nsat
e pe
r Day
0
100
200
300
400
500
600
700
800
900
1000
Mill
ion
Cub
ic F
eet o
f Gas
per
Day
Oil and Condensate Gas
Source: Northern Economics, Inc. estimates based in part on MMS scenarios in Beaufort Sea Planning Area Oil and Gas Lease Sales 186, 195, and 202 Final Environmental Impact Statement. OCS EIS/EA MMS 2003-01. February 2003.

Economic Analysis of Future Offshore Oil and Gas Development: Beaufort Sea, Chukchi Sea, and North Aleutian Basin
21
Table 9. Total Annual Production Volumes of Oil and Gas Assumed in the Beaufort Production Scenario
Annual Oil and Condensate Production Annual Gas Production Year (in million barrels) (in billion cubic feet) 2019 33.1 2020 44.1 2021 67.6 2022 117.0 2023 153.4 2024 202.4 2025 238.9 2026 303.4 2027 321.5 2028 353.8 2029 357.3 201 2030 331.7 219 2031 302.7 219 2032 278.5 219 2033 258.3 219 2034 238.1 219 2035 221.1 219 2036 192.4 219 2037 167.7 219 2038 146.2 219 2039 127.6 219 2040 111.4 219 2041 97.3 219 2042 85.1 219 2043 71.3 237 2044 62.4 274 2045 49.4 298 2046 42.1 322 2047 29.8 322 2048 26.2 322 2049 19.7 322 2050 17.3 322 2051 15.2 322 2052 13.4 272 2053 11.8 232 2054 200 2055 174 2056 154 2057 137 Total 5,109 6,961
Source: Northern Economics, Inc. estimates based in part on MMS scenarios in Beaufort Sea Planning Area Oil and Gas Lease Sales 186, 195, and 202 Final Environmental Impact Statement. OCS EIS/EA MMS 2003-01. February 2003.

Economic Analysis of Future Offshore Oil and Gas Development: Beaufort Sea, Chukchi Sea, and North Aleutian Basin
22
3.2 Chukchi Sea Scenario Five likely prospects were previously drilled on the Chukchi shelf: Burger, Klondike, Crackerjack, Popcorn, and Diamond. All five encountered favorable geology but commercial quantities of oil or gas (at the price expectation then in existence for oil and gas) were not discovered. When exploration of the Chukchi Sea was discontinued in 1992, there were 483 active leases in the Chukchi Sea; none remain active today. Given the recent surge in the price of oil and gas and renewed access to leasing however, there has been renewed interest in developing offshore resources in the Chukchi Sea. In fact, the MMS Chukchi Lease Sale 193 held in February 2008, collected $2.66 billion in high bids for 488 tracts; making it the biggest lease sale (onshore or offshore) in Alaska’s history.
MMS developed several scenarios for the environmental impacts analysis of Lease Sale 193. The scenario presented here for the Chukchi Sea is based in part on MMS’s exploration and development scenarios. MMS’s development and production scenario Lease Sale 193 includes the development of one large field producing one billion barrels (Bbbl). Lower oil volumes are not likely to be economically recoverable and locating larger volumes in a single pool is rare. The previous lease sale in the Chukchi Sea, Lease Sale 126, presented three separate resource levels: low, base case, and high. In contrast, Lease Sale 193 presented a single case analysis representing the statistically most likely development activity given the uncertainties of geology, engineering, and economics.
To date, no petroleum development has occurred in the Chukchi, and while high oil and gas prices attract investment activity, development in the Chukchi Sea faces a number of logistical and regulatory hurdles. MMS makes the assumption that in such a frontier area only the largest prospect would be developed initially. The project must be large enough to cover the high costs of the initial infrastructure and the logistical and regulatory hurdles. Two logistical hurdles to overcome are the location of base support facilities and resolution of transport issues. Once the infrastructure is developed for the major field, smaller fields could be brought into production to supplement the oil production.
The MMS Lease Sale 193 analysis is based on the assumption that gas would not be developed within the proposed timeframe of their analysis. More recent presentations by MMS staff indicate that gas could be developed in the Chukchi. The difference in these outlooks is based in part on differences in underlying assumptions about reasonably foreseeable events, and information from companies that are exploring the planning area. In addition, the price of oil at the time the EIS analysis was written was approximately $50 a barrel. Our analysis is based on the assumption that the long-term price of oil is more likely to be in the $60 to $70 per barrel range.
The MMS scenario for Sale 193 considered offshore gas production as speculative rather than foreseeable because of the lack of existing transportation infrastructure to move produced gas to market. The more recent presentations assume that construction of an Alaska gas pipeline is a reasonably foreseeable event and a pipeline from the Chukchi Sea coast to Prudhoe Bay could be built, or that ice strengthened liquefied natural gas (LNG) tankers could be built to move gas to world markets.
The Energy Information Administration (EIA) anticipates that natural gas prices in the lower 48 states could be in the $6 per thousand cubic feet (2006 $) range from 2020 through 2030 due to increased gas production from the Gulf of Mexico. At these prices, MMS does not anticipate significant gas production from the Chukchi Planning Area, even though very large gas resources are interpreted to exist in the area. However, after 2030, EIA anticipates that gas prices might exceed $7 and at that price MMS’s resource assessment anticipates substantial production from the Chukchi. Therefore, a large gas field is assumed to be brought into production after 2030 in the scenario developed for this report. The volume of free gas and associated gas produced through 2057 is 7.78 TCF.

Economic Analysis of Future Offshore Oil and Gas Development: Beaufort Sea, Chukchi Sea, and North Aleutian Basin
23
The Chukchi Sea OCS scenario assumes that seismic, exploration, and production activities occur from 2008 and past 2057. Three fields are assumed to be discovered with total oil and condensate production of 4.79 billion barrels over that time period. The following sub-sections discuss the Chukchi scenario in more detail.
3.2.1 Size and Location of Program Area The MMS five-year planning program for 2002-2007 identified a planning area of approximately 6,156 whole and partial blocks, which cover 34 million acres (Figure 7). At the time they excluded a corridor that varied in width from a little less than 25 miles from the coast up to about 50 miles from the coast. Water depths in the sale area vary from 95 feet to approximately 262 feet. However, a small portion of the northeast corner of the area deepens to approximately 9,800 feet. The Lease Sale 193 planning area includes a 1,952-block area north of Barrow that before 1991 was part of the Beaufort Sea Planning Area. MMS offered previous portions of the current planning area in four previous sales: Beaufort Sea Sale 97 and Chukchi Sea Sale 109 in 1988, and Beaufort Sea Sale 124 and Chukchi Sea Sale 126 in 1991. As a result, extensive seismic activity has taken place within the current boundaries of the Chukchi Planning Area.
During the decision process for Lease Sale 193, the Secretary of the interior adopted a deferral area that deleted 6 additional blocks from the previously configured sale area so that no tracts closer than 25 miles from the coast would be offered. MMS designed the resource assessment model on the concept that the entire area is open for exploration.
In August 2007, MMS initiated the planning process and a multiple sale EIS for the two Beaufort Sea sales (Sales 209 and 217) and the last two Chukchi Se sales (Sales 212 and 221) in the 2007-2012 Five-Year Program. This multiple sale EIS will incorporate the planning and analysis for the sales. MMS will then prepare Environmental Assessments before making the final decisions on Sales 217 and 221.
According to the MMS news release, the Chukchi Sea 40-million acre planning area is located:
…offshore Alaska’s northwest coast from north of Point Hope to northwest of Cape Lisburne. The sale extends from about 35 to 275 statue miles offshore. The proposed sale area excludes waters within 25 miles of the coast. This buffer zone encompasses the “polynya: a system of ice leads through which the bowhead and beluga whales, other marine mammals, and marine birds migrate north in the spring, and in which local communities subsistence hunt.”

Economic Analysis of Future Offshore Oil and Gas Development: Beaufort Sea, Chukchi Sea, and North Aleutian Basin
24
Figure 7. Program Area, Chukchi Sea, Lease Sale 193
Source: Mineral Management Service, Draft Environmental Impact Statement accessed at http://www.mms.gov/alaska/ref/EIS%20EA/Chukchi_DEIS_193/Maps.pdf on December 11, 2007. Note: Map does not show deferral alternative.
3.2.2 Resource Estimates The Chukchi Sea area is considered to have a high potential for natural gas occurrence because the geology is similar to confirmed plays on the North Slope and many of the large prospects are mapped, and some have been drilled. In preparation for the 2007-2012 Five-Year Program, MMS revised its assessments of the undiscovered oil and gas resource potential of the Alaska Outer Continental Shelf including the Chukchi Sea. Table 10 shows that the Chukchi Sea planning area has estimated technically recoverable oil and gas resources ranging from 4 billion to 77 billion barrels of oil-equivalent energy (BOE). These estimates represent the potential quantities of undiscovered hydrocarbons that can be conventionally produced using existing or reasonably foreseeable technology, without any consideration of economic feasibility.
Table 11 shows the mean undiscovered economically recoverable resource (UERR) estimates by play for the Chukchi Sea OCS. The UERR estimates represent the portion of the undiscovered technically recoverable resources (UTRR) that can be explored, developed, and commercially produced at given costs and price considerations. The UERR estimates shown below assume resource commodity prices of $60 per barrel of oil and $9.07 per thousand cubic feet of gas. At these prices, the mean estimates of commercially producible resources in the Chukchi Sea planning area could be 8.38 billion barrels of oil and condensate, and 34.4 trillion cubic feet of natural gas (including solution gas).

Economic Analysis of Future Offshore Oil and Gas Development: Beaufort Sea, Chukchi Sea, and North Aleutian Basin
25
Table 10. 2006 Chukchi Sea Resource Assessment: Undiscovered Technically Recoverable Oil and Gas Resources (UTRR)
Resource Commodity F95 Mean F05 BOE (MMBOE) 4,152.0 29,041.0 77,357.0 Total Gas (TCFG) 10.3 76.8 209.5 Total Liquids (MMBO) 2,317.0 15,380.0 40,075.0 Free Gas (TCFG) 8.1 57.1 156,879.0 Solution Gas (TCFG) 2.2 19.6 52.6 Oil (MMBO) 1,895.0 12,381.0 31,841.0 Condensate (MMBC) 421.0 2,999.0 8,234.0 Source: Minerals Management Service, 2006 Oil and Gas Assessment: Chukchi Sea Planning Area (Alaska)-Province Summary. Notes: F95= 95% chance that resources will equal or exceed the given quantity. F05= 5% chance that resources will equal or exceed the given quantity. MMBOE= total oil and gas in millions of barrels-of-oil equivalent, where 1 barrel of oil = 5,620 cubic feet of natural gas. MMBO= millions of barrels of oil. TCFG = trillions of cubic feet of gas. MMBC= millions of barrels of condensate.
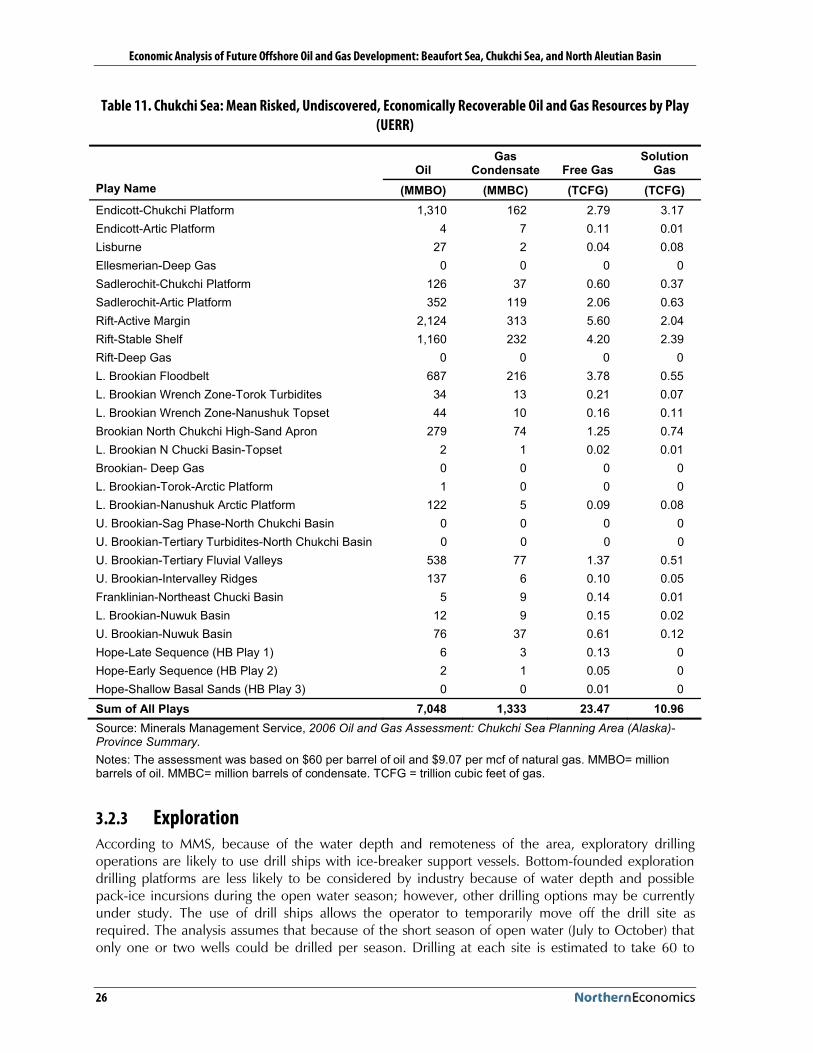
Economic Analysis of Future Offshore Oil and Gas Development: Beaufort Sea, Chukchi Sea, and North Aleutian Basin
26
Table 11. Chukchi Sea: Mean Risked, Undiscovered, Economically Recoverable Oil and Gas Resources by Play (UERR)
Oil Gas
Condensate Free Gas Solution
Gas Play Name (MMBO) (MMBC) (TCFG) (TCFG) Endicott-Chukchi Platform 1,310 162 2.79 3.17 Endicott-Artic Platform 4 7 0.11 0.01 Lisburne 27 2 0.04 0.08 Ellesmerian-Deep Gas 0 0 0 0 Sadlerochit-Chukchi Platform 126 37 0.60 0.37 Sadlerochit-Artic Platform 352 119 2.06 0.63 Rift-Active Margin 2,124 313 5.60 2.04 Rift-Stable Shelf 1,160 232 4.20 2.39 Rift-Deep Gas 0 0 0 0 L. Brookian Floodbelt 687 216 3.78 0.55 L. Brookian Wrench Zone-Torok Turbidites 34 13 0.21 0.07 L. Brookian Wrench Zone-Nanushuk Topset 44 10 0.16 0.11 Brookian North Chukchi High-Sand Apron 279 74 1.25 0.74 L. Brookian N Chucki Basin-Topset 2 1 0.02 0.01 Brookian- Deep Gas 0 0 0 0 L. Brookian-Torok-Arctic Platform 1 0 0 0 L. Brookian-Nanushuk Arctic Platform 122 5 0.09 0.08 U. Brookian-Sag Phase-North Chukchi Basin 0 0 0 0 U. Brookian-Tertiary Turbidites-North Chukchi Basin 0 0 0 0 U. Brookian-Tertiary Fluvial Valleys 538 77 1.37 0.51 U. Brookian-Intervalley Ridges 137 6 0.10 0.05 Franklinian-Northeast Chucki Basin 5 9 0.14 0.01 L. Brookian-Nuwuk Basin 12 9 0.15 0.02 U. Brookian-Nuwuk Basin 76 37 0.61 0.12 Hope-Late Sequence (HB Play 1) 6 3 0.13 0 Hope-Early Sequence (HB Play 2) 2 1 0.05 0 Hope-Shallow Basal Sands (HB Play 3) 0 0 0.01 0 Sum of All Plays 7,048 1,333 23.47 10.96 Source: Minerals Management Service, 2006 Oil and Gas Assessment: Chukchi Sea Planning Area (Alaska)-Province Summary. Notes: The assessment was based on $60 per barrel of oil and $9.07 per mcf of natural gas. MMBO= million barrels of oil. MMBC= million barrels of condensate. TCFG = trillion cubic feet of gas.
3.2.3 Exploration According to MMS, because of the water depth and remoteness of the area, exploratory drilling operations are likely to use drill ships with ice-breaker support vessels. Bottom-founded exploration drilling platforms are less likely to be considered by industry because of water depth and possible pack-ice incursions during the open water season; however, other drilling options may be currently under study. The use of drill ships allows the operator to temporarily move off the drill site as required. The analysis assumes that because of the short season of open water (July to October) that only one or two wells could be drilled per season. Drilling at each site is estimated to take 60 to

Economic Analysis of Future Offshore Oil and Gas Development: Beaufort Sea, Chukchi Sea, and North Aleutian Basin
27
90 days and is affected by target depth and any difficulties encountered during drilling and logging/testing operations. Five previous wells have been drilled on the Chukchi Sea. It is assumed that about 43 exploratory and delineation wells could be drilled to discover and delineate four of the commercial fields.
Table 12 shows the schedule of seismic and exploration activities assumed for the Chukchi Sea.
Table 12. Schedule for Seismic and Exploration Activities in the Chukchi Sea
Year Seismic Surveys Exploration/
Delineation Wells Exploration
Drilling Rigs per Season 2008 1 0 0 2009 4 0 0 2010 3 0 0 2011 3 2 1 2012 2 2 1 2013 1 2 1 2014 1 2 1 2015 1 2 1 2016 1 1 1 2017 1 1 1 2018 0 3 2 2019 1 1 1 2020 1 2 1 2021 0 1 1 2022 0 0 0 2023 1 0 0 2024 1 1 1 2025 1 1 1 2026 1 1 1 2027 1 2 1 2028 1 2 1 2029 0 0 0 2030 1 0 0 2031 1 0 0 2032 0 3 2 2033 1 3 2 2034 1 2 1 2035 0 3 2 2036 0 2 1 2037 0 2 1 2038 0 2 1 2039 0 1 1 Total` 33 43 27 Source: Northern Economics, Inc. estimates based in part on MMS scenarios in Minerals Management Service, Chukchi Sea Planning Area: Oil and Gas Lease Sale 193 and Seismic Surveying Activities in the Chukchi Sea: Final Environmental Impact Statement. Volume I: Executive Summary, Sections I through VI. OCS EIS/EA MMS 2007-226.

Economic Analysis of Future Offshore Oil and Gas Development: Beaufort Sea, Chukchi Sea, and North Aleutian Basin
28
3.2.4 Development The Chukchi development scenario assumes construction of offshore facilities and onshore facilities along the Chukchi coast. The timing and level of construction activities, drilling activities, and abandonment are placed along a timeline in Table 13. This scenario assumes new shore base and support facilities would be constructed to serve all four fields. An estimated 680 miles of onshore and offshore pipelines are built to transport the oil and gas resources, with the oil pipelines built first and the gas pipelines built when gas production commences. The Chukchi scenario used in this analysis includes two pipelines across the North Slope connecting to facilities at Prudhoe Bay. Around 250 miles of onshore oil pipeline would be built before oil production begins, followed by approximately 250 miles of gas pipeline prior to natural gas production. No platforms are abandoned during the study period in this scenario for the Chukchi Sea.

Economic Analysis of Future Offshore Oil and Gas Development: Beaufort Sea, Chukchi Sea, and North Aleutian Basin
29
Table 13. Development and Production Activity Schedule for Chukchi Sea
Year
Install Production Platforms
Drill Production Wells
Construct Onshore & Offshore
Pipelines (Miles)
Construct Onshore Facilities
Abandon Platforms
2019 0 150 2020 0 135 3 2021 2 8 50 2022 24
2023 28 2024 8 2025 4 2026 4 2027 4 2028 4 15 2029 1 4 15 2030 12 15 2031 14 2032 14
2033 6 2034 6 2035 4 100 2036 5 100 2037 5 50 2038 1 11 10 2039 18 10 2040 14 2041 4 2042 4 10
2043 4 2044 4 10 2045 4 10
Total 4 217 680 3 none Source: Northern Economics, Inc. estimates based in part on MMS scenarios in Minerals Management Service, Chukchi Sea Planning Area: Oil and Gas Lease Sale 193 and Seismic Surveying Activities in the Chukchi Sea: Final Environmental Impact Statement. Volume I: Executive Summary, Sections I through VI. OCS EIS/EA MMS 2007-026. Note: Abandonment of platforms in the Chukchi Sea does not occur until after 2057 under this development scenario.
Development in the Chukchi Sea could require advances in new technology. Once a large field is delineated, a platform must be designed that can operate in the extreme environmental conditions in the Chukchi. While other bottom-founded platforms exist in high latitude settings worldwide, no platform has to date operated in environmental conditions similar to the Chukchi with its year-round ice movements and the likely relative water depth of any discovery (over 100 feet). According to MMS, the conceptual design proposed for the Chukchi is a circular platform with a wide base all constructed of concrete. The platform would be built in several sections, transported to the site, and

Economic Analysis of Future Offshore Oil and Gas Development: Beaufort Sea, Chukchi Sea, and North Aleutian Basin
30
then the components put together. The platform base would be pinned to the seafloor, which is expected to be relatively firm. A prepared berm might not be required. The wide base of the platform, anchoring system, and ballast in the cavities of the concrete would serve to stabilize the structure and help resist ice forces.
Topside space on the platform would be limited compared to the widespread area of the oil reservoir. According to MMS, possibly half or more of the total production wells may be subsea wells. These could be completed in templates with possibly four wells per template, and then production could be transported to the central platform some miles away through three-phase (i.e., oil, gas, and water) flow lines. If necessary, the subsea equipment and pipelines could be installed beneath the seafloor for protection against possible deep-keeled ice masses. The subsea wells would be drilled by drill ships during the summer open water season, while drilling on the platform could occur year-round.
This scenario assumes that subsea completions would be used in the Chukchi.
Gas and produced water can be separated from the production slurry on the central platform and the gas and water can be re-injected into the subsurface. The associated and solution gas that is produced can be used either as fuel for the facility or re-injected into the main reservoir to increase oil recovery until such time as a gas transportation system is in place.
Construction of the platform and installations of the flow line from the subsea templates along with the main oil pipeline from the platform can both occur during the short summer open-water seasons. MMS assumed that a 30- to 150-mile offshore pipeline would be required to transport oil from the platform to landfall. They anticipated a new facility constructed on the coast to support offshore operations and serve as the first pump station. An overland pipeline was also anticipated to connect to the TAPS. This 250-mile line would require the coordination of several land managers and could run through the NPR-A. Pump stations along the pipeline corridor might be co-located with oil fields along the route. One of the benefits of this transport alternative is that more marginal fields in proximity to the proposed pipeline could become economically viable.
MMS identified two other transport alternatives. One alternative involves construction of a LNG plant at the port terminal of the DeLong Mountain Transportation System, which ships concentrates from the Red Dog mine. New facilities would load oil and gas into oil or LNG tankers. Another alternative postulated by MMS would be construction and operation of an offshore platform capable of storing and loading crude oil and LNG in the Chukchi and transport of LNG and oil by tankers. Ice-capable tankers could be built and icebreakers could be used to assist in transit through areas of thick ice. However, the limited open water season in the Chukchi is a major constraint for both of these alternatives.
3.2.5 Transportation of Materials, Supplies, and Personnel Seismic surveys are assumed to take place for about 30 days during the summer open-water season. The vessels used for these surveys are largely self-contained, so a minimum amount of helicopter support (one per day) would be required to transport needed personnel, seismic data and light supplies. MMS assumes that a smaller support vessel would make occasional trips—perhaps once every two weeks—to Barrow to refuel and resupply.
Exploratory drilling operations would need to be supported by both helicopters and supply vessels. MMS anticipated that helicopters would probably fly from Barrow to the site one to three times per day, but Kotzebue could also be used if the drilling location was closer. Support vessels would also make one to three trips a week to Barrow during the exploratory phase. Once a new shore base is
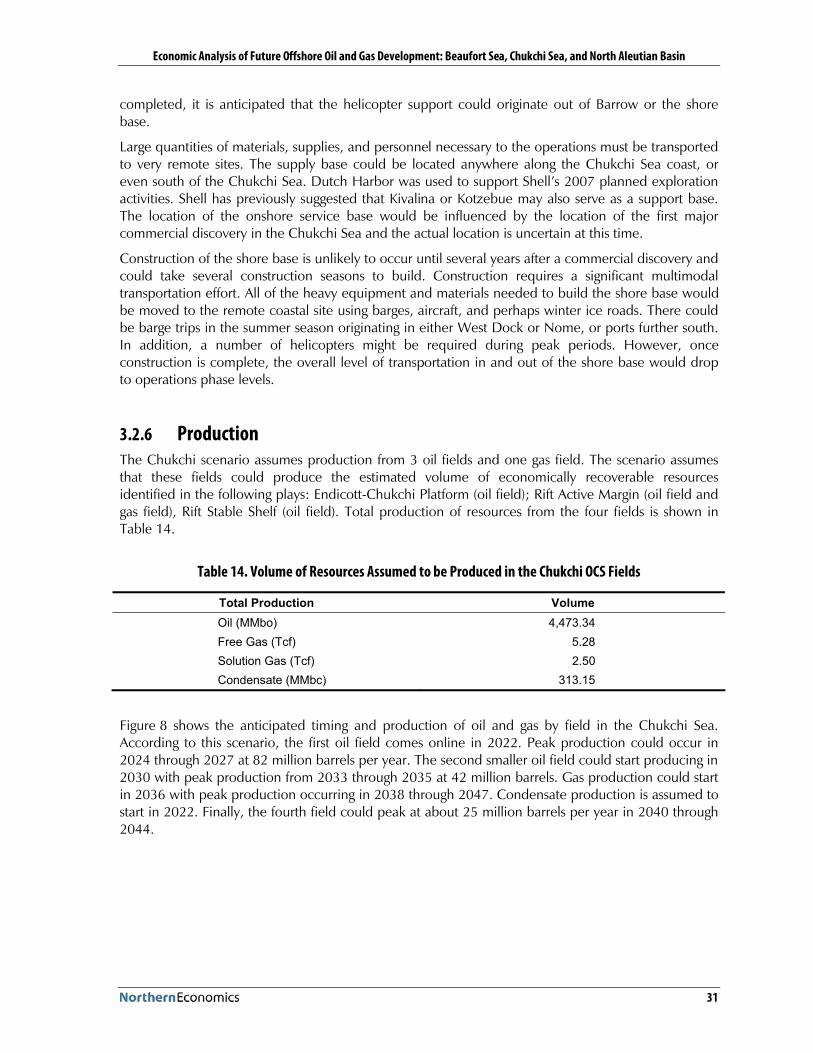
Economic Analysis of Future Offshore Oil and Gas Development: Beaufort Sea, Chukchi Sea, and North Aleutian Basin
31
completed, it is anticipated that the helicopter support could originate out of Barrow or the shore base.
Large quantities of materials, supplies, and personnel necessary to the operations must be transported to very remote sites. The supply base could be located anywhere along the Chukchi Sea coast, or even south of the Chukchi Sea. Dutch Harbor was used to support Shell’s 2007 planned exploration activities. Shell has previously suggested that Kivalina or Kotzebue may also serve as a support base. The location of the onshore service base would be influenced by the location of the first major commercial discovery in the Chukchi Sea and the actual location is uncertain at this time.
Construction of the shore base is unlikely to occur until several years after a commercial discovery and could take several construction seasons to build. Construction requires a significant multimodal transportation effort. All of the heavy equipment and materials needed to build the shore base would be moved to the remote coastal site using barges, aircraft, and perhaps winter ice roads. There could be barge trips in the summer season originating in either West Dock or Nome, or ports further south. In addition, a number of helicopters might be required during peak periods. However, once construction is complete, the overall level of transportation in and out of the shore base would drop to operations phase levels.
3.2.6 Production The Chukchi scenario assumes production from 3 oil fields and one gas field. The scenario assumes that these fields could produce the estimated volume of economically recoverable resources identified in the following plays: Endicott-Chukchi Platform (oil field); Rift Active Margin (oil field and gas field), Rift Stable Shelf (oil field). Total production of resources from the four fields is shown in Table 14.
Table 14. Volume of Resources Assumed to be Produced in the Chukchi OCS Fields
Total Production Volume Oil (MMbo) 4,473.34 Free Gas (Tcf) 5.28 Solution Gas (Tcf) 2.50 Condensate (MMbc) 313.15
Figure 8 shows the anticipated timing and production of oil and gas by field in the Chukchi Sea. According to this scenario, the first oil field comes online in 2022. Peak production could occur in 2024 through 2027 at 82 million barrels per year. The second smaller oil field could start producing in 2030 with peak production from 2033 through 2035 at 42 million barrels. Gas production could start in 2036 with peak production occurring in 2038 through 2047. Condensate production is assumed to start in 2022. Finally, the fourth field could peak at about 25 million barrels per year in 2040 through 2044.
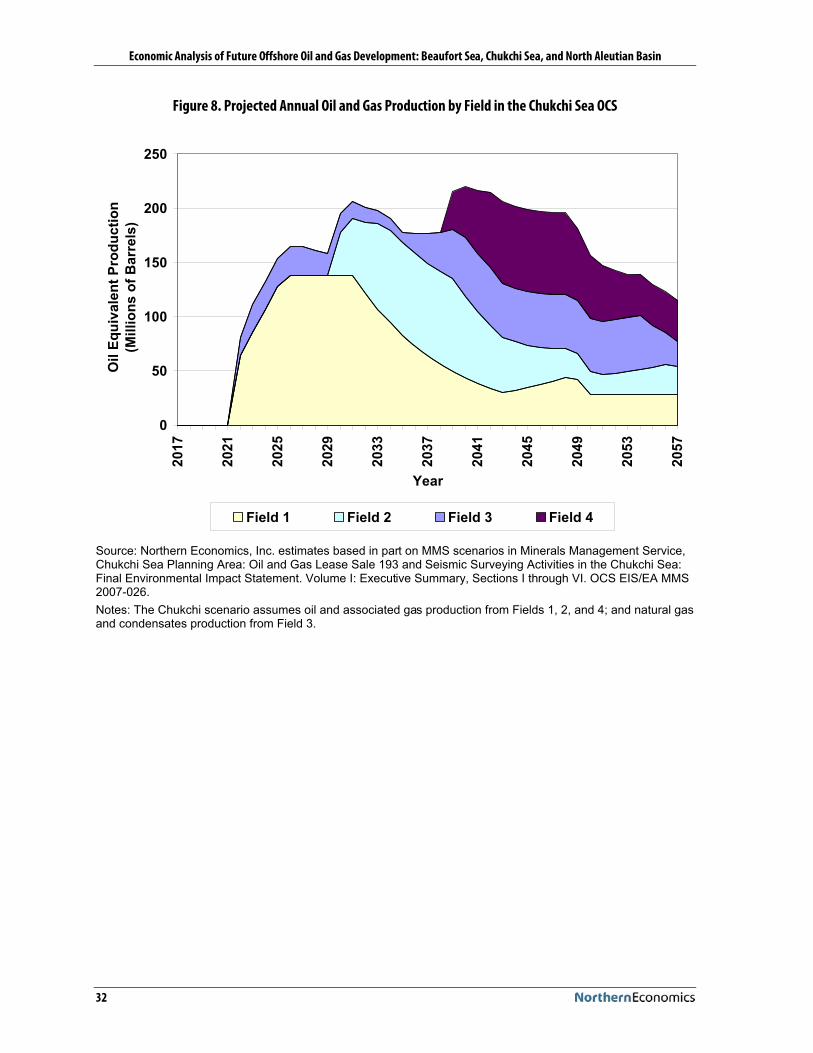
Economic Analysis of Future Offshore Oil and Gas Development: Beaufort Sea, Chukchi Sea, and North Aleutian Basin
32
Figure 8. Projected Annual Oil and Gas Production by Field in the Chukchi Sea OCS
0
50
100
150
200
25020
17
2021
2025
2029
2033
2037
2041
2045
2049
2053
2057
Year
Oil
Equi
vale
nt P
rodu
ctio
n(M
illio
ns o
f Bar
rels
)
Field 1 Field 2 Field 3 Field 4
Source: Northern Economics, Inc. estimates based in part on MMS scenarios in Minerals Management Service, Chukchi Sea Planning Area: Oil and Gas Lease Sale 193 and Seismic Surveying Activities in the Chukchi Sea: Final Environmental Impact Statement. Volume I: Executive Summary, Sections I through VI. OCS EIS/EA MMS 2007-026. Notes: The Chukchi scenario assumes oil and associated gas production from Fields 1, 2, and 4; and natural gas and condensates production from Field 3.

Economic Analysis of Future Offshore Oil and Gas Development: Beaufort Sea, Chukchi Sea, and North Aleutian Basin
33
Figure 9 shows the total daily production volumes and Table 15 shows the total annual production volumes of oil and gas across all fields in the Chukchi Sea OCS.
Figure 9. Projected Daily Oil and Gas Production in the Chukchi Sea OCS
0
100,000
200,000
300,000
400,000
500,000
600,00020
17
2021
2025
2029
2033
2037
2041
2045
2049
2053
2057
Year
Bar
rels
of O
il an
d C
onde
nsat
e pe
r Day
0
200
400
600
800
1,000
1,200
1,400
1,600
Mill
ion
Cub
ic F
eet o
f Gas
per
Day
Oil Gas
Source: Northern Economics, Inc. estimates based in part on MMS scenarios in Minerals Management Service, Chukchi Sea Planning Area: Oil and Gas Lease Sale 193 and Seismic Surveying Activities in the Chukchi Sea: Final Environmental Impact Statement. Volume I: Executive Summary, Sections I through VI. OCS EIS/EA MMS 2007-026.

Economic Analysis of Future Offshore Oil and Gas Development: Beaufort Sea, Chukchi Sea, and North Aleutian Basin
34
Table 15. Total Annual Production Volumes of Oil and Gas Assumed in the Chukchi Sea Production Scenario
Year Annual Oil and Condensate Production
(in million barrels) Annual Gas Production
(in billion cubic feet) 2022 81.0 2023 111.3 2024 132.6 2025 153.9 2026 164.5 2027 164.5 2028 161.3 2029 158.6 2030 195.4 2031 206.4 2032 201.0 2033 197.9 2034 190.1 2035 177.5 2036 166.5 56.0 2037 156.7 112.0 2038 148.1 168.0 2039 175.4 224.0 2040 170.2 280.1 2041 166.9 280.1 2042 165.5 280.1 2043 156.4 280.1 2044 146.7 311.8 2045 138.1 343.5 2046 130.6 375.2 2047 124.0 406.9 2048 118.2 438.6 2049 104.0 438.6 2050 79.3 438.6 2051 69.8 438.6 2052 61.4 458.6 2053 54.1 478.6 2054 47.6 518.6 2055 41.9 495.6 2056 36.8 486.8 2057 32.4 468.9 Total 4,786.5 7,779.1 Source: Northern Economics, Inc. estimates based on MMS 2006 Resource Assessment.

Economic Analysis of Future Offshore Oil and Gas Development: Beaufort Sea, Chukchi Sea, and North Aleutian Basin
35
3.3 North Aleutian Basin Scenario In 1985, MMS conducted Lease Sale 92 in the North Aleutian Basin. Over 5.6 million acres were offered for bid. Water depth ranged from 30 to 100 meters. The proposed sale accounted for approximately 17 percent of the North Aleutian Basin Planning Area. The entire North Aleutian Basin incorporates all of Bristol Bay and adjacent waters out to Unimak Pass. In October 1988, 23 lease blocks covering 121,757 acres were leased.
In 2003, President George W. Bush signed the Interior Appropriations Act for 2004 in which Congress lifted its moratorium on offshore drilling in Bristol Bay. Therefore, Minerals Management Service was allowed to include the federal waters of Bristol Bay in their Proposed Five-Year Program for Outer Continental Shelf Leasing 2007-2012. In January 2007, Present George W. Bush lifted the ban on offshore drilling in Bristol Bay by rescinding the presidential withdrawal. The current sale is limited to the 990 blocks off the Alaskan Peninsula that were evaluated for the earlier Alaska Lease Sale 92.
The following sub-sections discuss the North Aleutian scenario.
3.3.1 Size and Location of Program Area Figure 10 shows the North Aleutian Basin Planning Area, while Figure 11 shows the limited leasing area from Lease Sale 92. The program schedules a lease sale in the North Aleutian Basin for 2011.
Figure 10. North Aleutian Basin Planning Area
Source: MMS http://www.mms.gov/5-year/2007-2012DEIS/VolumeII/Figures/II-1_II-10.pdf, 2007-2012 Five-Year Program.

Economic Analysis of Future Offshore Oil and Gas Development: Beaufort Sea, Chukchi Sea, and North Aleutian Basin
36
Figure 11. Alternative 7 Limited Leasing Area in the North Aleutian Basin Planning Area
Source: MMS http://www.mms.gov/5-year/2007-2012DEIS/VolumeII/Figures/II-1_II-10.pdf, 2007-2012 Five-Year Program.
3.3.2 Resource Estimates The 1985 EIS for lease sale 92 was based in part on the assumption that the conditional mean resource estimates of 364 MMbbls of oil and 2.662 TCF of gas could be discovered and produced. In the original EIS under alternative 1, oil and gas production was scheduled to begin in 1993 and 1994, respectively, and reach a peak annual production in 1994 to 1999 for oil (31 MMbbls) and in 1995 to 2012 for gas (.126 TCF). MMS has identified this area as gas-prone but light crude oil is also possible as a secondary commodity.
Table 16 shows the oil and gas resource estimates for the North Aleutian Basin that were developed by MMS in their 2006 assessment; these estimates were used in developing the scenario for this study. The mean estimate for technically recoverable resources in this planning area ranges from 91 million to 6.6 billion barrels of oil-equivalent energy.
Table 17 shows the mean undiscovered economically recoverable resource (UERR) estimates by play for the North Aleutian Basin OCS. The UERR estimates represent the portion of the undiscovered technically recoverable resources (UTRR) that can be explored, developed, and commercially produced at given costs and price considerations. The UERR estimates shown below assume resource commodity prices of $60 per barrel of oil and $9.07 per thousand cubic feet of gas. At these prices,

Economic Analysis of Future Offshore Oil and Gas Development: Beaufort Sea, Chukchi Sea, and North Aleutian Basin
37
the mean estimates of commercially producible resources in the North Aleutian Basin planning area could be 0.7 billion barrels of oil and condensate, and 7.65 trillion cubic feet of natural gas (including solution or associated gas).
Table 16. 2006 North Aleutian Basin Resource Assessment: Undiscovered, Technically Recoverable Oil and Gas Resources (UTRR)
Resource Commodity F95 Mean F05 BOE (MMBOE) 91.0 2,287.0 6,647.0 Total Gas (TCFG) 0.4 8.6 23.3 Total Liquids (MMBO) 19.0 753.0 2,505.0 Free Gas (TCFG) 0.4 8.4 22.5 Solution Gas (TCFG) 0.0 0.2 0.8 Oil (MMBO) 9.0 545.0 1,948.0 Condensate (MMBC) 10.0 208.0 556.0 Source: Minerals Management Service, 2006 Oil and Gas Assessment: North Aleutian Basin Planning Area (Alaska)-Province Summary. Notes: F95= 95% chance that resources will equal or exceed the given quantity. F05= 5% chance that resources will equal or exceed the given quantity. MMBOE= total oil and gas in millions of barrels-of-oil equivalent, where 1 barrel of oil = 5,620 cubic feet of natural gas. MMBO= millions of barrels of oil. TCFG = trillions of cubic feet of gas. MMBC = millions of barrels of condensate.
Table 17. North Aleutian Basin: Mean Risked, Undiscovered, Economically Recoverable Oil and Gas Resources by Play (UERR)
Oil Gas
Condensate Free Gas Solution Gas Play Name (MMBO) (MMBC) (TCFG) (TCFG) Bear Lake/Stepovak (Miocene/Oligocene) 268 126 5.08 0.11 Tolstoi FM. (Eocene/Paleocene) 59 50 2.00 0.02 Black Hills Uplift- Amak Basin 136 5 0.18 0.06 Mesozoic- Deformed Sedimentary Rocks 32 0 0 0.01 Mesozoic Basement- Buried 'Granite Hills' 25 4 0.17 0.01
Sum of All Plays 520 185 7.43 0.21 Source: Minerals Management Service, 2006 Oil and Gas Assessment: North Aleutian Basin Planning Area (Alaska)-Province Summary. Notes: The assessment was based on $60 per barrel of oil and $9.07 per mcf of natural gas. MMBO= million barrels of oil. MMBC= million barrels of condensate. TCFG = trillion cubic feet of gas.
3.3.3 Exploration In terms of facilities, the MMS scenario under the proposed action included:
! Drilling of 10 exploration and delineation wells between 1986 to 1991
! Installation of one oil and one gas production platform along with the drilling of 32 development/production wells during the period 1990 to 1993.

Economic Analysis of Future Offshore Oil and Gas Development: Beaufort Sea, Chukchi Sea, and North Aleutian Basin
38
The scenario used for this current analysis includes seismic activity occurring from 2008 through 2015 (see Table 18), and uses a similar schedule for exploration and delineation drilling activities, although the beginning year is assumed to be 2008 rather than 1986.
Table 18. Schedule for Seismic and Exploration Activities in the North Aleutian Basin
Year Seismic Activity Exploration/Delineation Wells Exploration Drilling
Rig Seasons 2008 0 2009 2 2010 1 2011 2 2012 1 1 1 2013 1 1 1 2014 2 3 2 2015 1 2 2 2016 3 2
Total 11 10 8 Source: Northern Economics, Inc. estimates based in part on MMS scenarios in Minerals Management Service, Final Environmental Impact Statement, Volumes 1, 2, Appendix A Exploration and Development Maximum Case and Appendix B Minimum Case, Proposed North Aleutian Basin Lease Sale (Sale 92). September 1985. Note. Lease Sale 214 in 2010; Lease Sale 223 in 2012.
3.3.4 Development The development schedule for the North Aleutian Basin is shown in Table 19. The sequencing and timing of these activities is the same as presented in the 1985 EIS for Lease Sale 92, but the volume of produced oil and gas has been increased to reflect the newer resource assessment and the year when these activities takes place is moved forward in time with the first production-related activities occurring in 2016. Two major shore-based facilities are required with this scenario. One supply base is required on the Bering Sea side of the Alaska Peninsula for the supply boats and helicopters, and a second facility on the Pacific Ocean side of the Peninsula. The Pacific facility would include an LNG plant and provide marine terminals for oil and LNG tankers.

Economic Analysis of Future Offshore Oil and Gas Development: Beaufort Sea, Chukchi Sea, and North Aleutian Basin
39
Table 19. Development and Production Activity Schedule for North Aleutian Basin
Year Production Platforms Production/injection Wells
Offshore/Onshore Pipelines (Miles)
New Shore Based Facilities
2016 1 2017 50 2018 1 100 .25 2019 9 .25 2020 9 50 .25 2021 9 100 .25 2022 1 12 2023 11 2024 11 Total 2 61 300 2 Source: Northern Economics, Inc. assumptions based in part on MMS scenarios in Minerals Management Service, Final Environmental Impact Statement, Volumes 1, 2, Appendix A Exploration and Development Maximum Case and Appendix B Minimum Case, Proposed North Aleutian Basin Lease Sale (Sale 92). September 1985. Note: For new shore based facilities the .25 indicates that 25 percent of the marine terminal and LNG plant is built in each of these four years.
Alternative 1 in the 1985 EIS proposed two methods of transport—either pipelines to landfall in the Port Moller area or offshore storage and loading with transport to markets by 80,000 dead weight tonnage tankers. This scenario assumes that offshore pipelines are built to the Alaska Peninsula, with onshore pipelines built across the Alaska Peninsula to a location on the Pacific Ocean coast. Gas produced from one offshore platform would be transported to an LNG liquefaction facility and then transported directly to a U.S. or Pacific Rim LNG re-gasification terminal via LNG tankers. Oil would be transported by pipeline to a separate terminal on the Pacific Ocean coast and then to U.S. or Pacific Rim markets via crude oil carriers.
During a Shell Oil presentation at the North Aleutian Basin meeting in 2006, Shell envisioned construction of offshore drilling production platforms with product transported via pipeline to a natural gas liquefaction facility on the Alaska Peninsula near Sand Point with the LNG transported to the U.S. West Coast market in tankers.
The marine support base for previous offshore operations in the North Aleutian Basin was located at Captains Bay near Dutch Harbor/Unalaska while Cold Bay was the primary air-support site (Patrick Burden & Associates 1985). If permanent facilities are built on either side of the Alaska Peninsula air strips could be built near the site of those facilities. Potential sites for an onshore service base are limited on the north side of the Alaska Peninsula. Two sites that might be considered are Unalaska or Port Moller, and the decision regarding which site to use likely hinges on the location of a commercial oil or gas discovery.
3.3.5 Production The North Aleutian scenario assumes production from one oil field and one gas field. The scenario assumes that these fields would produce the estimated volume of economically recoverable resources identified in the Bear Lake/Stepovak play. Total production of resources from the oil and gas fields is shown in Table 20.

Economic Analysis of Future Offshore Oil and Gas Development: Beaufort Sea, Chukchi Sea, and North Aleutian Basin
40
Table 20. Volume of Resources Assumed to be Produced in the North Aleutian OCS Fields
Total Production Volume Oil (MMbo) 268.12 Free Gas (Tcf) 5.08 Solution Gas (Tcf) None Condensate (MMbc) 126.33
Figure 12 shows the timing of production and annual production volumes per field in the North Aleutian Basin. First oil is assumed to come on line in 2021 and first gas is assumed to flow in 2022. Figure 13 shows the total daily production volumes and Table 21 shows the total annual production volumes of oil and gas across all fields in the North Aleutian Basin OCS.
Figure 12. Projected Annual Oil and Gas Production by Field in the North Aleutian Basin OCS
0
10
20
30
40
50
60
70
80
90
2017
2021
2025
2029
2033
2037
2041
2045
2049
2053
2057
Year
Oil
Equi
vale
nt P
rodu
ctio
n(M
illio
ns o
f Bar
rels
per
Yea
r)
Field 1 Field 2
Source: Northern Economics, Inc. estimates based in part on MMS scenarios in Minerals Management Service, Final Environmental Impact Statement, Volumes 1, 2, Appendix A Exploration and Development Maximum Case and Appendix B Minimum Case, Proposed North Aleutian Basin Lease Sale (Sale 92). September 1985.

Economic Analysis of Future Offshore Oil and Gas Development: Beaufort Sea, Chukchi Sea, and North Aleutian Basin
41
Figure 13. Projected Daily Oil and Gas Production in the North Aleutian Basin OCS
0
20,000
40,000
60,000
80,000
100,000
120,000
2017
2021
2025
2029
2033
2037
2041
2045
2049
2053
2057
Year
Bar
rels
of O
il an
d C
onde
nsat
e pe
r Day
0
100
200
300
400
500
600
700
Mill
ion
Cub
ic F
eet o
f Gas
per
Day
Oil Gas
Source: Northern Economics, Inc. estimates based in part on MMS scenarios in Minerals Management Service, Final Environmental Impact Statement, Volumes 1, 2, Appendix A Exploration and Development Maximum Case and Appendix B Minimum Case, Proposed North Aleutian Basin Lease Sale (Sale 92). September 1985.

Economic Analysis of Future Offshore Oil and Gas Development: Beaufort Sea, Chukchi Sea, and North Aleutian Basin
42
Table 21. Total Annual Production Volumes of Oil and Gas Assumed in the North Aleutian Basin Production Scenario
Year Annual Oil and Condensate Production
(in million barrels) Annual Gas Production
(in billion cubic feet) 2021 22.7 2022 34.4 180.9 2023 38.4 211.1 2024 38.4 241.2 2025 38.4 241.2 2026 35.2 241.2 2027 29.9 241.2 2028 25.5 241.2 2029 21.8 241.2 2030 18.7 241.2 2031 16.0 241.2 2032 13.8 241.2 2033 11.9 241.2 2034 10.2 241.2 2035 8.8 241.2 2036 7.6 241.2 2037 6.6 241.2 2038 4.9 241.2 2039 4.3 241.2 2040 3.8 241.2 2041 3.3 241.2 2042 193.0 2043 154.4 Total 394.5 5,080.9 Source: Northern Economics, Inc. estimates based in part on MMS scenarios in Minerals Management Service, Final Environmental Impact Statement, Volumes 1, 2, Appendix A Exploration and Development Maximum Case and Appendix B Minimum Case, Proposed North Aleutian Basin Lease Sale (Sale 92). September 1985.

Economic Analysis of Future Offshore Oil and Gas Development: Beaufort Sea, Chukchi Sea, and North Aleutian Basin
43
4 Results and Findings
This section presents a potential outcome of future offshore oil and gas development in the Beaufort, Chukchi, and North Aleutian OCS areas. This potential future outcome is specifically based on the exploration, development, and production scenarios described in Section 3.
Oil and gas development in Alaska OCS areas is expected to generate direct and indirect jobs, and direct and indirect revenues to the state and local governments. The magnitude of these economic benefits would ultimately depend on the volumes of petroleum resources that might be discovered in the OCS areas, the levels of investment that oil and gas explorers, developers, and producers would be willing to spend in these areas, and the fiscal regime or tax structure that would be in effect as OCS oil and gas development occurs. There is still a great deal of uncertainty as to whether oil and gas production in the OCS would occur and if production does occur whether the levels of production assumed in this study would be reached. This study assumes that development would occur given the price and cost assumptions in the analysis and that there will be no regulatory impediments or delays to OCS development due to environmental restrictions.
The results presented in the following sections include potential OCS employment and population effects, potential revenue effects, and projected fiscal effects at the state and local levels. The results for each OCS area are discussed in separate sub-sections. Also included are summary results for the North Slope region (combined Beaufort and Chukchi results) and for all three Alaska OCS areas (total statewide results). This study is only focused on the potential economic effects of OCS development.
Before presenting the economic results, the potential incremental effect of OCS development on total oil and gas production in Alaska is discussed below.
4.1 Incremental Oil and Gas Production Without OCS development, cumulative statewide oil production through 2057 is projected to be 7.7 billion barrels and cumulative natural gas production is projected to be 62 TCF. OCS development in the Beaufort, Chukchi, and North Aleutian Basin could add an additional 10 billion barrels of oil and 19.8 TCF of natural gas to Alaska petroleum production through 2057. The combined incremental production from all three OCS areas over time is shown in Figure 14 and Figure 15.
The following charts illustrate the projected incremental oil and gas production over time from OCS development in the Beaufort Sea (Figure 16 and Figure 17), Chukchi Sea (Figure 18 and Figure 19), North Aleutian Basin (Figure 20 and Figure 21). Production scenarios for each of the basins are discussed in more detail in Section 3.
The charts presented below also show the projected statewide oil and gas production without OCS development. As noted in Section 2.2, a baseline economic projection without OCS development was developed to allow a comparison between a future with OCS development and a future without OCS development. This baseline analysis (without OCS development) assumes development and commercialization of natural gas from the North Slope starting in 2020 at daily volumes of 4.5 billion cubic feet and continuation of the declining trend in statewide oil production—reflecting the diminishing oil reserves in the major oil fields in the North Slope.

Economic Analysis of Future Offshore Oil and Gas Development: Beaufort Sea, Chukchi Sea, and North Aleutian Basin
44
Figure 14. Incremental Oil Production from All Three Basins OCS Development
0.0
0.2
0.4
0.6
0.8
1.0
1.2
1.4
1.6
1.8
2.0
2007 2012 2017 2022 2027 2032 2037 2042 2047 2052 2057Year
Bar
rels
per
Day
(in
mill
ions
)
Projected Oil Production without OCS OCS Increment
Source: Northern Economics, Inc. and ISER estimates based on scenarios developed for the study.

Economic Analysis of Future Offshore Oil and Gas Development: Beaufort Sea, Chukchi Sea, and North Aleutian Basin
45
Figure 15. Incremental Gas Production from All Three Basins OCS Development
0
1
2
3
4
5
6
7
2007 2012 2017 2022 2027 2032 2037 2042 2047 2052 2057Year
BC
F pe
r Day
Projected Gas Production without OCS OCS Increment
Source: Northern Economics, Inc. and ISER estimates based on scenarios developed for the study.

Economic Analysis of Future Offshore Oil and Gas Development: Beaufort Sea, Chukchi Sea, and North Aleutian Basin
46
Figure 16. Incremental Oil Production from Beaufort OCS Development
0.0
0.2
0.4
0.6
0.8
1.0
1.2
1.4
2007 2012 2017 2022 2027 2032 2037 2042 2047 2052 2057Year
Bar
rels
per
Day
(in
mill
ions
)
Projected Oil Production without OCS OCS Increment
Source: Northern Economics, Inc. and ISER estimates based on scenarios developed for the study.

Economic Analysis of Future Offshore Oil and Gas Development: Beaufort Sea, Chukchi Sea, and North Aleutian Basin
47
Figure 17. Incremental Gas Production from Beaufort OCS Development
0
1
2
3
4
5
6
2007 2012 2017 2022 2027 2032 2037 2042 2047 2052 2057Year
BC
F pe
r Day
Projected Gas Production without OCS OCS Increment
Source: Northern Economics, Inc. and ISER estimates based on scenarios developed for the study.

Economic Analysis of Future Offshore Oil and Gas Development: Beaufort Sea, Chukchi Sea, and North Aleutian Basin
48
Figure 18. Incremental Oil Production from Chukchi OCS Development
0.0
0.1
0.2
0.3
0.4
0.5
0.6
0.7
0.8
0.9
1.0
2007 2012 2017 2022 2027 2032 2037 2042 2047 2052 2057Year
Bar
rels
per
Day
(in
mill
ions
)
Projected Oil Production without OCS OCS Increment
Source: Northern Economics, Inc. and ISER estimates based on scenarios developed for the study.

Economic Analysis of Future Offshore Oil and Gas Development: Beaufort Sea, Chukchi Sea, and North Aleutian Basin
49
Figure 19. Incremental Gas Production from Chukchi OCS Development
0
1
2
3
4
5
6
7
2007 2012 2017 2022 2027 2032 2037 2042 2047 2052 2057Year
BC
F pe
r Day
Projected Gas Production without OCS OCS Increment
Source: Northern Economics, Inc. and ISER estimates based on scenarios developed for the study.

Economic Analysis of Future Offshore Oil and Gas Development: Beaufort Sea, Chukchi Sea, and North Aleutian Basin
50
Figure 20. Incremental Oil Production from North Aleutian Basin OCS Development
0.0
0.1
0.2
0.3
0.4
0.5
0.6
0.7
0.8
0.9
2007 2012 2017 2022 2027 2032 2037 2042 2047 2052 2057Year
Bar
rels
per
Day
(in
mill
ions
)
Projected Oil Production without OCS OCS Increment
Source: Northern Economics, Inc. and ISER estimates based on scenarios developed for the study.

Economic Analysis of Future Offshore Oil and Gas Development: Beaufort Sea, Chukchi Sea, and North Aleutian Basin
51
Figure 21. Incremental Gas Production from North Aleutian Basin OCS Development
0
1
2
3
4
5
6
2007 2012 2017 2022 2027 2032 2037 2042 2047 2052 2057Year
BC
F pe
r Day
Projected Gas Production without OCS OCS Increment
Source: Northern Economics, Inc. and ISER estimates based on scenarios developed for the study.
4.2 Potential Employment Effects Exploring, developing, and producing the oil and gas resources off Alaska’s coast will require a substantial effort and as a result will directly employ thousands of people in the oil and gas sector, with many more thousands of jobs created in the Alaska economy’s infrastructure, support, and government sectors. Table 22 summarizes the annual average employment that might be created if the OCS scenarios (described in Section 3) were to occur. These estimates represent the annual average employment over the entire 50-year period from 2008 to 2057. It should be noted that it could take several years before OCS employment could reach the annual average of 6,000 direct jobs in the oil and gas sector, and for the other sectors to reach the levels indicated in the table. Figure 22 in the next section illustrates the ramp up of the direct employment effects of OCS development over time.
The direct jobs are the oil and gas jobs created in the industry and the indirect jobs are the jobs created in all the other categories (Section 4.2.1 defines these job categories in more detail). The roughly 6,000 direct jobs in oil and gas and the revenues associated with production could create an additional 29,000 jobs in other sectors of the state’s economy. Thus, each oil and gas job helps create an additional 4.8 jobs in the economy. The estimated increase of 35,000 jobs would represent about an 11 percent increase over the 2007 statewide annual average employment.

Economic Analysis of Future Offshore Oil and Gas Development: Beaufort Sea, Chukchi Sea, and North Aleutian Basin
52
Table 22. Estimated Direct and Indirect Employment Effects by Sector for All Three OCS Areas (expressed as Annual Average from 2008 to 2057)
Sector Number of Jobs Oil and Gas (extraction and oilfield services) 6,000 Infrastructure 3,000 Support 22,000 State/Local Government 4,000 Total 35,000 Sources: Northern Economics, Inc. estimates derived from modified MMS IMPAK models, and ISER estimates from MAP model.
The potential employment effects discussed in the following subsections include:
! Definition of the employment categories used in this analysis
! Description of the direct employment activities involved in OCS development
! Discussion of direct employment results
! Discussion of the total number of jobs (direct and indirect) by place of work and by place of residence for each OCS area, for the North Slope region, and for all three OCS areas combined.
4.2.1 Definition of Employment Categories Direct employment includes all the jobs in the oil and gas sector involved in OCS exploration, development, and production activities. Direct employment is comprised of on-site and off-site workers.
On-site workers are those engaged in exploration, development, and production activities at each of the OCS locations. On-site jobs fall under three major types of activities: 1) construction and operation of onshore facilities; 2) operation and drilling of production platforms and wells; and 3) operation and drilling of exploration platforms and wells.
Off-site workers include employees working in the oil and gas company headquarters as well as those involved in the pipe coating activities. The headquarters jobs are estimated at 15 percent of total on-site jobs. This percentage is consistent with the historical average for Anchorage oil and gas employment compared to statewide oil and gas employment excluding Anchorage. These headquarters jobs are assumed to be located in Anchorage. Pipe-coating jobs are assumed to be located in Fairbanks.
Indirect employment includes jobs in other sectors of the economy that provide goods and services to support OCS exploration, development and production. Indirect jobs fall under three major sectors:
! Infrastructure employment. This consists of workers in the transportation, communications, public utilities, and business services industries that work closely with the petroleum industry.
! Support employment. This includes all other private sector workers in trade, services, and related businesses. These businesses provide goods and services both to other Alaska businesses as well as Alaska households.

Economic Analysis of Future Offshore Oil and Gas Development: Beaufort Sea, Chukchi Sea, and North Aleutian Basin
53
! State and local government employment (including federal jobs). State and local government employment growth is based on the assumption that all revenues from OCS activity will be spent on services for both new and existing residents12.
Employment effects are also expressed as jobs by Place of Work and by Place of Residence.
Employment by place of work includes all jobs held by both Alaska residents and non-residents working in various locations in Alaska. This category does not include the jobs associated with building the modules or pipes that are imported from Outside Alaska or any other job done outside of Alaska even if the jobs are associated with Alaska OCS development.
Employment by place of residence distinguishes jobs according to five locations that include Local (residents of the North Slope Borough or the Aleutians region), Anchorage, Fairbanks, Other Alaska Resident, and Non-Resident. It is uncertain if OCS employment will have the same residency characteristics as current oil and gas industry employment, but other data have not been identified that would support other assumptions. Therefore, for this analysis historic percentages of employment by residency are used (see Table 23 for share of workers by place of residence).
Table 23. Historical Percentage of Oil and Gas Sector Jobs by Place of Residence
Place of Residence Percent of Direct Employment Local 0.5 Anchorage 47.0 Fairbanks 6.0 Other Alaska Resident 21.1 Non-resident 25.4
Source: Northern Economics, Inc. analysis
4.2.2 Potential Direct Employment Effects Based on the scenarios described in Section 3, OCS development in the Beaufort, Chukchi, and the North Aleutian could directly generate an estimated annual average employment of about 6,000 jobs in the oil and gas sector over the course of 50 years (2008 to 2057). These are direct jobs13 (both on-site and off-site) that could be involved in exploration activities, construction of offshore and onshore production and transportation facilities, spill prevention, logistics, and operations and maintenance activities in all three OCS areas. The estimated 6,000 direct jobs for OCS activity in the three basins represent roughly 48 percent of the 2007 oil and gas employment of 12,600 (ADOLWD, 2008).
Figure 22 shows the potential direct annual average employment in the oil and gas industry that might result from OCS development in all three areas across time. The growth in employment in the next decade associated with OCS development could offset the decline in petroleum employment associated with the decline in oil production on state lands and maintain employment levels after the construction of the gas pipeline. Subsequently, for about 2 decades, employment could be relatively stable as fields are developed and produced over that period. Eventually, direct employment will decline as production declines and fields are abandoned. As noted earlier, this is just one possible 12 Different assumptions regarding how and when public revenues from OCS development are spent would yield somewhat different employment and population impacts.
13 These direct employment estimates do not include jobs involved in building modules outside of Alaska, but do include non-resident jobs involved in installing pre-fabricated modules at the site. On-site facilities include the onshore and offshore facilities.

Economic Analysis of Future Offshore Oil and Gas Development: Beaufort Sea, Chukchi Sea, and North Aleutian Basin
54
development pattern; OCS development could occur in different locations and different times. The development of multiple fields could tend to smooth out any boom and bust phenomenon.
Figure 22. Total Annual Average Direct Employment for All Three OCS Areas, 2008-2057
0
1,000
2,000
3,000
4,000
5,000
6,000
7,000
8,000
9,000
10,000
2008 2013 2018 2023 2028 2033 2038 2043 2048 2053Year
Ann
ual A
vera
ge E
mpl
oym
ent
Source: Estimates by Northern Economics, Inc. from modified MMS IMPAK model.
Peak employment across all OCS areas based on the scenarios presented in Section 3 could occur in 2038 with an estimated annual average employment of about 9,500; the peaking occurs when major discoveries are being developed and facility construction is underway. In the North Aleutian OCS development scenario, employment is highest in year 2018. Generally, because of the scale of potential resource development in the Beaufort and the Chukchi OCS areas, employment effects in these areas are higher compared to the North Aleutian Basin.
Table 24 shows the potential direct employment effects that could result from oil and gas development in each of the OCS areas. As noted earlier, the average employment over the entire period could be about 48 percent of the 12,600 oil and gas-related employment in 2007. Peak OCS employment in 2038 could be about 75 percent of 2007 petroleum-related employment.

Economic Analysis of Future Offshore Oil and Gas Development: Beaufort Sea, Chukchi Sea, and North Aleutian Basin
55
Table 24. Annual Average Direct Employment by OCS Area, 2008-2057
Beaufort Chukchi North Aleutian All Areas Annualized Average
Entire time frame 2,800 2,500 900 6,000 Production phase 3,300 3,000 1,100 7,100
Peak Employment 4,800 4,200 2,200 9,500 Year of Peak Employment 2027 2038 2018 2038 Source: Northern Economics Inc. estimates derived from modified MMS IMPAK models. Note: Employment estimates are rounded.
4.2.3 Potential Employment Effects of the Beaufort OCS Development Total Alaska employment (wage and salary jobs plus self employed) associated with Beaufort OCS development by category is shown in Figure 23. The figure represents the incremental employment over and above the base case with no OCS development. Direct jobs peak at about 5,000 in 2027 and total employment continues to increase until field production ceases and fields are abandoned.
Figure 23. Estimated Incremental Employment by Sector, Beaufort OCS Development
0
5
10
15
20
25
2007 2012 2017 2022 2027 2032 2037 2042 2047 2052 2057Year
Empl
oym
ent (
in th
ousa
nds)
Direct State-Local Infrastructure Support
Source: Northern Economics, Inc. and ISER estimates.
Figure 24 shows the regional breakdown of Alaska employment by place of work associated with Beaufort OCS development. Direct employment is mostly located in the North Slope Borough, with a

Economic Analysis of Future Offshore Oil and Gas Development: Beaufort Sea, Chukchi Sea, and North Aleutian Basin
56
few direct off-site jobs in Anchorage and Fairbanks. The infrastructure and support employment are distributed throughout the state because most of the direct employees live in Southcentral Alaska and other parts of the state. Local government employment is also concentrated in the North Slope Borough, although it increases wherever new workers live. State government employment also increases wherever new workers live.
Figure 24. Estimated Incremental Employment by Place of Work, Beaufort OCS Development
0
5
10
15
20
25
2007 2012 2017 2022 2027 2032 2037 2042 2047 2052 2057Year
Empl
oym
ent (
in th
ousa
nds)
North Slope Borough Aleutians East and West FairbanksMatsu Anchorage KenaiBalance of State
Source: Northern Economics, Inc. and ISER estimates. Note: Fairbanks is the Fairbanks North Star Borough; Anchorage is the Municipality of Anchorage; Aleutians East and West is comprised of the Aleutians East Borough, Aleutians West Census Area, Bristol Bay Borough, Dillingham Census Area, and Lake and Peninsula Borough; Matsu is the Matanuska-Susitna Borough; Kenai is the Kenai Peninsula Borough.
Figure 25 shows the incremental statewide employment associated with Beaufort Sea OCS development by place of residence. This figure shows total (direct and indirect) employment for areas within the state. Outside of Alaska estimates are for direct employment only. Anchorage captures about half of all employment, which is similar to its 47 percent share of statewide 2007 employment. The Fairbanks North Star Borough and the Matanuska-Susitna Borough also capture significant shares of total incremental employment associated with the OCS development.
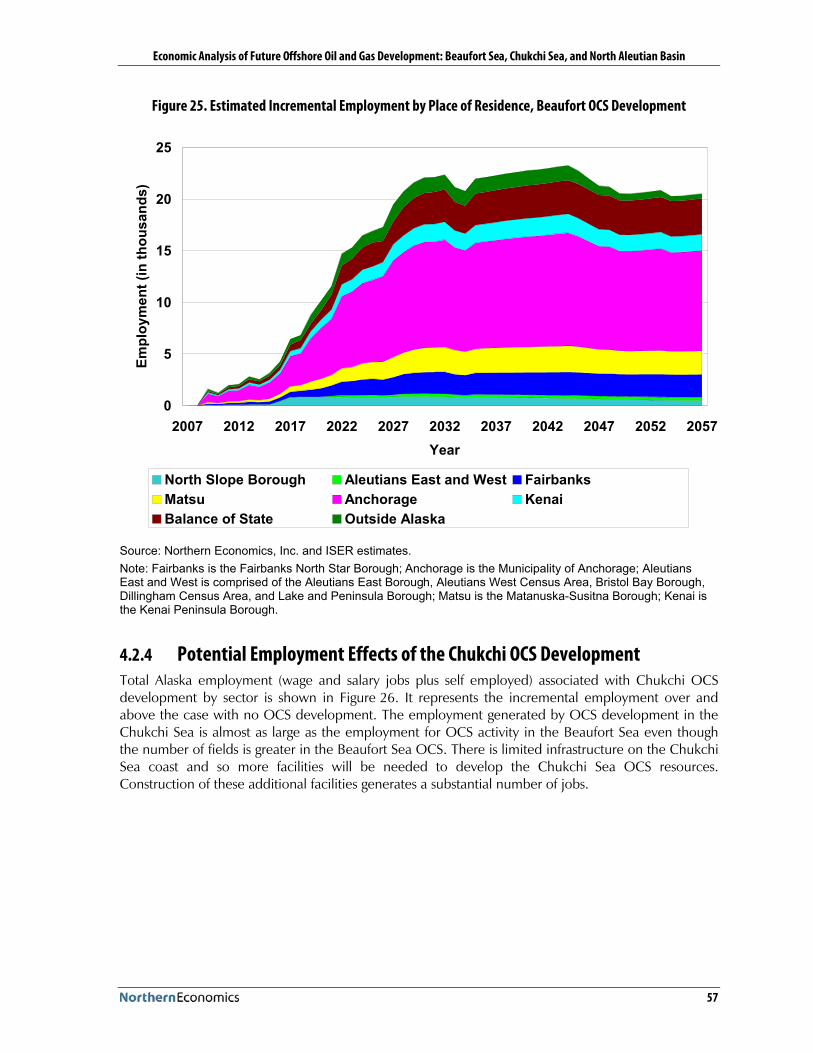
Economic Analysis of Future Offshore Oil and Gas Development: Beaufort Sea, Chukchi Sea, and North Aleutian Basin
57
Figure 25. Estimated Incremental Employment by Place of Residence, Beaufort OCS Development
0
5
10
15
20
25
2007 2012 2017 2022 2027 2032 2037 2042 2047 2052 2057Year
Empl
oym
ent (
in th
ousa
nds)
North Slope Borough Aleutians East and West FairbanksMatsu Anchorage KenaiBalance of State Outside Alaska
Source: Northern Economics, Inc. and ISER estimates. Note: Fairbanks is the Fairbanks North Star Borough; Anchorage is the Municipality of Anchorage; Aleutians East and West is comprised of the Aleutians East Borough, Aleutians West Census Area, Bristol Bay Borough, Dillingham Census Area, and Lake and Peninsula Borough; Matsu is the Matanuska-Susitna Borough; Kenai is the Kenai Peninsula Borough.
4.2.4 Potential Employment Effects of the Chukchi OCS Development Total Alaska employment (wage and salary jobs plus self employed) associated with Chukchi OCS development by sector is shown in Figure 26. It represents the incremental employment over and above the case with no OCS development. The employment generated by OCS development in the Chukchi Sea is almost as large as the employment for OCS activity in the Beaufort Sea even though the number of fields is greater in the Beaufort Sea OCS. There is limited infrastructure on the Chukchi Sea coast and so more facilities will be needed to develop the Chukchi Sea OCS resources. Construction of these additional facilities generates a substantial number of jobs.
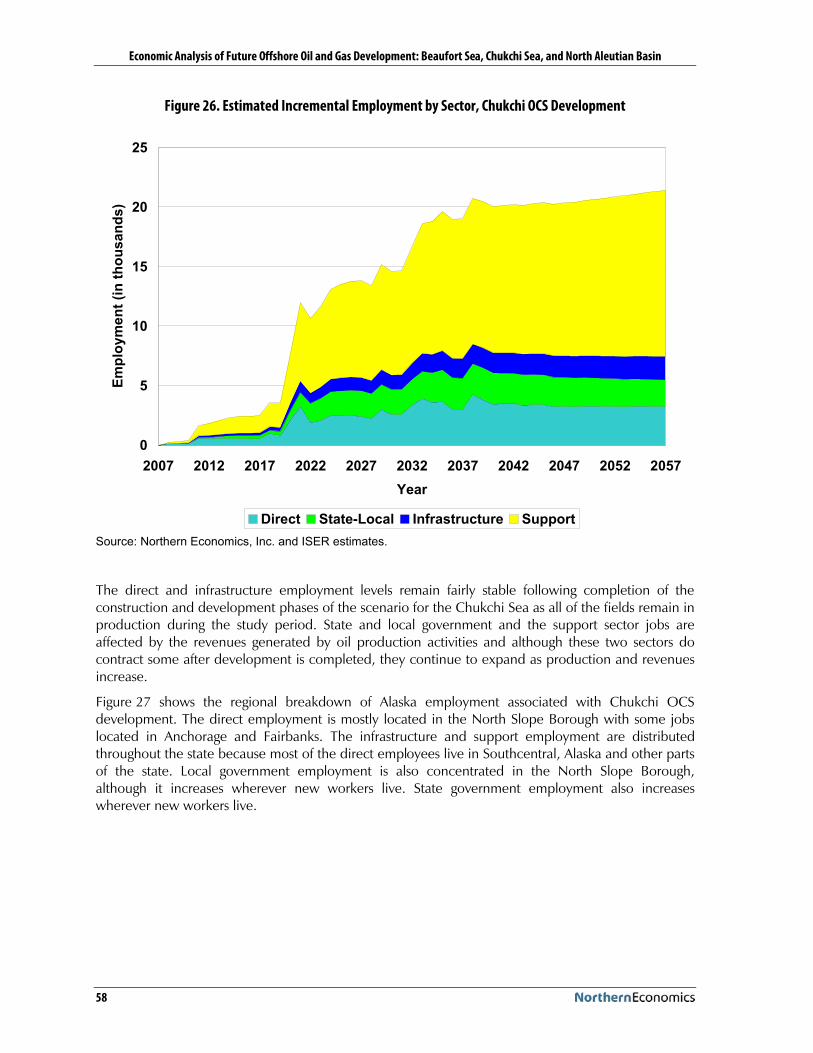
Economic Analysis of Future Offshore Oil and Gas Development: Beaufort Sea, Chukchi Sea, and North Aleutian Basin
58
Figure 26. Estimated Incremental Employment by Sector, Chukchi OCS Development
0
5
10
15
20
25
2007 2012 2017 2022 2027 2032 2037 2042 2047 2052 2057Year
Empl
oym
ent (
in th
ousa
nds)
Direct State-Local Infrastructure SupportSource: Northern Economics, Inc. and ISER estimates.
The direct and infrastructure employment levels remain fairly stable following completion of the construction and development phases of the scenario for the Chukchi Sea as all of the fields remain in production during the study period. State and local government and the support sector jobs are affected by the revenues generated by oil production activities and although these two sectors do contract some after development is completed, they continue to expand as production and revenues increase.
Figure 27 shows the regional breakdown of Alaska employment associated with Chukchi OCS development. The direct employment is mostly located in the North Slope Borough with some jobs located in Anchorage and Fairbanks. The infrastructure and support employment are distributed throughout the state because most of the direct employees live in Southcentral, Alaska and other parts of the state. Local government employment is also concentrated in the North Slope Borough, although it increases wherever new workers live. State government employment also increases wherever new workers live.

Economic Analysis of Future Offshore Oil and Gas Development: Beaufort Sea, Chukchi Sea, and North Aleutian Basin
59
Figure 27. Estimated Incremental Employment by Place of Work, Chukchi OCS Development
0
5
10
15
20
25
2007 2012 2017 2022 2027 2032 2037 2042 2047 2052 2057Year
Empl
oym
ent (
in th
ousa
nds)
North Slope Borough Aleutians East and West FairbanksMatsu Anchorage KenaiBalance of State
Source: Northern Economics, Inc. and ISER estimates. Note: Fairbanks is the Fairbanks North Star Borough; Anchorage is the Municipality of Anchorage; Aleutians East and West is comprised of the Aleutians East Borough, Aleutians West Census Area, Bristol Bay Borough, Dillingham Census Area, and Lake and Peninsula Borough; Matsu is the Matanuska-Susitna Borough; Kenai is the Kenai Peninsula Borough.
Figure 28 shows the incremental statewide employment associated with the Chukchi Sea OCS development by place of residence. This figure shows total (direct and indirect) employment for areas within the state. Outside of Alaska estimates are for direct employment only. Total employment exceeds 22,000 by the end of the study period.

Economic Analysis of Future Offshore Oil and Gas Development: Beaufort Sea, Chukchi Sea, and North Aleutian Basin
60
Figure 28. Incremental Employment by Place of Residence, Chukchi OCS Development
0
5
10
15
20
25
2007 2012 2017 2022 2027 2032 2037 2042 2047 2052 2057Year
Empl
oym
ent (
in th
ousa
nds)
North Slope Borough Aleutians East and West FairbanksMatsu Anchorage KenaiBalance of State Outside Alaska
Source: Northern Economics, Inc. and ISER estimates. Note: Fairbanks is the Fairbanks North Star Borough; Anchorage is the Municipality of Anchorage; Aleutians East and West is comprised of the Aleutians East Borough, Aleutians West Census Area, Bristol Bay Borough, Dillingham Census Area, and Lake and Peninsula Borough; Matsu is the Matanuska-Susitna Borough; Kenai is the Kenai Peninsula Borough.
4.2.5 Potential Employment Effects in the North Slope: Combined Beaufort and Chukchi OCS Activities
Total Alaska employment (wage and salary jobs plus self employed) associated with combined Beaufort and Chukchi development by sector is shown in Figure 29. It represents the incremental employment over and above the case with no OCS development. The employment estimates shown below represent the sum of the employment for the Beaufort and Chukchi OCS scenarios.

Economic Analysis of Future Offshore Oil and Gas Development: Beaufort Sea, Chukchi Sea, and North Aleutian Basin
61
Figure 29. Estimated Incremental Employment, Beaufort and Chukchi OCS Development
0
5
10
15
20
25
30
35
40
45
50
2007 2012 2017 2022 2027 2032 2037 2042 2047 2052 2057Year
Empl
oym
ent (
in th
ousa
nds)
Direct State-Local Infrastructure Support
Source: Northern Economics, Inc. and ISER estimates.
Figure 30 shows the regional breakdown of Alaska employment associated with Beaufort and Chukchi OCS development. The direct employment is mostly located in the North Slope Borough. The infrastructure and support employment are distributed throughout the state because most of the direct employees live in Southcentral, Alaska and other parts of the state. Local government employment is also concentrated in the North Slope Borough, although it increases wherever new workers live. State government employment also increases wherever new workers live.
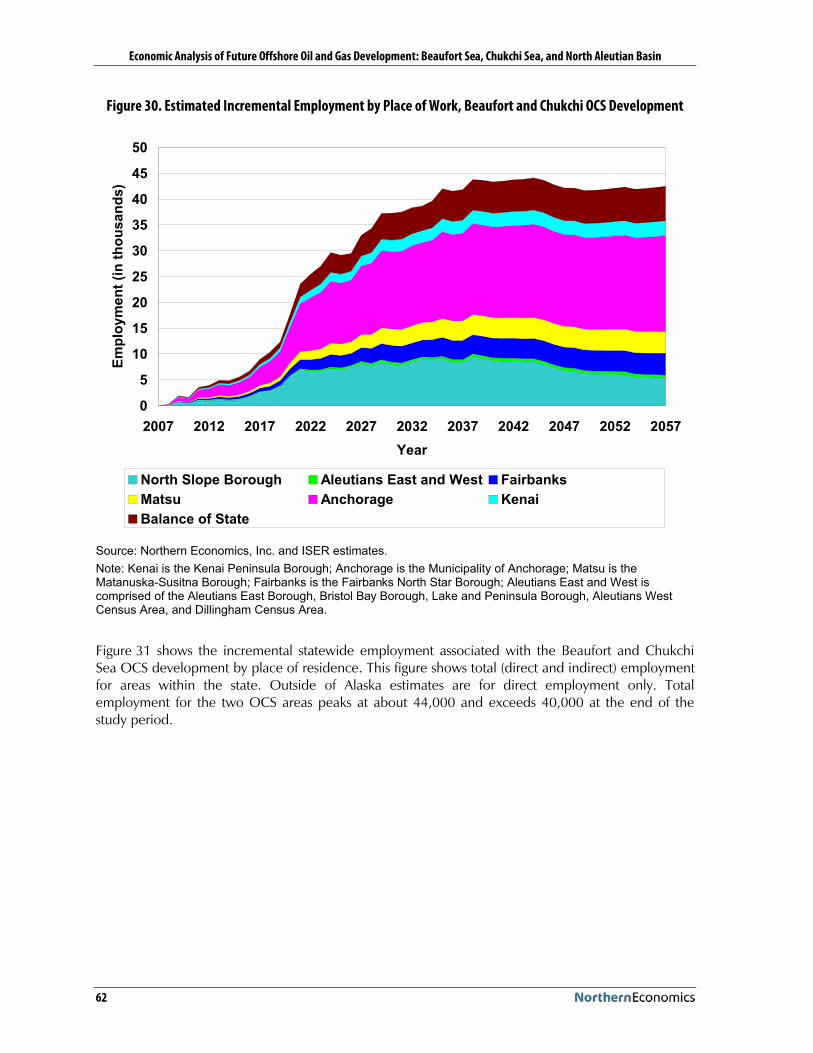
Economic Analysis of Future Offshore Oil and Gas Development: Beaufort Sea, Chukchi Sea, and North Aleutian Basin
62
Figure 30. Estimated Incremental Employment by Place of Work, Beaufort and Chukchi OCS Development
0
5
10
15
20
25
30
35
40
45
50
2007 2012 2017 2022 2027 2032 2037 2042 2047 2052 2057Year
Empl
oym
ent (
in th
ousa
nds)
North Slope Borough Aleutians East and West FairbanksMatsu Anchorage KenaiBalance of State
Source: Northern Economics, Inc. and ISER estimates. Note: Kenai is the Kenai Peninsula Borough; Anchorage is the Municipality of Anchorage; Matsu is the Matanuska-Susitna Borough; Fairbanks is the Fairbanks North Star Borough; Aleutians East and West is comprised of the Aleutians East Borough, Bristol Bay Borough, Lake and Peninsula Borough, Aleutians West Census Area, and Dillingham Census Area.
Figure 31 shows the incremental statewide employment associated with the Beaufort and Chukchi Sea OCS development by place of residence. This figure shows total (direct and indirect) employment for areas within the state. Outside of Alaska estimates are for direct employment only. Total employment for the two OCS areas peaks at about 44,000 and exceeds 40,000 at the end of the study period.

Economic Analysis of Future Offshore Oil and Gas Development: Beaufort Sea, Chukchi Sea, and North Aleutian Basin
63
Figure 31. Estimated Incremental Employment by Place of Residence, Beaufort and Chukchi OCS Development
0
5
10
15
20
25
30
35
40
45
50
2007 2012 2017 2022 2027 2032 2037 2042 2047 2052 2057Year
Empl
oym
ent (
in th
ousa
nds)
North Slope Borough Aleutians East and West FairbanksMatsu Anchorage KenaiBalance of State Outside Alaska
Source: Northern Economics, Inc. and ISER estimates. Note: Fairbanks is the Fairbanks North Star Borough; Anchorage is the Municipality of Anchorage; Aleutians East and West is comprised of the Aleutians East Borough, Aleutians West Census Area, Bristol Bay Borough, Dillingham Census Area, and Lake and Peninsula Borough; Matsu is the Matanuska-Susitna Borough; Kenai is the Kenai Peninsula Borough.
4.2.6 Potential Employment Effects of the North Aleutian OCS Development Total Alaska employment (wage and salary jobs plus self employed) associated with North Aleutian Basin OCS development by category is shown in Figure 32. It represents the incremental employment over and above the case with no OCS development. The decline in direct employment following the development phase is evident in the figure. The figure also shows the relatively level employment for the direct and infrastructure sectors during production. The state and local government employment and support sector employment declines over time due to the decline in production which affects state and local government revenues and associated jobs in those sectors.
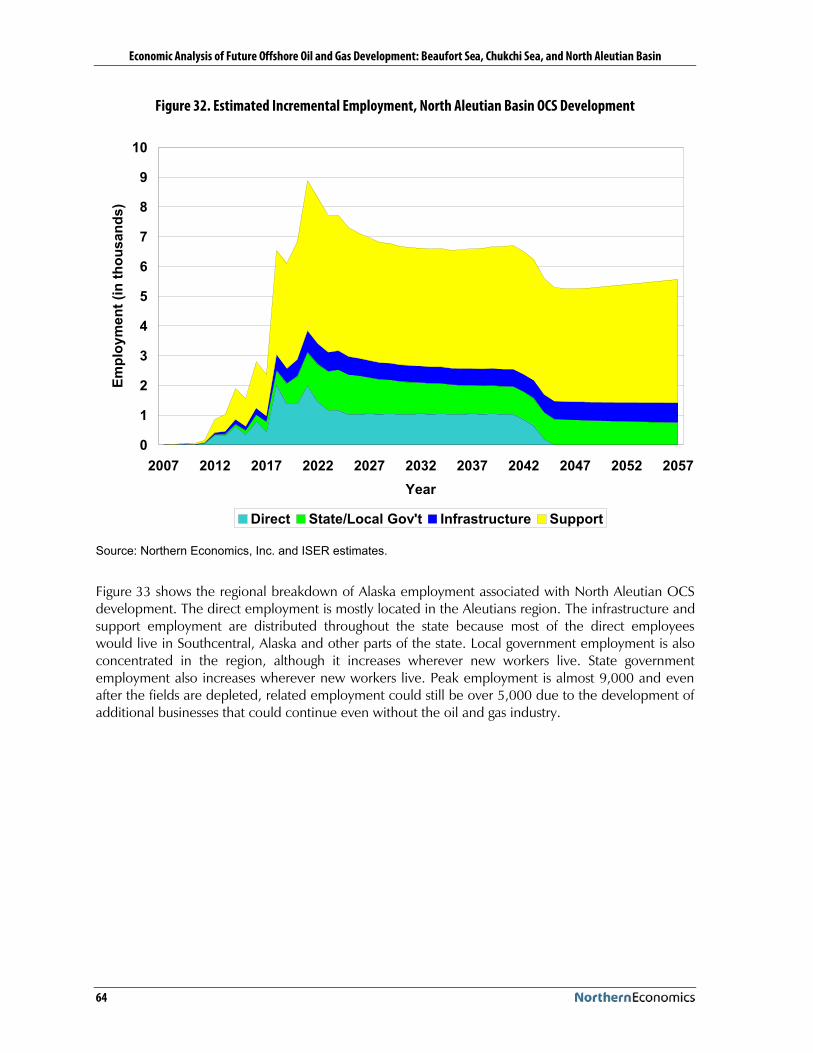
Economic Analysis of Future Offshore Oil and Gas Development: Beaufort Sea, Chukchi Sea, and North Aleutian Basin
64
Figure 32. Estimated Incremental Employment, North Aleutian Basin OCS Development
0
1
2
3
4
5
6
7
8
9
10
2007 2012 2017 2022 2027 2032 2037 2042 2047 2052 2057Year
Empl
oym
ent (
in th
ousa
nds)
Direct State/Local Gov't Infrastructure Support
Source: Northern Economics, Inc. and ISER estimates.
Figure 33 shows the regional breakdown of Alaska employment associated with North Aleutian OCS development. The direct employment is mostly located in the Aleutians region. The infrastructure and support employment are distributed throughout the state because most of the direct employees would live in Southcentral, Alaska and other parts of the state. Local government employment is also concentrated in the region, although it increases wherever new workers live. State government employment also increases wherever new workers live. Peak employment is almost 9,000 and even after the fields are depleted, related employment could still be over 5,000 due to the development of additional businesses that could continue even without the oil and gas industry.

Economic Analysis of Future Offshore Oil and Gas Development: Beaufort Sea, Chukchi Sea, and North Aleutian Basin
65
Figure 33. Estimated Incremental Employment by Place of Work, North Aleutian Basin OCS Development
0
1
2
3
4
5
6
7
8
9
10
2007 2012 2017 2022 2027 2032 2037 2042 2047 2052 2057Year
Empl
oym
ent (
in th
ousa
nds)
North Slope Borough Aleutians East and West FairbanksMatsu Anchorage KenaiBalance of State
Source: Northern Economics, Inc. and ISER estimates. Note: Kenai is the Kenai Peninsula Borough; Anchorage is the Municipality of Anchorage; Matsu is the Matanuska-Susitna Borough; Fairbanks is the Fairbanks North Star Borough; Aleutians is comprised of the Aleutians East Borough, Bristol Bay Borough, Lake and Peninsula Borough, Aleutians West Census Area, and Dillingham Census Area; NS Borough is the North Slope Borough.
Figure 34 shows the incremental statewide employment associated with the North Aleutian Basin OCS development by place of residence. This figure shows total (direct and indirect) employment for areas within the state. Outside of Alaska estimates are for direct employment only.

Economic Analysis of Future Offshore Oil and Gas Development: Beaufort Sea, Chukchi Sea, and North Aleutian Basin
66
Figure 34. Estimated Incremental Employment by Place of Residence, North Aleutian Basin OCS Development
0
1
2
3
4
5
6
7
8
9
10
2007 2012 2017 2022 2027 2032 2037 2042 2047 2052 2057Year
Empl
oym
ent (
in th
ousa
nds)
North Slope Borough Aleutians East and West FairbanksMatsu Anchorage KenaiBalance of State Outside Alaska
Source: Northern Economics, Inc. and ISER estimates. Note: Fairbanks is the Fairbanks North Star Borough; Anchorage is the Municipality of Anchorage; Aleutians East and West is comprised of the Aleutians East Borough, Aleutians West Census Area, Bristol Bay Borough, Dillingham Census Area, and Lake and Peninsula Borough; Matsu is the Matanuska-Susitna Borough; Kenai is the Kenai Peninsula Borough.
4.2.7 Potential Total Statewide Employment Effects: All Three OCS Development
Total Alaska employment (wage and salary jobs plus self employed) associated with OCS development in the Beaufort, Chukchi, and the North Aleutian Basin by sector is shown in Figure 35. It represents the incremental employment over and above the status quo case with no OCS development. The peak of about 50,000 additional employment would be an increase of about 16 percent over 2007 wage and salary employment and about 11 percent over total employment, including the self-employed in 2007 (Bureau of Economic Analysis, 2008).

Economic Analysis of Future Offshore Oil and Gas Development: Beaufort Sea, Chukchi Sea, and North Aleutian Basin
67
Figure 35. Estimated Incremental Employment: Beaufort, Chukchi, and North Aleutian Basin OCS Development
0
10
20
30
40
50
60
2007 2012 2017 2022 2027 2032 2037 2042 2047 2052 2057Year
Empl
oym
ent (
in th
ousa
nds)
Direct State-Local Infrastructure Support
Source: Northern Economics, Inc. and ISER estimates.
Figure 36 and Figure 37 show the regional breakdown of Alaska employment associated with the development of all 3 OCS areas by place of work and by place of residence, respectively.
Direct employment would mostly be located in the North Slope and in the Aleutians. The infrastructure and support employment are distributed throughout the state because most of the direct employees live in Southcentral Alaska and other parts of the state. Local government employment would also be concentrated in the North Slope and Aleutians regions, although local government increases wherever new workers live. State government employment also increases wherever new workers live.
Population change would occur with changes in employment by place of residence. Because much of the direct and infrastructure workforce on the North Slope and Aleutians regions would live in Southcentral, Alaska, the incremental population is primarily concentrated there. Incremental population is slightly less than incremental employment because a small share of direct employment is non-resident. The following sub-section discusses the population effects of OCS development in Alaska.
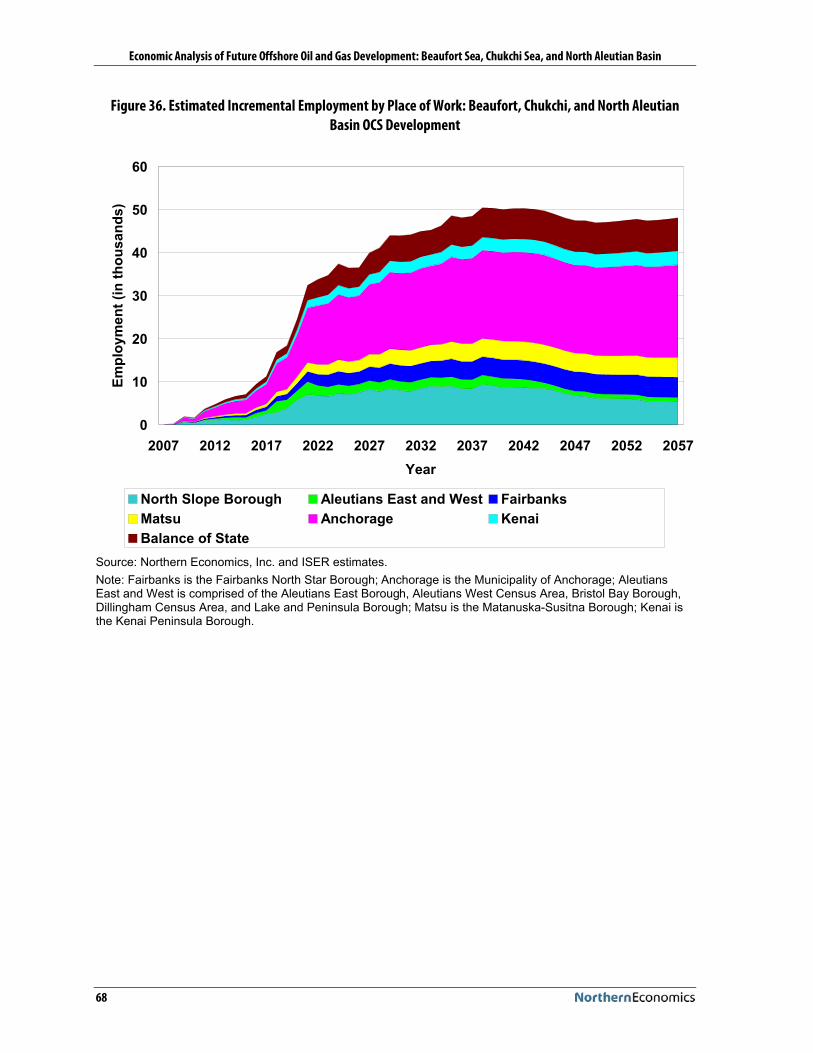
Economic Analysis of Future Offshore Oil and Gas Development: Beaufort Sea, Chukchi Sea, and North Aleutian Basin
68
Figure 36. Estimated Incremental Employment by Place of Work: Beaufort, Chukchi, and North Aleutian Basin OCS Development
0
10
20
30
40
50
60
2007 2012 2017 2022 2027 2032 2037 2042 2047 2052 2057Year
Empl
oym
ent (
in th
ousa
nds)
North Slope Borough Aleutians East and West FairbanksMatsu Anchorage KenaiBalance of State
Source: Northern Economics, Inc. and ISER estimates. Note: Fairbanks is the Fairbanks North Star Borough; Anchorage is the Municipality of Anchorage; Aleutians East and West is comprised of the Aleutians East Borough, Aleutians West Census Area, Bristol Bay Borough, Dillingham Census Area, and Lake and Peninsula Borough; Matsu is the Matanuska-Susitna Borough; Kenai is the Kenai Peninsula Borough.

Economic Analysis of Future Offshore Oil and Gas Development: Beaufort Sea, Chukchi Sea, and North Aleutian Basin
69
Figure 37. Estimated Incremental Employment by Place of Residence: Beaufort, Chukchi, and North Aleutian Basin OCS Development
0
10
20
30
40
50
60
2007 2012 2017 2022 2027 2032 2037 2042 2047 2052 2057Year
Empl
oym
ent (
in th
ousa
nds)
North Slope Borough Aleutians East and West FairbanksMatsu Anchorage KenaiBalance of State Outside Alaska
Source: Northern Economics, Inc. and ISER estimates. Note: Fairbanks is the Fairbanks North Star Borough; Anchorage is the Municipality of Anchorage; Aleutians East and West is comprised of the Aleutians East Borough, Aleutians West Census Area, Bristol Bay Borough, Dillingham Census Area, and Lake and Peninsula Borough; Matsu is the Matanuska-Susitna Borough; Kenai is the Kenai Peninsula Borough.
4.3 Potential Statewide Population Effects The Alaska labor market does not have the capacity to supply all the workers needed to fill the jobs that could be created by OCS activity. Although some of the new jobs could be filled by the growing Alaska labor force, many could be taken by new migrants to the state and this would increase the Alaska population.
This is consistent with the historical pattern of population growth. Each year a significant share of the population leaves the state, only to be replaced by an almost equal number of new residents. In years of rapid growth of employment opportunities, the number of people moving into the state will outnumber those who leave, and this will result in an increase in the total population of the state. In years of slow or negative employment growth the number of people who migrate from the state will outnumber newcomers and total population will either grow more slowly (due to natural increase) or actually fall.
Because migrants seeking jobs often have families, the population effect of OCS development would increase the size of the working adult population and the number of dependents—infants, children, adults not in the labor force, and even senior citizens. Often a family will include more than one adult

Economic Analysis of Future Offshore Oil and Gas Development: Beaufort Sea, Chukchi Sea, and North Aleutian Basin
70
in the labor force. In those cases, one new family can account for more than one of the new jobs created by OCS activity.
Two factors beyond the size and composition of families are important in determining the population response to new employment opportunities. The first is the share of new jobs taken by nonresidents who come to the state to work, but continue to reside outside of Alaska, a practice that has been common in the petroleum industry. It is assumed in this study that a share of the direct jobs in OCS exploration, development, and production will be filled by these commuting nonresidents, but that the other jobs generated by OCS activity (infrastructure, support, and government) will be filled by residents, including new migrants. Obviously the larger the nonresident share of new workers, the smaller will be the population impact of OCS development.
The second is the presence of an under-utilized Alaska labor force. The Alaska unemployment rate has historically been higher than the national average, in part because job opportunities are more concentrated in urban Alaska than the population, and in part because the labor force participation among Alaska Natives is low. To the extent that policies were in place that brought more of these potential Alaska workers into the work force, the need to attract new workers from outside the state would be reduced and the population impact from OCS development could be reduced. In this analysis, the assumption is that there is no change from the historical relationship between the unemployment rates in Alaska and the U.S. average.
The potential population effects of OCS development in the Beaufort, Chukchi, and the North Aleutian Basin are discussed in the following sections. These results show the projected change in statewide population resulting from OCS development in each of the three OCS areas. The projected change in the local population of the directly impacted regions—the North Slope Borough and the Aleutians region—is presented in a separate section (Section 4.4).
To illustrate the magnitude of the potential increase in population, the incremental change due to OCS development is compared against the statewide baseline population projection without OCS development. The baseline statewide population projection reflects the effects of births, deaths, and migration that correspond with the economic growth assumptions discussed earlier. The results below show that OCS development is not anticipated to create a substantial increase in statewide population relative to the baseline population growth. The implication of this result is that the estimated increase in population due OCS development is not anticipated to create a disproportionate burden on the state to provide public services to the new population.
4.3.1 Beaufort OCS OCS development in the Beaufort Sea is anticipated to add modestly to the total population of the state, as shown in Figure 38. As discussed above, the size of the population impact depends upon the number of jobs generated by OCS development, the capacity of the Alaska labor force to fill those jobs, and the family characteristics of those non-Alaskans who come to the state to fill the jobs not taken by current Alaskans.
The increase in population would be distributed throughout the state (Figure 39), but likely concentrated in the urban areas including the Municipality of Anchorage, the Matanuska-Susitna Borough, the Kenai Peninsula Borough, and the Fairbanks North Star Borough rather than on the North Slope. There are two reasons for this urban concentration. First, although most of the direct OCS jobs would be located in the North Slope Borough, most would be taken by workers living in urban areas and commuting to the work site, as has been the pattern since the development of North Slope petroleum resources began. Second, most of the infrastructure and support jobs associated with

Economic Analysis of Future Offshore Oil and Gas Development: Beaufort Sea, Chukchi Sea, and North Aleutian Basin
71
OCS development would be located in the urban areas and it is assumed that these jobs will be filled by residents of urban Alaska.
Population growth in the North Slope Borough would result from employment of local residents in direct OCS jobs as well as in infrastructure, support, and government. Population growth in other parts of the state would be related to persons commuting to jobs on the North Slope or Beaufort OCS and government jobs.
Figure 38. Estimated Statewide Population Effects, Beaufort OCS Development
0
200
400
600
800
1,000
1,200
2007 2012 2017 2022 2027 2032 2037 2042 2047 2052 2057Year
Num
ber o
f Per
sons
(in
thou
sand
s)
Baseline Statewide Population OCS Increment
Source: Northern Economics, Inc. and ISER estimates.

Economic Analysis of Future Offshore Oil and Gas Development: Beaufort Sea, Chukchi Sea, and North Aleutian Basin
72
Figure 39. Estimated Population Effects by Region, Beaufort OCS Development
0
5
10
15
20
25
30
35
2007 2012 2017 2022 2027 2032 2037 2042 2047 2052 2057Year
Num
ber o
f Per
sons
(in
thou
sand
s)
North Slope Borough Aleutians East and West FairbanksMatsu Anchorage KenaiBalance of State
Source: Northern Economics, Inc. and ISER estimates. Note: Fairbanks is the Fairbanks North Star Borough; Anchorage is the Municipality of Anchorage; Aleutians East and West is comprised of the Aleutians East Borough, Aleutians West Census Area, Bristol Bay Borough, Dillingham Census Area, and Lake and Peninsula Borough; Matsu is the Matanuska-Susitna Borough; Kenai is the Kenai Peninsula Borough.
4.3.2 Chukchi OCS As in the Beaufort case, OCS development in the Chukchi is also estimated to add modestly to the total population of the state as shown in Figure 40. As noted above, the size of the population impact depends upon the number of jobs generated by OCS development, the capacity of the Alaska labor force to fill those jobs, and the family characteristics of those non-Alaskans who come to the state to fill the jobs not taken by current Alaskans.
Figure 41 shows the distribution of the additional population throughout the different parts of the state. The figure shows that the additional population is expected to be concentrated not in the North Slope but in the Municipality of Anchorage, Kenai Peninsula Borough, and Fairbanks North Star Borough, where most of the workers are anticipated to reside.

Economic Analysis of Future Offshore Oil and Gas Development: Beaufort Sea, Chukchi Sea, and North Aleutian Basin
73
Figure 40. Estimated Statewide Population Effects, Chukchi OCS Development
0
200
400
600
800
1,000
1,200
2007 2012 2017 2022 2027 2032 2037 2042 2047 2052 2057Year
Num
ber o
f Per
sons
(in
thou
sand
s)
Baseline Statewide Population OCS Increment
Source: Northern Economics, Inc. and ISER estimates.

Economic Analysis of Future Offshore Oil and Gas Development: Beaufort Sea, Chukchi Sea, and North Aleutian Basin
74
Figure 41. Estimated Population Effects by Region, Chukchi OCS Development
0
5
10
15
20
25
30
35
2007 2012 2017 2022 2027 2032 2037 2042 2047 2052 2057Year
Num
ber o
f Per
sons
(in
thou
sand
s)
North Slope Borough Aleutians East and West FairbanksMatsu Anchorage KenaiBalance of State
Source: Northern Economics, Inc. and ISER estimates. Note: Fairbanks is the Fairbanks North Star Borough; Anchorage is the Municipality of Anchorage; Aleutians East and West is comprised of the Aleutians East Borough, Aleutians West Census Area, Bristol Bay Borough, Dillingham Census Area, and Lake and Peninsula Borough; Matsu is the Matanuska-Susitna Borough; Kenai is the Kenai Peninsula Borough.
4.3.3 Combined Beaufort and Chukchi OCS Activity Figure 42 and Figure 43 show the estimated combined population effects of the Beaufort and the Chukchi OCS development. The population effects from OCS development in the North Slope as noted earlier are expected to be modest and most of the additional population would be concentrated in urban areas.

Economic Analysis of Future Offshore Oil and Gas Development: Beaufort Sea, Chukchi Sea, and North Aleutian Basin
75
Figure 42. Estimated Statewide Population Effects, Combined Beaufort and Chukchi OCS Activity
0
200
400
600
800
1,000
1,200
2007 2012 2017 2022 2027 2032 2037 2042 2047 2052 2057Year
Num
ber o
f Per
sons
(in
thou
sand
s)
Baseline Statewide Population OCS Increment
Source: Northern Economics, Inc. and ISER estimates.

Economic Analysis of Future Offshore Oil and Gas Development: Beaufort Sea, Chukchi Sea, and North Aleutian Basin
76
Figure 43. Estimated Population Effects by Region, Combined Beaufort and Chukchi OCS Activity
0
10
20
30
40
50
60
70
2007 2012 2017 2022 2027 2032 2037 2042 2047 2052 2057Year
Num
ber o
f Per
sons
(in
thou
sand
s)
North Slope Borough Aleutians East and West FairbanksMatsu Anchorage KenaiBalance of State
Source: Northern Economics, Inc. and ISER estimates. Note: Fairbanks is the Fairbanks North Star Borough; Anchorage is the Municipality of Anchorage; Aleutians East and West is comprised of the Aleutians East Borough, Aleutians West Census Area, Bristol Bay Borough, Dillingham Census Area, and Lake and Peninsula Borough; Matsu is the Matanuska-Susitna Borough; Kenai is the Kenai Peninsula Borough.
4.3.4 North Aleutian OCS Additional population resulting from OCS development in the North Aleutian Basin is expected to be modest (as shown in Figure 44). Although most of the direct OCS jobs would be located in the North Aleutians Basin, most would be taken by workers living in urban areas and commuting to the work site. Furthermore, since most of the infrastructure and support jobs associated with OCS development would be located in the urban areas, it is assumed that these jobs will be filled by residents of urban Alaska. The distribution of the additional population resulting from OCS development in the North Aleutians is illustrated in Figure 45.
Population growth in the North Aleutian Basin would result from employment of local residents in direct OCS jobs as well as in infrastructure, support, and government. Population growth in other parts of the state would be related to persons commuting to jobs in the North Aleutian Basin region and government jobs.

Economic Analysis of Future Offshore Oil and Gas Development: Beaufort Sea, Chukchi Sea, and North Aleutian Basin
77
Figure 44. Estimated Statewide Population Effects, North Aleutian Basin OCS Development
0
2
4
6
8
10
12
14
16
18
20
2007 2012 2017 2022 2027 2032 2037 2042 2047 2052 2057Year
Num
ber o
f Per
sons
(in
thou
sand
s)
Baseline Aleutians Region Population OCS Increment
Source: Northern Economics, Inc. and ISER estimates.

Economic Analysis of Future Offshore Oil and Gas Development: Beaufort Sea, Chukchi Sea, and North Aleutian Basin
78
Figure 45. Estimated Population Effects by Region, North Aleutian Basin OCS Development
0
2
4
6
8
10
12
14
2007 2012 2017 2022 2027 2032 2037 2042 2047 2052 2057Year
Num
ber o
f Per
sons
(in
thou
sand
s)
North Slope Borough Aleutians East and West FairbanksMatsu Anchorage KenaiBalance of State
Source: Northern Economics, Inc. and ISER estimates. Note: Fairbanks is the Fairbanks North Star Borough; Anchorage is the Municipality of Anchorage; Aleutians East and West is comprised of the Aleutians East Borough, Aleutians West Census Area, Bristol Bay Borough, Dillingham Census Area, and Lake and Peninsula Borough; Matsu is the Matanuska-Susitna Borough; Kenai is the Kenai Peninsula Borough.
4.3.5 Total Potential Population Effects: All Three OCS Development Figure 46 and Figure 47 show the combined population effects of the development of all 3 OCS areas. The increase in statewide population is projected to be modest and most of the new population is expected to be concentrated in urban areas of Alaska.

Economic Analysis of Future Offshore Oil and Gas Development: Beaufort Sea, Chukchi Sea, and North Aleutian Basin
79
Figure 46. Estimated Statewide Population Effects: Beaufort, Chukchi, and North Aleutian Basin OCS Development
0
200
400
600
800
1,000
1,200
2007 2012 2017 2022 2027 2032 2037 2042 2047 2052 2057Year
Num
ber o
f Per
sons
(in
thou
sand
s)
Baseline Statewide Population OCS Increment
Source: Northern Economics, Inc. and ISER estimates.
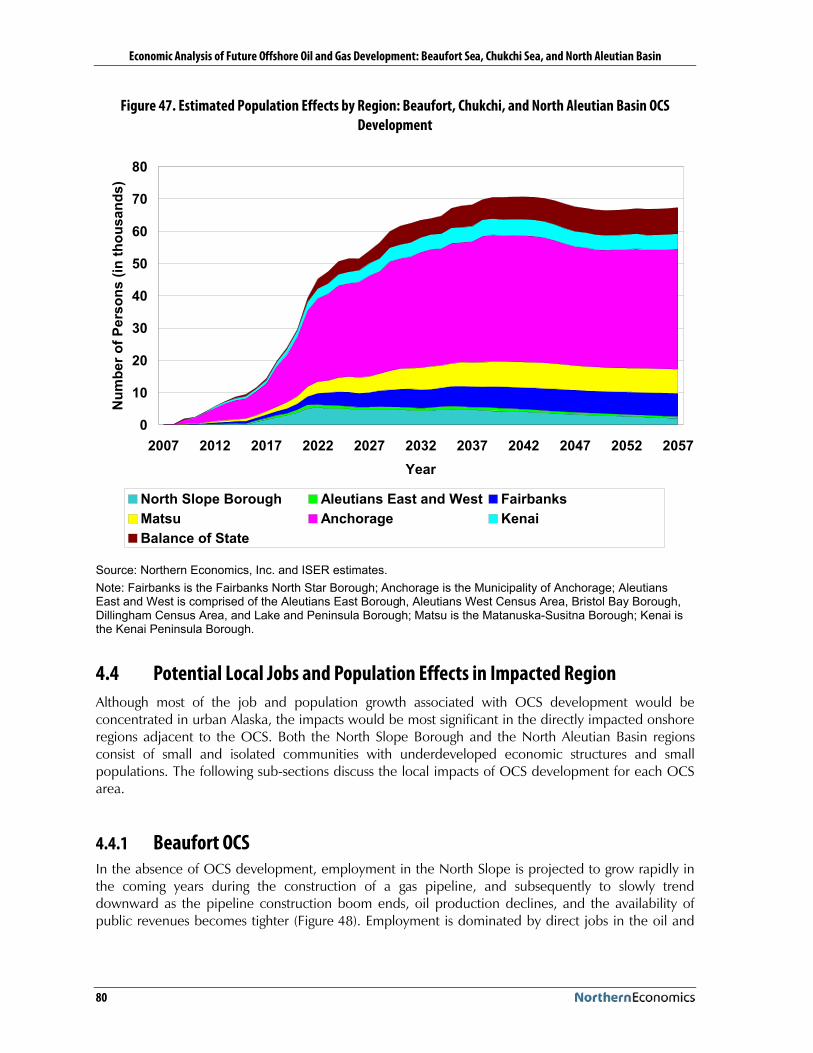
Economic Analysis of Future Offshore Oil and Gas Development: Beaufort Sea, Chukchi Sea, and North Aleutian Basin
80
Figure 47. Estimated Population Effects by Region: Beaufort, Chukchi, and North Aleutian Basin OCS Development
0
10
20
30
40
50
60
70
80
2007 2012 2017 2022 2027 2032 2037 2042 2047 2052 2057Year
Num
ber o
f Per
sons
(in
thou
sand
s)
North Slope Borough Aleutians East and West FairbanksMatsu Anchorage KenaiBalance of State
Source: Northern Economics, Inc. and ISER estimates. Note: Fairbanks is the Fairbanks North Star Borough; Anchorage is the Municipality of Anchorage; Aleutians East and West is comprised of the Aleutians East Borough, Aleutians West Census Area, Bristol Bay Borough, Dillingham Census Area, and Lake and Peninsula Borough; Matsu is the Matanuska-Susitna Borough; Kenai is the Kenai Peninsula Borough.
4.4 Potential Local Jobs and Population Effects in Impacted Region Although most of the job and population growth associated with OCS development would be concentrated in urban Alaska, the impacts would be most significant in the directly impacted onshore regions adjacent to the OCS. Both the North Slope Borough and the North Aleutian Basin regions consist of small and isolated communities with underdeveloped economic structures and small populations. The following sub-sections discuss the local impacts of OCS development for each OCS area.
4.4.1 Beaufort OCS In the absence of OCS development, employment in the North Slope is projected to grow rapidly in the coming years during the construction of a gas pipeline, and subsequently to slowly trend downward as the pipeline construction boom ends, oil production declines, and the availability of public revenues becomes tighter (Figure 48). Employment is dominated by direct jobs in the oil and

Economic Analysis of Future Offshore Oil and Gas Development: Beaufort Sea, Chukchi Sea, and North Aleutian Basin
81
gas sector and indirect jobs in the government sector, supported by both state and local revenues. Over time, infrastructure and support jobs become a larger share of the total jobs.
This pattern represents only one possible future scenario for North Slope Borough employment. In particular this pattern of government and support employment assumes that the resident population will remain at least at the current level. However, in recent years out migration from rural Alaska has increased. A continuation of that trend would result in both a smaller population and a smaller number of jobs than projected for the North Slope Borough in this analysis.
Figure 48. Projected Employment on the North Slope without Beaufort OCS Development
0
2
4
6
8
10
12
14
16
18
2007 2012 2017 2022 2027 2032 2037 2042 2047 2052 2057Year
Empl
oym
ent (
in th
ousa
nds)
Direct State/Local Gov't Infrastructure/Support
Source: Northern Economics, Inc. and ISER estimates.
The local employment associated with OCS development could expand over a 10 year period, remain relatively stable for the next 20 years, and then decline over the subsequent 10 year period (Figure 49). Most of the jobs would be directly related to oil and gas exploration, development, and production.
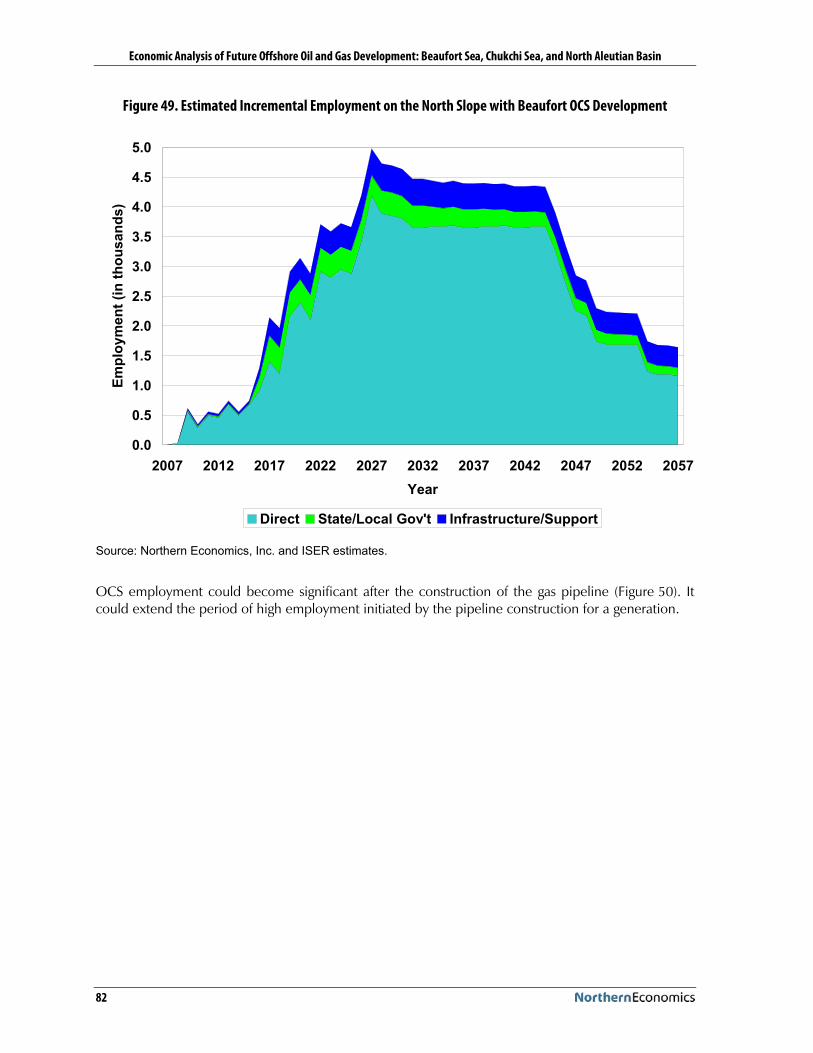
Economic Analysis of Future Offshore Oil and Gas Development: Beaufort Sea, Chukchi Sea, and North Aleutian Basin
82
Figure 49. Estimated Incremental Employment on the North Slope with Beaufort OCS Development
0.0
0.5
1.0
1.5
2.0
2.5
3.0
3.5
4.0
4.5
5.0
2007 2012 2017 2022 2027 2032 2037 2042 2047 2052 2057Year
Empl
oym
ent (
in th
ousa
nds)
Direct State/Local Gov't Infrastructure/Support
Source: Northern Economics, Inc. and ISER estimates.
OCS employment could become significant after the construction of the gas pipeline (Figure 50). It could extend the period of high employment initiated by the pipeline construction for a generation.

Economic Analysis of Future Offshore Oil and Gas Development: Beaufort Sea, Chukchi Sea, and North Aleutian Basin
83
Figure 50. Estimated Total Employment on the North Slope with and without Beaufort OCS Development
0
2
4
6
8
10
12
14
16
18
20
2007 2012 2017 2022 2027 2032 2037 2042 2047 2052 2057Year
Empl
oym
ent (
in th
ousa
nds)
Baseline North Slope Employment OCS Increment
Source: Northern Economics, Inc. and ISER estimates.
The effect of the new employment opportunities provided by OCS development on the population of the region depends on the share of new jobs taken by residents, including new migrants into the region. Consistent with the historical trend, it is assumed that only a small share of the direct jobs are taken by local residents, with the majority going to residents of urban Alaska and non-resident commuters from outside the state. However, all the government, infrastructure, and support jobs are taken by local residents.
The result is a projection of North Slope Borough population as shown in Figure 51. Population growth is rapid during the first years of OCS activity. After that, total population is relatively stable with a slow downward trend as the impact of OCS moderates.

Economic Analysis of Future Offshore Oil and Gas Development: Beaufort Sea, Chukchi Sea, and North Aleutian Basin
84
Figure 51. Estimated Local Population Effect, Beaufort OCS Development
0
2
4
6
8
10
12
2007 2012 2017 2022 2027 2032 2037 2042 2047 2052 2057Year
Num
ber o
f Per
sons
(in
thou
sand
s)
Baseline North Slope Population OCS Increment
Source: Northern Economics, Inc. and ISER estimates.
4.4.2 Chukchi OCS As noted above, in the absence of OCS development, employment in the North Slope is projected to grow rapidly in the coming years during the construction of a gas pipeline, and subsequently to slowly trend downward as the pipeline construction boom ends, oil production declines, and the availability of public revenues becomes tighter (Figure 52). Employment is dominated by direct jobs, almost all of which are petroleum related, and government jobs, supported by both state and local revenues. Infrastructure and support jobs become a larger share of the total over time.
This pattern represents only one possible future scenario for North Slope Borough employment. In particular this pattern of government and support employment assumes that the resident population will remain at least at the current level. However, in recent years out migration from rural Alaska has increased. A continuation of that trend could result in both a smaller population and a smaller number of jobs than projected in this study.

Economic Analysis of Future Offshore Oil and Gas Development: Beaufort Sea, Chukchi Sea, and North Aleutian Basin
85
Figure 52. Estimated Employment on the North Slope without Chukchi OCS Development
0
2
4
6
8
10
12
14
16
18
2007 2012 2017 2022 2027 2032 2037 2042 2047 2052 2057Year
Empl
oym
ent (
in th
ousa
nds)
Direct State/Local Gov't Infrastructure/Support
Source: Northern Economics, Inc. and ISER estimates.
The local employment associated with OCS development could expand rapidly, fluctuate over the next 20 years, and then slowly decline (Figure 53). Most of the jobs would be directly related to oil and gas exploration, development, and production.

Economic Analysis of Future Offshore Oil and Gas Development: Beaufort Sea, Chukchi Sea, and North Aleutian Basin
86
Figure 53. Estimated Incremental Employment on the North Slope with Chukchi OCS Development
0.0
0.5
1.0
1.5
2.0
2.5
3.0
3.5
4.0
4.5
5.0
2007 2012 2017 2022 2027 2032 2037 2042 2047 2052 2057Year
Empl
oym
ent (
in th
ousa
nds)
Direct State/Local Gov't Infrastructure/Support
Source: Northern Economics, Inc. and ISER estimates.
The OCS employment could become significant with a slight delay after the construction of the gas pipeline (Figure 54). It could extend the period of high employment initiated by the pipeline construction.

Economic Analysis of Future Offshore Oil and Gas Development: Beaufort Sea, Chukchi Sea, and North Aleutian Basin
87
Figure 54. Estimated Total Employment on the North Slope with and without Chukchi OCS Development
0
2
4
6
8
10
12
14
16
18
20
2007 2012 2017 2022 2027 2032 2037 2042 2047 2052 2057Year
Empl
oym
ent (
in th
ousa
nds)
Baseline North Slope Employment OCS Increment
Source: ISER estimates.
The effect of the new employment opportunities provided by OCS development on the population of the region depends on the share of new jobs taken by residents, including new migrants into the region. Consistent with the historical trend, it is assumed that only a small share of the direct jobs are taken by local residents with the majority going to residents of urban Alaska and non-resident commuters from outside the state. However, all the government, infrastructure, and support jobs are taken by local residents.
The result is a projection of North Slope Borough population as shown in Figure 55. Population growth is rapid during the first years of OCS activity. After that total population is relatively stable with a slow downward trend as the impact of OCS moderates.
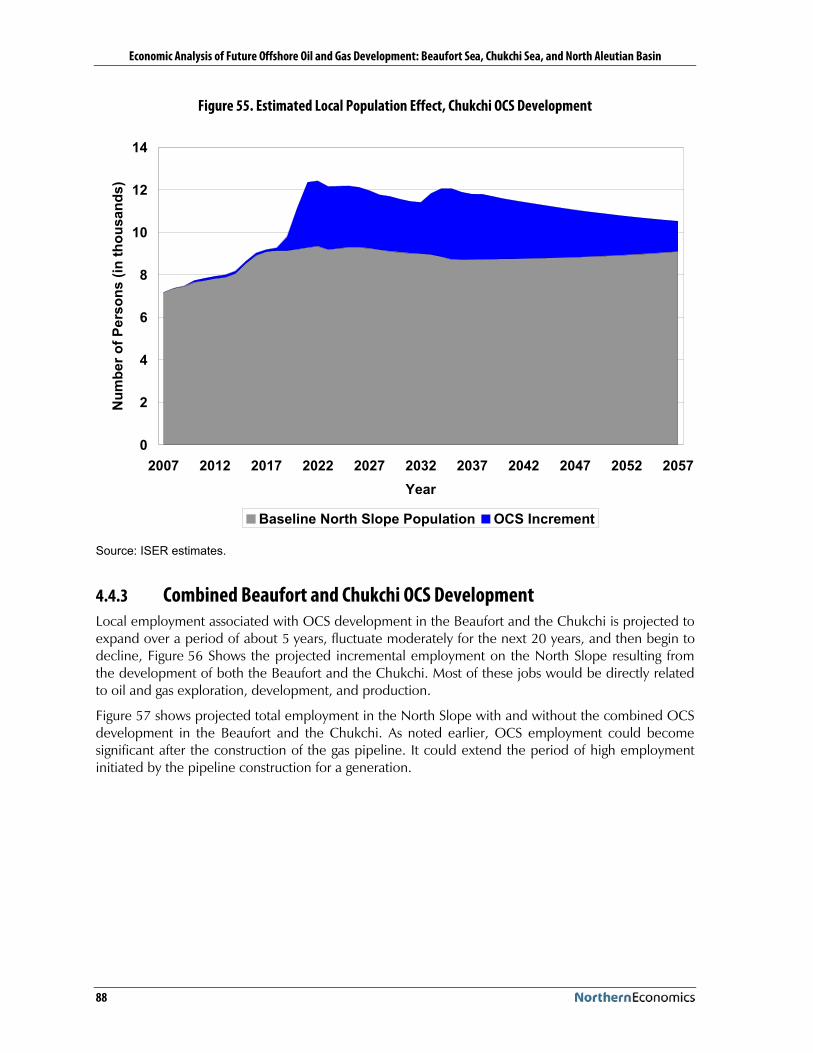
Economic Analysis of Future Offshore Oil and Gas Development: Beaufort Sea, Chukchi Sea, and North Aleutian Basin
88
Figure 55. Estimated Local Population Effect, Chukchi OCS Development
0
2
4
6
8
10
12
14
2007 2012 2017 2022 2027 2032 2037 2042 2047 2052 2057Year
Num
ber o
f Per
sons
(in
thou
sand
s)
Baseline North Slope Population OCS Increment
Source: ISER estimates.
4.4.3 Combined Beaufort and Chukchi OCS Development Local employment associated with OCS development in the Beaufort and the Chukchi is projected to expand over a period of about 5 years, fluctuate moderately for the next 20 years, and then begin to decline, Figure 56 Shows the projected incremental employment on the North Slope resulting from the development of both the Beaufort and the Chukchi. Most of these jobs would be directly related to oil and gas exploration, development, and production.
Figure 57 shows projected total employment in the North Slope with and without the combined OCS development in the Beaufort and the Chukchi. As noted earlier, OCS employment could become significant after the construction of the gas pipeline. It could extend the period of high employment initiated by the pipeline construction for a generation.

Economic Analysis of Future Offshore Oil and Gas Development: Beaufort Sea, Chukchi Sea, and North Aleutian Basin
89
Figure 56. Estimated Incremental Employment on the North Slope with Beaufort and Chukchi OCS Development
0
1
2
3
4
5
6
7
8
9
10
2007 2012 2017 2022 2027 2032 2037 2042 2047 2052 2057Year
Empl
oym
ent (
in th
ousa
nds)
Direct State/Local Gov't Infrastructure/Support
Source: Northern Economics, Inc. and ISER estimates.

Economic Analysis of Future Offshore Oil and Gas Development: Beaufort Sea, Chukchi Sea, and North Aleutian Basin
90
Figure 57. Estimated Total Employment on the North Slope with and without Beaufort and Chukchi OCS Development
0
5
10
15
20
25
2007 2012 2017 2022 2027 2032 2037 2042 2047 2052 2057Year
Empl
oym
ent (
in th
ousa
nds)
Baseline North Slope Employment OCS Increment
Source: ISER estimates.
The effect of the new employment opportunities provided by OCS development on the population of the region depends on the share of new jobs taken by residents, including new migrants into the region. Consistent with the historical trend, it is assumed that only a small share of the direct jobs are taken by local residents with the majority going to residents of urban Alaska and non-resident commuters from outside the state. However, all the government, infrastructure, and support jobs are taken by local residents.
The result is a projection of North Slope Borough population as shown in Figure 58. Population growth is rapid during the first years of OCS activity. After that, total population is relatively stable with a slow downward trend as the impact of OCS moderates.

Economic Analysis of Future Offshore Oil and Gas Development: Beaufort Sea, Chukchi Sea, and North Aleutian Basin
91
Figure 58. Estimated Local Population Effect, Combined Beaufort and Chukchi OCS Development
0
2
4
6
8
10
12
14
16
2007 2012 2017 2022 2027 2032 2037 2042 2047 2052 2057Year
Num
ber o
f Per
sons
(in
thou
sand
s)
Baseline North Slope Population OCS Increment
Source: ISER estimates.
4.4.4 North Aleutian OCS In the absence of OCS development, employment in the North Aleutian region (defined here as the Aleutians East, Bristol Bay, and Lake and Peninsula Boroughs as well as the Aleutians West and Dillingham Census Areas) is projected to grow rapidly in the coming years due to the development of the proposed Pebble Mine in the Lake and Peninsula Borough (Figure 59). This will increase the number of direct jobs, currently dominated by seafood harvesting and processing. Infrastructure and support jobs become a larger share of the total over time.
This pattern represents only one possible future scenario for the North Aleutian region. In particular this pattern of government and support employment assumes that the resident population will remain at least at the current level. However, in recent years out migration from rural Alaska has increased. A continuation of that trend could result in both a smaller population and a smaller number of jobs than projected in this study.

Economic Analysis of Future Offshore Oil and Gas Development: Beaufort Sea, Chukchi Sea, and North Aleutian Basin
92
Figure 59. Estimated Employment in the North Aleutian Region without OCS Development
0
5
10
15
20
25
2007 2012 2017 2022 2027 2032 2037 2042 2047 2052 2057Year
Empl
oym
ent (
in th
ousa
nds)
Direct State/Local Gov't Infrastructure/Support
Source: Northern Economics, Inc. and ISER estimates.
The local employment associated with OCS development could expand rapidly, stabilize for a period of 20 years, and then rapidly fall off (Figure 60). Most of the jobs would be directly related to oil and gas exploration, development, and production.

Economic Analysis of Future Offshore Oil and Gas Development: Beaufort Sea, Chukchi Sea, and North Aleutian Basin
93
Figure 60. Estimated Incremental Employment in the North Aleutian Region with North Aleutian Basin OCS Development
0.0
0.5
1.0
1.5
2.0
2.5
3.0
3.5
2007 2012 2017 2022 2027 2032 2037 2042 2047 2052 2057Year
Empl
oym
ent (
in th
ousa
nds)
Direct State/Local Gov't Infrastructure/Support
Source: Northern Economics, Inc. and ISER estimates.
The OCS employment could become significant to the region after the development of the Pebble Mine (Figure 61).

Economic Analysis of Future Offshore Oil and Gas Development: Beaufort Sea, Chukchi Sea, and North Aleutian Basin
94
Figure 61. Estimated Total Employment in the North Aleutian Region with and without North Aleutian OCS Development
0
5
10
15
20
25
2007 2012 2017 2022 2027 2032 2037 2042 2047 2052 2057Year
Empl
oym
ent (
in th
ousa
nds)
Baseline Aleutians Region Employment OCS Increment
Source: ISER estimates.
The effect of the new employment opportunities provided by OCS development on the population of the region depends on the share of new jobs taken by residents, including new migrants into the region. Consistent with the historical trend, it is assumed that only a small share of the direct jobs are taken by local residents with the majority going to residents of urban Alaska and non-resident commuters from outside the state. However, all the government, infrastructure, and support jobs are taken by local residents.
The result is a projection of North Aleutian regional population as shown in Figure 62. Population growth is rapid during the first years of OCS activity. After that, total population is relatively stable.

Economic Analysis of Future Offshore Oil and Gas Development: Beaufort Sea, Chukchi Sea, and North Aleutian Basin
95
Figure 62. Estimated Local Population Effect, North Aleutian Basin OCS Development
0
2
4
6
8
10
12
14
16
18
20
2007 2012 2017 2022 2027 2032 2037 2042 2047 2052 2057Year
Num
ber o
f Per
sons
(in
thou
sand
s)
Baseline Aleutians Region Population OCS Increment
Source: ISER estimates.
4.5 Potential Revenue Effects The analysis of potential revenue effects of future OCS development is focused on projected revenues to the state and local governments. Total state and local government take from direct and indirect petroleum revenues, as well as population-related revenues were projected.
This section is organized into the following sub-sections: 1) Revenue Parameters—this section discusses the various sources of government revenues and the assumptions used in projecting the potential revenue effects from each source; and 2) Projected Direct Petroleum Revenues—this section discusses the estimated direct petroleum revenues that could accrue to the State of Alaska and each of the directly impacted local governments from shared lease payments (if any), property taxes, and state corporate income taxes.
The next subsection, 4.6 Potential Fiscal Effects, addresses the fiscal effects to the State and local governments. Section 4.6.1 combines direct and indirect revenues projected to accrue to the State of Alaska and compares these to the projected expenditures that could be required to support the increase in statewide population resulting from OCS development, including incremental state expenditures to manage OCS-related programs. The fiscal effects on directly impacted local governments are discussed separately from the state fiscal effects, in Section 4.6.2.

Economic Analysis of Future Offshore Oil and Gas Development: Beaufort Sea, Chukchi Sea, and North Aleutian Basin
96
4.5.1 Revenue Parameters The parameters that are defined and described in this section include: 1) direct petroleum revenue sources; 2) population-related revenue sources; and 3) indirect revenue sources.
4.5.1.1 Direct Petroleum Revenue Parameters There are 3 major sources of direct petroleum revenues associated with OCS oil and gas activities: 1) lease revenues, 2) property taxes associated with new onshore infrastructure, and 3) state corporate income taxes. The definitions and modeling assumptions are discussed below.
Lease Revenues OCS lease revenues are comprised of three payment streams: 1) bonus bids, 2) rental payments, and 3) royalty payments.
Bonus bids Bonus bids are cash payments paid to the federal government in exchange for the right to explore and develop the petroleum reserves in OCS areas. Companies/explorers participate in a sealed bid auction to lease tracts of land during scheduled area-wide lease sales.
Bonus bids are generated at the time the area-wide lease sales occur. The model estimates bonus bids based on historical patterns. Typically, succeeding lease sales generate fewer bids because the good prospects have been previously picked over. In the Chukchi therefore, it is expected that the next lease sale will generate significantly less bonus bids than the 2008 lease sale. In the North Aleutian basin however, interest in the area is expected to be high because of higher petroleum prices and more recent attractiveness of gas resources compared to the last lease sale held in the area, where oil was the primary target. In 1988, industry high bids in the North Aleutian Basin totaled $95 million on 23 tracts (these covered the biggest prospects).
Future revenues from bonus bids are expected as follows: 1) in the Beaufort, bonus bids are scheduled to be received in 2009 and 2011; 2) in the North Aleutian, bonus bids are expected to be generated in 2011; and 3) in the Chukchi, bonus bids will be generated in 2010 and 2012. The results of the recent Chukchi lease sales that generated $2.66 billion in bonus bids have been incorporated into the model.
Rental payments A rental payment is established in the lease agreement and made to the lessor (MMS) every year; there is no royalty payment from production. The MMS does not place a lease back on annual rental status once production has begun, even though production has stopped and the lease is still in its primary term. In such cases, the lessee pays minimum royalty, which for MMS is calculated at the same rate as the rental. Rental rates vary per year and are usually specified in the Final Notice of Sale. In the most recent Chukchi lease sale for example, the rental rates established are as described in Table 25.
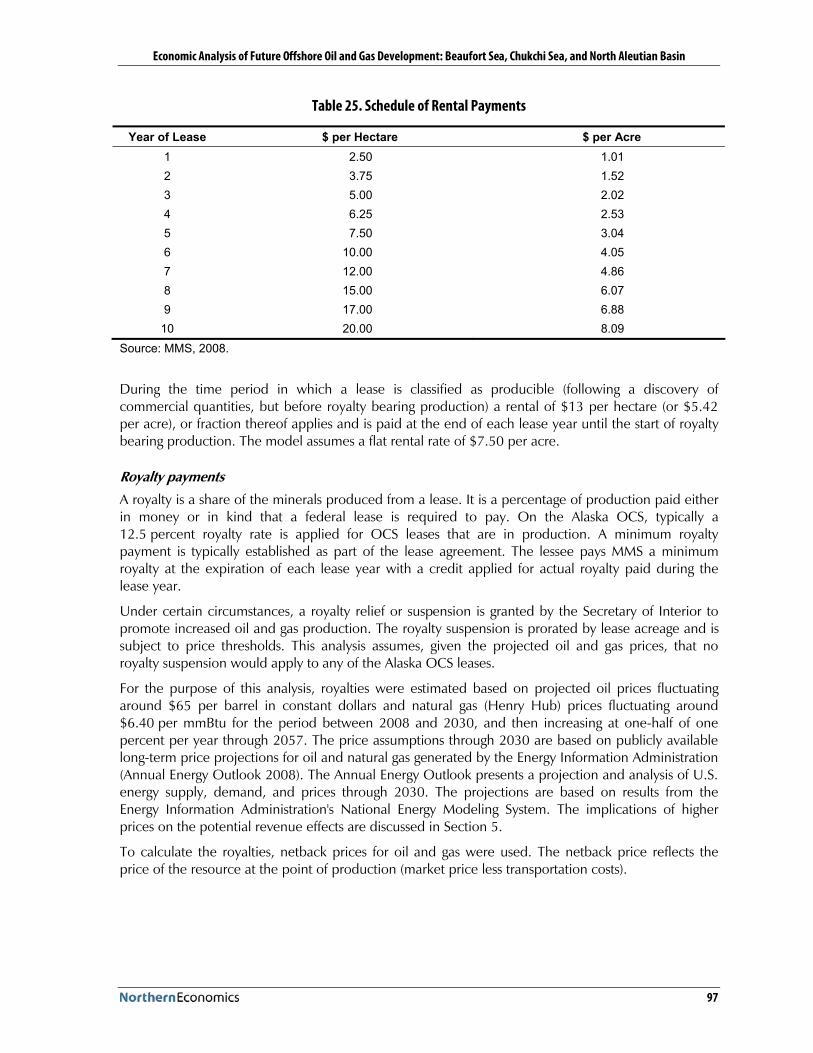
Economic Analysis of Future Offshore Oil and Gas Development: Beaufort Sea, Chukchi Sea, and North Aleutian Basin
97
Table 25. Schedule of Rental Payments
Year of Lease $ per Hectare $ per Acre 1 2.50 1.01 2 3.75 1.52 3 5.00 2.02 4 6.25 2.53 5 7.50 3.04 6 10.00 4.05 7 12.00 4.86 8 15.00 6.07 9 17.00 6.88
10 20.00 8.09 Source: MMS, 2008.
During the time period in which a lease is classified as producible (following a discovery of commercial quantities, but before royalty bearing production) a rental of $13 per hectare (or $5.42 per acre), or fraction thereof applies and is paid at the end of each lease year until the start of royalty bearing production. The model assumes a flat rental rate of $7.50 per acre.
Royalty payments A royalty is a share of the minerals produced from a lease. It is a percentage of production paid either in money or in kind that a federal lease is required to pay. On the Alaska OCS, typically a 12.5 percent royalty rate is applied for OCS leases that are in production. A minimum royalty payment is typically established as part of the lease agreement. The lessee pays MMS a minimum royalty at the expiration of each lease year with a credit applied for actual royalty paid during the lease year.
Under certain circumstances, a royalty relief or suspension is granted by the Secretary of Interior to promote increased oil and gas production. The royalty suspension is prorated by lease acreage and is subject to price thresholds. This analysis assumes, given the projected oil and gas prices, that no royalty suspension would apply to any of the Alaska OCS leases.
For the purpose of this analysis, royalties were estimated based on projected oil prices fluctuating around $65 per barrel in constant dollars and natural gas (Henry Hub) prices fluctuating around $6.40 per mmBtu for the period between 2008 and 2030, and then increasing at one-half of one percent per year through 2057. The price assumptions through 2030 are based on publicly available long-term price projections for oil and natural gas generated by the Energy Information Administration (Annual Energy Outlook 2008). The Annual Energy Outlook presents a projection and analysis of U.S. energy supply, demand, and prices through 2030. The projections are based on results from the Energy Information Administration's National Energy Modeling System. The implications of higher prices on the potential revenue effects are discussed in Section 5.
To calculate the royalties, netback prices for oil and gas were used. The netback price reflects the price of the resource at the point of production (market price less transportation costs).

Economic Analysis of Future Offshore Oil and Gas Development: Beaufort Sea, Chukchi Sea, and North Aleutian Basin
98
Current OCS Lease Revenue Sharing Arrangement Revenues from offshore federal leases are statutorily allocated among the coast states, the Land and Water Conservation Fund, the National Historic Preservation Fund, and the U.S. Treasury. Revenues received by the coastal states are also shared with the coastal political subdivisions (local governments) that are or will be affected by offshore oil and gas development.
The revenue estimates presented in this section reflect the revenue sharing arrangement that currently exists. It is anticipated that various stakeholders, particularly the state government, would initiate efforts to gain the same kind of revenue sharing arrangement as the arrangement in place in the Gulf of Mexico. The existing OCS revenue sharing arrangement is as follows:
The State of Alaska receives 27 percent of OCS lease revenues from leases that are in 8(g) zone. The 8(g) revenue stream is the result of a 1978 Outer Continental Shelf Lands Act (OCSLA) amendment that provides for a “fair and equitable” sharing of revenues from 8(g) common pool lands. These lands are defined in the amendments as submerged acreage lying outside the 3-nautical mile state-federal demarcation line, typically extending to a total of 6 nautical miles offshore. The states’ share of the revenue (27 percent) was established by the OCSLA amendments of 1985 (P.L. 99-272) and is paid directly to the states.
In this study, 8(g) revenues are projected to be generated only from leases in the Beaufort. This analysis assumes that 0.2 percent of the lease acreage in the Beaufort Basin fall within the 8(g) zone; and the rest of the lease acreage lie further out in federal offshore areas. This assumption is based on information on existing 8(g) tracts in the Beaufort. No leases are assumed to be in the 8(g) zone in the Chukchi and North Aleutian OCS.
In addition to the 8(g) revenue stream, Alaska also currently receives funds from the Coastal Impact Assessment Program (CIAP). CIAP was established under the Energy Policy Act of 2005 (P.L. 109-58). Under this program, the Secretary of the Interior distributes $250 million per year during FY2007 to FY 2010 to producing states and political subdivisions according to specified allocations. Alaska is one of six oil and gas producing states that are eligible to receive CIAP funds14. Alaska received $2.425 million in the FY2007 and FY2008 allocations (this represents only one percent of the total amount shared among the six states). However, due to the highly successful Chukchi lease sale held in early February 2008 that generated $2.7 billion in federal OCS revenues, the MMS estimates that Alaska’s CIAP allocation15 would increase to somewhere between $29 million and $41.2 million for FY2009 and FY2010 (Alaska Department of Natural Resources Division of Coastal and Ocean Management, 2008).
A portion of the State’s share of CIAP funds are shared with local governments (or coastal political subdivisions [CPS]) according to a 3-part formula as follows:
! 25 percent is allocated to the CPSs based on the proportion of population that the CPS bears to the total population of all the CPSs in the state.
! 25 percent is allocated to the CPSs based on the ratio of the coastline length of the CPS to the total coastline length of all the CPSs in the state.
14 Besides Alaska, other states receiving CIAP funds include: California, Alabama, Louisiana, Mississippi, and Texas.
15 The amounts disbursed to each producing state in each of the fiscal years 2007 thru 2010 are based on the ratio of the amount of qualified OCS revenues generated off the coastline of the producing state bears to the amount of qualified OCS revenues generated off the coastline of all producing states (Coastal Impact Assessment Program, Technical Documentation of the Methodology for the Allocation Formulas; OCS Report MMS 2007-065).

Economic Analysis of Future Offshore Oil and Gas Development: Beaufort Sea, Chukchi Sea, and North Aleutian Basin
99
! 50 percent is allocated to the CPSs in amounts that are inversely proportional to the respective distance between the geographic center of each leased tract and the closest point on the perimeter of each CPS to the geographic center of each leased tract.
For FY 2007 and FY 2008, the allocations to the different CPSs in Alaska were determined as shown in Table 26.
Table 26. Coastal Impact Assessment Program (CIAP) Fund Alaska Allocations for FY2007 and FY2008
Year Alaska Coastal Political Subdivisions FY 2007 $1,576,250 $848,750 FY 2008 $1,576,250 $848,750 Alaska Coastal Political Subdivisions (CPSs) Allocation (%) Total Allocation ($) Anchorage 16.23 137,752 Bristol Bay Borough 0.08 679 Kenai Peninsula 7.00 59,413 Kodiak Island 8.62 73,162 Lake and Peninsula 4.07 34,544 Matanuska-Susitna Borough 3.70 31,404 North Slope Borough 32.57 276,438 Northwest Arctic Borough 27.73 235,358 Total 100.00 848,750 Source: MMS, 2008
To receive CIAP funds, the producing states are asked to submit plans for approval by the Secretary of Interior regarding the use of funds. These funds are designated for the restoration of coastal areas, mitigation of damage to natural resources, implementation of federally approved conservation management plans, and for infrastructure projects.
CIAP Funds are only available thru FY2010. Unless another law is passed to continue or replace CIAP, the Alaska take of future OCS lease revenues would be limited to the 27 percent of 8(g) lease revenues. As noted earlier, this analysis assumes 8(g) leases (0.2 percent of total leased acreage) only in the Beaufort; and none in the Chukchi and North Aleutian OCS areas.
Property Taxes Property taxes are another source of revenue from OCS oil and gas development. New onshore facilities built to support oil and gas development will be subject to property taxes. A local tax is levied on the state’s assessed value16 for oil and gas property within a city or borough, and is subject to the local property tax limitations established in AS 29.45.080 and AS 29.45.100. The state’s mill rate is effectively 20 mills minus the local rate, which in the case of the North Slope Borough, is 18.5 mills.
For this study, the Beaufort OCS development scenario assumes that approximately 35 miles of onshore pipelines, one for oil and one for gas, will be built to connect to TAPS and the proposed Alaska natural gas pipeline. In addition, a marine terminal, production facility, and support base are
16 Oil and gas property values are assessed by the State of Alaska.

Economic Analysis of Future Offshore Oil and Gas Development: Beaufort Sea, Chukchi Sea, and North Aleutian Basin
100
assumed to be built onshore to support the offshore activities. These onshore facilities are estimated to be valued at $2.66 billion.
Similarly, the development scenario for the Chukchi assumes building the following onshore facilities: 1) a marine terminal; 2) a support base; 3) a production facility; and 4) approximately 500 miles of onshore oil and gas pipelines (each could be a 250-mile pipeline). These new onshore facilities are estimated to be worth $6.1 billion.
For the purpose of this analysis, it is assumed that the marine terminal/support base could be located anywhere on the coast between Wainwright and Point Hope. Similarly, the oil and gas pipelines are assumed to traverse through the NPR-A from west to east connecting to TAPS and the proposed Alaska North Slope (ANS) gasline in the Prudhoe Bay area; however, it is also possible that the oil and gas pipelines could be oriented differently and connect to TAPS and the ANS gasline somewhere further south of the Prudhoe Bay unit.
For the North Aleutian scenario, new onshore infrastructure could include: 1) a shorebase to support exploration and production activities; 2) onshore pipelines for oil and gas; 3) an LNG facility and terminal; 4) another marine terminal for oil; and 5) an onshore production facility. These onshore facilities are estimated to be valued at $3.87 billion. The analysis assumes that the Aleutians East Borough would levy local property taxes similar to the tax rate in the North Slope Borough; otherwise the state gets the full 20 mills.
State Corporate Income Taxes The state also obtains revenue from the special state corporate income tax on petroleum activity. The tax is calculated as 9.4 percent of the Alaska share of worldwide income for each corporation. The Alaska income is calculated using a “modified apportionment formula,” which averages the Alaska share of corporate worldwide property, sales, and extraction and applies that formula to calculate the Alaska share of worldwide income. The state apportions the tax base for all other types of corporations using a formula that substitutes payroll for extraction. Consequently, the Alaska tax base for the special corporate income tax on petroleum depends not only on activity and profits within Alaska, but also on activity and profits in other locations, making it difficult to forecast. This is reflected in the historical variability of tax revenues which have averaged 2.6 percent of the value of production at the wellhead, but ranged from a low of 0.3 percent to a high of 5.1 percent. Annual revenues have ranged from $18 million to $860 million, or from $.03 to $2.32 per barrel of oil.
For this analysis, the estimate of direct corporate income tax revenues to the state from OCS activity is based on the wellhead value of OCS production and a modified apportionment formula that reflects the special OCS conditions. First, it excludes the sales and extraction components of the formula, on the assumption that all OCS sales and extraction would occur outside the jurisdiction of Alaska (in federal waters). Second, it includes only that share of the property associated with OCS activities which is onshore. Finally, it assumes that the OCS operation of the companies would have “stand alone” status—that is, the characteristics of their other operations, either onshore Alaska or elsewhere in the world, would not impact their Alaska OCS tax liability.
The result is a very small allocation of OCS income to the state petroleum income tax base. The historical 2.6 percent ratio of revenues to the value of production is adjusted downward to 0.13 percent to estimate future corporate petroleum revenues to the state from OCS production. Although the onshore share of petroleum property is likely to differ among the OCS basins, the analysis uses 0.13 percent for each basin because of the inherent uncertainty surrounding this estimator.

Economic Analysis of Future Offshore Oil and Gas Development: Beaufort Sea, Chukchi Sea, and North Aleutian Basin
101
4.5.1.2 Population-Related Revenue Parameters State sales and use tax revenues (motor fuels, insurance, premiums, tobacco products, etc.), corporate income tax revenues (excluding petroleum), and motor vehicle license fees all will increase due to the economic activity and population engendered from OCS development.
The state does not currently have either a general sales tax or a personal income tax. However, the non OCS projection of future state population and public sector demands compared to revenues suggests that a number of adjustments to the state fiscal structure will be necessary in future years to maintain adequate public services. Although it is impossible to anticipate the exact nature of these adjustments, or when they may be put into place, the two options available to the state are, in addition to reducing expenditures, institution of a broad-based tax and use of a portion of the earnings of the Permanent Fund. (Additional taxes on other resource industries could generate only very modest revenues.) It is anticipated that both will be required in the non OCS case, in spite of commercialization of North Slope gas. Use of permanent fund earnings to fund state programs begins in 2023. A personal income tax, similar to the tax that was eliminated in 1980, will be phased in between 2022 and 2026. This personal income tax will be the largest source of population-related revenues from OCS development because the tax base will be the entire payroll generated by the OCS development. It is assumed that the alternative of a statewide sales tax would generate an equivalent amount of revenue.
It is possible that neither a personal income tax nor a statewide sales tax would be necessary or instituted in the future. If that were the case, it would represent a conscious decision of the state not to take advantage of its largest untapped tax base, and rather to finance state government expenditures by other means. However, the estimated revenues from the personal income tax in response to OCS development do represent one element of the capacity of the development to pay for public services, and for this reason, it would be incorrect not to include it as a revenue source.
4.5.1.3 Indirect Petroleum Revenue Parameters OCS development is expected to generate additional state petroleum-related revenues (or indirect revenues) from spillover effects on other oil and gas activities on the North Slope. Although there is considerable uncertainty about how large these additional revenues might be, it is important to identify the sources of these revenues and to develop a conservative idea of their potential magnitude. This study identifies four sources of indirect revenues that arise from the lower cost of petroleum production and transportation generated by OCS development:
! TAPS—Fuller Pipeline Enhanced Value of North Slope Production
! TAPS—Fuller Pipeline Additional North Slope Production
! Gas Pipeline Tariff Reduction Effect
! Incremental Production due to OCS Infrastructure
TAPS: Fuller Pipeline Enhanced Value of North Slope Production OCS oil from the Beaufort Sea and the Chukchi Sea may be transported to market through the existing TAPS oil pipeline from the North Slope to Valdez. If OCS oil is transported through TAPS, the higher volume of throughput would reduce the TAPS tariff and extend the life of TAPS.

Economic Analysis of Future Offshore Oil and Gas Development: Beaufort Sea, Chukchi Sea, and North Aleutian Basin
102
The TAPS pipeline is currently operating at about one-third of its capacity of 2 million barrels per day, and will be carrying less oil in the future as North Slope production continues to decline. The pipeline tariff, based on the cost of its operation, is sensitive to the volume of oil and tends to increase as the volume falls. If OCS oil were added to the TAPS pipeline it would increase the throughput, and this would reduce the tariff on all the oil flowing through the line. Because the price of oil at the wellhead is a “netback” price based on the market price net of transportation costs, a lower pipeline tariff would increase the wellhead value of North Slope oil. Since the royalty on oil from state lands and the production tax are based on the wellhead value of the oil, a lower tariff would increase the revenues to the state from the royalties and the production tax (the analysis does not incorporate the possible effect on the corporate income tax).
The lower tariff translates into in an increase in wellhead value of a barrel of oil on the North Slope. The study assumes that all non-OCS production is from state lands and the combined revenue yield as a share of the increase in the value of production is 40 percent. The yield is high because the increase in the value of production would all be profit.
Furthermore, in the absence of OCS oil throughput, TAPS is anticipated to shut down when it reaches the minimum technically viable level of daily throughput—estimated at 200,000 barrels per day—which could be reached in 2046. Because this shut down would leave oil worth billions stranded on the North Slope, some alternative to move the oil to market would be deployed. It is assumed that a marine transport system could be used to move the remaining oil to market at an estimated cost of $15 per barrel ($2007).To the extent that OCS volumes extend the date when TAPS shuts down, the state and onshore producers would benefit from the lower TAPS tariff as compared to marine transport, with resulting higher wellhead value, and higher revenues to the state from royalties and the production tax.
TAPS-Fuller Pipeline Additional North Slope Production A higher wellhead value resulting from the higher TAPS pipeline throughput because of OCS oil is also anticipated to have a stimulating effect on exploration and development of North Slope reserves. The average increase in wellhead value due to higher TAPS throughput is estimated to be six percent. The effect could be similar to an increase in industry activity due to higher oil prices or a reduction in taxes. Based on studies of the sensitivity of North Slope production to the price of oil, as well as observations that higher prices stimulate the development of satellite fields (smaller accumulations of oil that are adjacent to larger fields), it is estimated that this stimulating effect could result in an increase in oil production equal to 141 million barrels over the projection period. This could translate to an increase in state revenues of about $2 billion.
Gas Pipeline Tariff Reduction Effect Similar to the full TAPS tariff reduction effect, development of natural gas from OCS leases in the Beaufort and Chukchi Sea would result in higher gas pipeline throughput starting in 2029, when gas from the Beaufort OCS is assumed to come on line. The increase in the gas pipeline throughput is expected to reduce the tariff only up to a certain point where the capacity of the pipeline could be expanded through additional compression. Beyond this point, the tariff would go up due to the expensive looping system that would have to be constructed to further expand the pipeline to accommodate gas volumes higher than 6.5 billion cubic feet per day. The tariff structure of the gas pipeline has not been determined at this point. However, for the purpose of this study, the potential full gas pipeline tariff reduction effect that could result with OCS gas development is estimated using

Economic Analysis of Future Offshore Oil and Gas Development: Beaufort Sea, Chukchi Sea, and North Aleutian Basin
103
the rolled-in rate pipeline expansion analysis proposed by TransCanada as provided in their Alaska Gasline Inducement Act (AGIA) application (AGIA website, State of Alaska). The TransCanada analysis showed the estimated rolled-in rate tariff in dollars per million Btu’s given different step increases in throughput levels from 4.5 to 7.2 BCF per day. For this analysis, it is assumed that the pipeline throughput is expanded by 600 million cubic feet per day in 2029 (from 4.5 to 5.1 BCF per day) due to the Beaufort OCS gas; resulting in a $.07 per MCF reduction in tariff. An additional expansion is further assumed as a result of the Chukchi OCS gas; the expansion could increase the gas pipeline’s daily throughput to 5.9 BCF per day sometime after 2040. The reduction in tariff given this volume of expansion is estimated to be $0.16 per million cubic feet. Since expansion volumes could come from other onshore sources as well, OCS gas is assumed in this analysis to contribute only 1 BCF per day of the total additional throughput beyond the 4.5 BCF per day base case.
This reduction in tariff is projected to generate additional royalties and production tax payments to the State of Alaska because these payments are calculated based on the wellhead value of the resource (market price less transportation cost). The estimated cumulative state benefits resulting from the full gas pipeline tariff reduction effect is about $1.2 billion.
Incremental Production due to OCS Infrastructure OCS development will increase the amount and geographic reach of petroleum infrastructure on the North Slope. The presence of additional petroleum infrastructure and its geographic distribution suggests that there could be opportunities for the development of otherwise marginal fields if they are in close geographic proximity to OCS infrastructure or that could share OCS facilities. An expanded support industry due to OCS developments could also be the source of cost savings that could make some marginal fields economically attractive. The potential production and revenues from these latter effects could be very large, but very difficult to quantify. However, to demonstrate the potential magnitude of these effects on state revenues, it is assumed that cumulative North Slope production is increased by two percent—87 million barrels—as a result of these effects. This could generate $1.2 billion (2007$) in additional state revenues from production and corporate income taxes and royalty payments to the state.
4.5.2 Potential Direct Petroleum Revenues This section presents the estimated revenues that could accrue to the state and local governments (Boroughs) from future oil and gas development in the three Alaska OCS areas. Under the Beaufort OCS development scenario, lease revenues from 8(g) common pool lands and revenues from property and corporate income taxes will accrue to the state and to the North Slope Borough. Under the Chukchi and the North Aleutian OCS development scenario, there will be no shared lease payments accruing to the state and local governments.
The potential cumulative direct petroleum revenues to Alaska from all three OCS areas could be $5.8 billion (2007$) with most revenues going to directly impacted local communities from property taxes on onshore petroleum facilities. Table 27 summarizes the potential cumulative revenues that could accrue to the different government entities from 2008 to 2057.

Economic Analysis of Future Offshore Oil and Gas Development: Beaufort Sea, Chukchi Sea, and North Aleutian Basin
104
Table 27. Potential Cumulative Direct Petroleum Revenues Accruing to the State of Alaska and Local Governments, 2008 to 2057(in Billions of 2007$)
Entity/Source of Revenue Amount State of Alaska 1.4
Property Tax 0.4 Corporate Income Tax 1.0 Shared Lease Payments --
Directly Impacted Local Governments 4.5 Property Tax 4.5 Shared Lease Payments --
Other Local Governments Shared Lease Payments --
Total Alaska 5.8 Source: Northern Economics, Inc. and ISER estimates. Notes: 1) The sum of the amounts may not equal total due to rounding. 2) Other local governments refer to coastal political subdivisions, other than the directly impacted governments
(assumed to be the North Slope Borough and Aleutians East Borough), that are by statute eligible to receive Coastal Impact Assistance Program funds.
Potential direct revenue effects resulting from each OCS development are discussed in separate sub-sections below.
4.5.2.1 Potential Revenues from Beaufort OCS Development The potential cumulative direct petroleum revenues resulting from the Beaufort OCS development are presented in Table 28.
The State of Alaska is projected to receive about $400 million in cumulative property tax revenues, corporate income tax revenues, and shared lease payments (primarily from 8(g) leases). As noted earlier, for this study, the Beaufort OCS is the only area assumed to have leases in 8(g) zone.
Given the assumed onshore infrastructure expected to be developed to support oil and gas development in the Beaufort OCS, the North Slope Borough could receive $1.1 billion in local property taxes, cumulative over the years 2008 to 2057.

Economic Analysis of Future Offshore Oil and Gas Development: Beaufort Sea, Chukchi Sea, and North Aleutian Basin
105
Table 28. Potential Cumulative Direct Petroleum Revenues, Beaufort OCS Development, 2008 to 2057 (in Billions of 2007$)
Government Entity/Revenue Source Amount
State Revenues 0.4 Property Tax 0.1 Corporate Income Tax 0.3 Shared Lease Payments
General Fund -- Permanent Fund --
North Slope Borough 1.1 Property Tax 1.0 Shared Lease Payments --
Total Government Take 1.5 Source: Northern Economics, Inc. and ISER estimates. Note: The sum of the amounts may not equal total due to rounding.
4.5.2.2 Potential Revenues from Chukchi OCS Development Alaska is not anticipated to receive any share of the lease revenues from the Chukchi leases. Nonetheless, total cumulative direct petroleum revenues accruing to the State and the North Slope Borough are projected to amount to over $3 billion (See Table 29).
Table 29. Potential Cumulative Direct Petroleum Revenues, Chukchi OCS Development, 2008 to 2057 (in Billions of 2007$)
Government Entity/Revenue Source Amount State Revenues 0.8 Property Tax 0.2 Corporate Income Tax 0.6 Shared Lease Payments --
North Slope Borough 2.4 Property Tax 2.4 Shared Lease Payments --
Total Government Take 3.1 Source: Northern Economics, Inc. and ISER estimates. Note: The sum of the amounts may not equal total due to rounding.
4.5.2.3 Combined Potential Revenues from Beaufort and Chukchi OCS Development The combined revenue effects of the Beaufort and the Chukchi OCS development indicate the magnitude of benefits that could be generated in the North Slope region. The North Slope Borough is projected to generate total cumulative property tax revenues of about $3.5 billion from taxable onshore facilities that are assumed to be required to support the development of oil and gas resources in the Beaufort and the Chukchi OCS. Total cumulative government take resulting from the combined Beaufort and Chukchi OCS development is estimated to be $4.6 billion (see Table 30).

Economic Analysis of Future Offshore Oil and Gas Development: Beaufort Sea, Chukchi Sea, and North Aleutian Basin
106
Table 30. Potential Cumulative Direct Petroleum Revenues, Combined Beaufort and Chukchi OCS Development, 2008 to 2057 (in Billions of 2007$)
Government Entity/Revenue Source Amount State Revenues 1.2 Property Tax 0.3 Corporate Income Tax 0.9 Shared Lease Payments
General Fund -- Permanent Fund --
North Slope Borough 3.5 Property Tax 3.5 Shared Lease Payments --
Total AK Government Take 4.6 Source: Northern Economics, Inc. and ISER estimates. Note: The sum of the amounts may not equal total due to rounding.
4.5.2.4 Potential Revenues from North Aleutian Basin OCS Development The potential cumulative direct petroleum revenues resulting from the North Aleutian Basin OCS development are presented in Table 31.
The State of Alaska is projected to receive about $200 million in cumulative property tax revenues, and corporate income tax revenues.
Given the assumed onshore infrastructure expected to be developed to support oil and gas development in the North Aleutian OCS, the regional government could receive $1 billion in local property taxes, cumulative through 2057.
Table 31. Potential Cumulative Direct Petroleum Revenues, North Aleutian OCS Development, 2008 to 2057 (in Billions of 2007$)
Government Entity/Revenue Source Amount State Revenues 0.2 Property Tax 0.1 Corporate Income Tax 0.1 Shared Lease Payments --
General Fund -- Permanent Fund --
Directly Impacted Communities 1.0 Property Tax 1.0 Shared Lease Payments --
Total Government Take 1.2 Source: Northern Economics, Inc. and ISER estimates. Note: The sum of the amounts may not equal total due to rounding.

Economic Analysis of Future Offshore Oil and Gas Development: Beaufort Sea, Chukchi Sea, and North Aleutian Basin
107
4.5.2.5 Potential Revenues for All OCS Activity Total Alaska government take from all OCS activity is projected to amount to $5.8 billion through 2057 (see Table 32).
Table 32. Potential Cumulative Direct Petroleum Revenues, All Three OCS Areas, 2008 to 2057 (in Billions of 2007$)
Government Entity/Revenue Source Amount
State Revenues 1.4
Property Tax 0.4
Corporate Income Tax 1.0
Shared Lease Payments General Fund -- Permanent Fund --
North Slope Borough 3.5 Property Tax 3.5 Shared Lease Payments --
Aleutians East Borough 1.0 Property Tax 1.0 Shared Lease Payments --
Total Government Take: 5.8 Source: Northern Economics, Inc. and ISER estimates. Note: The sum of the amounts may not equal total due to rounding.
4.5.3 Population-Related and Indirect Revenue Effects of OCS Development Table 33 summarizes the potential cumulative population-related revenue effects and the indirect revenue effects of OCS development. The effects for each OCS area are discussed in the next section as part of the fiscal effects discussion.
Table 33. Potential Cumulative Population-Related and Indirect Revenue Effects of OCS Development, 2008 to 2057 (in Billions of 2007$)
Source/Category Amount Population Related Revenues 3.9 Indirect Petroleum Revenues
TAPS- Full Pipeline Enhanced Value of North Slope Production 5.7 TAPS- Full Pipeline Additional North Slope Production 2.0 Gas Pipeline Tariff Reduction Effect 1.2 Incremental Production due to OCS Infrastructure 1.2
Total 14.0 Source: Northern Economics, Inc. and ISER estimates. Note: The sum of the amounts may not equal total due to rounding.
Economic Analysis of Future Offshore Oil and Gas Development: Beaufort Sea, Chukchi Sea, and North Aleutian Basin
108
4.6 Potential Fiscal Effects This section discusses the potential fiscal effects at the state level and at the local/regional level.
4.6.1 Potential State Fiscal Effects OCS development will generate state revenues in three ways. A share of state revenues will come directly from property and corporate income taxes on OCS activity as well as from the sharing of lease revenues with the federal government. The state will also receive revenues from the taxes and fees paid by the households of those working directly on OCS-related jobs as well as those working in other businesses providing goods and services to the petroleum industry and to Alaska households. Finally, because the development of the OCS will reduce the cost of business for the petroleum industry in the state and facilitate the development of additional oil and gas through the addition of new petroleum related infrastructure, state revenues from non-OCS petroleum activity will increase.
At the same time OCS development will place new demands on state government. These demands will come primarily from the population growth accompanying OCS development.
These state fiscal effects must be interpreted within the context of the overall fiscal future of the state. In the absence of OCS development, the population of the state is projected to increase, putting additional demands on the state budget. But at the same time petroleum revenues, the major source of funding for the budget, are projected to fall. New sources of revenues and spending restraint will be required to maintain state fiscal integrity. Within that context, OCS activity is projected to generate a positive state fiscal balance with revenue growth exceeding the spending necessary to meet the demands of the OCS induced population growth.
4.6.1.1 General Fund The state government provides a larger share of state and local public services in Alaska compared to most other states because of the limited fiscal capacity of Alaska local governments, and the general fund is the mechanism for funding most state programs. In the absence of OCS development, and given the MAP model assumptions as discussed in Section 2.2, state general fund revenues are projected to exceed state expenditures until 2015, after which time annual revenues fall below annual expenditures. Starting in 2015, the state begins to draw down accumulated balances in the general fund and constitutional budget reserve. Revenues from the development of a gas pipeline starting in 2020, the phasing in of a state personal income tax starting in 2022, reduction in the Permanent Fund dividend by half, and diversion of remainder of the earnings of the Permanent Fund to support general fund expenditures starting in 2023 largely offset declining oil revenues for a decade but eventually they are insufficient to forestall a downward trend in general fund revenues (Figure 63 shows general fund revenues). As a consequence, real per capita general fund spending trends slowly downward toward its historical level in the late 1990s.

Economic Analysis of Future Offshore Oil and Gas Development: Beaufort Sea, Chukchi Sea, and North Aleutian Basin
109
Figure 63. State General Fund Revenue, No OCS Case
$0
$1
$2
$3
$4
$5
$6
$7
$8
2007 2012 2017 2022 2027 2032 2037 2042 2047 2052 2057Year
Bill
ion
2007
$
Source: Northern Economics, Inc. and ISER estimates.
OCS development results in additional general fund revenues from the state property tax, the corporate income tax, and sharing of federal lease revenues including the 8(g) revenues. Additional general fund revenues are also generated by new workers and their families from various fees, excise taxes, and the personal income tax. General fund spending also increases to pay for the public services required by the new petroleum activity and population.
4.6.1.2 Permanent Fund The Permanent Fund balance grows over time from deposits from a portion of the state royalties from oil and gas production as well as annual appropriations for inflation proofing (see Figure 64).

Economic Analysis of Future Offshore Oil and Gas Development: Beaufort Sea, Chukchi Sea, and North Aleutian Basin
110
Figure 64. Permanent Fund Balance No OCS Case
$0
$10
$20
$30
$40
$50
$60
2007 2012 2017 2022 2027 2032 2037 2042 2047 2052 2057Year
Bill
ion
2007
$
Source: Northern Economics, Inc. and ISER estimates.
With OCS development, the Permanent Fund would, under current law, receive a share of any lease payments shared with the federal government. In the absence of a change in the sharing arrangements, the amount is projected to be trivial—25 percent of 8(g) revenues.
4.6.1.3 State Expenditures The growth in population associated with OCS development will increase the demand for state government services, particularly education (including the University), public safety, transportation, corrections, and public health. Although a precise estimate of these incremental public sector requirements is impossible to develop, it is important to indicate the likely demand that this additional population could place on public financial resources. Following a 1995 study by ISER entitled Marginal Oil Field Development: The Economic Impact, the incremental population was divided into four groups—infants, school-aged children, adults, and senior citizens (over time some adults drawn to the state for work could retire and remain in Alaska). The “per client” public service demand for each group was calculated based on the 2007 state budget.
The per capita state operating budget in 2007 was $4,935. However, many budget expenses target special needs of rural areas, provide a safety net for low income or otherwise disadvantaged individuals, or pay for programs not tied to population like resource management or the legislature. It is assumed that OCS-related population growth will not increase the state budget for these items; the per capita cost for the OCS-related population across the weighted average of new infants, school-aged children, adults, and senior citizens are calculated based on this assumption (see Table 34). The

Economic Analysis of Future Offshore Oil and Gas Development: Beaufort Sea, Chukchi Sea, and North Aleutian Basin
111
result is a per capita state budget cost estimate of $3,717—75 percent of the average across all budget items.
Table 34. Share of OCS Population and Per Capita Cost per Population Category
Population Category Share of OCS Population (%) Per Capita Cost ($) Infant 7.2 - School aged child 14.5 7,191 Adult 70.9 3,018 Senior Citizen 7.4 7,229 Weighted Average OCS Population 3,717 Source: ISER.
This estimate that 75 percent of the state general fund operating budget was sensitive to OCS related population growth was applied to the historical average per capita state general fund operating budget resulting in a per capita OCS population annual cost estimate of $3,510 (2007$). Figure 65 shows the historical trend in per capita spending until quite recently has been downward.
Figure 65. State Operations Spending Per Capita and Capital Spending Per Capita
$0
$5
$10
$15
$20
1975 1980 1985 1990 1995 2000 2005Year
Thou
sand
200
7 $
Per Capita Spending on Operations Per Capita Capital Spending
Source: Alaska Legislative Finance and ISER.
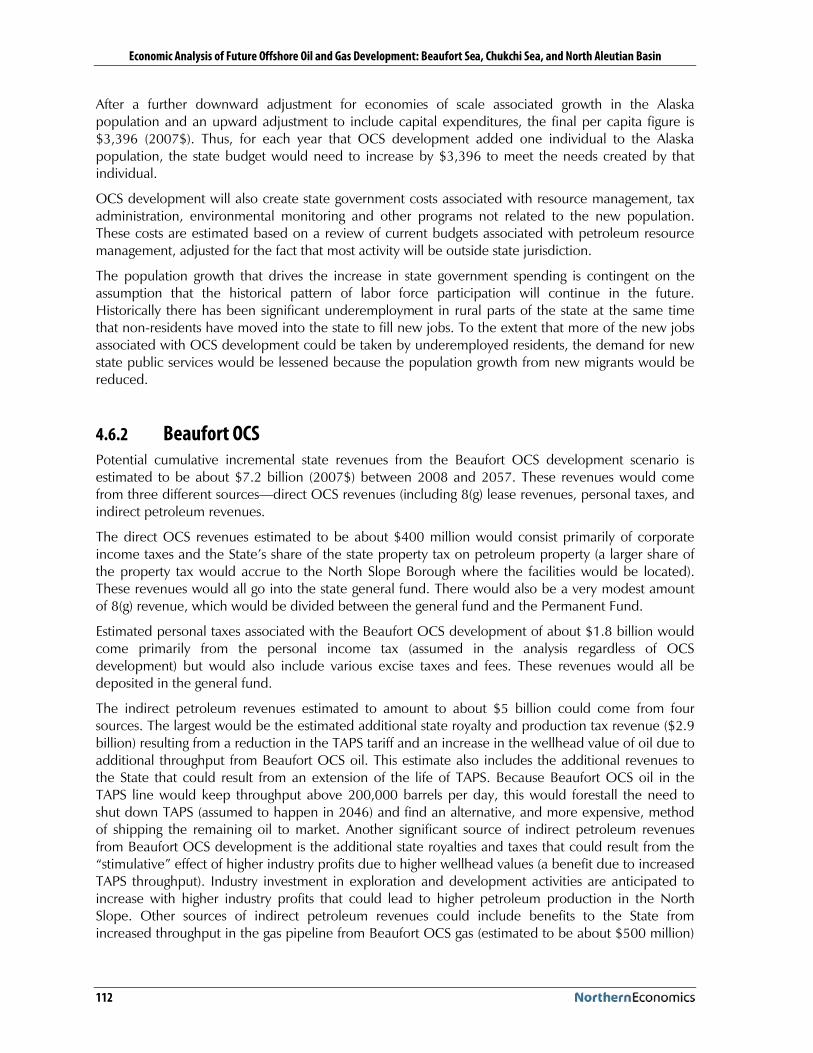
Economic Analysis of Future Offshore Oil and Gas Development: Beaufort Sea, Chukchi Sea, and North Aleutian Basin
112
After a further downward adjustment for economies of scale associated growth in the Alaska population and an upward adjustment to include capital expenditures, the final per capita figure is $3,396 (2007$). Thus, for each year that OCS development added one individual to the Alaska population, the state budget would need to increase by $3,396 to meet the needs created by that individual.
OCS development will also create state government costs associated with resource management, tax administration, environmental monitoring and other programs not related to the new population. These costs are estimated based on a review of current budgets associated with petroleum resource management, adjusted for the fact that most activity will be outside state jurisdiction.
The population growth that drives the increase in state government spending is contingent on the assumption that the historical pattern of labor force participation will continue in the future. Historically there has been significant underemployment in rural parts of the state at the same time that non-residents have moved into the state to fill new jobs. To the extent that more of the new jobs associated with OCS development could be taken by underemployed residents, the demand for new state public services would be lessened because the population growth from new migrants would be reduced.
4.6.2 Beaufort OCS Potential cumulative incremental state revenues from the Beaufort OCS development scenario is estimated to be about $7.2 billion (2007$) between 2008 and 2057. These revenues would come from three different sources—direct OCS revenues (including 8(g) lease revenues, personal taxes, and indirect petroleum revenues.
The direct OCS revenues estimated to be about $400 million would consist primarily of corporate income taxes and the State’s share of the state property tax on petroleum property (a larger share of the property tax would accrue to the North Slope Borough where the facilities would be located). These revenues would all go into the state general fund. There would also be a very modest amount of 8(g) revenue, which would be divided between the general fund and the Permanent Fund.
Estimated personal taxes associated with the Beaufort OCS development of about $1.8 billion would come primarily from the personal income tax (assumed in the analysis regardless of OCS development) but would also include various excise taxes and fees. These revenues would all be deposited in the general fund.
The indirect petroleum revenues estimated to amount to about $5 billion could come from four sources. The largest would be the estimated additional state royalty and production tax revenue ($2.9 billion) resulting from a reduction in the TAPS tariff and an increase in the wellhead value of oil due to additional throughput from Beaufort OCS oil. This estimate also includes the additional revenues to the State that could result from an extension of the life of TAPS. Because Beaufort OCS oil in the TAPS line would keep throughput above 200,000 barrels per day, this would forestall the need to shut down TAPS (assumed to happen in 2046) and find an alternative, and more expensive, method of shipping the remaining oil to market. Another significant source of indirect petroleum revenues from Beaufort OCS development is the additional state royalties and taxes that could result from the “stimulative” effect of higher industry profits due to higher wellhead values (a benefit due to increased TAPS throughput). Industry investment in exploration and development activities are anticipated to increase with higher industry profits that could lead to higher petroleum production in the North Slope. Other sources of indirect petroleum revenues could include benefits to the State from increased throughput in the gas pipeline from Beaufort OCS gas (estimated to be about $500 million)
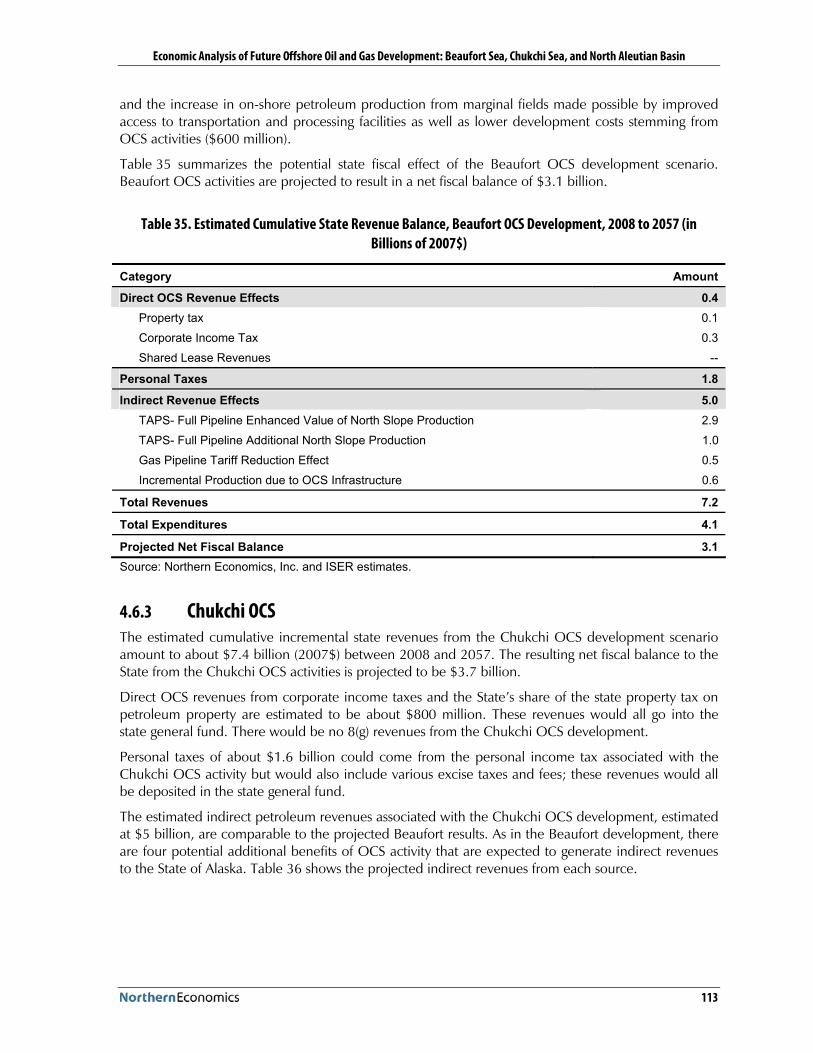
Economic Analysis of Future Offshore Oil and Gas Development: Beaufort Sea, Chukchi Sea, and North Aleutian Basin
113
and the increase in on-shore petroleum production from marginal fields made possible by improved access to transportation and processing facilities as well as lower development costs stemming from OCS activities ($600 million).
Table 35 summarizes the potential state fiscal effect of the Beaufort OCS development scenario. Beaufort OCS activities are projected to result in a net fiscal balance of $3.1 billion.
Table 35. Estimated Cumulative State Revenue Balance, Beaufort OCS Development, 2008 to 2057 (in Billions of 2007$)
Category Amount
Direct OCS Revenue Effects 0.4 Property tax 0.1
Corporate Income Tax 0.3
Shared Lease Revenues --
Personal Taxes 1.8
Indirect Revenue Effects 5.0 TAPS- Full Pipeline Enhanced Value of North Slope Production 2.9
TAPS- Full Pipeline Additional North Slope Production 1.0
Gas Pipeline Tariff Reduction Effect 0.5
Incremental Production due to OCS Infrastructure 0.6
Total Revenues 7.2
Total Expenditures 4.1
Projected Net Fiscal Balance 3.1 Source: Northern Economics, Inc. and ISER estimates.
4.6.3 Chukchi OCS The estimated cumulative incremental state revenues from the Chukchi OCS development scenario amount to about $7.4 billion (2007$) between 2008 and 2057. The resulting net fiscal balance to the State from the Chukchi OCS activities is projected to be $3.7 billion.
Direct OCS revenues from corporate income taxes and the State’s share of the state property tax on petroleum property are estimated to be about $800 million. These revenues would all go into the state general fund. There would be no 8(g) revenues from the Chukchi OCS development.
Personal taxes of about $1.6 billion could come from the personal income tax associated with the Chukchi OCS activity but would also include various excise taxes and fees; these revenues would all be deposited in the state general fund.
The estimated indirect petroleum revenues associated with the Chukchi OCS development, estimated at $5 billion, are comparable to the projected Beaufort results. As in the Beaufort development, there are four potential additional benefits of OCS activity that are expected to generate indirect revenues to the State of Alaska. Table 36 shows the projected indirect revenues from each source.

Economic Analysis of Future Offshore Oil and Gas Development: Beaufort Sea, Chukchi Sea, and North Aleutian Basin
114
Table 36. Estimated Cumulative State Revenue Balance, Chukchi OCS Development, 2008 to 2057 (in Billions of 2007$)
State Revenues Amount Direct revenue 0.8
Property tax 0.2
Corporate Income Tax 0.6
Shared Lease Revenues --
Personal taxes 1.6 Indirect effects 5.0
TAPS- Full Pipeline Enhanced Value of North Slope Production 2.8
TAPS- Full Pipeline Additional North Slope Production 1.0
Gas Pipeline Tariff Reduction Effect 0.7
Incremental Production due to OCS Infrastructure 0.6
Total Revenues 7.4
Total Expenditures 3.7
Projected Net Fiscal Balance 3.7 Source: Northern Economics, Inc. and ISER estimates.
4.6.4 Combined Beaufort and Chukchi OCS Development This section summarizes the combined fiscal effects of the Beaufort and Chukchi OCS development. As shown in Table 37, the combined total state revenues associated with the Beaufort and Chukchi OCS development, projected through 2057 could be about $14.6 billion. Estimated state government expenditures associated with the combined OCS development are $7.8 billion. In this combined case, the fiscal balance is $6.8 billion.

Economic Analysis of Future Offshore Oil and Gas Development: Beaufort Sea, Chukchi Sea, and North Aleutian Basin
115
Table 37. Estimated Cumulative State Revenue Balance, Combined Beaufort and Chukchi OCS Development, 2008 to 2057 (in Billion of 2007$)
State Revenues Amount Direct revenue 1.2
Property tax 0.3
Corporate Income Tax 0.9
Shared Lease Revenues --
Personal taxes 3.3 Indirect effects 10.1
TAPS- Full Pipeline Enhanced Value of North Slope Production 5.7
TAPS- Full Pipeline Additional North Slope Production 2.0
Gas Pipeline Tariff Reduction Effect 1.2
Incremental Production due to OCS Infrastructure 1.2
Total Revenues 14.6
Total Expenditures 7.8
Projected Net Fiscal Balance 6.8 Source: Northern Economics, Inc. and ISER estimates.
4.6.5 North Aleutian OCS The North Aleutian OCS development scenario is projected to generate cumulative incremental state revenues of about $800 million (2007$) between 2008 and 2057.
The estimated direct revenues from corporate income taxes and the state’s share of the state property tax on petroleum property amount to $200 million. These revenues would all go into the state general fund.
Personal taxes are projected to be about $600 million; primarily from a personal income tax but also including various excise taxes and fees. Personal taxes would all be deposited in the general fund.
No indirect petroleum revenues are anticipated from the North Aleutian OCS development since the development scenario does not anticipate other oil and gas development in the region. If other oil and gas development were anticipated then indirect petroleum revenues might be generated.
Table 38 shows the projected state government revenues and expenditures associated with OCS development in the North Aleutian Basin. The projected result is a net fiscal deficit of $200 million.

Economic Analysis of Future Offshore Oil and Gas Development: Beaufort Sea, Chukchi Sea, and North Aleutian Basin
116
Table 38. Estimated Cumulative State Revenue Balance, North Aleutian Basin OCS Development, 2008 to 2057 (in Billions of 2007$)
State Revenues Amount Direct revenue 0.2
Property tax 0.1
Corporate Income Tax 0.1
Shared Lease Revenues --
Personal taxes 0.6 Indirect effects
TAPS- Full Pipeline Enhanced Value of North Slope Production --
TAPS- Full Pipeline Additional North Slope Production --
Gas Pipeline Tariff Reduction Effect --
Incremental Production due to OCS Infrastructure --
Total Revenues 0.8
Total Expenditures 1.0
Projected Net Fiscal Balance (0.2) Source: Northern Economics, Inc. and ISER estimates.
4.6.6 Combined All Three OCS Development OCS development in all three areas—the Beaufort, Chukchi, and North Aleutian Basin— is projected to generate a positive net fiscal balance to the State of Alaska of about $6.6 billion.
As shown in Table 39, the estimated state government revenues from OCS development in all three areas ($15.3 billion) are expected to be greater than the estimated state government expenditures associated with OCS activity in all three areas ($8.8 billion)

Economic Analysis of Future Offshore Oil and Gas Development: Beaufort Sea, Chukchi Sea, and North Aleutian Basin
117
Table 39. Estimated Cumulative State Revenue Balance, All Three OCS Development, 2008 to 2057 (in Billions of 2007$)
State Revenues Amount Direct revenue 1.4
Property tax 0.4
Corporate Income Tax 1.0
Shared Lease Revenues --
Personal taxes 3.9 Indirect effects 10.1
TAPS- Full Pipeline Enhanced Value of North Slope Production 5.7
TAPS- Full Pipeline Additional North Slope Production 2.0
Gas Pipeline Tariff Reduction Effect 1.2
Incremental Production due to OCS Infrastructure 1.2
Total Revenues 15.3
Total Expenditures (8.8)
Projected Net Fiscal Balance 6.6 Source: Northern Economics, Inc. and ISER estimates. Note: Totals may not add due to rounding.
4.6.7 Potential Fiscal Effects for Local Governments Local governments in the directly impacted regions have a limited number of revenue sources to pay for necessary local public services. The most important are revenues from resource production and limited local sales and property taxes. State government directly supports some services like education, and provides limited revenue sharing. The following sections discuss the potential fiscal effects of OCS development for impacted local governments.
4.6.7.1 Beaufort OCS The North Slope Borough (Borough) relies on the property tax, which produced $28,700 per capita in 2006, primarily from revenues from the state property tax on petroleum property shared with the local jurisdictions where the property is located (Alaska Department of Commerce, Community, and Economic Development, 2007). Without OCS development, revenues from oil-related property are projected to decline in future years; however, the construction of a natural gas pipeline is expected to increase the taxable property in the region and increase Borough revenues. Over time, those revenues would also begin to fall as petroleum property depreciates (Figure 66).
OCS development in the Beaufort is projected to generate additional property tax revenues for the Borough amounting to about $1 billion (cumulative through 2057). Over time, these revenues would also decline with the value of the onshore OCS related property (Figure 67). In addition, shared lease revenues from 8(g) leases could add a modest amount to total Borough revenues (estimated to amount to over $20 million through 2057); because the annual amounts are small they do not appear in Figure 67. Section 4.5.1.1 of this report provides more detail about the property taxes and 8(g) revenues.
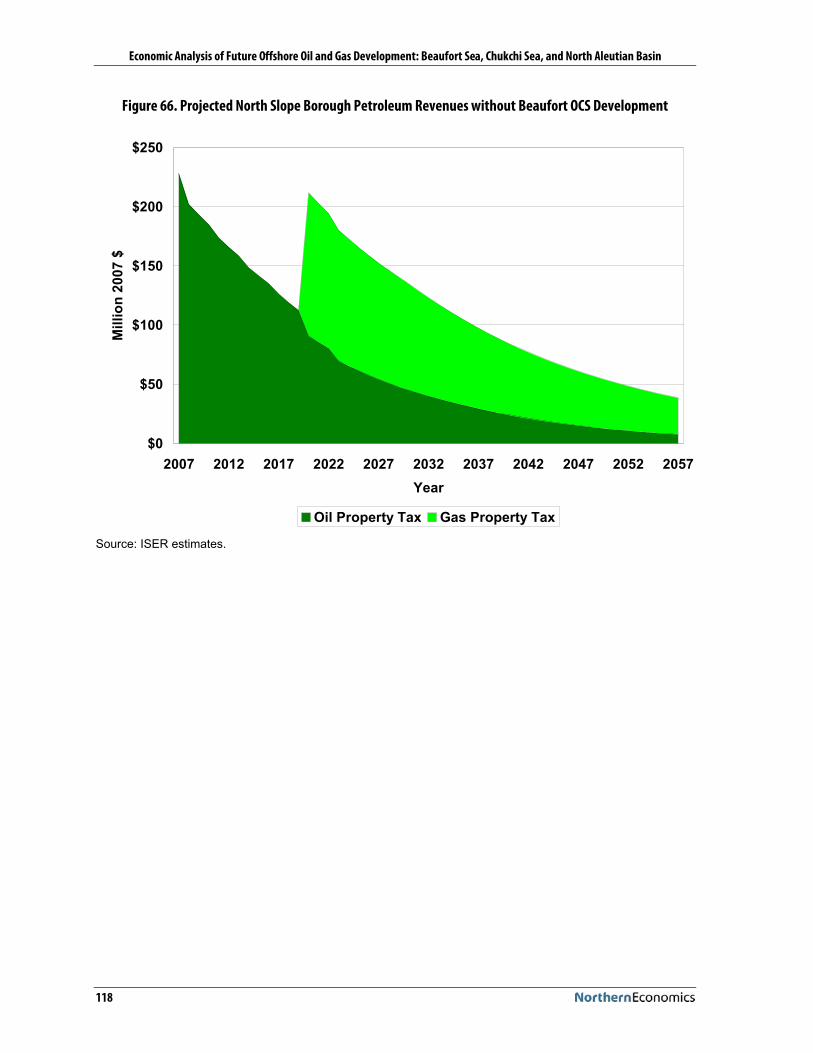
Economic Analysis of Future Offshore Oil and Gas Development: Beaufort Sea, Chukchi Sea, and North Aleutian Basin
118
Figure 66. Projected North Slope Borough Petroleum Revenues without Beaufort OCS Development
$0
$50
$100
$150
$200
$250
2007 2012 2017 2022 2027 2032 2037 2042 2047 2052 2057Year
Mill
ion
2007
$
Oil Property Tax Gas Property Tax Source: ISER estimates.

Economic Analysis of Future Offshore Oil and Gas Development: Beaufort Sea, Chukchi Sea, and North Aleutian Basin
119
Figure 67. Estimated North Slope Borough Incremental Petroleum Revenues, Beaufort OCS Development
$0
$5
$10
$15
$20
$25
$30
$35
$40
$45
2007 2012 2017 2022 2027 2032 2037 2042 2047 2052 2057Year
Mill
ion
2007
$
Property Tax Shared Lease Revenues
Source: Northern Economics, Inc. and ISER estimates.
Figure 68 shows the total petroleum revenues that could accrue to the North Slope Borough with and without the Beaufort OCS development.

Economic Analysis of Future Offshore Oil and Gas Development: Beaufort Sea, Chukchi Sea, and North Aleutian Basin
120
Figure 68. Estimated North Slope Borough Petroleum Revenues with and Without Beaufort OCS Development
$0
$50
$100
$150
$200
$250
2007 2012 2017 2022 2027 2032 2037 2042 2047 2052 2057Year
Mill
ion
2007
$
No OCS Oil Revenues No OCS Gas Revenues OCS Revenues Source: Northern Economics, Inc. and ISER estimates.
Without OCS development, per capita local revenues trend downward except for the spike when the gas pipeline is built (Figure 69). OCS revenues per new resident are generally higher. (The percent increase in local revenues with OCS development is greater than the percent increase in local population with OCS development.)
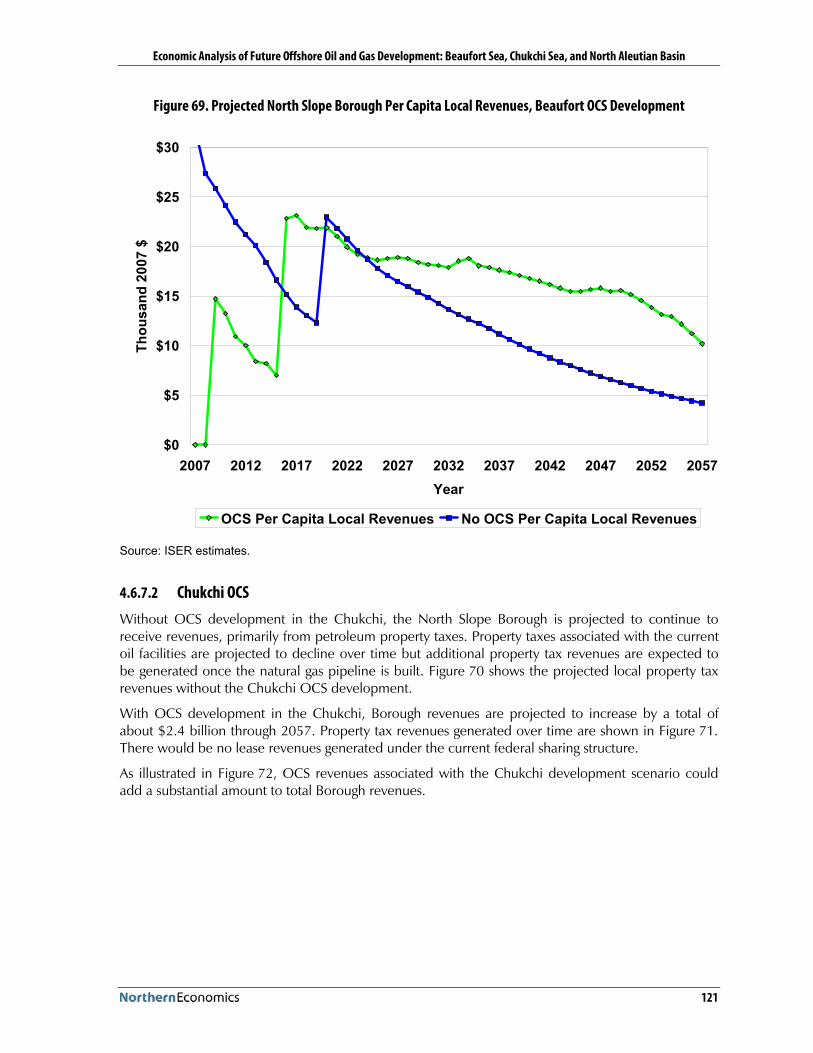
Economic Analysis of Future Offshore Oil and Gas Development: Beaufort Sea, Chukchi Sea, and North Aleutian Basin
121
Figure 69. Projected North Slope Borough Per Capita Local Revenues, Beaufort OCS Development
$0
$5
$10
$15
$20
$25
$30
2007 2012 2017 2022 2027 2032 2037 2042 2047 2052 2057Year
Thou
sand
200
7 $
OCS Per Capita Local Revenues No OCS Per Capita Local Revenues
Source: ISER estimates.
4.6.7.2 Chukchi OCS Without OCS development in the Chukchi, the North Slope Borough is projected to continue to receive revenues, primarily from petroleum property taxes. Property taxes associated with the current oil facilities are projected to decline over time but additional property tax revenues are expected to be generated once the natural gas pipeline is built. Figure 70 shows the projected local property tax revenues without the Chukchi OCS development.
With OCS development in the Chukchi, Borough revenues are projected to increase by a total of about $2.4 billion through 2057. Property tax revenues generated over time are shown in Figure 71. There would be no lease revenues generated under the current federal sharing structure.
As illustrated in Figure 72, OCS revenues associated with the Chukchi development scenario could add a substantial amount to total Borough revenues.

Economic Analysis of Future Offshore Oil and Gas Development: Beaufort Sea, Chukchi Sea, and North Aleutian Basin
122
Figure 70. Projected North Slope Borough Petroleum Revenues without Chukchi OCS Development
$0
$50
$100
$150
$200
$250
2007 2012 2017 2022 2027 2032 2037 2042 2047 2052 2057Year
Mill
ion
2007
$
Oil Property Tax Gas Property Tax Source: Northern Economics, Inc. and ISER estimates.

Economic Analysis of Future Offshore Oil and Gas Development: Beaufort Sea, Chukchi Sea, and North Aleutian Basin
123
Figure 71. Estimated North Slope Borough Incremental Petroleum Revenues, Chukchi OCS Development
$0
$10
$20
$30
$40
$50
$60
$70
$80
$90
2007 2012 2017 2022 2027 2032 2037 2042 2047 2052 2057Year
Mill
ion
2007
$
Property Tax Shared Lease Revenues
Source: Northern Economics, Inc. and ISER estimates.

Economic Analysis of Future Offshore Oil and Gas Development: Beaufort Sea, Chukchi Sea, and North Aleutian Basin
124
Figure 72. Estimated North Slope Borough Petroleum Revenue with and without Chukchi OCS Development
$0
$50
$100
$150
$200
$250
$300
2007 2012 2017 2022 2027 2032 2037 2042 2047 2052 2057Year
Mill
ion
2007
$
No OCS Oil Revenues No OCS Gas Revenues OCS Revenues
Source: Northern Economics, Inc. and ISER estimates.

Economic Analysis of Future Offshore Oil and Gas Development: Beaufort Sea, Chukchi Sea, and North Aleutian Basin
125
Without OCS development, per capita local revenues trend downward except for the spike when the gas pipeline is built (Figure 73). OCS revenues per new resident are generally higher. (The percent increase in local revenues with OCS development is greater than the percent increase in local population with OCS development.)
Figure 73. Projected North Slope Borough Per Capita Local Revenues, Chukchi OCS Development
$0
$5
$10
$15
$20
$25
$30
2007 2012 2017 2022 2027 2032 2037 2042 2047 2052 2057Year
Thou
sand
200
7 $
OCS Per Capita Local Revenues No OCS Per Capita Local Revenues
Source: ISER estimates.
4.6.7.3 Combined Beaufort and Chukchi OCS Development Figure 74, Figure 75, and Figure 76 show the combined projected annual revenues to the North Slope Borough from OCS activity in the Beaufort and the Chukchi.
OCS development in both areas is expected to add significantly to North Slope Borough revenues. In property taxes, the combined results for the Beaufort and Chukchi are estimated to amount to about $3.5 billion through 2057.
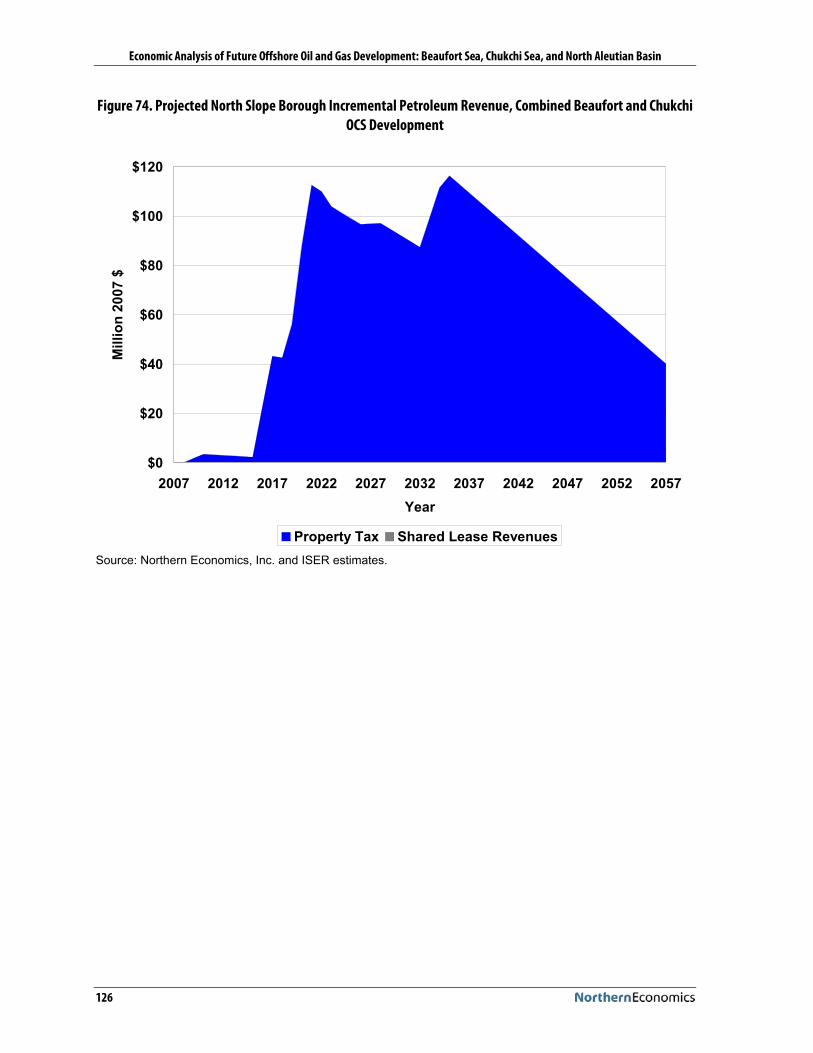
Economic Analysis of Future Offshore Oil and Gas Development: Beaufort Sea, Chukchi Sea, and North Aleutian Basin
126
Figure 74. Projected North Slope Borough Incremental Petroleum Revenue, Combined Beaufort and Chukchi OCS Development
$0
$20
$40
$60
$80
$100
$120
2007 2012 2017 2022 2027 2032 2037 2042 2047 2052 2057Year
Mill
ion
2007
$
Property Tax Shared Lease Revenues
Source: Northern Economics, Inc. and ISER estimates.

Economic Analysis of Future Offshore Oil and Gas Development: Beaufort Sea, Chukchi Sea, and North Aleutian Basin
127
Figure 75. Estimated North Slope Borough Petroleum Revenue with and without Combined Beaufort and Chukchi OCS Development
$0
$50
$100
$150
$200
$250
$300
$350
2007 2012 2017 2022 2027 2032 2037 2042 2047 2052 2057Year
Mill
ion
2007
$
No OCS Oil Revenues No OCS Gas Revenues OCS Revenues
Source: Northern Economics, Inc. and ISER estimates.

Economic Analysis of Future Offshore Oil and Gas Development: Beaufort Sea, Chukchi Sea, and North Aleutian Basin
128
Figure 76. Projected North Slope Borough Per Capita Local Revenues, Combined Beaufort and Chukchi OCS Development
$0
$5
$10
$15
$20
$25
$30
2007 2012 2017 2022 2027 2032 2037 2042 2047 2052 2057Year
Thou
sand
200
7 $
OCS Local Per Capita Revenues No OCS Per Capita Local Revenues
Source: ISER estimate
4.6.7.4 North Aleutian OCS The North Aleutian Basin region relies on a mixture of local property and sales taxes as well as taxes on the seafood industry. In addition, most communities share in a portion of the state fishery business tax and fishery resource landing tax (as well as a number of other small shared taxes). Per capita revenues in 2006 from these local and shared taxes ranged from a high of $3,700 in the Bristol Bay Borough and $1,900 in the city of Dillingham, to a low of $800 in the small communities in the Lake and Peninsula Borough (Alaska Department of Commerce, Community, and Economic Development, 2007 and Alaska Department of Revenue, 2007). In the aggregate these revenues are quite modest—roughly $10 million annually. These revenues are projected to continue at their current level. Construction of the Pebble Mine will increase revenues to some communities within the region, but since that project is still in the early stages of planning it is too soon to estimate what those might be (Figure 77).

Economic Analysis of Future Offshore Oil and Gas Development: Beaufort Sea, Chukchi Sea, and North Aleutian Basin
129
Figure 77. Projected Regional Revenue without North Aleutian OCS Development
$0
$2
$4
$6
$8
$10
$12
2007 2012 2017 2022 2027 2032 2037 2042 2047 2052 2057Year
Mill
ion
2007
$
Local and Shared Taxes
Source: Northern Economics, Inc. and ISER estimates.
Under the development scenario envisioned for the North Aleutian Basin, OCS development could generate significant property tax revenues for the region; these revenues would decline over time with the value of the oil and gas property (Figure 78). There would be no lease revenues under the current federal sharing structure.
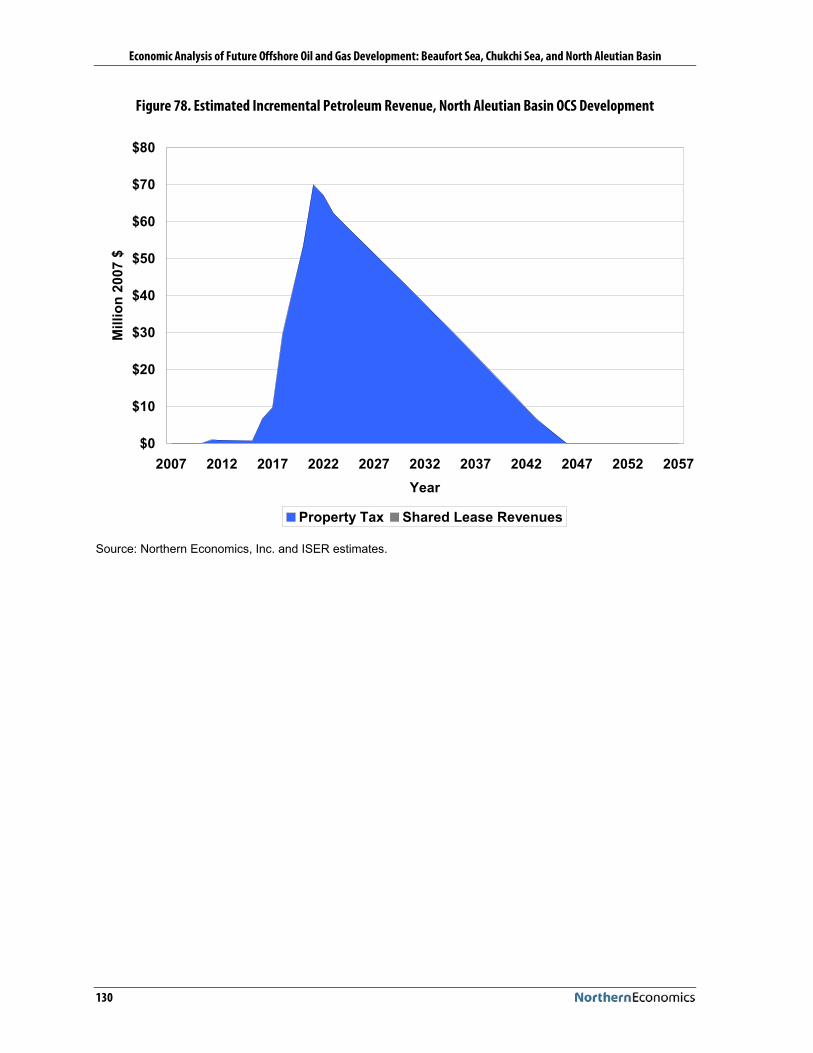
Economic Analysis of Future Offshore Oil and Gas Development: Beaufort Sea, Chukchi Sea, and North Aleutian Basin
130
Figure 78. Estimated Incremental Petroleum Revenue, North Aleutian Basin OCS Development
$0
$10
$20
$30
$40
$50
$60
$70
$80
2007 2012 2017 2022 2027 2032 2037 2042 2047 2052 2057Year
Mill
ion
2007
$
Property Tax Shared Lease Revenues
Source: Northern Economics, Inc. and ISER estimates.

Economic Analysis of Future Offshore Oil and Gas Development: Beaufort Sea, Chukchi Sea, and North Aleutian Basin
131
The OCS revenues could add significantly add to total regional revenues (Figure 79) given the development scenario for the Basin.
Figure 79. Estimated Petroleum Revenues with and without North Aleutian OCS Development
$0
$10
$20
$30
$40
$50
$60
$70
$80
$90
2007 2012 2017 2022 2027 2032 2037 2042 2047 2052 2057Year
Mill
ion
2007
$
No OCS Revenues OCS Revenues
Source: Northern Economics, Inc. and ISER estimates.
Without OCS development, per capita local revenues are stable but low over time (Figure 80). OCS revenues per new resident could be several times higher. The percent increase in local revenues with OCS development could be greater than the percent increase in local population with OCS development.

Economic Analysis of Future Offshore Oil and Gas Development: Beaufort Sea, Chukchi Sea, and North Aleutian Basin
132
Figure 80. Projected Aleutians East Borough Per Capita Local Revenues, North Aleutian OCS Development
$0
$5
$10
$15
$20
$25
$30
$35
$40
$45
$50
2007 2012 2017 2022 2027 2032 2037 2042 2047 2052 2057Year
Thou
sand
200
7 $
OCS Per Capita Local Revenues No OCS Per Capita Local Revenues
Source: ISER estimates.

Economic Analysis of Future Offshore Oil and Gas Development: Beaufort Sea, Chukchi Sea, and North Aleutian Basin
133
5 Sensitivity Analysis
A sensitivity analysis was done to consider OCS revenue effects given higher market prices for oil and gas (holding all other factors constant).
The base case analysis as presented in Section 4, assumed long-term (50-year) projected prices of oil and gas fluctuating around $65 per barrel and $6.4 per million Btu of natural gas, respectively, in 2006 dollars. These price assumptions are based on the Energy Information Administration’s (EIA) June 2008 published petroleum price forecast17.
For the sensitivity analysis, the following oil and gas price levels were assumed through 2030:
Case 1: Oil: $80 per barrel and natural gas: $7.8 per mmBtu
Case 2: Oil: $100 per barrel and natural gas: $9.8 per mmBtu
Case 3: Oil: $120 per barrel and natural gas: $11.8 per mmBtu
Prices after 2030 and through 2057 were assumed to increase at a rate of 0.5 percent per year (same assumption as the base case). The results are shown in Table 40.
Table 40. Sensitivity Analysis Results: Cumulative State Revenues under Different Petroleum Price Levels
Sensitivity Analysis Revenue/Expenditure Category
Base Case Case 1 Case 2 Case 3
Projected State Revenues 15.3 16.0 17.1 18.2 Direct OCS Petroleum Revenues 1.4 1.4 1.4 1.4 Population Related Revenues 3.9 3.9 3.9 3.9 Indirect Petroleum Revenues due to OCS development
TAPS-Full Pipeline Enhanced Value of North Slope Production 5.7 5.7 5.7 5.7 TAPS-Full Pipeline Additional North Slope Production 2.0 2.4 3.1 3.8 Gas Pipeline Tariff Reduction Effect 1.2 1.2 1.2 1.2 Incremental Production due to OCS Infrastructure 1.2 1.5 1.9 2.3
Projected Incremental State Expenditures (8.8) (8.8) (8.8) (8.8) Projected State of Alaska Net Fiscal Balance: 6.6 7.2 8.3 9.4 Notes: (1) The sum of the amounts may not equal the total due to rounding.
The economic benefits of the development of oil and gas resources from Alaska’s OCS areas would be greater with higher prices—revenues would be higher, production could be higher, and consequently higher revenues and production would increase statewide employment and population.
Higher prices could have a significant impact on the indirect revenues. Higher prices are expected to result in greater oil and gas and production in the North Slope; thereby increasing the spillover effects from lower transportation costs and lower operating costs due to additional OCS infrastructure.
17 EIA’s Annual Energy Outlook presents a projection and analysis of US energy supply, demand, and prices through 2030. The projections are based on results from EIA’s National Energy Modeling System. Prices were projected to increase slowly in real dollars from 2030 until 2057. These price levels also approximate the Department of Revenue’s 10-year oil price forecast—in 2017, DOR price forecast is $65.25 per barrel (in real 2008$) at ANS West Coast (DOR, Spring 2008 Forecast).

Economic Analysis of Future Offshore Oil and Gas Development: Beaufort Sea, Chukchi Sea, and North Aleutian Basin
134
The impact on direct OCS petroleum revenues, however, could be insignificant as most of these revenues are tied to property taxes and not to lease revenues. Under a different federal lease revenue sharing arrangement such as the one in the Gulf of Mexico, the benefits to Alaska could be greater with higher oil prices.

Economic Analysis of Future Offshore Oil and Gas Development: Beaufort Sea, Chukchi Sea, and North Aleutian Basin
135
6 References
Alaska Department of Commerce, Community, and Economic Development, 2007. Alaska Taxable, 2006.
Alaska Department of Fish and Game (ADF&G). 2006 Overview. Undated.
Alaska Department of Labor and Workforce Development (ADOLWD). “Alaska’s Oil Industry.” Alaska Economic Trends, September 2008.
Alaska Department of Natural Resources, Division of Ocean and Coastal Management, 2008. Coastal Impact Assistance Program. Accessed on November 5, 2008 at http://www.dnr.state.ak.us/coastal/CIAP/ciap.htm.
Alaska Department of Revenue, 2007. Shared Taxes and Fees Annual Report, 2006.
Alaska Department of Revenue, 2007. Revenue Sources, Fall 2008. Accessed at http://www.tax.alaska.gov/programs/sourcebook/index.aspx.
Alaska Department of Revenue, 2008. Spring Revenue Sources 2008. Accessed at http://www.tax.alaska.gov/programs/sourcebook/index.aspx.
Aleutians East Borough. “The Pipeline.” Issue 1: Volume 1. October 10. 2007.
Aleutians East Borough. 2007. Aleutians East Borough Coastal Management Plan Final Draft Plan Amendment.
Aleutians East Borough. Undated. NAB Fisheries/Energy Workshop Draws Strong Attendance. Available at http://www.aleutianseast.org/index.asp?Type=B_BASIC&SEC={B5DA41CB-4F19-4AB8-8A67-722A8BFA2605}
Bradner, Tim. “Shell bids aggressively in federal Beaufort Sea lease sale,” Alaska Journal of Commerce. April 22, 2007.
Bristol Bay Native Corporation. 2008. BBNC Report to Shareholders Concerning the Pebble Mine Survey. Available at http://www.bbnc.net/news/39/83/d,sidebartemplate/
Craig, James. Minerals Management Service. Scenarios and Benefits from Development in the Chukchi OCS. Power Point Presentation.
Department of Commerce, Community, and Economic Development. National Petroleum Reserve-Alaska (NPR-A) Impact Mitigation Grant Program Report to the Second Session of the Twenty-Fifth Alaska Legislature. Issued January 2008.
Energy Information Administration. Annual Energy Outlook 2008). Accessed at http://www.ei.doe.gov/oiaf/aeo/production.html on July 2008.
Freudenburg, W. and R. Gramling. 1992. Community impacts of technological change: Toward a longitudinal perspective. Social Forces 70:937-957.
Institute of Social and Economic Research, 1995. Marginal Oil Field Development: The Economic Impact. Available at http://www.iser.uaa.alaska.edu/Home/pubs.html.
Minerals Management Service, Alaska OCS Region. Beaufort Sea Planning Area Oil and Gas Lease Sales 186, 195, and 202. Final Environmental Impact Statement, OCS EIS/EA MMS 2003-01. February 2003.

Economic Analysis of Future Offshore Oil and Gas Development: Beaufort Sea, Chukchi Sea, and North Aleutian Basin
136
Minerals Management Service, Alaska OCS Region. Environmental Assessment. Shell Offshore Inc. Beaufort Sea Exploration Plan. OCSEISIEA MMS 2007-009.
Minerals Management Service, Alaska OCS Region. Proposed OCS Lease Sale 202 Beaufort Sea Planning Area. OCS EIS/EA MMS 2006-01. August 2006.
Minerals Management Service, Alaska OCS. Undiscovered Oil and Gas Resources, Alaska Federal Offshore As of 2006. 2007.
Minerals Management Service. 2006 Resource Assessment-Alaska Region. Accessed at http://www.mms.gov/alaska/re/reports/2006Asmt/results.htm.
Patrick Burden & Associates, 1985. Monitoring OCS Activity in the Bering Sea. Prepared for Minerals Management Service, Alaska Outer Continental Shelf Office.
TransCanada. Alaska Gasline Inducement Act (AGIA) Application for License. Submitted on November 30, 2007.
U.S. Department of the Interior. Fact Sheet 2007-2012 Proposed Final Program (PFP) accessed Accessed at http//www.doi.gov/news/07043a_factsheet.html.
USDOI, MMS. 2007a. Chukchi Sea Planning Area Oil and Gas Lease Sale 193 and Seismic Surveying Activities in the Chukchi Sea Final Environmental Impact Statement. Volume I. OCS EIS/EA MMS 2007-026.