economic analysis of solar home systems - world...
TRANSCRIPT
__________________ Economic Analysis of Solar Home Systems:
A Case Study for the Philippines
February 25, 2003
____________
Peter Meier
Prepared for
Asia Alternative Energy Program (ASTAE) Energy and Mining Sector Development Unit (EASEG)
East Asia and Pacific Region The World Bank
Washington, D.C.


i
CONTENTS
FOREWORD ................................................................................................................................................... II ABSTRACT .....................................................................................................................................................III ACKNOWLEDGMENTS.............................................................................................................................IV CURRENCY EQUIVALENTS ................................................................................................................... V ACRONYMS AND ABBREVIATIONS ................................................................................................. V 1. BACKGROUND ....................................................................................................................................... 1 2. ASSESSING BENEFITS AS AVOIDED COSTS ........................................................................ 3
RESULTS............................................................................................................................................................ 5 VAT EXEMPTION ........................................................................................................................................ 10 CAPITAL GRANT SUBSIDY.............................................................................................................................. 11
3. ASSESSING BENEFITS AS CONSUMER .................................................................................. 12 SURPLUS CHANGES................................................................................................................................. 12
ISSUES ............................................................................................................................................................ 13 OTHER STUDIES ............................................................................................................................................. 14
4. CONSUMER SURPLUS BENEFIT ESTIMATES ..................................................................... 16 RESULTS.......................................................................................................................................................... 19 IMPACT OF KEROSENE PRICE ........................................................................................................................ 20 SENSITIVITY ANALYSIS .................................................................................................................................. 21 RESULTS FOR LARGER SYSTEMS ................................................................................................................... 24
CHAPTER 5. EXTERNALITIES........................................................................................................... 28 LOCAL AIR POLLUTION................................................................................................................................... 28 HEALTH BENEFITS .......................................................................................................................................... 28 GLOBAL EXTERNALITIES ................................................................................................................................ 29
6. SUBSIDY STRUCTURE..................................................................................................................... 31 CHAPTER 7. RISK ANALYSIS ........................................................................................................... 35 CHAPTER 8. AGGREGATE ECONOMIC BENEFITS.................................................................... 38 CHAPTER 9. CONCLUSIONS.............................................................................................................. 40 REFERENCES................................................................................................................................................ 42

ii
FOREWORD The recent decreases in the capital costs of photovoltaic systems are making off-grid solar home systems a real alternative for electrification in rural areas where low load densities make the costs of conventional grid extension uneconomic. Such systems are now being proposed in many countries, and the successful experience in Sri Lanka and elsewhere shows a high willingness-to-pay for such systems, given the transformation of lifestyles made possible by electric lighting, radio, and television viewing. The economic benefits thus extend beyond the mere replacement costs of the kerosene-based lighting that solar homes replace. Building on a detailed survey of rural household energy use in the Philippines, this paper addresses some of the issues involved in the economic analysis of off-grid systems for the proposed Philippines Rural Power Project, including the development of plausible assumptions for demand curves and consumer surplus calculations, the reconciliation of economic and financial flows (in the presence of both subsidies and taxes), the problems of income effects and budget constraints of poor rural households, the design and impact of subsidies, and the analysis of risk and uncertainty. It is hoped that the analytical approaches developed in this paper will also be useful for analysis of other technologies in rural applications, or the use of solar home systems in other countries.
Mohammad Farhandi Acting Sector Manager East Asia and Pacific Region The World Bank

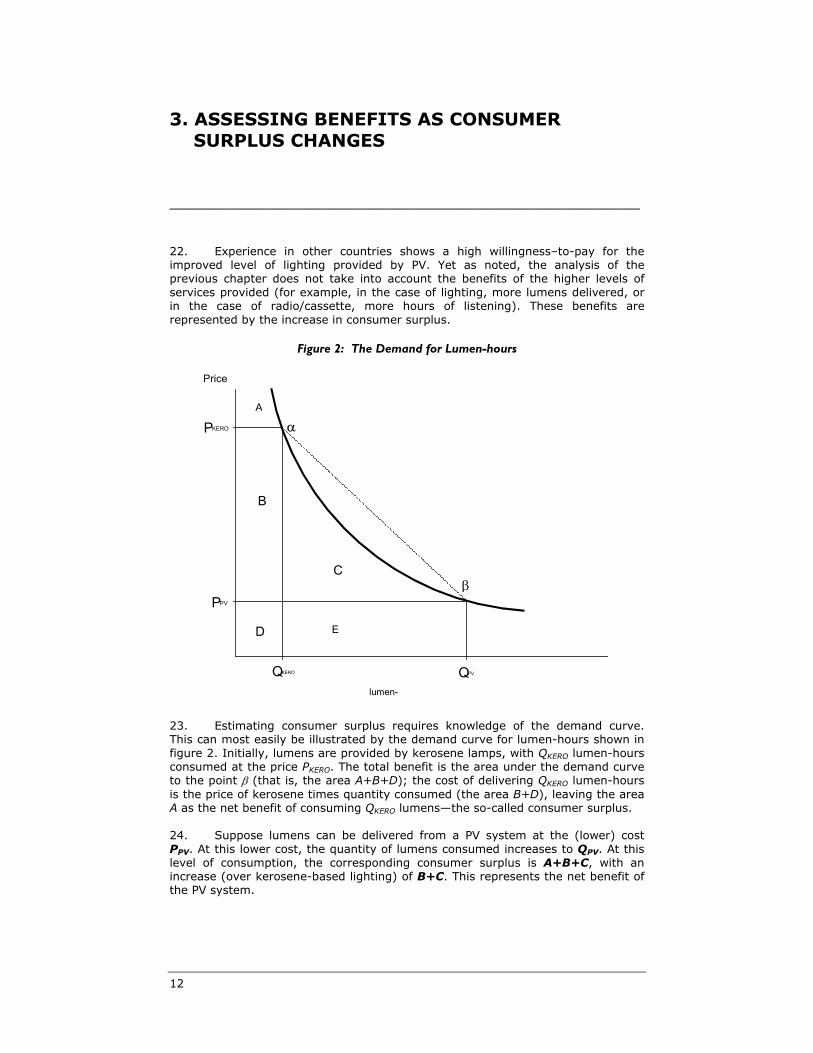
iii
ABSTRACT
This paper deals with the economic analysis of solar photovoltaic home systems for off-grid application in the Philippines. Financing of solar homes systems (SHSs) is one of several components of the proposed Philippines Rural Project. Each of the three candidate systems is evaluated separately: 20 Wp systems for the poorest households, 40 Wp systems for poor households, and 75 Wp systems for nonpoor households, with baseline data on household energy use before electrification based a 1998 survey. The economic analysis using only replacement costs (of kerosene, dry cells, and rechargeable auto batteries) suggests that only the smallest 20 Wp system is economic. However, when increases in consumer surplus are correctly assessed, all three size classes show economic rates of return substantially above the 15 percent hurdle rate. Demand curves are derived for both lighting and television-viewing hours. Photovoltaic- (PV-) based systems provide a much greater level of service for given levels of household budget constraints, and the survey data confirm a high willingness-to-pay for a system that provides television viewing and clean bright lighting. The paper uses a concave shape of the demand curve (which is more conservative, and also more reasonable from the standpoint of theory, than the usual assumption of linearity). The assumption of a constant budget constraint for energy expenditures in the poorest households further ensures conservative results. A detailed reconciliation of economic and financial flows is provided, which provides the basis for an assessment of the rationale for, and impact of, alternative levels of subsidy. The conventional switching value sensitivity analysis is augmented by a probabilistic risk assessment using Monte Carlo simulation. The risk factors assessed include shorter-than-expected system lives, capital costs, market penetration, kerosene prices, and uncertainty in the demand curve parameters. Additional benefits from carbon reduction further enhance the economic rate of return. A range of further environmental benefits—such as the reduction of burn injuries and deaths from kerosene lamps—and indoor air pollution benefits are noted, although not quantified. The paper concludes that SHSs provide high economic returns for areas with low load density for which grid extension is uneconomic, with very small risk of hurdle rates not being achieved.

iv
ACKNOWLEDGMENTS
The writer thanks Anil Cabraal, who provided much of the data on which this work is based and provided access to prior work, and whose ideas made this study possible. Also gratefully acknowledged is the support of Selina Shum, the Task Manager for the Philippines Rural Power Project. The paper has also benefited from the critical reviews of Susan Bogach and Charles Feinstein. Support from Teresita G. Velilla for preparation of the document for publication is gratefully acknowledged. Funding for this study was provided by the Asia Alternative Energy Program (ASTAE), managed by the Energy and Mining Sector Development Unit in the East Asia and Pacific Region of the World Bank. World Bank and donor partners established ASTAE in 1992 to support the transition to environmentally sustainable energy use in developing countries in Asia. ASTAE’s strategic objective during the past decade has been to mainstream alternative energy options in World Bank energy sector activities by promoting the preparation and implementation of renewable energy and energy efficiency components in World Bank energy sector projects in Asia. This strategic objective has been achieved. By the year 2000, about 15 percent of the Bank’s power sector lending in Asia was for alternative energy components or projects.

v
CURRENCY EQUIVALENTS
Currency unit = Philippine peso (P)
P 1 = US$0.0196 US$1 = P 51
ACRONYMS AND ABBREVIATIONS
APL Adaptable Program Loan ASTAE Asia Alternative Energy Program C Carbon CS Consumer surplus DOE Department of Energy (Philippines) EASEG Energy and Mining Sector Development Unit,
East Asia and Pacific Region ERR Economic rate of return FRR Financial rate of return FIRR Financial internal rate of return GEF Global Environment Facility GHG Greenhouse gas ICR Implementation Completion Report LPG Liquefied petroleum gas NEA National Electrification Administration NGO Nongovernmental organization NPV Net present value O&M Operations and maintenance P Peso PAD Project Appraisal Document PCF Prototype Carbon Fund PGSEP Philippine-German Solar Energy Program PV Photovoltaic SHS Solar home system VAT Value added tax (10%) Wh Watt-hour Wp Watt-peak WTP Willingness–to-pay

vi

1
1. BACKGROUND __________________________________________________________________ 1. This report presents an economic analysis of solar PV-based home systems (SHSs) for application in the Philippines.1 SHSs are expected to be one of the technologies supported under the proposed Philippines Rural Power Project. The purpose of using SHSs is to provide rural consumers who are unlikely to gain access to grid electricity services, with affordable off-grid electricity.2 According to the National Electrification Administration (NEA), in 2000 more than 2.5 million households were without access to grid electricity. Even when 100 percent of villages are electrified, NEA estimates that about 1 million households are likely to be too dispersed or too far to be economically connected to the distribution grid network. 2. Studies in the Philippines and elsewhere find that photovoltaics can be the least-cost solution to providing basic electricity services for lighting, communications, and other household and community needs in areas with small dispersed populations and that are remote from the grid.3 It is expected that in the early years of the implementation of the stand-alone renewable energy systems component, PV options are likely to dominate for the following reasons:
• The Philippines has private firms and nongovernmental organizations (NGOs) capable of delivering products and services and an extensive rural financial network for credit delivery.
• Positive experiences and good implementation models are emerging from other countries.4 About 3,500 SHSs and 260 battery-charging stations have been installed in the Philippines during the last 20 or more years.5
1 An SHS kit usually consists of a PV module, controller, battery, and several fluorescent lamps,
along with cables and support structure. Electricity available from a PV system is proportional to the size of the PV module(s) and the availability and brightness of sunlight. Each household or facility has its own unit. Electricity is stored in a rechargeable battery for use when needed.
2 In addition to individual SHSs, other candidate renewable energy technologies to provide off-grid services include the following:
• Battery charging stations of 300 Wp serving 10 households. Each would cost around US$3,500–4,500. Households would bring the batteries to the charging station to be recharged once every week or 10 days.
• Small wind or wind-PV systems for household service. These are appropriate in areas with good wind resources. Typically these systems have lower unit costs compared to SHSs, but applicability is more site-specific.
• Pico-hydro units. These are small, typically 200–500 W units that operate with a head of 1–1.5 meters. Low-cost units are available from China and Vietnam. Their quality is low and annual repair costs are generally comparable to the initial costs of about US$25–75 per unit. Units are installed in streams with power lines that are usually strung on trees or bamboo poles, which take power to the households. Safety and voltage control are concerns because such units often lack a regulator.
3 See Cabraal, Cosgrove-Davies, and Schaeffer (1996).
4 These experiences have shown that several important conditions are needed for such programs to succeed. These include a competitive marketplace; consumer credit availability; significant private investment; and GEF and other grant support, especially in the early years, to help companies build the sales and service infrastructure, increase affordability particularly for poorer households, help mitigate the higher perceived risk of consumers because of the newness of the technology, and improve the profitability for companies. Also, a one-time subsidy is more effective in improving

2
• The Philippines has far less experience with other technology options.
• The Philippines enjoys good to excellent solar resources throughout the archipelago, even during the rainy season.
3. The Philippines Rural Power Project is proposed for implementation as an Adaptable Program Loan (APL), whose first phase (APL-I) is expected to cover a five year period. For rural households that are too remote or are too dispersed to be cost-effectively connected to the grid, the Project includes a subcomponent to make available for direct purchase various capacities of solar PV systems through private vendors and NGOs. Recognizing the generally low incomes of these rural consumers and the still high capital costs of PV systems, the project will provide, through the Global Environment Facility (GEF) and government funds, subsidies to lower the cost to consumers, and financing to spread out the payments. The suppliers would offer small PV system options (for example, 20–75 Wp) sufficient to provide basic services to households. Competing vendors would be enticed to do business through incentives that include assistance in market development and capacity building, product promotions, and other risk-reducing activities funded by the proposed GEF grants in order to reduce the critical barriers of PV market development. 4. GEF grants would be leveraged with government subsidies to help reduce the initial cost of the PV systems and make them affordable for the rural poor. Further, to remove the barrier of credit access, this subcomponent would provide a line of credit to financial intermediaries (such as rural banks and microfinance institutions) to enable them to provide consumer loans for the PV systems and financing of incremental working for dealers. The economic analysis presented in this paper covers the PV systems subcomponent during its first phase of implementation during which about 10,000 PV systems of various sizes would be financed.
affordability than an interest rate subsidy. The initial pace of implementation is likely to be slow; a variety of products should be offered to meet varying consumer needs and improve affordability; consumer satisfaction requires correct expectations; product quality and reliability and effective, responsive, after-sales service is essential; and marketing and sales are key activities. For details, see Cabraal, Cosgrove-Davies, and Schaeffer (1996) and Martinot, Cabraal, and Mathur (2001).
5 About 3,957 systems of various PV applications are located in the country. These installations are largely attributed to the initial efforts of the Philippine-German Solar Energy Program (PGSEP) in the 1980s, whose main objective was to demonstrate the technical viability of using PV for electrification. The project likewise demonstrated and tested various PV applications ranging from telecommunication, battery charging stations, PV-powered video cinemas, refrigerators, incubators, streetlights and others. Currently, an estimated 3,455 solar home systems have been installed in various locations in the country. With the real costs of PV project development above the affordability level of most of the rural population (the SHSs considered in this report cost between US$350–700), international cooperation is necessary in the realization of such projects. Systems have been installed through private companies, local cooperatives (for example, multipurpose, agricultural, and credit), and rural electric cooperatives.
Because of the limited market, PV systems in the Philippines tend to be more expensive than products available in other Asian countries. Experiences in the Philippines have not been all positive because any donor- or government-funded programs have not paid adequate attention to sustainability.
3
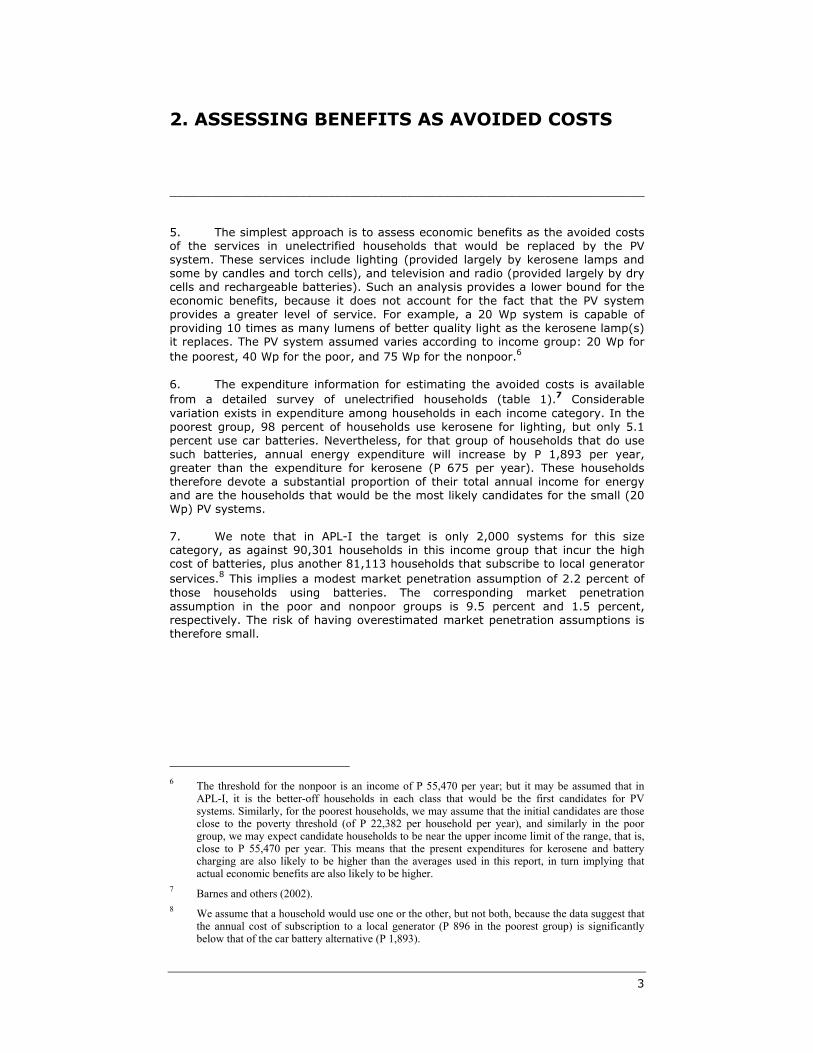
2. ASSESSING BENEFITS AS AVOIDED COSTS __________________________________________________________________ 5. The simplest approach is to assess economic benefits as the avoided costs of the services in unelectrified households that would be replaced by the PV system. These services include lighting (provided largely by kerosene lamps and some by candles and torch cells), and television and radio (provided largely by dry cells and rechargeable batteries). Such an analysis provides a lower bound for the economic benefits, because it does not account for the fact that the PV system provides a greater level of service. For example, a 20 Wp system is capable of providing 10 times as many lumens of better quality light as the kerosene lamp(s) it replaces. The PV system assumed varies according to income group: 20 Wp for the poorest, 40 Wp for the poor, and 75 Wp for the nonpoor.6 6. The expenditure information for estimating the avoided costs is available from a detailed survey of unelectrified households (table 1).7 Considerable variation exists in expenditure among households in each income category. In the poorest group, 98 percent of households use kerosene for lighting, but only 5.1 percent use car batteries. Nevertheless, for that group of households that do use such batteries, annual energy expenditure will increase by P 1,893 per year, greater than the expenditure for kerosene (P 675 per year). These households therefore devote a substantial proportion of their total annual income for energy and are the households that would be the most likely candidates for the small (20 Wp) PV systems. 7. We note that in APL-I the target is only 2,000 systems for this size category, as against 90,301 households in this income group that incur the high cost of batteries, plus another 81,113 households that subscribe to local generator services.8 This implies a modest market penetration assumption of 2.2 percent of those households using batteries. The corresponding market penetration assumption in the poor and nonpoor groups is 9.5 percent and 1.5 percent, respectively. The risk of having overestimated market penetration assumptions is therefore small.
6 The threshold for the nonpoor is an income of P 55,470 per year; but it may be assumed that in
APL-I, it is the better-off households in each class that would be the first candidates for PV systems. Similarly, for the poorest households, we may assume that the initial candidates are those close to the poverty threshold (of P 22,382 per household per year), and similarly in the poor group, we may expect candidate households to be near the upper income limit of the range, that is, close to P 55,470 per year. This means that the present expenditures for kerosene and battery charging are also likely to be higher than the averages used in this report, in turn implying that actual economic benefits are also likely to be higher.
7 Barnes and others (2002). 8 We assume that a household would use one or the other, but not both, because the data suggest that
the annual cost of subscription to a local generator (P 896 in the poorest group) is significantly below that of the car battery alternative (P 1,893).

PHILIPPINES:SOLAR HOME SYSTEMS
4
Table 1: 1998 Average Annual Household Expenditure (Pesos) for Lighting and Electricity
Poorest (1) Poor (2) Nonpoor (3) Kerosene 675
n=845,198823
n=506,782966
n=366,761
Dry cells 566n=560,614
626n=332,528
730 n=273,231
Candles 202
n=33,463197
n=17,321297
n=15,927
Power generators 896n=81,113
1,334n=86,784
1,796 n=82,148
Car batteries (charging) 1,143
n=90,3011,290
n=73,3451,349
n=68131
New battery every two years 750n=90,301
800n=90,301
900 n=90,301
Average across all households in income category 1,562
N=864,4512,330
N=517,0724,937
N=382,139 Target PV systems in APL-I 2,000 7,000 1,000
n Number of households using each device. N Number of households in each income category. (1) Households with income below the first income decile. (2) Above first income decile, but below poverty threshold. (3) Above the poverty threshold of P 55,470 per year.
8. Table 2 shows the breakdown of the assumed PV system capital costs. The assumed dealer gross margin is 100 percent, which is based on the Sri Lanka experience where high margins and good access to consumer credit have resulted in an attractive business environment and a successful PV electrification program. In contrast, gross margins are very low in China because of the lower costs of labor and local materials, and the lower expectations of profits by the rural PV companies. Gross margins are also low in Indonesia where strong pressure keeps prices low because of the lack of consumer financing.
Table 2: Capital Costs of PVs ($US)
Hardware Source 20 Wp 40 Wp 75 Wp PV module Imported 85.00 140.00 240.00 Steel mounting frame and pole Local 5.00 7.00 7.00 Storage battery Local 22.00 25.00 25.00 Charge controller (BCU) Imported 22.00 25.00 25.00 12 Vdc/10W lamps Local 6.00 9.00 9.00 Wirings and installation accessories Local 6.00 8.00 8.00 Total hardware costs 146.00 214.00 314.00 Gross margins 146.00 214.00 314.00 Total retail cost 292.00 428.00 628.00 VAT and duties 29.93 43.62 63.63 Local transport 4.38 6.42 9.42 Installation 4.38 6.42 9.42
Total Installed cost 330.69 484.47 710.47 Assumptions: Unit costs are assumed to be OEM prices to PV systems integrator. OEM prices for local items, such as batteries, are World Bank estimates. Module costs are based on international prices plus shipping to Manila in container loads
9. The PV system prices taken here for the Philippines are higher than prices in other countries that benefit from large volumes (for example, in Sri Lanka,

2. ASSESSING BENEFITS
5
where 10,740 systems were sold in 2001; see table 3). Given that module prices continue to decline steadily (20 percent decline for every doubling of cumulative output in real terms), the risk of higher capital costs over the APL project period is low.
Table 3: Comparison of System Costs ($US), Installed
Philippines IndonesiaSri
Lanka India Kenya20 Wp system 331 302 37 Wp system 270 40 Wp system 484 303 419 307 45 Wp system 509 50 Wp system 300–408 480 360 822 60 Wp 588 75–80 Wp 710 686
Note: Prices include taxes and duties. Results 10. Table 4 shows the results of the economic analysis using replacement costs as the measure of benefits. Rows 1–6 break down the (financial) first cost of the PV system by funding source;9 we then subtract taxes and transfers to derive the economic cost (row 12). For these poorest households, we assume a single hurricane lamp at US$5 (P 51 per U.S. dollar) with three-year life.10 11. Given their magnitude, the treatment of dealer margins is important, because a share of this margin represents transfer payments. Some part (assumed to be 60 percent) of this margin reflects the real (current) cost of doing business, and counts as an economic cost. Another part of the margin reflects the return on equity capital invested up front. The part that is equal to the assumed opportunity cost of capital (15 percent) counts as an economic cost, but any excess (and dealers typically expect 20 percent or more post-tax returns) emerges in the reconciliation of financial and economic costs as a transfer payment (and is so recorded in row 11 of table 4). Moreover, the net margin (that is, net of actual expenses) may be assumed to be subject to corporate income tax (at 32 percent), a financial flow recorded in row 10 of table 4. The resulting economic rate of return (ERR) is 15.2 percent, which is marginally above the hurdle rate used in the Philippines. 12. The financial rate of return (FRR) to the consumer, however, is a very high 150 percent, reflecting the large subsidy component. This suggests that if properly marketed, PV systems with the given GEF and government grant components should find high market acceptability. We examine below alternative subsidy structures.
9 Ten percent down payment, GEF and government grants as defined below, and consumer finance
at 24 percent over five years. 10 Operations and maintenance (O&M) costs for kerosene lanterns are taken as US$0.15 per month
for wick, glass replacement, and so forth. This is based on the 1987 survey data of US$0.12 per month for Rwanda and Burundi (van der Plas and Graff 1988).

PHILIPPINES:SOLAR HOME SYSTEMS
6
Table 4: Economic Analysis for 20 Wp Systems, Poorest Households: Avoided Costs Only
13. Table 5 shows the reconciliation of economic and financial flows expressed as net present values (NPVs) at 15 percent (the discount rate used by the government). The (negative) net economic benefits of +P 344 reflect that the ERR (15.2 percent) is slightly above the discount rate. The financial institutions appear as beneficiaries because the consumer loan rate (24 percent) exceeds the discount rate.11
11 The present value of the loan principal is P 4,485, whereas the present value of the stream of loan
repayments (principal and interest) is P 5,476. These become equal when the consumer finance rate is exactly equal to the discount rate, but here the difference is booked as a net transfer to the financial institutions. We assume this is taxed at the corporate tax rate, with a net surplus of P 674 as shown in the last row of table 5.
poorest households: 20Wp system 15% =discount rate[unit] NPV 1 2 3 4 5 6 7 8 9 10
1 costs of PV system2 down payment [peso] 719 8273 GEF [peso] 2217 25504 Govt.Grant [peso] 6957 80005 loan principal [peso] 4485 51586 finanancial cost [peso] 14378 165357 finance [peso] 5476 1879 1879 1879 1879 18798 loan repayments [peso] -5476 -1879 -1879 -1879 -1879 -18799 lessVAT&duties [peso] -1301 -1497
10 less income tax on margin [peso] -813 -93411 less transfers [peso] -863 -99312 economic capital cost [peso] 11401 13111 0 0 0 0 01314 O&M costs15 bulbs [peso] 508 100 100 100 100 100 100 100 100 10016 controller [peso] 388 60017 battery [peso] 3473 1500 1500 1500 150018 financial cost to consumer [peso] 4370 0 100 1600 100 1600 700 1600 100 1600 10019 less VAT [peso] -437 0 -10 -160 -10 -160 -70 -160 -10 -160 -1020 economic O&M costs [peso] 3933 0 90 1440 90 1440 630 1440 90 1440 9021 Total economic costs [peso] 15333 13111 90 1440 90 1440 630 1440 90 1440 902223 benefits at avoided costs24 kerosene consumption [litres] 260 51 51 51 51 51 51 51 51 5125 kerosene [peso] 3433 675 675 675 675 675 675 675 675 67526 battery&charging expenditure [peso] 9625 1893 1893 1893 1893 1893 1893 1893 1893 189327 dry cell expenditures [peso] 2878 566 566 566 566 566 566 566 566 56628 hurricane lamp [peso] 577 255 255 255 25529 petromax lamp [peso] 0 0 0 030 wick, gauzes [peso] 467 92 92 92 92 92 92 92 92 9231 total, financial [peso] 17240 255 3226 3226 3481 3226 3226 3481 3226 3226 348132 kerosene duties [peso] -208 -41 -41 -41 -41 -41 -41 -41 -41 -4133 VAT [peso] -1355 -26 -255 -255 -281 -255 -255 -281 -255 -255 -28134 avoided costs, economic [peso] 15678 230 2930 2930 3160 2930 2930 3160 2930 2930 31603536 Net economic flows [peso] 344 -12881 2840 1490 3070 1490 2300 1720 2840 1490 307037 ERR [ ] 15.2%38 net f inancial impact on consumers39 PV system [peso] 10565 827 1979 3479 1979 3479 2579 1600 100 1600 10040 Replacement [peso] 16980 255 3226 3226 3481 3226 3226 3481 3226 3226 348141 net flow [peso] 6415 -572 1247 -253 1502 -253 647 1881 3126 1626 338142 FRR [ ] 149.4%
2. ASSESSING BENEFITS
7
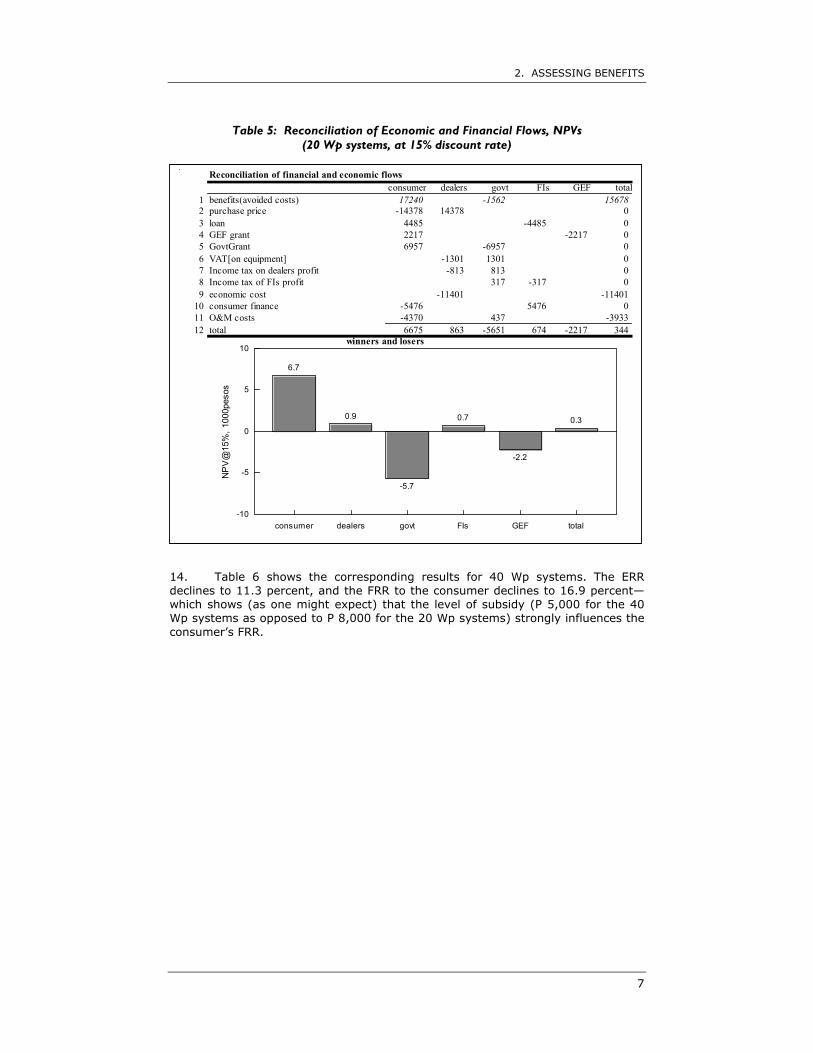
Table 5: Reconciliation of Economic and Financial Flows, NPVs (20 Wp systems, at 15% discount rate)
14. Table 6 shows the corresponding results for 40 Wp systems. The ERR declines to 11.3 percent, and the FRR to the consumer declines to 16.9 percent—which shows (as one might expect) that the level of subsidy (P 5,000 for the 40 Wp systems as opposed to P 8,000 for the 20 Wp systems) strongly influences the consumer’s FRR.
Reconciliation of financial and economic flowsconsumer dealers govt FIs GEF total
1 benefits(avoided costs) 17240 -1562 156782 purchase price -14378 14378 03 loan 4485 -4485 04 GEF grant 2217 -2217 05 GovtGrant 6957 -6957 06 VAT[on equipment] -1301 1301 07 Income tax on dealers profit -813 813 08 Income tax of FIs profit 317 -317 09 economic cost -11401 -11401
10 consumer finance -5476 5476 011 O&M costs -4370 437 -393312 total 6675 863 -5651 674 -2217 344
winners and losers
-10
-5
0
5
10
6.7
0.9
-5.7
0.7
-2.2
0.3
NP
V@
15%
, 100
0pes
os
consumer dealers govt FIs GEF total

PHILIPPINES:SOLAR HOME SYSTEMS
8
Table 6: Economic Analysis: 40 Wp Systems

2. ASSESSING BENEFITS
9
Table 7: Economic Analysis: 75 Wp Systems (non-poor households)
15. For the 75 Wp system (table 7), the ERR declines further to 8.4 percent; more importantly, the FRR for the consumer is a very low 1.2 percent. However, the PV system will bring much higher levels of service, reflected in the high willingness-to-pay of nonpoor households for PV systems in other countries: this consumer benefit—the increase in consumer surplus—is not captured here. The results of table 7, however, do raise questions about the proposed subsidy structure: the government grant is proposed to be extended only to the poorest

PHILIPPINES:SOLAR HOME SYSTEMS
10
and poor groups. But because of the capital intensity of the larger PV systems, the net result for the larger 75 Wp systems is an increase in government revenue, as the increase in PV system–related value added tax (VAT) and income tax on large dealer margins exceeds the loss of revenue from VAT and kerosene duty of the unelectrified household. Indeed, it should be noted that even if consumer surplus benefits were included (as in the next chapter), the (positive) fiscal balance for government remains unchanged for the 75 Wp systems. VAT Exemption 16. Table 8 shows the impact of the proposal to exempt PV systems from VAT. Clearly, elimination of VAT on the PV modules is tantamount to an increase of the capital grant—for example, in the case of 20 Wp systems, from P 8,000 to P 9,477 (or from P 5,000 to P 7,194 for 40 Wp systems). Because this directly affects the first-year cash flows, the FRR shows significant increases. In the case of 75 Wp systems, however, the VAT exemption would still not be sufficient to bring the consumer FRR (based on replacement costs only) to a value comfortably above the hurdle rate.
Table 8: Impact of VAT Exemption on Consumer FRR: System Only
VAT amount (1)
(pesos) 10% VAT (%) VAT exempt (%) Change (%) 20 Wp 1,497 150 308 +158 40 Wp 2,194 16.9 26.5 +9.6 75 Wp 3,219 1.2 3.6 +2.4
17. If the VAT exemption were extended to replacement batteries (table 9), the financial internal rate of return (FIRR) would increase further, but not significantly.
Table 9: Extending VAT to Batteries
FIRR, system only
(%)
FIRR, system plus batteries
(%) 20 Wp 308 314 40 Wp 26.5 28 75 Wp 3.6 4.1
This analysis suggests the following:
• Extending the exemption to batteries has an insignificant effect on consumer FIRR (which would be true even if the FIRR considered consumer surplus benefits as well).
• The VAT exemption on PV modules is monetarily equivalent to increasing the capital grant: a P 1,000 decrease in VAT is equivalent to a P 1,000 increase in capital grant (although slight differences in transaction costs may not be reflected in our calculations).12
12 However, Mostert (2002) argues that a direct capital subsidy has a stronger incentive effect on
purchases than tax rebates having the same subsidy value, because it is more transparent for investors and voters (although this lack of transparency may be also be seen as an advantage). By contrast, an advantage of tax rebates is the avoidance of a separate bureaucracy for the administration of subsidy payments. A detailed study of subsidy policy for rural electrification in the Philippines is currently under way (Patalinghug, Mendoza, and Alonzo 2002).

2. ASSESSING BENEFITS
11
Capital Grant Subsidy 18. The present proposal for subsidies is P 8,000 for 20 Wp systems, P 5,000 for 40 Wp systems, and zero for 75 Wp systems. These subsidy levels reflect the perception that it is the poorest households, and therefore 20 Wp systems, that are most worthy of subsidy support. As shown in table 10, however, the subsidy on the 20 Wp system is more than twice that for 40 Wp systems as a fraction of the upfront financial cost, which in turn has a disproportionate effect on the FIRR.
Table 10: Impact of Subsidy Structure on the FIRR
Proposed subsidy (pesos)
Financial first cost
(pesos) Percent
of first cost FIRR (%) 20 Wp 8,000 16,535 48 160 40 Wp 5,000 24,235 21 17.9 75 Wp 0 35,560 0 1.6
19. This raises the obvious question: Is the subsidy proposed for the poorest households too large? For poor households (40 Wp), the 17.9 percent FRR appears reasonable, and for the nonpoor households, experience in other countries suggests a high willingness-to-pay (based on consumer surplus) to offset the narrowly defined FIRR based on replacement cost. 20. Clearly, it is reasonable that even the poor households should experience some negative cash flow in the first year, as an incentive to take care of the system. However, as shown in figure 1, even at the P 8,000 subsidy level, there remain two further years of negative cash flow (for battery replacements in years 1–5 when the loan payments are still being made). Any reduction of the subsidy would therefore worsen the magnitude of these negative years.
Figure 1: Annual Consumer Cash Flows, 20 Wp System
21. Before we can properly assess the subsidy structure as a whole (in chapter 6), however, we need a better characterization of the economic benefits, to which we turn in the next chapter.
-1
0
1
2
3
4
1000
P
1 2 3 4 5 6 7 8 9 10 11 12 13 14 14 15
12
3. ASSESSING BENEFITS AS CONSUMER SURPLUS CHANGES ______________________________________________________ 22. Experience in other countries shows a high willingness–to-pay for the improved level of lighting provided by PV. Yet as noted, the analysis of the previous chapter does not take into account the benefits of the higher levels of services provided (for example, in the case of lighting, more lumens delivered, or in the case of radio/cassette, more hours of listening). These benefits are represented by the increase in consumer surplus.
Figure 2: The Demand for Lumen-hours
23. Estimating consumer surplus requires knowledge of the demand curve. This can most easily be illustrated by the demand curve for lumen-hours shown in figure 2. Initially, lumens are provided by kerosene lamps, with QKERO lumen-hours consumed at the price PKERO. The total benefit is the area under the demand curve to the point β (that is, the area A+B+D); the cost of delivering QKERO lumen-hours is the price of kerosene times quantity consumed (the area B+D), leaving the area A as the net benefit of consuming QKERO lumens—the so-called consumer surplus. 24. Suppose lumens can be delivered from a PV system at the (lower) cost PPV. At this lower cost, the quantity of lumens consumed increases to QPV. At this level of consumption, the corresponding consumer surplus is A+B+C, with an increase (over kerosene-based lighting) of B+C. This represents the net benefit of the PV system.
Q KERO
A
B
C
D E
QPV
P KERO
P PV
lumen-
Price
α
β

3. CONSUMER SURPLUS
13
Issues 25. The main difficulty of this approach is that only one point of the demand curve is known with reasonable certainty, namely, the point α, which is readily measurable from survey data of unelectrified households. Data from other countries may give guidance on point β, because it is possible to observe the changes in lumen consumption where PV systems are already in place (for example, from the successful PV program in Sri Lanka). Extrapolation to the Philippines, however, necessarily involves some uncertainty. 26. Even with an estimate of point β in hand, calculation of the area C requires knowledge of the shape of the demand curve in the range of QKERO to QPV. It is often assumed that the demand curve is linear,13 but if the demand curve is concave (with respect to the origin), then all other things equal, the area C will be much smaller.14 The curve as drawn reflects the assumption made in this analysis, namely, of constant elasticity (as derived below), which results in more realistic estimates of consumer surplus benefits. 27. A second issue concerns the assumption that the demand curve is independent of any changes in the price and consumption of goods or services that may be complements to or substitutes for electricity (World Bank 2002). The demand curve could be expected to shift to the right (that is, greater demand for given price) if complements for electricity consumption—such as the availability of the services of electrical appliances—become less expensive. The demand curve would shift to the left (that is, lower demand at a given price) if fuels that may substitute for electricity become cheaper—although that is hardly likely in the case of lighting, which is the main focus of this analysis. 28. A third issue relates to income effects: as income increases, the aggregate demand curve shifts to the right. Therefore, rather than using a single aggregate demand curve, we estimate separate demand curves for each of the categories of the three-way income classification used in the survey—poorest, poor, and nonpoor. This is the conservative assumption, because if incomes increase over the project lifetime, economic benefits will also increase.15 29. Thus assumptions on these matters are unavoidable, given the lack of empirical data from cross-country studies. However, calculation of the relevant switching values can provide an indication of the robustness of returns to the assumptions made (see example in table 15). 30. This analysis simplifies a number of important aspects. First, the quantity of lumens is not the sole determinant of consumer utility, because a lumen delivered from a smelly and possibly dangerous kerosene lamp would be valued less than a lumen from a PV system. Thus, as in the case of electricity, the improved quality of PV-generated lumens is an additional value not captured in the above analysis.
13 For example, the consumer surplus estimates in the World Bank’s analysis of the Philippines
survey data assumes such linearity. 14 The World Bank report (2000) notes that if the demand curve is convex with respect to the origin,
calculation of the area C, assuming linearity, will underestimate the true value. It would be rare, though, for a demand curve to have a convex shape, so the assumption of linearity is much more likely to result in an overestimate of the consumer surplus than an underestimate. Note also that the shape of the demand curve above point α, or to the right of point β, does not affect the calculation of changes in consumer surplus (which occurs between these two points).
15 However, the benefits are subject to the upper bound of the watt-hours that the given system initially purchased would produce. One of the few advantages of kerosene is that output can be increased by small increments (purchase of a an additional lamp) as lighting demand rises.
PHILIPPINES:SOLAR HOME SYSTEMS
14
31. Kerosene lighting also contributes to indoor air pollution damage costs, whose avoidance is a benefit to the PV system. The incremental contribution to indoor pollution levels from kerosene lighting may be difficult to identify, given the much higher contribution from wood-based cooking stoves, but it is certainly not zero. Kerosene lighting also causes a significant number of burn injuries, house fires, and related deaths; these impacts are discussed further below. 32. Other indirect benefits exist that can plausibly be claimed as a benefit of PV systems, for which there is significant logical rationale and anecdotal evidence, but which still lack the necessary research studies to permit monetization. These include:
• Income effects: For example, traders in India who used solar lanterns at their roadside stalls found that the quality of lighting and absence of kerosene fumes attracted more customers during the main early evening business hours, with 50 percent increases in their daily income (Rs 50–100/day).16
• Educational benefits: The Philippines survey data show that members of electrified households attain about two years more formal education than their unelectrified counterparts, resulting in earnings increases of US$37–45/household.17 SHSs may result in a somewhat smaller impact on reading and studying habits than full electrification, but again, the effect is unlikely to be zero.
33. It should be noted that the consumer surplus calculations are done in terms of financial prices (because these are the prices to which consumers respond and make their decisions). Financial and economic flows must therefore be reconciled in order to assess economic benefits, in the manner shown in box 1.
Other Studies 34. The general framework as depicted in figure 2 has been applied in similar projects elsewhere. For example, in the Implementation Completion Report (ICR) for the Indian Renewable Resources Development Project (Meritec Ltd. 2002), the economic analysis uses an estimate of benefits of 20Rs/kWh (about US$0.40 per kWh at the current exchange rate) for the consumer surplus, resulting in a 30 percent ERR without global environmental benefits (and 108 percent with global benefits). With only the cost of replacement kerosene as the measure of benefits, the ERR was lower at 15 percent (60 percent with global benefits). 35. On the other hand, the Sri Lanka Renewable Energy for Rural Development Project (World Bank 2002) omits an economic analysis altogether for the case of the solar homes component:
In this case [solar homes] there is little difference between a financial and economic computation. It can safely be assumed that the economic rate of return would be higher than 12% since the economic benefits are likely to be much higher than the mere replacement cost of kerosene. For example, the indirect benefits of replacing kerosene with solar lighting—between quality of lighting, higher safety and freedom from air pollution—are not captured in the financial benefit evaluation. Given these factors and uncertainty about the valuation of actual benefits, a separate EIRR [Economic Internal Rate of Return] calculation for solar has not been presented here.
16 Meritec Ltd. (2002), p. 41. 17 World Bank (2002), paras. 6.25–6.27.

3. CONSUMER SURPLUS
15
Box 1: Reconciling Economic and Financial Costs
The consumer surplus calculations are done using financial costs (since these are the costs actually seen by the consumer). However, the financial and economic costs require careful enumeration. The figure below illustrates the reconciliation in terms of the demand curve for lumen-hours, in a situation in which the cost of PV systems is both subject to subsidy of δ (equal to PPV[econ] - PPV[subs] equivalent to the area δQPV ), as well as taxed (for example, VAT on sales), which raises the price from PPV[subs] to the retail price PPV (equal to the area D* + E*). As drawn, the assumption is that the subsidy exceeds related taxes: but as noted in the text, for 75 Wp systems, taxes exceed the subsidies. For kerosene, the total (financial) cost to the consumer is B*+ B + D* + D. Of this, the area B* represents taxes (for example, 10% VAT, customs duty). For PV, the total cost to the consumer is D + D* + E + E*, of which D* + E* represents taxes and duties (for example, VAT, duties on imported components).
Q KERO
A
B
C
D E
QPV
P KERO
P PV
lumen-hours
Price
D* E*
P KERO [economic
B*
P PV[econ]
P PV[SUBS
δ
In tabular format, the reconciliation is as follows: Kerosene PV Difference Consumer surplus A A+B*+B+C B+B*+C
Taxes and duties (VAT) B* D*+E* D*+E*-B* PV system subsidy -δQPV -δQPV Economic cost B+D*+D D+E+dQPV +E+dQPV
-B-D* Total benefit to consumer (area under demand curve)
A+B*+B+D*+D A+B+B*+C+ D*+D+E*+E
C+E*+E

16
4. CONSUMER SURPLUS BENEFIT ESTIMATES 36. Calculation of the demand curve requires numerical estimates of four quantities (in the case of a linear demand curve): PKERO, PPV, QKERO and QPV. The price of kerosene-based lumen-hours, PKERO, follows from survey consumption data and the reconciliation of kerosene consumption and lighting output shown in table 11.
Table 11: Calculation Lumen-hours per Day (QKERO)
20 W system 40 Wp system 75 Wp system Annual kerosene consumption Liters/year] 51 64.2 74.5 Annual kerosene cost Pesos/year 675 849 986 Daily consumption Liters/day 0.14 0.18 0.20 Hurricane lamp Liters/hour 0.04 0.04 0.04 Operating
hours/day 3.49 4.40 0.50
Lumens/hour 40 40 40 Lumen-hours/day 140 176 20 Liters/day 0.14 0.18 0.020 Petromax lamp Liters/hour 0.08 Operating
hours/day 2.3
Lumens/hour 400 Lumen-hours/day 921 Liters/day 0.184 Total lumen-hours/day Lumen-hours/day 140 176 941
Note: Petromax lamps consume about twice that of a hurricane lamp, but produce 10 times the lumen output (that is, 400 lumens per hour versus 40). Non-poor households are assumed to have one Petromax and one hurricane lamp, whose utilization is taken as 2.3 and 0.5 hours per day, respectively (so as to reconcile with the known data on average daily consumption).
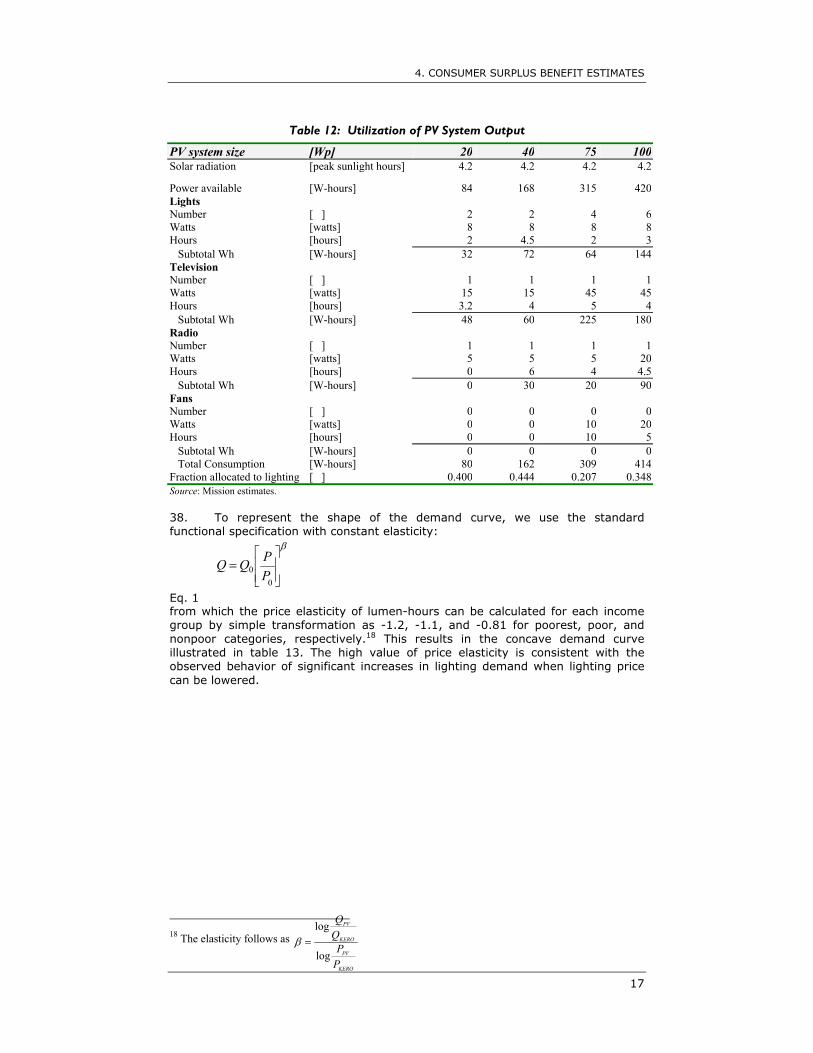
37. To estimate the quantity of lumen-hours available from the PV system for lighting (and other uses) requires assumptions about consumer behavior that may be derived from the survey data shown in table 12. The resulting watt-hour calculations must reconcile with the available watt-hours based on the peak output of each system. This reconciliation then provides a basis not only for estimating the quantity of lumen-hours available (QPV), but also the proportion of the total PV system cost that may be allocated to lighting. For example, for the poorest households, 40 percent of the output (and cost) is allocable to lighting.
4. CONSUMER SURPLUS BENEFIT ESTIMATES
17
Table 12: Utilization of PV System Output
PV system size [Wp] 20 40 75 100 Solar radiation [peak sunlight hours] 4.2 4.2 4.2 4.2
Power available [W-hours] 84 168 315 420 Lights Number [ ] 2 2 4 6 Watts [watts] 8 8 8 8 Hours [hours] 2 4.5 2 3 Subtotal Wh [W-hours] 32 72 64 144 Television Number [ ] 1 1 1 1 Watts [watts] 15 15 45 45 Hours [hours] 3.2 4 5 4 Subtotal Wh [W-hours] 48 60 225 180 Radio Number [ ] 1 1 1 1 Watts [watts] 5 5 5 20 Hours [hours] 0 6 4 4.5 Subtotal Wh [W-hours] 0 30 20 90 Fans Number [ ] 0 0 0 0 Watts [watts] 0 0 10 20 Hours [hours] 0 0 10 5 Subtotal Wh [W-hours] 0 0 0 0 Total Consumption [W-hours] 80 162 309 414 Fraction allocated to lighting [ ] 0.400 0.444 0.207 0.348 Source: Mission estimates. 38. To represent the shape of the demand curve, we use the standard functional specification with constant elasticity:
β
=
00 P
PQQ
Eq. 1 from which the price elasticity of lumen-hours can be calculated for each income group by simple transformation as -1.2, -1.1, and -0.81 for poorest, poor, and nonpoor categories, respectively.18 This results in the concave demand curve illustrated in table 13. The high value of price elasticity is consistent with the observed behavior of significant increases in lighting demand when lighting price can be lowered.
18 The elasticity follows as
KERO
PV
KERO
PV
PP
log
log=β

PHILIPPINES:SOLAR HOME SYSTEMS
18
Table 13: Consumer Surplus Estimate, 20 Wp System for the Poorest Households
source: Note: results calculated over 15-year assumed lifetime for PV system (but only years 1-10 shown for clarity)

4. CONSUMER SURPLUS BENEFIT ESTIMATES
19
Results 39. The resulting consumer surplus in area C is significantly lower than that which follows from the common assumption of linearity.19 For example, for the poorest households using the assumed elasticity of -1.2, the area C calculates to P 1,053 (as an annual quantity), as opposed to P 2,723, assuming linearity.20 Using exactly the same procedure, we also calculate the consumer surplus benefits associated with television viewing—which, as noted, accounts for significant costs of battery charging (or subscription to local diesel generators) in unelectrified households.21 40. The ERR, taking into consideration the consumer surplus benefits, is 45 percent, which, as expected, is significantly higher than when only replacement costs are considered. Figure 3 shows the beneficiaries (as NPVs over the 15-year lifetime for a single system). Sources of funds and subsidies are shown as negative quantities in this chart.
Figure 3: Beneficiaries: 20 Wp Systems
41. We note the predominance of television benefits (P 33,670) over those of lighting (P 9,300), a result that follows from the allocation of PV system output (of table 13). Figure 4 shows the sensitivity of ERR to this assumption—which changes little.22
19 The area (C+E) under the demand curve eq. 1 follows as the definite integral
β
β
β
β
β /11
/11
/1
/1
/1+
+
==+ ∫Q
QPdQQ
QPEC
PVQ
KEROQ
PVQ
KEROQo
o
o
o
20 If the area C is zero, the consumer surplus reduces to the change in financial costs (that is, area
B+D=881 for kerosene, and D+E=831 for PV, a gain of 50). 21 Barnes and others 2002. Table 6.4 states that viewing hours per month in unelectrified households
using a battery is “1.85 hours per month.” This implies 4 minutes per day—which hardly justifies the high cost of a battery. We therefore make the assumption that with a battery, an average of 1 hour per day of television viewing is possible, as opposed to 3.2–5 hours per day for PV systems (as per table 10).
22 Although our assumptions appear plausible and consistent with observed behavior elsewhere, there is a lack of reliable survey information. Improving the database has high priority, and resources should be set aside in the Philippines project to collect the necessary information by follow-up surveys conducted one, two, three, and five years after installation. Ideally, households seeking grants for PV systems should be made to complete a survey on their pre-electrification habits as well. Such an ongoing data collection process would also facilitate the ICR.
-20
0
20
40
60
0.9 -5.7 0.7-2.2
lighting:9.3
TV/radio:33.7
36.6
NP
V@
15%
, 10
00p
eso
s
consumer dealers govt FIs GEF total

PHILIPPINES:SOLAR HOME SYSTEMS
20
Figure 4: Sensitivity of ERR to Allocation Fraction
Of interest is the robustness of the economic returns to other key uncertainties:
• The capital cost of the PV system. • The television viewing hours provided by the PV system. • The lumen-hours provided by the PV system (QPV). • The kerosene price (as influenced by changes in the world oil price). • The actual life of the system.
Impact of Kerosene Price 42. Higher kerosene prices imply higher avoided costs, and hence larger economic benefits. Indeed, since the survey year of 1998, when oil prices were atypically low (Singapore spot prices for kerosene in mid-1998 were around US$16 per barrel), oil prices have almost doubled, and then fallen some (the present price is around US$26 per barrel). However, for the poorest and poor households with little disposable income, increases in kerosene prices would most likely imply a downward adjustment of consumption rather than an increase in annual kerosene expenditure. Table 14 compares the daily lumen-hours at US$16 and US$30 per barrel, which for the poorest households under an expenditure constraint implies a reduction in daily lumen-hours from 140 to 111.
Table 14: Adjustment to Higher World Oil Prices: Poorest Households
Singapore kerosene spot price [US$/bbl] 16 30 [Pesos/bbl] 640 1200 [Pesos/liter] 4.03 7.55
Freight and margins at 1998 values [Pesos/liter] 8.40 8.40 Taxes [Pesos/liter] 0.80 0.80 Retail price [Pesos/liter] 13.23 16.75 Expenditure constraint [Pesos/year] 675 675 Consumption [Pesos/liter] 51 40 Ratio of consumption [ ] 0.79 Lumen-hours/day [lumen-hours/day] 140 111
0
10
20
30
40
50
Fraction allocated to lighting
ERR
0.4 0.5 0.6

4. CONSUMER SURPLUS BENEFIT ESTIMATES
21
43. With the replacement cost of kerosene assumed constant, the ERRs based on avoided costs obviously do not change. One might expect, however, that the consumer surplus estimates of benefit would increase, because the initial kerosene lumen-hours decrease. Figure 5 depicts this adjustment graphically: the areas U+V=675 for the 16$/bbl price must equal U+Y for the US$30 per barrel price (because the kerosene expenditure is assumed constant).
Figure 5: Adjusting to Higher Kerosene Prices:
Lumen-hour Demand Curve for Poorest Households
44. Even an increase to US$30 per barrel affects the consumer surplus-based ERR estimates very little—an additional 1 percent on ERR. This is because the area Y+Z is quite small as a percentage of the total gain in consumer surplus (Y+Z+U+V+W). We conclude that the economic benefits are not sensitive to world oil price changes, under the conservative assumption of a household expenditure constraint. Sensitivity Analysis 45. Figure 6 shows the sensitivity of FIRR and ERR to PV system life. For the ERR based on consumer surplus, returns are robust down to seven years for the large systems, and four years for the smaller systems. This is because the consumer surplus benefits of increased lighting and television viewing are so large (and the first few years of which determine the magnitude of the ERR). For both the replacement cost–based ERR and the FRR, the curves are relatively flat in the 10–15 year range. 46. The sensitivity of the economic returns to the other three assumptions is measured by calculating the relevant switching values (table 15), which are the values of the variable in question that make the ERR equal to the hurdle rate—assumed here as the opportunity cost of capital at 15 percent.
QKERO=111 QPV
PKERO(30$/bb)
PPV
price
QKERO=140
PKERO(16$/bb)
X
Y
U V
Z
W

PHILIPPINES:SOLAR HOME SYSTEMS
22
Table 15: Switching Values, 20 Wp System
Base value (as in table
14) Switching
value
ERR at Switching value (%)
Capital cost (equipment) in pesos 7,300 38,690 15 Q(TV) as viewing hours/day 3.2 0.28 15 Q(PV) as lumen-hours/day 1,120 140 33
47. The switching values confirm the robustness of the benefits of 20 Wp systems. We have already noted that the risks of PV equipment costs increasing are very small—but even in the remote case that these would increase over time, a 530 percent increase would be needed to bring the ERR to the hurdle rate. Indeed, this subsumes the possible impact of peso devaluation, given that 73 percent (see table 2) of the equipment cost is imported: even a 100 percent change in the exchange rate would do little to impair the (consumer surplus-based) economic returns of the PV system. 48. The hurdle rate is reached if the television viewing hours were reduced to 0.28 hours per day, rather than the 3.2 hours assumed in the base case. Such a reduction would imply serious PV system problems—but for output to be permanently 10 percent below the reference value would imply significant defects in manufacture or maintenance—which experience elsewhere (for example, Sri Lanka) suggests is quite unlikely. Similarly for lighting output—even if it were reduced to that of kerosene—the ERR is still 33 percent. 49. This switching values analysis varies one assumption at a time. Suppose, however, that all the assumptions in the reference case were optimistic. Table 16 shows such a pessimistic scenario, with a 25 percent capital cost increase for PV system equipment and a 30 percent reduction in lumen-output and a 30 percent reduction of television viewing hours. These assumptions taken together reduce the ERR to 26.8 percent, still comfortably above the hurdle rate.
Table 16: Pessimistic Scenario
Pessimistic Reference Capital cost 9125 7300 QTV 2.24 3.2 QPV 784 1120 ERR 26.8% 45%
50. This analysis suggests that despite the various uncertainties, the economic benefits of the PV system are robust for the case of the 20 Wp systems that are targeted at the poorest households.

4. CONSUMER SURPLUS BENEFIT ESTIMATES
23
Figure 6: Sensitivity to PV System Life
20Wp system
-1
-0.5
0
0.5
1
1.5
2
ERR, REPLACEMENT COSTS
ERR, CONSUMER SURPLUS
FRR
HURDLE RATE=15%
PV system life, years
Rat
e of
Ret
urn
3 4 5 6 7 8 9 10 11 12 13 14 15
75Wp system
-0.4
-0.2
0
0.2
0.4
ERR, REPLACEMENT COSTS
ERR, CONSUMER SURPLUS
FRR
HURDLE RATE=15%
PV system life, years
Rat
e of
Ret
urn
3 4 5 6 7 8 9 10 11 12 13 14 15

PHILIPPINES:SOLAR HOME SYSTEMS
24
Results for Larger Systems 51. Tables 17 and 18 replicate the above analysis for the larger 40 Wp and 75 Wp systems, with baseline ERRs of 46.6 percent and 32.2 percent, respectively.
Table 17: Poor Households: 40 Wp System

4. CONSUMER SURPLUS BENEFIT ESTIMATES
25
Table 18: Nonpoor Households: 75 Wp Systems

PHILIPPINES:SOLAR HOME SYSTEMS
26
52. Table 20 compares the estimates of consumer surplus with expenditures before and with the PV systems, and with household income, for the case of 75 Wp systems. The total consumer surplus estimate is US$119, or US$9.90 per household per month. This is substantially lower than the estimate of US$56.4 per household per month in the ESMAP report for the Philippines (World Bank 2002)—but the latter is for full electrification, rather than for the lower levels of service provided by a 75 Wp PV system. Although our estimates of net benefits are high, they are supported by an observed willingness-to-pay in other countries. The increases as a fraction of household income are in proportion to the dramatic improvement in the quality of life experienced by households previously using kerosene and batteries.
Table 20: Comparison of Consumer Surplus Estimates, 75 Wp Systems
Before With PV systemPesos Pesos US$
Lighting expenditure 1,811 1,473 n.a.Consumer surplus n.a. 1,757 34TV expenditure 2,979 5,639 n.a.Consumer surplus 4,291 84 Total 4,790 13,160 119Household income 60,000 60,000 n.a. Total, as % of household income 8% 22% n.a.
n.a. Not applicable. 53. Inspection of the distributions of the economic benefits shown in figures 7 and 8 reveal several important points. First, for both systems, the consumer surplus benefits for television and radio exceed those for lighting—which is a reflection of the high willingness-to-pay for television—and particularly for color television, which is made possible by the 75 Wp system. Second, in the case of the 75 Wp systems, the lighting benefits are only half those of the 40 Wp systems. This is because nonpoor households are assumed to use Petromax lamps, which provide significantly more lumens per peso of kerosene expenditure than do hurricane lamps (used by the poor). Consequently, the improvement in lighting service for poor households (40 Wp systems) is very much greater than that for the nonpoor.23
Figure 7: Beneficiaries, 40 Wp Systems
23 Note the very different shape and position of the lighting demand curves in tables 17 and 18.
-20
0
20
40
60
1.3-1.9
1.5 -4.4
lighting:17.6
TV/radio:35.249.3
NP
V@
15%
, 10
00p
eso
s
consumer dealers govt FIs GEF total

4. CONSUMER SURPLUS BENEFIT ESTIMATES
27
Figure 8: Beneficiaries, 75 Wp Systems
54. The switching values analysis for the larger systems differs little from that displayed in table 15 for the 20 Wp systems. Table 19 compares the results for the three systems under the three sets of assumptions: benefits at replacement costs, and consumer surplus benefits of lighting under reference and pessimistic assumptions.
Table 19: Pessimistic Scenario Comparisons: ERR
Benefits at avoided
costs only (%) Consumer surplus benefit
Reference (%) Pessimistic
scenario (%) 20 Wp systems 15.2 45 27 40 Wp systems 11.3 47 25 75 Wp systems 8.4 32 16
55. We conclude that the economic benefits of PV systems are robust even without consideration of externalities and are substantially above risk-adjusted hurdle rates. The risks of returns falling to unsatisfactory levels are quite small and certainly unrelated to the physical and economic aspects of the project design.
-10
0
10
20
30
40
1.94.4 3.4
-5.0
lighting:8.9
TV/radio:21.8
35.5
NP
V@
15%
, 10
00p
eso
s
consumer dealers govt FIs GEF total

28
5. EXTERNALITIES __________________________________________________________________ 56. PV system–generated electricity avoids the air emissions associated with kerosene lighting. The avoided damage costs represent a benefit, which needs to be considered in the economic analysis. Other negative impacts of kerosene whose avoidance is not included in the above analysis include occasional burn injuries, bad odors, and the inconvenience of having to buy and store the fuel. Their monetization, even if possible, would be so small that they would make no material difference to the economic analysis. However, in the case of avoided air emissions, the avoided damages do make a significant difference to the economic analysis, notably in the case of carbon emissions.24 Local Air Pollution 57. It has been argued that kerosene lamps represent a small fraction of total indoor air emissions, particularly in poor households that use fuelwood for cooking. Even where liquefied petroleum gas (LPG) is introduced to replace fuelwood (or where improved cookstoves with chimneys are introduced), kerosene lamp–based emissions would represent a small part of the total. And if the fraction of emissions is small, health damages may be smaller still, given that fuelwood emissions generally contain higher fractions of carcinogenic compounds. Indeed, the World Bank survey noted weak evidence of a health effect for grid-based rural electrification.25 58. The argument that these damages represent a small fraction of the total does not necessarily also constitute an argument that they are not worth considering (particularly given some of the problems in self-reporting of symptoms or illnesses in surveys). Rather, the problem is that uncertainties in the shape of the damage function make estimates speculative. For example, if the reduction of emissions occurs to the right of any significant threshold effects, even a small marginal reduction may be significant. By contrast, if, say, replacement of fuelwood based cooking by LPG lowers emissions to the left of any threshold effect, further reductions of kerosene-based emissions would be unimportant. 59. Given the high level of uncertainty and the absence of a detailed heath damage study, the local effects of air-emissions are not considered in this economic analysis. However, it is unlikely that these benefits are actually zero. Health Benefits 60. A significant social and human cost of kerosene lighting is that of burn injuries. Although they are hard to quantify, their widespread incidence make them more than just anecdotal: in Sri Lanka, it is estimated that 50 percent of burn injuries are attributable to accidents involving kerosene lanterns and candles, of
24 As noted earlier, for example, in the case of Indian solar homes, the ERR was claimed to have
increased from 30 percent to 108 percent when global environmental benefits were considered. 25 The survey noted the following, based on self-reported illnesses and symptoms: “A relationship
between rural electrification and avoided school days missed during a three-month period [could be established]. However, there did not seem to be any similar health benefits for adults in terms of avoided lost work days. These results may suggest the need for more detailed and reliable health questions in future surveys.” (World Bank 2002, p. 73.)

5. EXTERNALITIES
29
which a substantial fraction occurs to children.26 Similar problems are reported in many other countries.27 In the Philippines, numerous reports of deaths have been reported from fires caused by kerosene lamps.28 Indeed, such instances may well be most frequent among the poorest families where homemade kerosene lamps are reported. 61. This is an important area for further research, because burn injuries and child deaths have high social costs whose avoidance should be counted as one of the benefits of rural electrification in general (and solar PV systems in particular). Indeed, such direct costs may be easier to ascertain, and most likely of greater magnitude, than those related to local air pollution. Global Externalities 62. Although the treatment of GEF grants in the financial analysis (where they represent a source of funds) is straightforward, their treatment in the economic analysis needs care. The Bank’s procedures (OP 10.04) for the calculation of the ERR to be reported in the Project Appraisal Document (PAD) requires that the global environmental benefit be taken as the amount of the GEF grant (in the years the grants are actually received). As we note below (chapter 8), this results in the project ERR increasing from 44.6 percent to 53.2 percent. 63. As a matter of theory, however, there are problems with this approach, notwithstanding that GEF grants (or carbon purchases by the Prototype Carbon Fund) do reflect the actual global willingness-to-pay for carbon reduction. In our case, the proposed GEF subsidy for APL-I is US$2.50 per Wp for systems of 50 Wp or less, and US$1.50 per Wp for systems larger than 50 Wp. Clearly the actual carbon benefit is not a function of the installed capacity of the PV systems built, but rather of greenhouse gas (GHG) emissions avoided (and is therefore certainly not inversely proportional to Wp installed!).29 Table 21 shows the implied cost of avoided carbon for the three different systems, which are significantly different.
Table 21: Cost of Avoided Carbon (kerosene replacement only)
GEF grant 15year carbon
saving US$/ton C Peso US$ Kg US$/ton
20 Wp 2550 50 1443 35 40 Wp 5100 100 1816 55 75 Wp 5738 113 9710 12
26 At the Burns Unit of the Lady Ridgeway Children’s Hospital (established in December 2000), by
August 2001, 176 children had been treated for burn wounds. The majority of the victims were from the unelectrified rural villages of Chilaw, Puttalam, and Karapitiya that are dependent on kerosene for lighting (Sri Lanka Sunday Observer; September 23, 2001; Colombo).
27 See, for example, Foster and Tre (2000). 28 See, for example, Reyes (2001). 29 Indeed, whatever GEF’s accounting procedures, it should be obvious that there can only be one
value of carbon damage costs, because all carbon emissions, from whatever their location on earth, make an identical contribution to actual global damage costs.
30
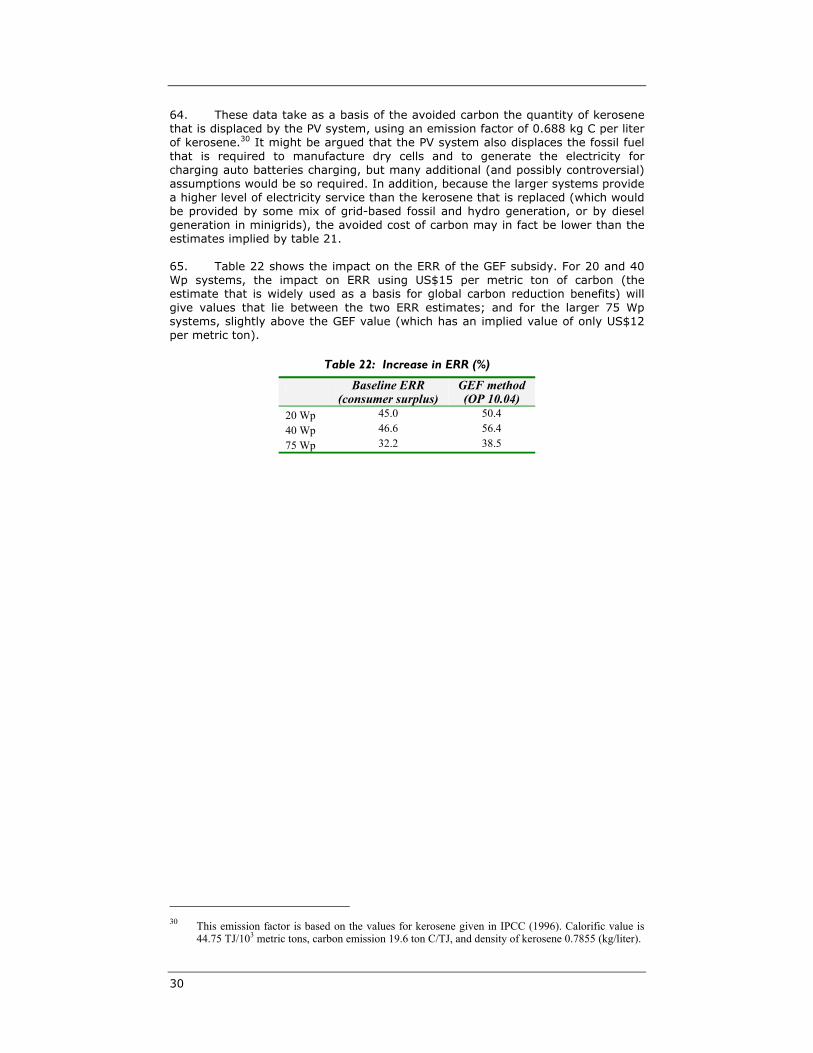
64. These data take as a basis of the avoided carbon the quantity of kerosene that is displaced by the PV system, using an emission factor of 0.688 kg C per liter of kerosene.30 It might be argued that the PV system also displaces the fossil fuel that is required to manufacture dry cells and to generate the electricity for charging auto batteries charging, but many additional (and possibly controversial) assumptions would be so required. In addition, because the larger systems provide a higher level of electricity service than the kerosene that is replaced (which would be provided by some mix of grid-based fossil and hydro generation, or by diesel generation in minigrids), the avoided cost of carbon may in fact be lower than the estimates implied by table 21. 65. Table 22 shows the impact on the ERR of the GEF subsidy. For 20 and 40 Wp systems, the impact on ERR using US$15 per metric ton of carbon (the estimate that is widely used as a basis for global carbon reduction benefits) will give values that lie between the two ERR estimates; and for the larger 75 Wp systems, slightly above the GEF value (which has an implied value of only US$12 per metric ton).
Table 22: Increase in ERR (%)
Baseline ERR (consumer surplus)
GEF method (OP 10.04)
20 Wp 45.0 50.4 40 Wp 46.6 56.4 75 Wp 32.2 38.5
30 This emission factor is based on the values for kerosene given in IPCC (1996). Calorific value is
44.75 TJ/103 metric tons, carbon emission 19.6 ton C/TJ, and density of kerosene 0.7855 (kg/liter).

31
6. SUBSIDY STRUCTURE __________________________________________________________________ 66. Having established a better estimate of the economic benefits using the consumer surplus approach, we now return to the question of the subsidy structure.31 We note in table 23 the relationship between size of government capital grant subsidy, and the net economic benefit achieved by this subsidy. Clearly, the proposed subsidy design meets one of the first tests of efficiency: subsidies leverage significantly larger economic benefits.
Table 23: Proposed Subsidy v. Economic Benefit (using consumer surplus method)
Proposed subsidy
NPV, net economic benefits
Subsidy, as % of benefit
FRR to consumer
(%)
NPV of net government tax revenue
20 Wp 8,000 34,562 23 160.0 -5,634 40 Wp 5,000 44,235 11 17.4 -1,866 75 Wp 0 32,548 0 0.9 4,662
67. However, we also note that the consumer FRR, based on avoided costs, shows very large variations across the three types of systems and that, in the case of the 75 Wp systems, the net effect on government revenue is an increase, largely the result of tax receipts from the assumed dealer margins and the VAT of PV system modules. Given the fungibility between capital subsidy and VAT noted earlier, what really matters is the net flow to and from government.32 However, as noted in table 24, the net revenue from the 75 Wp systems offsets 18 percent of the government’s cost to the other categories. Whether this is intended or not requires discussion with the government.
31 See also Mostert (2001a), section 5.6: Policy Recommendations for the Design of SHS Subsidy
Systems. Mostert argues that subsidies should be designed to maximize the ratio of market expansion to free riders, and calls for a three-phase approach: a first phase in which a market priming subsidy is launched, a second phase when no subsidies are given, and a third phase where a market deepening subsidy is introduced. The proposed subsidies to be given during APL-I fall into the first category.
32 Although again, see Mostert (2002) on the incentive value of these two approaches.

PHILIPPINES:SOLAR HOME SYSTEMS
32
Table 24: Aggregate Impact on Government Revenue
20 Wp 40 Wp 75 Wp Total Targets [number systems] 2,000 7,000 1,000 10,000 NPVGovtImpact [P/system] -5651 -1885 4442 Aggregate impact [P million] -11.3 -13.2 4.4 -20
68. Figure 9 shows the impact of subsidy level on FRR and aggregate government revenue. A revenue neutral subsidy would be around P 4,750—but the FRR climbs only to around 5 percent, and even at a subsidy of P 8,000, the FRR is still around 10 percent. We conclude that even with higher subsidy, the FRR based on avoided cost is nowhere close to the hurdle rate. It follows that if nonpoor households do indeed show a high willingness-to-pay, offering them a subsidy (or a VAT reduction) will make little difference: they become “free riders.”33
Figure 9: Capital Subsidy, Government Revenue and FRR
69. These calculations do not take into account the price elasticity of demand for SHSs. Figure 10 shows the demand and supply curves for subsidies: the x-axis shows the number of rural households obtaining access to electricity from SHSs per year;34 the supply curve shows the relationship between the number of customers and subsidy rate for a given annual subsidy budget. As drawn, we assume an annual subsidy budget for 40 Wp systems of P 3.5million, at which level we expect first-year demand to be 700 40 Wp systems: hence, the demand curve is drawn to intersect the supply curve at this point. One must concede, however, that although the supply curve is known (given knowledge of the costs of the SHSs and the subsidy), the estimate of demand (at this price) is subject to considerable uncertainty. However, since the FRR for 40 Wp systems is 17.4 percent, purely on a replacement cost basis it seems unlikely that demand would be significantly less.
33 The reverse “Ramsey Pricing” principle calls for subsidies to be focused on those products or
services with the highest elasticity of demand in order to achieve maximum market expansion per invested subsidy amount (Mostert 2001). Because the estimated price elasticity (of lumen-hour demand) is highest for the poorest families (20 Wp systems, -1.2) and smallest for the nonpoor (75 Wp systems, -0.81), the emphasis on subsidies for the smallest systems meets this criterion.
34 The demand curve for subsidies shown in Mostert (2001), p. 25, has an upward slope because of his definition of the y-axis as the quantum of subsidy rather than the price. We prefer the conventional representation so as to avoid confusion with other demand curves shown in this report.
-4
-2
0
2
4
6
0
0.02
0.04
0.06
0.08
0.1
<------GOVERNMENT REVENUE FRR ------->
Capital subsidy, pesos
impa
ct o
n G
over
nmen
t Rev
enue
, 100
0P a
s NPV
C
onsumer FR
R
0 1000 2000 3000 4000 5000 6000 7000 8000

6. SUBSIDY STRUCTURE
33
Figure 10: Demand and Supply for Subsidies (40 Wp systems)
70. However, an additional dimension of uncertainty is the elasticity of demand. For example, if the first-year subsidy budget were cut by half, to P 1.75million (see figure 11), then with the relatively inelastic demand curve of figure 10, the impact on sales would be relatively small, falling from 700 systems to about 650 systems. But if the demand curve is more elastic, the same cut in subsidy budget would result in only 500 systems sold.
Figure 11: Impact of Demand Elasticity
71. A related issue is dealer margin, for which we use a figure of 100 percent (based on the Sri Lanka experience). These are healthy margins that may well be competed down over time—although in the initial years of the project such margins may well be necessary until consumer acceptance is demonstrated. Figure 12 shows that the FRR does indeed respond to cuts in margin, but in the early years, even if margins are cut to 60–70 percent, the FRR is still less than 10 percent.
0 200 400 600 800 1000 1200 5
10
15
20
25
30
35
SUBSIDY BUDGET=3.5m
INELASTIC DEMAND
Number of households per year
Cco
st o
f sys
tem
, 100
0P
0 200 400 600 800 1000 1200 5
10
15
20
25
30
35
SUBSIDY BUDGET=3.5m
INELASTIC DEMAND
SUBSIDY BUDGET=1.75m
ELASTIC DEMAND
Number of households per year
Cos
t of s
yste
m, 1
000P

PHILIPPINES:SOLAR HOME SYSTEMS
34
Figure 12: Dealer Margins and FRR (75 Wp Systems)
72. In any event, if indeed the willingness-to-pay for the large 75 Wp systems is insufficient to overcome the poor FRR based on replacement costs only, nonpoor households can simply buy the smaller 40 Wp systems, whose FRR is satisfactory. The VAT exemption would also be worth about P 3,200, which would still mean a net increase in government revenue for this category of system.
0
0.05
0.1
0.15
Dealer Margin
Con
sum
er F
RR
1 0.9 0.8 0.7 0.6 0.5 0.4

35
7. RISK ANALYSIS __________________________________________________________________ 73. Although the sensitivity analyses and switching values suggest robust economic returns, this needs to be verified in a more general risk analysis, in which all of the major input assumptions are specified as probability distributions, and the economic returns are estimated as a probability distribution (that reflects the likely circumstances in which all input variables vary simultaneously, rather than just one at a time). 74. Table 25 (and figure 13) shows the probability distributions assumed for the input variables. Because 40 Wp systems account for the bulk of the installations, the analysis is for this system size class.
Table 25: Input Assumptions for Risk Analysis
Assumption
Probability distribution
Basis
Equipment costs (imported PV modules)
Triangular Capital costs may be lower than estimated, given worldwide cost decreases from scale economies and learning curve effects
Project Life Triangular Module life may be lower than the 15 years assumed in the base case
Allocation fraction (share of PV system output devoted to lighting)
Uniform (from 0.3 to 0.5) Uncertainty in consumer behavior
Lumen-hours/day Normal (mean= 2520, � = 200)
Uncertainty in consumer behavior (as it affects the calculation of consumer surplus)
TV-hours per day Normal (mean=4, �=1) Uncertainty in consumer behavior (as it affects the calculation of consumer surplus)

PHILIPPINES:SOLAR HOME SYSTEMS
36
Figure 13: Input Probability Distributions
source:
75. The resulting probability distribution (of 1,000 trials) for the ERR of the 40 Wp systems is shown in figure 14. The probability of the ERR falling below 15 percent, the hurdle rate, is less than 1 percent. The average ERR of the 1000 trials is 47.7 percent, as opposed to 46.6 percent using “most likely” (median) estimates of assumptions.

7. RISK ANALYSIS
37
Figure 14: Distribution of Rate of Return
0 0.2 0.4 0.6 0.8 1 1.20
0.1
0.2
0.3
0.4
@avg=0.477
@ref=0.466

38
8. AGGREGATE ECONOMIC BENEFITS _________________________________________________ 76. We next aggregate the costs and benefits over the entire project. For each of the three size or income classes, we estimate the number of systems installed each year of the period of APL-I and the benefits of each cohort extended over their respective lifetimes (see table 26). The baseline ERR for the SHS component of the project is 44.6 percent.35 When the GEF subsidies are treated as economic benefits, the ERR increases to 53.2 percent.
35 This is the weighted average of the individual ERRs presented previously. As may be seen from
table 26, the ERRs for each size category are the same as in the earlier individual tables. Because 70 percent of the systems are assumed to be in the 40 Wp size (ERR 46.6 percent), the overall ERR is fairly close to this value.

7. RISK ANALYSIS
39
Table 26: Aggregate Economic Flows: APL-I
All calculations done to 2022, as in the graph (thereby including the 15years of benefits for the systems added in 2007).

40
9. CONCLUSIONS _________________________________________________ 77. Solar PV systems for individual homes are found to be economic. Under the most conservative assumptions, the ERR for APL-I as a whole is 44.6 percent. The consumer-surplus–based ERRs are 45 percent for the smallest 20 Wp systems, 47 percent for 40 Wp systems, and 32 percent for 75 Wp systems. Table 27 summarizes the results (including the FRR from the consumer’s perspective, the ERR using only avoided costs, and the ERR when also considering global carbon benefits).
Table 27: Summary of Results
FRR Consumer perspective
(%)
ERR Benefits at
avoided economic costs only
(%)
ERR Benefits based on increase in
consumer surplus (%)
ERR Consumer
surplus benefits plus GEF subsidy as benefit (%)
20 Wp systems 150.0 15.2 45.0 50.4 40 WP systems 16.9 11.3 46.6 56.4 75 Wp systems 1.2 8.4 32.2 38.5 Entire project 44.6 53.2
78. We note that for the smallest 20 Wp systems, the ERR when using avoided costs is marginally above the hurdle rate of 15 percent; and with the proposed subsidy schemes, the FRR (from the consumer’s perspective) is high (and consistent with the high personal discount rates observed in poor families). If the marketing and institutional aspects of the project are competently handled, the probability of realizing the economic benefits is therefore also high. The low consumer-based financial rate of return for the nonpoor (looking only at replacement costs) is offset by their high willingness-to-pay for the very much greater level of service of the larger PV-systems, as observed in almost all other countries with similar projects (as, for example, in India and Sri Lanka). Moreover, if the willingness-to-pay for such systems does not offset the low FRR, the nonpoor households can always buy the smaller 40 Wp systems, whose FRR is satisfactory. 79. The result of net economic benefit is robust with respect to input assumptions in the plausible range. A switching values analysis shows that increases in initial cost, problems in system performance, and assumptions about the shape of the demand curve all pose relatively small risks to achieving the project benefits. With 10,000 systems as the goal for APL-I, the risks of having overestimated market size is small (requiring sales to 2.2 percent, 9.5 percent, and 1.5 percent of poorest, poor, and nonpoor households, respectively, that use batteries for radio and television, or 1.1 percent, 4.75 percent, and 0.75 percent, respectively, of households that use either batteries or small diesel generators). 80. The input assumption with the most significant potential effect on ERR is the life of the PV module lives, which we assume at 15 years in the reference case. However, because of the large magnitude of (consumer surplus) benefits, significant erosion of ERR occurs only if model lives are below 7–8 years, which, based on experience in other countries, seems unlikely.

7. RISK ANALYSIS
41
81. The benefits are consistent with those estimated in other countries for similar projects (for example, a 30 percent ERR as estimated by the ICR for a similar project component in India). They reflect high willingness-to-pay for the improved levels of lighting service, and the significantly higher levels of television viewing. Although the benefits may be smaller than those for full grid extension- (or minigrid-) based-electrification, for areas where such electrification strategies are not cost-effective, PV-powered solar homes represent an economically efficient alternative. 82. Finally, the results of table 27 do not include a range of further benefits that include the avoidance of significant number of burn injuries and fires, the benefit to families of higher levels of educational achievement; and the benefit of attaining higher levels of family income.

42
REFERENCES
Barnes, D. F,. A. Domdom, V. Peskin, and H.
Peskin. 2002. “Rural Electrification and Development in the Philippines: Measuring the Social and Economic Benefits.” ESMAP Report 255/02. Washington, D.C.: World Bank.
Cabraal, A., M. Cosgrove-Davies, and L.
Schaeffer. 1996. Best Practices for Photovoltaic Household Electrification Programs: Lessons from Experiences in Selected Countries. World Bank Technical Series 324, Washington, D.C.
Foster, V., and J.-P, Tre. 2000. “Measuring the
Impact of Energy Interventions on the Poor—An Illustration from Guatemala.” Paper presented at a World Bank–U.K. government conference, Infrastructure for Development: Private Solutions and the Poor, May 31–June 2, London. http://www.ppiaf.org/conference/section1-paper4.pdf
IPCC (Intergovernmental Panel on Climate
Change). 1996. Revised 1996 IPCC Guidelines for National Greenhouse Gas Inventories. The Greenhouse Gas Inventory Workbook (Volume 2). The Greenhouse Gas Inventory Reference Manual (Volume 3). IPCC: Geneva.
Madecor Environmental Management Systems Inc.
2001. “Market Assessment for Rural Electrification.” Report to Philippines Department of Energy, Final Report, Manila.
Martinot, E., A. Cabraal, and S. Mathur. 2001.
“World Bank/GEF Solar Home Systems Projects: Experiences and Lessons Learned 1993–2000.” Renewable and Sustainable Energy Reviews 5(1):39–57.
Meritec Ltd. 2002. “India: Renewable Resources
Development Project; Review of Project for Implementation Completion Report.” Report for the World Bank, South Asia Energy Unit, Washington D.C.
Mostert, W. 2001a. Rural Electrification Subsides
in the Philippines, Volume 1: Policy Recommendations for Optimized Use of Re-subsidies and the National Lifeline Rate. Report to the Department of Energy,
National Electrification Administration, and the World Bank, Washington, D.C.
———. 2001b. Rural Electrification Subsides in
the Philippines, Volume 2: Rural Electrification Subsidy Principles, A Reference Manual. Report to the Department of Energy, National Electrification Administration, and the World Bank, Manila.
———. 2002. Rural Electrification Subsidy
Principles: A Reference Manual. World Bank, Africa Rural and Renewable Energy Initiative (AFFREI), Washington, D.C.
Patalinghug, E., N. Mendoza, and R. Alonzo. 2002.
“Rationalisation of Subsidy Policy for Rural Electrification.” Report to the World Bank and the Department of Energy, Government of the Philippines, Manila.
Reyes, Carmela. 2001. “Twin Girls Killed in
Bulacan Fire.” Inquirer News Service. December 23. <www.inq7.net/met/2001/dec/23/met_6-1.htm>
Smith, W. 2001. Designing Output-Based Aid
Schemes: A Checklist. Output-Based Aid. pp. 91–117. Colombo, Sri Lanka.
van der Plas, R., and A. B. de Graff. 1988.
“Comparison of Lamps for Domestic Lighting in Developing Countries.” Energy Series Paper 6. World Bank, Industry and Energy Department Working Paper, Washington, D.C.
World Bank. 2002. “Sri Lanka Renewable Energy
Development, Project Appraisal Document.” Report 23886-CE. World Bank, South Asia Energy Unit, Washington, D.C.