economic analysis of technology infrastructure needs for … · economic analysis of technology...
TRANSCRIPT

Prepared for—
Economic Analysis OfficeNational Institute of Standards and Technology100 Bureau DriveGaithersburg, MD 20899
This publication is available free of charge from:http://dx.doi.org/10.6028/NIST.GCR.16-006
Economic Analysis of Technology Infrastructure Needs for Advanced Manufacturing
Additive Manufacturing
August 2016
Prepared by—
Troy J. ScottTravis J. BeaulieuGinger D. RothrockAlan C. O’ConnorRTI International3040 E. Cornwallis RoadResearch Triangle Park, NC 27709
NIST GCR 16-006

Acknowledgements Many contributed to the preparation of this report, and we wish to acknowledge in particular the private companies, industry associations, research institutes, universities, and government agencies whose experts contributed data and insights underlying the analysis herein.
In addition to this study’s lead authors, significant contributors included Luca Alessandro Remotti of the Joint Institute for Innovation Policy (formerly of Intrasoft S.A.) and Ola Harrysson, Richard Wysk, Paul Cohen, and Russell King with NC State University’s Department of Industrial and Systems Engineering.
We would also like to acknowledge the advice and subject matter expertise contributed by NIST economic and scientific staff. Specifically, we are especially grateful for the contributions of Gary Anderson of NIST’s Economic Analysis Office, Timothy Burns of NIST’s Applied and Computational Mathematics Division, Stephen Campbell of NIST’s Economic Analysis Office, Heather Evan of NIST’s Program Coordination Office, Simon Frechette of NIST’s Systems Integration Division, Albert Jones of NIST’s Systems Integration Division, James Liddle of NIST’s Center for Nanoscale Science and Technology, Eric Lin of NIST’s Materials Science and Engineering Division, Richard Ricker of NIST’s Materials Measurement Science Division, Christopher Soles of NIST’s Materials Science and Engineering Division, Albert Wavering of NIST’s Intelligent Systems Division, and Paul Zielinski of NIST’s Technology Partnerships Office.
Disclaimer This publication was produced as part of contract GS10F0097L with the National Institute of Standards and Technology. The contents of this publication do not necessarily reflect the views or policies of the National Institute of Standards and Technology or the US Government.
About RTI RTI International is one of the world’s leading research institutes, dedicated to improving the human condition by turning knowledge into practice. Our staff of more than 4,150 provides research and technical services to governments and businesses in more than 75 countries in the areas of health and pharmaceuticals, education and training, surveys and statistics, advanced technology, international development, economic and social policy, energy and the environment, and laboratory testing and chemical analysis. For more information, visit www.rti.org.
RTI International is a registered trademark and a trade name of Research Triangle Institute.

NIST GCR 16-006
Economic Analysis of Technology Infrastructure Needs for Advanced
Manufacturing: Additive Manufacturing
Prepared for U.S. Department of Commerce
Economic Analysis Office Office of the Director
National Institute of Standards and Technology Gaithersburg, MD 20899
By
Troy J. Scott Travis J. Beaulieu
Ginger D. Rothrock Alan C. O’Connor RTI International
This publication is available free of charge from:
http://dx.doi.org/10.6028/NIST.GCR.16-006
August 2016
U.S. Department of Commerce Penny Pritzker, Secretary
National Institute of Standards and Technology
Willie May, Under Secretary of Commerce for Standards and Technology and Director

iii
This publication is available free of charge from: http://dx.doi.org/10.6028/N
IST.GC
R.16-006
Contents
Section Page
Executive Summary ES-1
1 Introduction 1-1
1.1 Definition of Technology Infrastructure ....................... 1-3 1.1.1 Infratechnologies ........................................... 1-3 1.1.2 Technology Platforms ..................................... 1-4 1.1.3 Proprietary Technologies................................. 1-4
1.2 Study Scope ........................................................... 1-5
1.3 Role of NIST............................................................ 1-8
1.4 What Distinguishes This Report ............................... 1-11
2 Analytical Approach 2-1
2.1 Data Collection ........................................................ 2-1 2.1.1 Interviews .................................................... 2-2 2.1.2 Stakeholder Groups ....................................... 2-3
2.2 Economic Models ..................................................... 2-3 2.2.1 Firm-Level Data ............................................. 2-4 2.2.2 Impact Applicability ....................................... 2-5 2.2.3 Industry-Level Impacts .................................. 2-6 2.2.4 Apportioning Total Impacts over Industry
Needs .......................................................... 2-6
2.3 Conservative Nature of Approach ............................... 2-7
3 Overview of Additive Manufacturing 3-1
3.1 Materials and Processes ............................................ 3-2 3.1.1 Plastics ......................................................... 3-3 3.1.2 Metals .......................................................... 3-4
iv
This publication is available free of charge from: http://dx.doi.org/10.6028/N
IST.GC
R.16-006
3.1.3 Metallic Additive Manufacturing Systems........... 3-5
3.2 Applications and Industries ....................................... 3-6 3.3.1 Modeling and Prototyping ............................... 3-7 3.3.2 Tooling ......................................................... 3-8 3.3.3 Aerospace ..................................................... 3-8 3.3.4 Armaments ................................................. 3-11 3.3.5 Automotive ................................................. 3-12 3.3.6 Dental ........................................................ 3-12 3.3.7 Biomedical .................................................. 3-12 3.3.8 Consumer Goods ......................................... 3-13
3.4 Stakeholders ......................................................... 3-13 3.4.1 Standards Organizations ............................... 3-14 3.4.2 Industry Associations ................................... 3-14 3.4.3 Federal Investment ...................................... 3-15
4 Quantitative Results and Economic Impact Analysis 4-1
4.1 Importance Ratings of Infrastructure Technology Needs .................................................................... 4-1
4.2 Impacts of Meeting Infrastructure Technology Needs .................................................................... 4-3
4.3 Impacts Apportioned over Technology Needs .............. 4-6
5 Qualitative Results: Stakeholder Views 5-1
5.1 Materials and Process Standards and Reference Databases .............................................................. 5-1
5.2 Design Optimization for AM ....................................... 5-5
5.3 Modeling and Simulation ........................................... 5-6
5.4 Real-Time Metrology ................................................ 5-7
5.5 Surface Finishing of Metal Additive Parts and Related Testing ....................................................... 5-7
5.6 Mechanical Testing Procedures .................................. 5-8
6 Conclusion 6-1
References R-1
v
This publication is available free of charge from: http://dx.doi.org/10.6028/N
IST.GC
R.16-006
Appendixes
A: Interview Guide for Additive Systems Developers ........ A-1
B: Interview Guide for Additive End Users ....................... B-1
C: Importance Scores ................................................... C-1
Figures
Number Page
ES-1. Total Annual Impact, Apportioned by Technology Need (Millions of 2013 US$) ................................................... ES-5
3-1. Metal-AM Part Design Complexities .................................... 3-7 4-1. Importance of Technology Needs ...................................... 4-2 4-2. Cost Reductions for Additive Manufacturing by Industry ....... 4-4 4-3. Total Annual Impact, Apportioned by Technology Need
(Millions of 2013 US$) ..................................................... 4-7

vi
This publication is available free of charge from: http://dx.doi.org/10.6028/N
IST.GC
R.16-006
Tables
Number Page
ES-1. General Industry-Level Needs for Additive Manufacturing ... ES-3 1-1. Definitions of Key Concepts .............................................. 1-6 1-2. General Industry-Level Needs for Additive Manufacturing ..... 1-7 1-3. Barriers to Developing and Adopting New Technology
That Brings about Market Failure ....................................... 1-9 3-1. Techniques/Methods Used in Additive Manufacturing ........... 3-3 3-2. Selected Alloys Used in Additive Manufacturing ................... 3-5 4-1. General Industry-Level Needs for Additive Manufacturing ..... 4-2 4-2. Economic Impact Summary Table ..................................... 4-4 4-3. Process Improvements ..................................................... 4-5

ES-1
This publication is available free of charge from: http://dx.doi.org/10.6028/N
IST.GC
R.16-006
Executive Summary
Through extensive engagement with industry stakeholders, RTI International identified pressing needs in additive manufacturing applications for technology infrastructure most closely aligned with the National Institute for Standards and Technology’s (NIST’s) unique mission and capabilities. These needs are in the areas of standards, metrology, design allowables, modeling and simulation, surface finishing, and testing procedures.
We estimate the potential impact of meeting these needs to be $4.1 billion per year, which is defined as costs that U.S. manufacturers could avoid if these needs were met. There are three important impacts that would accrue. First, lowering application–specific costs of capital, labor, energy, and materials for U.S. manufacturers would lead to lower prices for consumers of 3D-printed goods, which in turn would lead to the expansion of these market segments. Second, meeting technology infrastructure needs would lead to improvements in the performance characteristics of parts produced additively, which would increase demand and expand these market segments still further. Third, the emergence of altogether new products and markets would almost certainly also be accelerated.
We view our $4.1 billion impact estimate as conservative, because it does not take into account the second-order effect of the growth AM would experience as a direct result of cost reductions being shared with consumers in the form of lower prices, moving AM outward along its demand curve. Our quantitative impact estimate also does not take into account that the demand for additively manufactured parts will increase as their performance characteristics improve and end users become better able to verify and certify those performance characteristics.

Economic Analysis of Technology Infrastructure Needs for Advanced Manufacturing: Additive Manufacturing
ES-2
This publication is available free of charge from: http://dx.doi.org/10.6028/N
IST.GC
R.16-006
ES.1 SCOPE OF THE ANALYSIS This report identifies gaps in technology infrastructure inhibiting the development and adoption of AM technologies by U.S. manufacturers and quantifies the prospective economic benefits of addressing these gaps. The report also outlines specific actions that NIST can take to accelerate the development and adoption of critical technology infrastructure.
The research supporting this report was informed by primary data collection that consisted of unstructured and structured interviews with experts in the AM value chain, combined with secondary collection of industry information and data points. The findings of this report—the potential economic benefits and roles for NIST—are thus rooted in the perspectives of industry experts.
This report focuses on enhancements to six types of technology infrastructure, identified through stakeholder interviews as industries’ most pressing needs (Table ES-1). Technology infrastructure is the broad base technologies and technical knowledge with varying degrees of public-good content supporting the R&D and production efforts of firms, universities, and laboratories, as well as the development and adoption of improved and entirely new products, processes, and services.
Technology infrastructure includes infratechnologies and technology platforms. Infratechnologies are a varied set of “technical tools” that include measurement and test methods, artifacts such as standard reference materials that allow these methods to be used efficiently, scientific and engineering databases, process models, and the technical basis for physical and functional interfaces between components of systems technologies. Technology platforms are precompetitive proofs of concept that demonstrate the potential commercial viability of a new or improved product, process, or service.

Executive Summary
ES-3
This publication is available free of charge from: http://dx.doi.org/10.6028/N
IST.GC
R.16-006
Table ES-1. General Industry-Level Needs for Additive Manufacturing
Industry Needs Examples of Potential Impacts
Standards—standards, best practices, and reference data for materials and AM processes
• Improve confidence via reproducibility across manufacturing methods
• Provide greater assurance in raw materials
Metrology—real-time, in situ metrology, enabled by integrated sensors for real-time feedback during a build
• Identify in-build defects in time to correct and continue the build or scrap before using additional material
Design Allowables—design optimization tools and protocols for complex builds
• Improve “design to manufacture” guidance for designing and printing complex parts, including mesh, lightweight, and sacrificial support structures
• Reduce scrap rates and turnaround times and improve reliability and reproducibility of parts
Modeling and Simulation—high-fidelity process modeling and simulation for different materials and designs
• Improve yields, shorter and fewer R&D cycles • Predict anomalies at various stages of a build • Understand material-specific processes leading
to new applications
Surface Finishing—cost-effective approaches to improve surface finishing of metal AM parts and standards for measuring surface finish and tolerances
• Eliminate or greatly reduce the degree of postprocessing required to make production-quality parts
Testing Procedures—innovative mechanical testing procedures
• Improve efficiency and cost savings from nondestructive and other test methods
• Improve confidence in AM processes and materials to speed up adoption and validation of high-value printed parts in various applications
ES.2 ANALYSIS APPROACH The methodology includes the collection and analysis of qualitative and quantitative data from primary and secondary sources. To ensure that a variety of perspectives are accounted for, RTI interviewed a cross-section of nearly 60 interviews with technology experts representing end using firms, technology developers and universities. We also had informal conversations with individuals at conferences and industry events, which contributed to the findings in this report.
We approached interviewees with a set of infrastructure technology needs, which, through our first phase of interviews, we found to be of the utmost importance to members of the manufacturing value chain:
Materials and process standards and reference data
Real-time metrology

Economic Analysis of Technology Infrastructure Needs for Advanced Manufacturing: Additive Manufacturing
ES-4
This publication is available free of charge from: http://dx.doi.org/10.6028/N
IST.GC
R.16-006
Design optimization tools
Modeling and simulation
Surface finishing
Mechanical testing procedures
Quantitative information from interviews about the prospective impact of meeting these needs formed the basis of our economic models that estimate the economic benefits that enhanced technology infrastructure would have on the U.S. manufacturing sector. Other key parameters in our models were derived from publicly available data on the manufacturing sector.
ES.3 ANALYSIS OF TECHNOLOGY INFRASTRUCTURE NEEDS Our discussions highlighted significant complementarities among the six industry needs (Table ES-1). For instance, high-fidelity predictive models would be a valuable tool for optimizing designs for 3D-printed parts and for qualifying parts for demanding applications with less need for destructive testing; building useful models requires large, high-quality scientific and engineering databases linking materials, processes, process conditions, and surface finish with the performance characteristics of the finished part.
Figure ES-1 apportions the estimated $4.1 billion annual impact over the six areas of unmet need. Enhanced standards, best practices, and reference data are associated with annual cost reductions for U.S. manufacturers of nearly $800 million. The cost impact of meeting each of the other five industry needs is between $600 and $700 million.
Stakeholders’ perceptions and opinions on each of the six needs are highlighted below.

Executive Summary
ES-5
This publication is available free of charge from: http://dx.doi.org/10.6028/N
IST.GC
R.16-006
Figure ES-1. Total Annual Impact, Apportioned by Technology Need (Millions of 2013 US$)
ES.3.1 Materials and Process Standards and Reference Data
Our interview sample was unanimous in their assessment that the most important infratechnology needs at this time are materials standards, process standards, and reference databases. Standards serve the industry by ensuring quality and consistency for the input materials and during a build.
A key inhibitor to AM is convincing customers and certifying bodies that an additively produced part has the necessary quality to meet the application. One large manufacturing company shared that it spends $500,000 over a 6-month time frame to obtain mechanical properties just for a single part, made from a single material, using a specific additive manufacturing process with specific parameters.
A senior engineer at a leading aerospace company explained that AM needs “objective evidence of compliance to design intent. When you pull a part out of the machine, how do you know it meets its design intent?” According to another respondent in the same industry, “[you need] empirical evidence of success to build customer confidence.” This is the ultimate goal for AM: achieving a level of confidence that a part is almost certainly free of deformations and functionally sound, while adhering to design standards and guidelines. Combining specialized scientific and engineering expertise with

Economic Analysis of Technology Infrastructure Needs for Advanced Manufacturing: Additive Manufacturing
ES-6
This publication is available free of charge from: http://dx.doi.org/10.6028/N
IST.GC
R.16-006
impartiality, NIST is especially well positioned to overcome this barrier—an uncertainty-based market failure—by acting as an honest broker among parties at different tiers of supply chains.
Property data for a set of common process–material pairs could accelerate the introduction of additively built parts into service in existing industries, as well as new industries, and open up additional opportunities for small suppliers and manufacturers. But because of the process–material connection and the many different process–material pairs relevant across applications (the lack of a single or even a few process–material pairs relevant to wide cross sections of industry), this is a task probably beyond the resources, at least for the time being, even of national laboratories. A practical and very useful first step would be to standardize the testing protocols, standardize the database schema for what data to collect, make a database available to the public, and allow the AM community to upload property data (obtained using standard procedures) to the database.
ES.3.2 Real-Time Metrology
Additively manufactured parts have an advantage in that the inherent layer-by-layer production provides an opportunity to take a snapshot at each fractional stage of product build. However, the metrology tools and associated real-time feedback processes remain in infancy. Most interviewees saw a need and value for real-time metrology, but few offered solutions or even topics for further research. Academic, government, and consortia groups are heavily pursuing this field, investigating optical (geometric), infrared, and thermal methods.
As reported by the companies surveyed, qualification is primarily done postproduction, with process and materials alterations done primarily by a trial-and-error method. The implementation of real-time metrology has clear benefits in efficiency, throughput, and related cost, replacing subjective reasoning with quantitative decision making. Given the variability in materials and processes as described above, real-time metrology and feedback loops offer a means of control that could compensate for the inputs.
Much like metrology desires in other manufacturing processes, manufacturers seek metrology solutions that are rapid,

Executive Summary
ES-7
This publication is available free of charge from: http://dx.doi.org/10.6028/N
IST.GC
R.16-006
quantitative, nondestructive, inexpensive, and high resolution and that have wide dynamic range. The range of features that interviewees could monitor varies from geometric distortion to porosity to mechanical and thermal stress.
ES.3.3 Design Optimization Tools
Designers—using computer-aided design (CAD) software to define part requirements to meet the desired function—must know the tolerances of the materials and processes that will be used to bring their designs to life: How closely can they expect the raw materials and the process conditions to conform to the ideal? How will any variance affect how the part performs or under what conditions it will fail?
Accelerating AM will require approaches for optimizing designs. One of the most significant benefits of AM is the ability to create 3D, complex, interlocking pieces in one process. In this manner, additively produced parts may have advantages in both economics and performance over their subtractively built counterparts, but guidance and data to support these novel designs (e.g., angles, sacrificial structures, meshes) are needed.
One firm noted that when building an AM part for the first time from a CAD file, they are able to do it correctly only two out of three times. On the second attempt, there is a 90% success rate. This comment suggests that improvements to AM design rules could reduce scrap rates and result in more productive machine time.
ES.3.4 Modeling and Simulation
Tools are needed to model and simulate materials properties and establish robust process-structure-property relationships. Most AM modeling efforts are focused on creating predictive capabilities to understand resulting part properties given material and process inputs. Time-temperature history determines material microstructure, which determines mechanical properties. Measurement and control of that time-temperature history is therefore important.
For aerospace and energy applications, in particular, modeling and simulation tools are critical. To date, this field has been held back by the lack of quality inputs. The variability in raw materials and processes, the lack of consistent metrology data,

Economic Analysis of Technology Infrastructure Needs for Advanced Manufacturing: Additive Manufacturing
ES-8
This publication is available free of charge from: http://dx.doi.org/10.6028/N
IST.GC
R.16-006
and simply the low number of similar parts produced by AM all contribute to the gap.
ES.3.5 Surface Finishing
Surface finish is a nagging problem for prototype and service parts. Additively built parts naturally have a rougher finish, similar to cast surfaces, requiring some postprocessing machining. This surface roughness is a function of both input materials (e.g., metal grain size) and process parameters (sintering, melting, beam width) and is often correlated with the fabrication time.
Better measurement methods are needed to enable the types of improvements in build processes that can reduce the need for surface finishing following a build.
Also, because topology optimization of additively built parts often creates surfaces where machine tools cannot reach, innovative surface finishing techniques, including hybrid manufacturing, may be required.
ES.3.6 Mechanical Testing Procedures
Innovative mechanical testing procedures are needed, especially to enable nondestructive testing. Closely linked with the needs for high-quality scientific and engineering data and high-fidelity modeling and simulation based on established process-structure-property relationships, novel mechanical testing procedures are needed to qualify 3D-printed parts for critical applications in aerospace and medicine.
As reported by an interviewee, one challenge with AM technology relates to “objective evidence of compliance to design intent.” When a part is extracted from a machine, it needs to be evaluated to determine whether it meets the design intent. The surface geometry can be analyzed, but there is no nondestructive methodology for determining whether the metal chemistry meets design specifications. A firm can produce a part, but how does one inspect and validate it? There needs to be a methodology to tell an operator that part A matches the history of yield specimens. Presently, firms are using ultrasound, X-ray, and computerized tomography scans to determine some qualities of the final part, but more cost-effective approaches are needed.

1-1
This publication is available free of charge from: http://dx.doi.org/10.6028/N
IST.GC
R.16-006
1 Introduction
Additive manufacturing (AM) describes a set of processes for joining materials to make objects, layer on layer, from three-dimensional model data. AM technologies are now enabling transformative innovation across a range of manufacturing applications and industries: from accelerating modeling and prototyping cycles to producing complex metal structures with unique capabilities and features, and from ultrasound equipment and medical implants to gas turbines and jet engine components.
The consensus among the more than 50 AM experts RTI interviewed for this study was that AM has even greater potential to enable both sustaining and disruptive innovation but is held back by the inadequacy of technology infrastructure needed to support the further development and application of AM technologies. This report provides in-depth analysis of those infrastructure needs and the potential economic benefits of meeting them through public research and development (R&D) investment.
AM processes are an alternative to conventional manufacturing methods such as injection molding (for plastics) and, for metals: investment casting; shaping, as by forging or rolling, to produce wrought metal; welding; and machining (e.g., drilling, turning, milling, and grinding).
When AM enhances the productivity of these conventional manufacturing processes, as when AM is used to produce prototypes for fit and assembly, patterns for prototype tooling, patterns for metal castings, and tooling components, AM can be seen as enabling sustaining innovation. For example, AM is enabling Siemens, a large, highly diversified engineering company, to greatly reduce the cost and time needed to replace blades on customers’ gas turbines and to accelerate prototyping

Economic Analysis of Technology Infrastructure Needs for Advanced Manufacturing: Additive Manufacturing
1-2
This publication is available free of charge from: http://dx.doi.org/10.6028/N
IST.GC
R.16-006
of turbine blades from 16-20 weeks to 48 hours (“Heavy Metal,” 2015).
The potential of AM to spur disruptive innovation is most evident in applications where additively manufactured (or 3D-printed) parts can achieve performance characteristics that conventionally produced parts cannot. In applications where these performance characteristics are sufficiently valuable to end users, companies that have built sustainable competitive advantage on perfecting the conventional manufacture of the parts may find their business models disrupted.
Illustrating the potential performance gains AM can deliver, GE Aviation has developed a single-piece fuel nozzle for the next-generation LEAP (for Leading Edge Aviation Propulsion) commercial jet engines (developed by CFM International, a 50-50 joint venture between France’s Safran and GE Aviation) that is 25% lighter and five times more durable than a conventionally made nozzle composed of 20 separate parts. To produce the fuel nozzles for the LEAP engines—as well as a sensor housing, known as T25, already in service in the GE90 engines that power Boeing’s 777—GE has installed more than a dozen additive machines in its 300,000-square-foot factory in Auburn, Alabama, billed by GE as the world’s highest-volume additive manufacturing center (GE Aviation, 2015).
As AM technology shortens the duration of product design cycles, enables more seamless transition from prototyping to production, and increases the frequency with which new product designs supplant old ones in production, companies can be expected to perceive greater advantages in collocating R&D and production and locating production facilities close to their customers. For U.S. companies especially, these trends will tend to favor locating production facilities in the United States. Providing the measurement science and other technology infrastructure necessary for U.S. companies to fully realize the potential of AM may, therefore, be expected to improve the U.S. trade balance for advanced technology products over time.
Worldwide sales revenues for AM equipment and services increased from less than $100 million in 1993 to $1 billion in 2006, exceeded $2 billion in 2012, and surpassed $4 billion in 2014. But this robust growth is largely driven by the prototyping and tooling applications that are less dependent on the next generation of measurement science and technical
Section 1 — Introduction
1-3
This publication is available free of charge from: http://dx.doi.org/10.6028/N
IST.GC
R.16-006
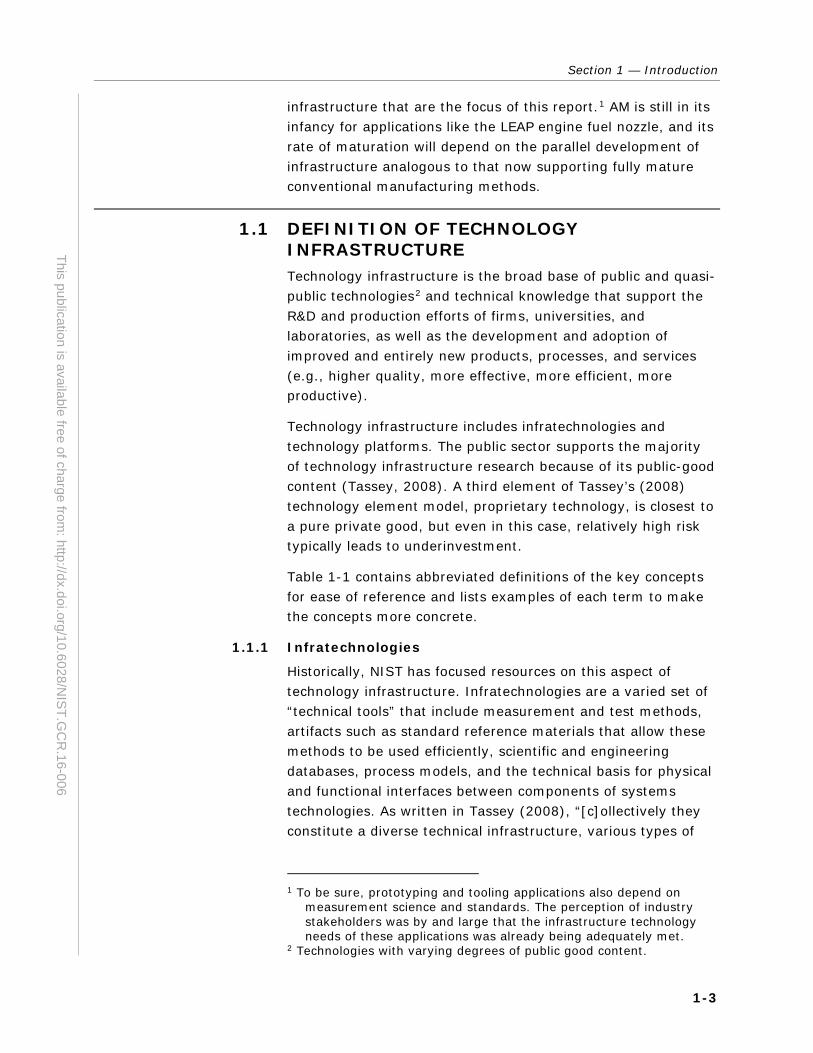
infrastructure that are the focus of this report.1 AM is still in its infancy for applications like the LEAP engine fuel nozzle, and its rate of maturation will depend on the parallel development of infrastructure analogous to that now supporting fully mature conventional manufacturing methods.
1.1 DEFINITION OF TECHNOLOGY INFRASTRUCTURE Technology infrastructure is the broad base of public and quasi-public technologies2 and technical knowledge that support the R&D and production efforts of firms, universities, and laboratories, as well as the development and adoption of improved and entirely new products, processes, and services (e.g., higher quality, more effective, more efficient, more productive).
Technology infrastructure includes infratechnologies and technology platforms. The public sector supports the majority of technology infrastructure research because of its public-good content (Tassey, 2008). A third element of Tassey’s (2008) technology element model, proprietary technology, is closest to a pure private good, but even in this case, relatively high risk typically leads to underinvestment.
Table 1-1 contains abbreviated definitions of the key concepts for ease of reference and lists examples of each term to make the concepts more concrete.
1.1.1 Infratechnologies
Historically, NIST has focused resources on this aspect of technology infrastructure. Infratechnologies are a varied set of “technical tools” that include measurement and test methods, artifacts such as standard reference materials that allow these methods to be used efficiently, scientific and engineering databases, process models, and the technical basis for physical and functional interfaces between components of systems technologies. As written in Tassey (2008), “[c]ollectively they constitute a diverse technical infrastructure, various types of
1 To be sure, prototyping and tooling applications also depend on
measurement science and standards. The perception of industry stakeholders was by and large that the infrastructure technology needs of these applications was already being adequately met.
2 Technologies with varying degrees of public good content.

Economic Analysis of Technology Infrastructure Needs for Advanced Manufacturing: Additive Manufacturing
1-4
This publication is available free of charge from: http://dx.doi.org/10.6028/N
IST.GC
R.16-006
which are applied at each stage of economic activity” (p. 618-619). New infratechnologies often replace less efficient forms of infratechnology that support current standards (Tassey, 2008).
Infratechnologies influence the development of technology platforms and proprietary technologies. They also support efficient R&D, production, and market transactions such as complying with customer requirements and regulations.
Infratechnologies provide the technical basis for standards that are set using consensus standard-setting processes that are usually led by industry organizations. Their benefits include full disclosure of information, reduced uncertainty regarding product attributes, and an overall improved level of trust that helps to reduce market transaction costs.
The provision of infratechnologies requires a combination of industry and government investment because infratechnologies have substantial public good content (Antonelli and Link, 2014). Some industries depend on hundreds of distinct infratechnologies and associated standards. Furthermore, a particular infratechnology may have spillover benefits for many industries.
1.1.2 Technology Platforms
Technology platforms are precompetitive proofs of concept that demonstrate the potential commercial viability of a new or improved product, process, or service. These fundamental technical concepts originate from basic science research and can even be enabled by measurement infratechnologies (Link & Scott, 2010).
A characteristic of a technology platform is that it will often be foundational to multiple products and processes, the scope of which is typically broader than the business model of any one firm. Therefore, no firm is able to fully appropriate the benefits of investing in the development of a technology platform, so achieving the socially optimal level of investment will generally require additional public investment.
1.1.3 Proprietary Technologies
Proprietary technologies are not included in the definition of technology infrastructure for this study. Proprietary technologies are commercialized products, processes, and services that may be derivatives of technology platforms and

Section 1 — Introduction
1-5
This publication is available free of charge from: http://dx.doi.org/10.6028/N
IST.GC
R.16-006
have been influenced by infratechnologies. Generally, firm investments in proprietary technology fall under the category of R&D spending. Proprietary technologies that are ubiquitous may have quasi–public good characteristics, although they are almost exclusively funded and developed by private-sector firms. Proprietary technologies are included within the scope of this study to the extent that the infratechnologies and technology platforms on which we focus enable their development and adoption.
1.2 STUDY SCOPE This report identifies gaps in technology infrastructure inhibiting the development and adoption of AM technologies by U.S. manufacturers and quantifies the prospective economic benefits of addressing these gaps. The report also outlines specific actions that the National Institute of Standards and Technology (NIST) can take to accelerate the development and adoption of critical technology infrastructure.
The research supporting this report was informed by primary data collection that consisted of unstructured and structured interviews with experts in the AM value chain, combined with secondary collection of industry information and data points. The findings of this report—the potential economic benefits and roles for NIST—are thus rooted in the perspectives of industry experts.
To ensure that a variety of perspectives were accounted for, RTI spoke with a cross section of experts in various stakeholder groups. We interviewed individuals from industry associations and research centers (observers), manufacturers of AM systems (developers), and end users of AM systems in a range of manufacturing industries (end users).
This report focuses on enhancements to the following types of technology infrastructure, identified through stakeholder interviews as industries’ most pressing needs:
Economic Analysis of Technology Infrastructure Needs for Advanced Manufacturing: Additive Manufacturing
1-6
This publication is available free of charge from: http://dx.doi.org/10.6028/N
IST.GC
R.16-006
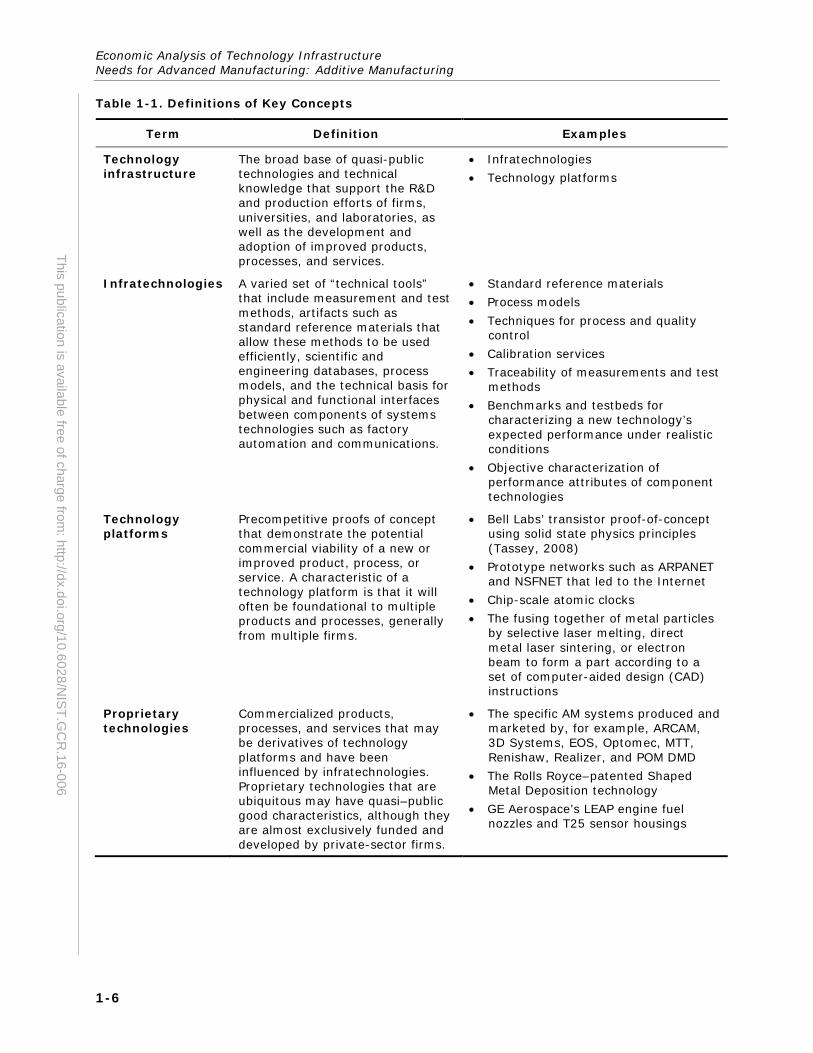
Table 1-1. Definitions of Key Concepts
Term Definition Examples
Technology infrastructure
The broad base of quasi-public technologies and technical knowledge that support the R&D and production efforts of firms, universities, and laboratories, as well as the development and adoption of improved products, processes, and services.
• Infratechnologies • Technology platforms
Infratechnologies A varied set of “technical tools” that include measurement and test methods, artifacts such as standard reference materials that allow these methods to be used efficiently, scientific and engineering databases, process models, and the technical basis for physical and functional interfaces between components of systems technologies such as factory automation and communications.
• Standard reference materials • Process models • Techniques for process and quality
control • Calibration services • Traceability of measurements and test
methods • Benchmarks and testbeds for
characterizing a new technology’s expected performance under realistic conditions
• Objective characterization of performance attributes of component technologies
Technology platforms
Precompetitive proofs of concept that demonstrate the potential commercial viability of a new or improved product, process, or service. A characteristic of a technology platform is that it will often be foundational to multiple products and processes, generally from multiple firms.
• Bell Labs’ transistor proof-of-concept using solid state physics principles (Tassey, 2008)
• Prototype networks such as ARPANET and NSFNET that led to the Internet
• Chip-scale atomic clocks • The fusing together of metal particles
by selective laser melting, direct metal laser sintering, or electron beam to form a part according to a set of computer-aided design (CAD) instructions
Proprietary technologies
Commercialized products, processes, and services that may be derivatives of technology platforms and have been influenced by infratechnologies. Proprietary technologies that are ubiquitous may have quasi–public good characteristics, although they are almost exclusively funded and developed by private-sector firms.
• The specific AM systems produced and marketed by, for example, ARCAM, 3D Systems, EOS, Optomec, MTT, Renishaw, Realizer, and POM DMD
• The Rolls Royce–patented Shaped Metal Deposition technology
• GE Aerospace’s LEAP engine fuel nozzles and T25 sensor housings

Section 1 — Introduction
1-7
This publication is available free of charge from: http://dx.doi.org/10.6028/N
IST.GC
R.16-006
1. materials and process standards and reference databases
2. design optimization tools
3. process modeling and simulation
4. real-time, in situ metrology
5. improved surface finishing of metal additive parts (i.e., improved build processes to reduce the need for postprocessing)
6. innovative mechanical testing procedures
These six needs are summarized with examples of potential impacts in Table 1-2 and discussed at length in Sections 5.1 through 5.6, drawing on explanations and anecdotes from stakeholder interviews.
Table 1-2. General Industry-Level Needs for Additive Manufacturing
Industry Needs Examples of Potential Impacts
Standards—standards, best practices, and reference data for materials and AM processes
• Improve confidence via reproducibility across manufacturing methods
• Provide greater assurance in raw materials
Metrology—real-time, in situ metrology, enabled by integrated sensors for real-time feedback during a build
• Identify in-build defects in time to correct and continue the build or scrap before using additional material
Design Allowables—design optimization tools and protocols for complex builds
• Improve “design to manufacture” guidance for designing and printing complex parts, including mesh, lightweight, and sacrificial support structures
• Reduce scrap rates and turnaround times, and improve reliability and reproducibility of parts
Modeling and Simulation—high-fidelity process modeling and simulation for different materials and designs
• Improve yields, shorter and fewer R&D cycles • Predict anomalies at various stages of a build • Understand material-specific processes leading
to new applications
Surface Finishing—cost-effective approaches to improve surface finishing of metal AM parts and standards for measuring surface finish and tolerances
• Eliminate or greatly reduce the degree of postprocessing required to make production-quality parts
Testing Procedures—innovative mechanical testing procedures
• Improve efficiency and cost savings from nondestructive and other test methods
• Improve confidence in AM processes and materials to speed up adoption and validation of high-value printed parts in various applications

Economic Analysis of Technology Infrastructure Needs for Advanced Manufacturing: Additive Manufacturing
1-8
This publication is available free of charge from: http://dx.doi.org/10.6028/N
IST.GC
R.16-006
In many interviews, our discussions highlighted significant complementarities among these six areas. For instance, high-fidelity predictive models would be a valuable tool for optimizing designs for 3D-printed parts and for qualifying parts for demanding applications with less need for destructive testing; building useful models requires large, high quality scientific and engineering databases linking materials, processes, process conditions, and surface finish with the performance characteristics of the finished part.
This report focuses on unmet needs that NIST is especially well positioned to address, highlights experts’ perspectives on these needs and the business imperative of meeting them, and provides quantitative estimates of the potential return on appropriately targeted public investment. This report does not attempt a comprehensive treatment of AM materials, processes, and applications. For a broader overview, see Caffrey and Wohlers (2015). This report also does not provide a comprehensive statement of everything that NIST can do, because it is guided by one sample of interviewees at a given point in time.
1.3 ROLE OF NIST A motivating principle for this study is that private investments in the development and adoption of new technologies typically generate social value in excess of their private returns. As a result, some socially productive technology investments are not undertaken because private companies do not see the research as profitable.3 The extent of private underinvestment, and thus the potential return on public investment, is likely to be greatest for precompetitive technology platforms and infrastructure—technologies with applications ranging well beyond the scope of any one company’s business model, often helping to bridge the divide between fundamental science and commercial development of proprietary technologies.
The private returns to developers’ and end users’ investments in AM technologies, and thus the rate and extent of adoption of these technologies in advanced manufacturing applications, will depend on the parallel development and diffusion of technology
3 The private rate of return is less than what is required (the private
hurdle rate), even though the social rate of return exceeds that required by society (the social hurdle rate).
Section 1 — Introduction
1-9
This publication is available free of charge from: http://dx.doi.org/10.6028/N
IST.GC
R.16-006
infrastructure that is generally underprovided by the market. It is this market failure—the failure of the market to provide a socially optimal level of technology infrastructure—that provides an opportunity to improve the efficiency of economic outcomes through public investment.
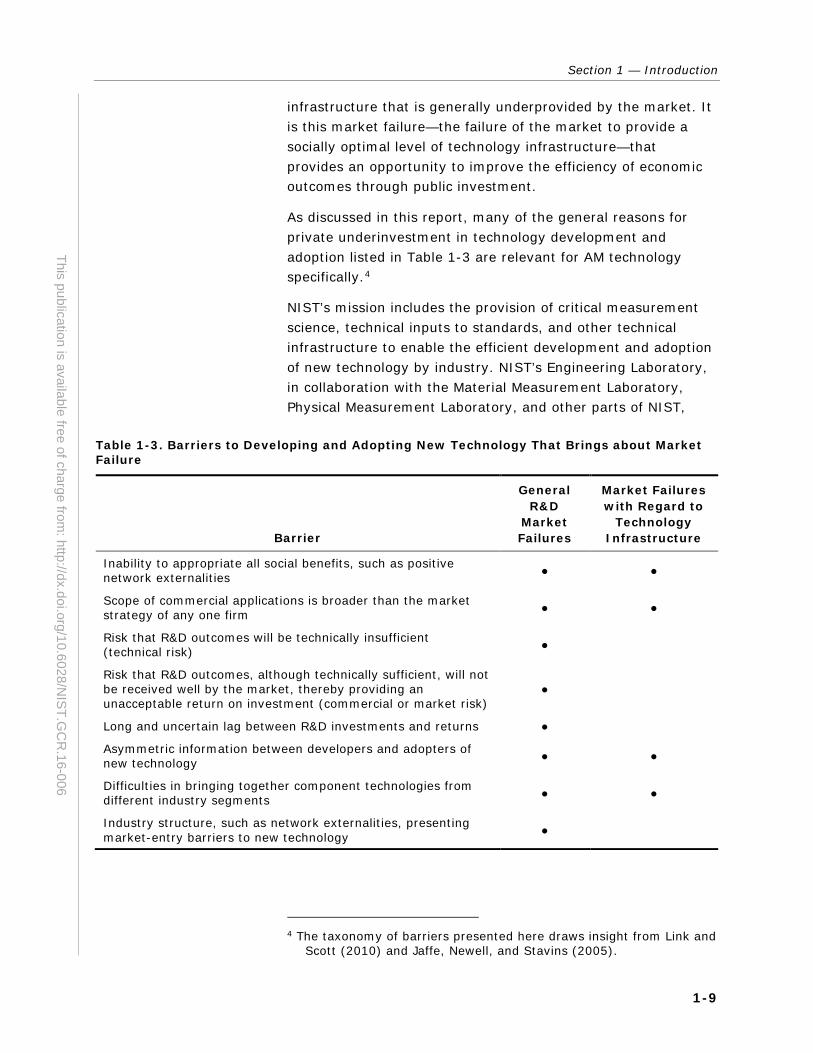
As discussed in this report, many of the general reasons for private underinvestment in technology development and adoption listed in Table 1-3 are relevant for AM technology specifically.4
NIST’s mission includes the provision of critical measurement science, technical inputs to standards, and other technical infrastructure to enable the efficient development and adoption of new technology by industry. NIST’s Engineering Laboratory, in collaboration with the Material Measurement Laboratory, Physical Measurement Laboratory, and other parts of NIST,
Table 1-3. Barriers to Developing and Adopting New Technology That Brings about Market Failure
Barrier
General R&D
Market Failures
Market Failures with Regard to
Technology Infrastructure
Inability to appropriate all social benefits, such as positive network externalities ● ●
Scope of commercial applications is broader than the market strategy of any one firm ● ●
Risk that R&D outcomes will be technically insufficient (technical risk) ●
Risk that R&D outcomes, although technically sufficient, will not be received well by the market, thereby providing an unacceptable return on investment (commercial or market risk)
●
Long and uncertain lag between R&D investments and returns ●
Asymmetric information between developers and adopters of new technology ● ●
Difficulties in bringing together component technologies from different industry segments ● ●
Industry structure, such as network externalities, presenting market-entry barriers to new technology ●
4 The taxonomy of barriers presented here draws insight from Link and
Scott (2010) and Jaffe, Newell, and Stavins (2005).
Economic Analysis of Technology Infrastructure Needs for Advanced Manufacturing: Additive Manufacturing
1-10
This publication is available free of charge from: http://dx.doi.org/10.6028/N
IST.GC
R.16-006
launched on October 1, 2013, the Measurement Science for Additive Manufacturing Program with four focus areas: material characterization, real-time process control, process and product qualification, and systems integration.5
To improve the accuracy and efficiency of material characterization, NIST is developing standardized methods to characterize the properties of metal additive powder and 3D-printed parts and, by applying these methods in extensive round robin tests, generating high-fidelity reference data.
To enable real-time process control, NIST is developing measurement systems and control algorithms using a small-scale metal laser sintering platform as a test bed. The process metrology, test methods, and traceable data developed here will support the validation of process models on factory floors everywhere, calibration of in-process sensors, and determination of optimal process conditions.
To reduce the need for extensive empirical testing to fully qualify AM processes and parts, NIST is developing measurement science to support equivalence-based and model-based qualification. In cooperation with industry and university partners, NIST is developing high-fidelity multi-physics process models and generating trusted data necessary for validating models that will be able to predict the performance characteristics of a 3D-printed part by integrating pre-process, in-process, and postprocess measurements.
To improve the performance of AM systems, NIST is developing standards to support consistent data exchange among AM modeling and simulation tools and methods of validation and verification to support the integration and exchange of AM models and data. The ultimate aim is to develop a federated information systems architecture with common data structures and interfaces to streamline the integration of AM systems.
Additional NIST activities related to additive include research in the Materials Measurement Laboratory on AM material property measurement, material testing and modeling, and defect detection; work by the Center for Neutron Research related to neutron imaging and AM residual stress measurement;
5 For details of the program and its four focus areas, see
http://www.nist.gov/el/isd/sbm/msam.cfm.

Section 1 — Introduction
1-11
This publication is available free of charge from: http://dx.doi.org/10.6028/N
IST.GC
R.16-006
statistical analysis by the Information Technology Laboratory of AM round robin test results; work by the Physical Measurement Laboratory related to thermal emissivity measurement for AM processes and laser power measurement; and industry outreach and assistance through the Manufacturing Extension Partnership.6
1.4 WHAT DISTINGUISHES THIS REPORT AM has received widespread attention, in the popular press, in the scientific and engineering literature, and in an important gray literature comprising conference presentations and technical reports produced by industry stakeholders. A recent and particularly incisive example of the latter is the Consortium for Additive Manufacturing Materials’ Strategic Roadmap for the Next Generation of Additive Manufacturing Materials (CAMM, 2015). Caffrey and Wohlers (2015) provide the latest installment in a fine series documenting AM technology state of the art and providing market analysis.
The unique contribution of this report is to identify AM technology needs most closely aligned with NIST’s mission and provide defensible estimates of the economic impact of meeting those needs. This report is intended to provide NIST and other stakeholders with relevant quantitative and qualitative information to consider when planning and prioritizing investments and research activities.
This report complements previous studies and roadmaps by engaging industry stakeholders and reporting their opinions and perspectives related to the importance to their manufacturing operations of infrastructure technology for AM. This report also builds on earlier studies by providing quantitative estimates of the potential impact of enhanced infrastructure based on stakeholder views. To facilitate stakeholder interviews, emphasis was placed on high-level areas of need, with specific infrastructure technology elements referenced only as illustrative examples. For a more exhaustive discussion of a larger set of infrastructure technology elements relevant to AM, a useful reference is the 2013 Measurement Science Roadmap for Metal-Based Additive Manufacturing (NIST, 2013). The focus
6 For more details see http://www.niu.edu/ceeT/MSAM/NIST_DED_
Workshop2016_Day1_Intro_Slides_Jurrens.pdf.

Economic Analysis of Technology Infrastructure Needs for Advanced Manufacturing: Additive Manufacturing
1-12
This publication is available free of charge from: http://dx.doi.org/10.6028/N
IST.GC
R.16-006
of this report on stakeholder views, related directly and transformed into quantitative impact estimates, also distinguishes it from recent economic studies of AM such as Thomas (2013) and Thomas and Gilbert (2014).
This report provides a working portrait of AM technology as it is applied in U.S. manufacturing industries today, focusing especially on the gaps that now exist in technology infrastructure—the currently unmet needs for measurement science, including metrology and test methods, traceable reference data, and other formal knowledge—that limit AM technology’s further development and adoption, and the ways in which meeting these needs could spur innovation and growth in US advanced manufacturing.
The remainder of this report is organized as follows:
Section 2 outlines our approach to data collection and analysis.
Section 3 provides an overview of AM technology and its application in advanced manufacturing industries.
Section 4 presents quantitative results and economic impact analysis.
Section 5 provides qualitative results, drawing heavily on stakeholder interviews and discussing each of the six identified needs.
Section 6 concludes the report by summarizing our general findings.

2-1
This publication is available free of charge from: http://dx.doi.org/10.6028/N
IST.GC
R.16-006
2 Analytical Approach
This section discusses the details of our data collection process and the transformation of interview data to support models that estimate the economic impact that enhanced technology infrastructure would have on the U.S. manufacturing sector.
2.1 DATA COLLECTION The analysis presented in this report was informed by nearly 60 interviews with technology experts representing end-using firms, technology developers, and universities. These interviews yielded a detailed summary of the most pressing technology infrastructure needs for AM, expected economic outputs and outcomes resulting from those technology needs being met, and quantitative impact data as well as anecdotes and qualitative information for context.
The sample of interviewees was identified by researching firms, industry associations, research efforts, and conferences with expertise in AM. RTI attended two conferences in 2014 and four in 2015 that were either dedicated to AM or had heavy representation from firms using AM. As well, individuals in industry and academia well connected in the AM space provided additional contacts as potential interviews.
In total, and through the means mentioned above, RTI contacted 118 individuals in a wide range of industries and research environments and succeeded in securing interviews with 55 of them. Of the 55 interviews conducted, 23 provided quantitative responses related to their respective organizations’ operating costs. The other 32 respondents did not provide quantitative responses for various reasons, most often because their involvement was more closely related to R&D or academic research; thus, their focus and expertise did not support venturing estimates of cost impacts.

Economic Analysis of Technology Infrastructure Needs for Advanced Manufacturing: Additive Manufacturing
2-2
This publication is available free of charge from: http://dx.doi.org/10.6028/N
IST.GC
R.16-006
Our data collection process began with selecting relevant sectors, then identifying contacts within those sectors with the appropriate level of expertise, conducting detailed interviews with those contacts, and determining their detailed North American Industry Classification System (NAICS) code with in the sector.
2.1.1 Interviews
Interviews were primarily conducted over the phone. For phone interviews, we provided the interview guide several days before the interview to help interviewees become better acquainted with our questions. The remaining interviews were conducted in person at industry events and conferences.
Interviews were preferable to other alternative data collection modes such as online surveys because of the highly complex, nuanced subject matter. Through interviews we were able obtain high-quality and rich information where we could walk the interviewee through our questions, providing prompts and adjusting course throughout as needed.
We identified potential interview respondents by first identifying firms selling AM systems or components (developers) and firms using AM systems in their manufacturing activities (end users). We then searched for key personnel within those firms. To supplement this list, we also identified contacts by conducting Internet searches for specific job titles. Finally, we identified and secured high-value respondents by attending industry conferences and trade shows.
Respondents represented a broad set of industries that use and develop AM technologies. Respondents also varied in seniority, from middle management to executives. Following are some examples of the job titles of those with whom we spoke:
senior engineering manager
director, advanced manufacturing technology
senior automation engineer
process automation engineer/process modeling and optimization engineer
CEO/president
founder
chief technology officer/chief technical advisor

Section 2 — Analytical Approach
2-3
This publication is available free of charge from: http://dx.doi.org/10.6028/N
IST.GC
R.16-006
global lead for manufacturing
Interview guides were used to structure the conversations and collect specific quantitative information. Two versions of the interview guide were used, one for developers (Appendix A) and one for end users (Appendix B). Some firms are hybrid developer-users, and in these cases, we focused on the end- user perspective but asked about both. Interview questions asked about expectations for the economic impact of applicable AM manufacturing technologies in terms of the percentage changes in their firm’s capital and labor, energy, and materials costs.
2.1.2 Stakeholder Groups
AM developers (systems manufacturers and material providers) and end-users (manufacturers using AM systems and service bureaus) provided complementary insights through their responses to interview questions.
All respondents provided quantitative ratings of the importance of the identified infrastructure needs. Both groups also provided qualitative insights on their perceived barriers to AM technology development and adoption, key technical pain points, and how these could be addressed by meeting the identified needs.
End users provided additional quantitative responses on how meeting identified needs for AM technology infrastructure would change the costs of four factors of production—capital, labor, energy, and materials (KLEM).
2.2 ECONOMIC MODELS Using the sales impact estimates provided by developers and the production cost impact estimates provided by end users associated with having identified needs met, we estimated the annual national impact for the United States using industry data and information about applicability.
Respondents were asked to provide a percentage impact estimate for each quantitative response, with ranges being acceptable. In cases where a respondent provided a range, we took the midpoint of the range. In cases where a respondent provided a single point estimate, the low and the high responses were assumed to be identical to the midpoint. The focus of the methods discussed below is on the midpoint impact

Economic Analysis of Technology Infrastructure Needs for Advanced Manufacturing: Additive Manufacturing
2-4
This publication is available free of charge from: http://dx.doi.org/10.6028/N
IST.GC
R.16-006
estimates, but the same approach was carried out with the low and the high responses to obtain ranges for impacts.
Quantitative responses were summarized at the micro or firm level and also scaled to reflect the applicable part of the industries represented by the interview respondents. For both approaches, we identified the industries represented by the respondents by querying a variety of sources including the following:
Hoover’s database of company profiles.
Census NAICS website search with information provided by the respondent about the division within their firm that they represent.
Descriptions of activities from company websites and/or annual reports.
2.2.1 Firm-Level Data
Respondents provided percentage changes to KLEM costs (as well as other production variables such as production yield and scrap rate). Dollar impacts were derived by first estimating the firm-level domestic sales to which the impact estimates applied. We estimated firm-level costs using industry-level cost-to-sales ratios from secondary sources such as the Annual Survey of Manufactures (ASM) and the Bureau of Labor Statistics Input-Output (IO) data. Percentage changes in costs were then applied to these estimates.
Firm-level sales were pulled from annual reports, public filings, and the Hoover’s database of company profiles. For larger firms with multiple lines of business where it was clear that the impact estimates only applied to a certain division, we estimated division-level sales using information from annual reports.
To estimate costs-to-sales ratios, we used industry data from national accounts provided by the Bureau of Labor Statistics (BLS) for industry-level energy and materials cost estimates. Energy costs included the manufacturing industry’s purchases of oil and gas extraction (NAICS 211), coal (NAICS 2121), electricity (NAICS 2211), natural gas (NAICS 2212), and refined petroleum (NAICS 324). Materials costs included purchases from other manufacturing industries in the NAICS range 3210–3330, excluding 324 (refined petroleum and coal).
Section 2 — Analytical Approach
2-5
This publication is available free of charge from: http://dx.doi.org/10.6028/N
IST.GC
R.16-006
The data provided by BLS give highly aggregated accounts for capital and labor. To better identify capital and labor costs associated with “shop floor” activities, we relied on the 2013 ASM. Capital costs include capital expenditures on machinery and equipment (CEXMCH, RPMCH), computer and peripheral equipment (CEXMCHC, PCHCMPQ), and other machinery and equipment (CEXMCHO, RPMCH). Labor costs include production workers’ annual wages (PAYANPW) grossed up to include nonwage benefits such as health insurance (BENHEA), retirement (BENPEC, BENPEB), and other fringe benefits (BENOTH).
Firm-level KLEM cost estimates then equal the estimate of firm or division sales times the relevant industry’s cost-to-sales ratio based on the BLS (energy and materials) or ASM (labor and capital) data. For example, we estimate production capital is 5.4% of sales in the iron and steel mills industry (NAICS 3311). A respondent at a firm with $500 million in sales within this industry who reported a 5% reduction in firm-wide capital costs would yield a $1.4 million ($500 * 0.054 * 0.05) capital impact estimate for advanced manufacturing technology adoption.
2.2.2 Impact Applicability
The values at the industry level, however, do not accurately reflect AM’s share of revenue generation. Because AM applications represent only a fraction of U.S. manufacturing activity, RTI analyzed the findings in the Wohlers Report 2015 (Caffrey and Wohlers, 2015) to offer more realistic impact estimates.
The Wohlers Report estimates that revenues generated from AM activities totaled roughly $4.1 billion worldwide. Because RTI is interested in only advanced manufacturing technologies in the United States for the purposes of this report, we estimated the U.S. market for AM to be $2.3 billion. This value was generated by multiplying the cumulative share of AM industrial machines installed in the United States between 1998 and 2014 (approximately 40%, according to the Wohlers Report 2015 [Caffrey and Wohlers, 2015]) by the 2014 worldwide market for AM. Thus, 40% of $5.8 billion results in a $2.3 billion market share for the United States.
Additionally, only the “services” market, which is defined as revenues generated from “parts produced on AM systems by
Economic Analysis of Technology Infrastructure Needs for Advanced Manufacturing: Additive Manufacturing
2-6
This publication is available free of charge from: http://dx.doi.org/10.6028/N
IST.GC
R.16-006
service providers, system maintenance contracts, training, seminars, conferences, expositions, advertising, publications, contract research, and consulting services,” were used in our economic impact analysis (Section 5). Revenues generated from AM system sales, materials, aftermarket products, or software were excluded.
The Wohlers Report provides industry shares of additive in terms of machine sales, which were used as a proxy for the relative size of AM at each industry. These industry shares were applied to the domestic sales value of AM ($2.3 billion) to obtain the dollar value of AM in each industry. The dollar values were then applied to our microeconomic model to discount the results because AM is involved in such a small percentage of manufacturing production.
2.2.3 Industry-Level Impacts
Respondents were asked to provide a percentage estimate for each quantitative response, with ranges being acceptable. In cases where a respondent provided a range, we took the midpoint of the range. In cases where a respondent provided a single point estimate, the low and the high numbers were assumed to be identical to the midpoint.
The midpoint estimates were averaged and applied to the respondent’s industry at the six-digit level that most closely aligned with the division and role of the respondent. However, the results were rolled up to the four-digit level for presentation purposes only, and the underlying data were still derived at the six-digit level.
The number of responses varies by four-digit manufacturing NAICS. We received quantitative responses for 12 of the approximately 85 NAICS manufacturing sectors defined at the four-digit NAICS level. The majority of the 85 manufacturing industries are not using AM. Though they may benefit from the technology in the future, the industries targeted in this analysis were the industries that are most familiar with AM. This under-response biases our estimates downward.
2.2.4 Apportioning Total Impacts over Industry Needs
We apportioned a share of the total cost impact to each of the six industry needs in Table 1-2 according to the average importance ratings associated with each need. We used only

Section 2 — Analytical Approach
2-7
This publication is available free of charge from: http://dx.doi.org/10.6028/N
IST.GC
R.16-006
the importance ratings provided by end users (see Section 4.1 and Appendix C on importance ratings).
For example, if an interviewee awarded a total of 20 points across the six capabilities (i.e., if the sum of the six importance ratings was 20), and if modeling and simulation was rated a 5 and real-time metrology was rated a 2, then these shares would be 25% and 10%, respectively. We then averaged these shares across individuals and applied them to the total cost impact.
2.3 CONSERVATIVE NATURE OF APPROACH The quantitative economic impact estimates calculated in this study are considered to be conservative in that they do not capture all the benefits that would result from an improved technology infrastructure. As discussed below, the focus of our analysis is on reductions in manufacturers’ production costs that would result from meeting the identified technology infrastructure needs. However, this focus does not encompass all of the potential economic benefits associated with an enhanced technology infrastructure.
Lowering U.S. manufacturers’ production costs in AM-specific applications would lead to lower prices for consumers of 3D-printed goods, which in turn would lead to the expansion of these market segments. Of even greater importance, albeit more difficult to quantify with any sort of accuracy, meeting these needs would lead to improvements in the performance characteristics of AM parts, which would shift demand outward and expand these market segments still further. The emergence of altogether new products and markets would almost certainly also be accelerated.
Quantifying the value of new (yet to be defined) products or product attributes is difficult, involves great uncertainty, and is beyond the scope of the study.
An improved technology infrastructure will also lead to reduced R&D costs. However, interviewees were not able to quantify R&D savings, saying that the benefits would be a mixture of improved/accelerated R&D and enhanced product quality. Hence, these categories of benefits are discussed only qualitatively and are not included in the quantitative economic impact estimates.

Economic Analysis of Technology Infrastructure Needs for Advanced Manufacturing: Additive Manufacturing
2-8
This publication is available free of charge from: http://dx.doi.org/10.6028/N
IST.GC
R.16-006
In general, focusing on manufacturing cost savings implies the analysis captures primarily gains in producer surplus and does not capture gains in consumer surplus associated with improved product quality. In addition, the analysis does not capture increases in social welfare from increased output (sales), which result from lower cost and higher demand. Nor does the analysis capture long-term competitive benefits such as on-shoring (or re-shoring) of advanced manufacturing activity that would result from general improvements in productivity and specifically greater advantages in collocating R&D and production and locating production facilities close to the large U.S. customer base. Also not quantified is the potential effect of enhanced infrastructure to improve the reliability of additively manufactured parts, with its implications for product safety, product liability, and the chilling effect premature failures can have on the adoption of new technology.
For these reasons, the economic impacts presented are considered to be conservative, lower-bound estimates.

3-1
This publication is available free of charge from: http://dx.doi.org/10.6028/N
IST.GC
R.16-006
3 Overview of Additive Manufacturing
In the early 1980s, an engineer named Chuck Hull had an idea: to use UV light to cure successive layers of (liquid) photo-curable polymer one on another to form 3D shapes. By the mid-1980s, Hull was marketing his rudimentary 3D printer to the US automotive industry as a means of producing prototypes without the need to send blueprints to a tool-and-die shop and wait months for the parts to come back (Kennedy, 2013).
Fittingly, rapid prototyping (RP) was the first name given to this emerging technology. As the technology became more widely used in myriad applications, 3D printing became the popular name, although solid freeform fabrication and other synonyms are sometimes still used. Perhaps to emphasize the difference between hobbyist-scale 3D printers and the industrial scale machines that melt advanced metal alloys with lasers, industry users have gravitated to the term additive manufacturing (AM).
Manufacturers across a range of industries are exploring an even wider range of applications for this versatile new technology as an alternative to conventional manufacturing methods: injection molding for plastics and, for metals: investment casting; shaping, as by forging or rolling, to produce wrought material; welding; and machining, typically using Computer Numerical Control (CNC) machines to guide machine tools such as drills, lathes, mills, and grinders.
Extant measurement science, materials property databases, standards, design methodologies, all have had decades to mature around these conventional manufacturing methods. Polymers and metal alloys have been optimized for these
Economic Analysis of Technology Infrastructure Needs for Advanced Manufacturing: Additive Manufacturing
3-2
This publication is available free of charge from: http://dx.doi.org/10.6028/N
IST.GC
R.16-006
processes. Even in this environment, manufacturers’ perceive worthwhile investments in AM technologies, particularly in prototyping and tooling applications, but only up to a point. Continued strong growth in AM, especially in metal and in the production of critical structural and functional parts, will depend on the development of analogous infrastructure for AM.
3.1 MATERIALS AND PROCESSES The performance characteristics of 3D-printed parts depend on the properties of the raw materials—additive feedstocks—and the process by which the particles of material are fused together to form the part. These dependencies are sometimes described as process-structure-property relationships: Feedstock and process conditions determine the microscopic structure of the 3D-printed material, and that structure in turn determines its properties. Postbuild processing that influences material properties (such as heating or shot peening) also affects the properties of the finished part.
When performance characteristics of the 3D-printed parts are critical—as in the case of functional jet engine parts or implantable medical devices—AM systems users must be able to ascertain all the relevant properties of their feedstocks, control and monitor all of the relevant variables during the build, and have a fundamental understanding of how those material properties and process conditions correlate with the performance characteristics of the finished part.
Designers—using CAD software to define part requirements to meet the desired function—must know the tolerances of the materials and processes that will be used to bring their designs to life: How closely can they expect the raw materials and the process conditions to conform to the ideal? How will any variance affect how the part performs or under what conditions it will fail?
The two major categories of AM feedstocks are plastics and metals. Ceramic materials are also used, in combination with plastics or metals, in a limited number of applications. The ceramic material may be blended with sacrificial polymers that act as support structures during the build, often to produce porous ceramic molds for investment casting, or may be mixed with metal powder, the ceramic powder acting as an additive, to change the fluidity or melting behavior of the metal (CAMM,

Section 3 — Overview of Additive Manufacturing
3-3
This publication is available free of charge from: http://dx.doi.org/10.6028/N
IST.GC
R.16-006
2015). Table 3-1 summarizes the most commonly used processes and materials.
3.1.1 Plastics
Plastic additive feedstocks account for more than 90% of all AM feedstock sales.7 As a rough indication of the relative scale of AM, Caffrey and Wohlers (2015, p. 54) cite an estimate by a representative of an international chemical company that for every kilogram of AM polymer sold, 100,000 kilograms of plastic material are sold for conventional manufacturing applications. In part because of the additional processing steps involved in producing plastic additive feedstocks, but also in no small part because of the relatively small market dominated by a small number of sellers, additive plastic feedstocks sell for 50 to 100 times the price per kilogram of the same raw materials for conventional use.8
Fully characterizing property-structure-performance relationships for plastics is important in many applications, although plastics-focused industry stakeholders with whom RTI spoke expressed relatively less need for technology infrastructure to support their efforts. Part of the reason seems
Table 3-1. Techniques/Methods Used in Additive Manufacturing
Production Process Material Market
Vat photopolymerization Photopolymers Prototyping
Powder bed fusion Polymers, metals Prototyping, direct part, tooling
Material jetting Polymers, waxes Prototyping, casting pattern
Binder jetting Polymers, metals, foundry, sand Prototyping, casting molds, direct part
Material extrusion Polymers Prototyping, non-structural direct part
Sheet lamination Paper, metals Prototyping, direct part
Directed energy deposition Metals Repair, direct part, tooling
Source: ASTM; compiled by the Industrial Economics & Knowledge Center, Industrial Technology Research Institute of Taiwan (2013).
7 Of $640 million in worldwide additive feedstock sales in 2014, metal
accounted for $48.7 million (Caffrey and Wohlers, 2015). 8 Caffrey and Wohlers (2015, p. 54) report a range of $175 to $250
per kilogram for thermoplastics and photopolymers for industrial AM systems, compared with $2 to $3 per kilogram for thermoplastics for injection molding.

Economic Analysis of Technology Infrastructure Needs for Advanced Manufacturing: Additive Manufacturing
3-4
This publication is available free of charge from: http://dx.doi.org/10.6028/N
IST.GC
R.16-006
to be that knowledge of conventionally processed plastics is relatively easy to leverage into an adequate understanding of the same materials processed on AM systems; additive processing introduces only a limited range of additional uncertainty. Also part of the reason: 3D-printed plastic parts are less often used in the most demanding applications, requiring qualification and certification. When qualification of a plastic part is required, it is less likely to be prohibitively expensive for a company to satisfy the requirement by brute force—relying on extensive empirical testing. Finally, plastic AM has simply been around longer, and the relevant knowledge base has had longer to develop. Several technical barriers and unmet measurement science needs exist in polymer AM. NIST’s Material Measurement Laboratory is hosting a road mapping workshop on polymers in June 2016 to further define and address these issues.
3.1.2 Metals
Although metal additive feedstocks currently account for less than 10% of all AM feedstock sales, metal dominates manufacturing applications for which technology infrastructure needs are most pressing.
Various metal alloys are used in different applications. The consensus among the metal-focused industry stakeholders with whom RTI spoke was that formal knowledge would be fairly specific to an alloy, or a family of alloys, and that formal knowledge about a particular alloy would be relatively application-agnostic. Note that it is generally not possible to separate the materials (i.e., type of alloy) from the process (i.e., the AM system used to build the parts) because of the specialized nature of structure-processing-property relationships for each alloy and the fact that AM, unlike traditional subtractive manufacturing, is also materials processing.
In other words, formal knowledge (using this term as shorthand for the measurement science and various elements of technology infrastructure NIST can provide) about stainless steel would be of little use to manufacturers building with titanium or aluminum but would be equally useful to manufacturers in different industries building stainless steel parts for different applications (provided they are using the same process).

Section 3 — Overview of Additive Manufacturing
3-5
This publication is available free of charge from: http://dx.doi.org/10.6028/N
IST.GC
R.16-006
One aerospace engineer suggested that the greatest value would come from NIST pursuing three to five alloys in parallel, generating formal knowledge about the most commonly used titanium, aluminum, and stainless alloys, plus one super alloy, plus Cobalt-Chromium, or CoCr (Table 3-2). Because of the noted interdependence of process and material, a challenge in undertaking this type of study would be to select the process most appropriate for each alloy. Selection of material–process pairs for study may run into trade-offs across different industries and applications that may make it difficult to move forward. That is, if there is no single material–process pair (or even a small set of such pairings) that would be widely applicable across a range of industries, it may be difficult to justify moving forward with a scope of inquiry likely to benefit (at least in the short run) only a relatively narrow industry segment.
3.1.3 Metallic Additive Manufacturing Systems
Metal AM systems include powder bed, powder feed, and wire feed. Feedstocks are melted and fused by laser, electron beam, or plasma arc. Frazier (2014) provides an excellent overview.
In powder feed–directed energy deposition systems, metal powder is fed through a nozzle, or deposition head, onto the build surface and fused with a laser. The work piece may remain stationary while the deposition head moves, or the deposition head may remain stationary while the work piece moves. The build area can be large, upwards of 1 cubic meter, and the systems can be used to refurbish worn parts or repair damaged ones. Siemens uses SLM Solutions’ powder feed systems to replace blades on customers’ gas turbines (“Heavy
Table 3-2. Selected Alloys Used in Additive Manufacturing
Titanium Aluminum Tool Steels Super Alloys Stainless
Steel Refractory
Ti-6Al-4V Al-Si-Mg H13 IN625 316 & 316L MoRe
ELI Ti 6061 Cermets IN718 420 Ta-W
CP Ti Satellite 347 CoCr
γ-TiAl PH 17-4 Alumina
Source: Frazier (2014).
Economic Analysis of Technology Infrastructure Needs for Advanced Manufacturing: Additive Manufacturing
3-6
This publication is available free of charge from: http://dx.doi.org/10.6028/N
IST.GC
R.16-006
Metal,” 2015). Powder feed systems are also used to repair the burner tips of gas turbine burners.
Wire feed–directed energy deposition systems are unusual among metal AM systems in using feedstock in the form of wire rather than powder. Wire feed offers build areas comparable to powder feed, using electron beam, laser beam, or plasma arc to melt a bead of material onto the work piece. Advantages of wire feed systems include high deposition rate and large build volumes, but for most applications require more extensive surface finishing (Frazier, 2014).
Powder bed fusion systems afford manufacturers the greatest capabilities to maintain dimensional control and to produce high resolution features and internal passages, albeit in a smaller build area; think of a cube roughly 30 cm on a side (Frazier, 2014). Think of a surface onto which a thin layer of powder is raked, and then selectively melted with a laser or electron beam.9 The work piece is lowered slightly—by the height of a layer of powder, a fresh layer of powder is raked across, and the process repeats. The LEAP engine fuel nozzles and T25 sensor housings are built with powder bed fusion systems.
3.2 APPLICATIONS AND INDUSTRIES The first AM systems, emerging in the 1980s, were used for modeling and prototyping, applications that cut across all manufacturing industries. The formal knowledge base supporting these applications has had decades to mature.10 Soon after, and similarly cross-cutting, came 3D-printed silicone rubber tooling, or molds, for prototype, pre-production, and production urethane parts. More recently, investment casting patterns, molds and cores for sand casting, tooling, and tooling inserts have been 3D printed (Caffrey and Wohlers, 2015).
9 Selective laser melting is more common; used by six of eight
systems manufacturers. EOS (Germany) uses direct metal laser sintering. ARCAM (Sweden) uses electron beam. Until recently, all eight powder bed fusion systems manufacturers were located outside the United States (Frazier, 2014). 3D Systems, headquartered in Rock Hill, South Carolina, recently added a powder bed fusion system to its product line.
10 The first systems from the 1980s actually consist of multiple (and very different) technologies, each with its own knowledge base.
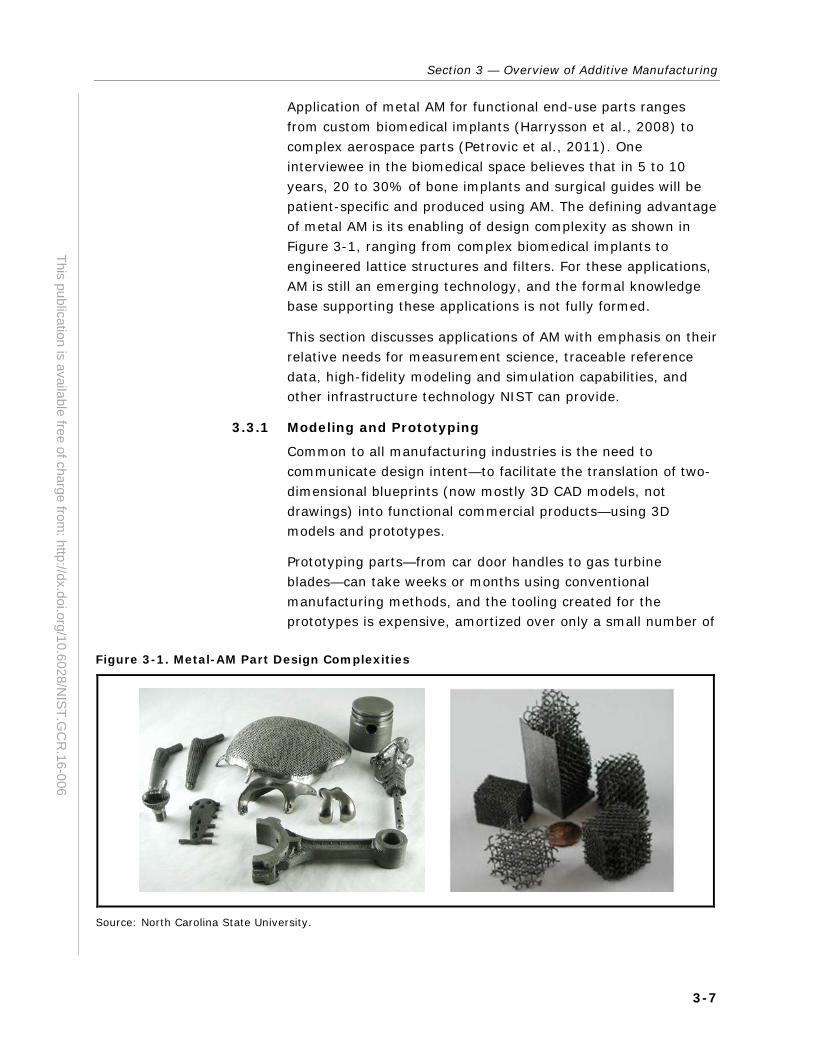
Section 3 — Overview of Additive Manufacturing
3-7
This publication is available free of charge from: http://dx.doi.org/10.6028/N
IST.GC
R.16-006
Application of metal AM for functional end-use parts ranges from custom biomedical implants (Harrysson et al., 2008) to complex aerospace parts (Petrovic et al., 2011). One interviewee in the biomedical space believes that in 5 to 10 years, 20 to 30% of bone implants and surgical guides will be patient-specific and produced using AM. The defining advantage of metal AM is its enabling of design complexity as shown in Figure 3-1, ranging from complex biomedical implants to engineered lattice structures and filters. For these applications, AM is still an emerging technology, and the formal knowledge base supporting these applications is not fully formed.
This section discusses applications of AM with emphasis on their relative needs for measurement science, traceable reference data, high-fidelity modeling and simulation capabilities, and other infrastructure technology NIST can provide.
3.3.1 Modeling and Prototyping
Common to all manufacturing industries is the need to communicate design intent—to facilitate the translation of two-dimensional blueprints (now mostly 3D CAD models, not drawings) into functional commercial products—using 3D models and prototypes.
Prototyping parts—from car door handles to gas turbine blades—can take weeks or months using conventional manufacturing methods, and the tooling created for the prototypes is expensive, amortized over only a small number of
Figure 3-1. Metal-AM Part Design Complexities
Source: North Carolina State University.
Economic Analysis of Technology Infrastructure Needs for Advanced Manufacturing: Additive Manufacturing
3-8
This publication is available free of charge from: http://dx.doi.org/10.6028/N
IST.GC
R.16-006
pieces. AM eliminates the need for tooling and reduces the turnaround time to days if not hours.
These applications of AM are exciting and offer real value to manufacturers. The formal knowledge base supporting these applications is relatively mature, and the potential return on public investment to further develop that knowledge base is relatively small.
3.3.2 Tooling
Tooling, such as molds and cores, dies, fixtures, and jigs, also cuts across all manufacturing industries. The role of AM is detailed by Caffrey and Wohlers (2015).11 Illustrative examples include the use of AM parts as investment casting patterns, eliminating the need for costly, time-intensive wax pattern tooling; 3D-printed molds and cores for sand casting prototype engine, transmission, and brake components; and 3D-printed tooling and tooling inserts with conformal cooling channels that wick heat more efficiently and so improve the quality of the molded part.
Like prototyping, although tooling applications of AM are exciting and offer real value to manufacturers, the formal knowledge base supporting these applications is relatively mature, and the potential return on public investment to further develop that knowledge base is therefore relatively small.
3.3.3 Aerospace
3D printed parts are now in service on commercial aircraft. These include many polymer parts and some metal structural parts—not flight-critical wing struts but such parts as overhead luggage brackets—and the T25 sensor housing now flying in some of the GE90 engines that power Boeing’s 777. In October 2015, CFM International, a 50-50 joint venture between France’s Safran and GE Aviation, delivered the first LEAP 1B engines to Boeing; the engines will power the new 737 MAX airplane.12 Each LEAP engine contains 19 of GE’s 3D-printed fuel nozzles.
11 Additional discussion of metal casting processes can be accessed at
wohlersassociates.com/castmetal2015.pdf. A history of AM tooling options can be accessed at wohlersassociates.com/tooling2015.pdf.
12 http://www.cfmaeroengines.com/press/cfm-delivers-first-leap-1b-engines-to-boeing/823.

Section 3 — Overview of Additive Manufacturing
3-9
This publication is available free of charge from: http://dx.doi.org/10.6028/N
IST.GC
R.16-006
Eliminating 1 kilogram from a commercial jet would have saved an estimated $3000 annually in 2011, when the price of jet fuel was around $3 per gallon (West, 2011). Jet fuel has recently been around $1, so at today’s prices, 1 kilogram saved is worth roughly $1000. Each of the 58 3D-printed fuel nozzles on the 737 MAX (29 in each of two engines) is 25% lighter than its conventionally built predecessor (RTI did not ascertain the weight of each nozzle); additional savings come from more efficient fuel delivery achieved by an internal structure enabled by AM. A 2013 contest, sponsored by GE to redesign for AM a 2,033-gram engine bracket (used by manufacturing and maintenance crews to manipulate the 6-ton engines), was won by M. Arie Kurniawan, an engineer from Indonesia. The winning design shaved 1,706 grams—worth $1,706 in annual fuel savings at today’s prices.
To bring the LEAP fuel nozzles into commercial service, GE made large investments in acquiring (through its acquisitions of Morris Technologies and Rapid Quality Manufacturing) and developing in its R&D labs the formal knowledge needed to design, build, and qualify the 3D-printed nozzles. R&D investments on this scale are not feasible for many companies. Much of the knowledge generated by GE in this effort is not specific to the LEAP nozzle and certainly would have application well beyond the scope of even GE’s widely diversified technology portfolio.
It follows that private investment in generating formal knowledge about AM technology for high-value applications is likely to be less than optimal for at least two reasons: imperfect credit markets (characterized by information asymmetries between lenders and borrowers) will not fund every R&D project with positive expected net present value, and the expected return on R&D investment that determines a company’s willingness to invest will be limited to the scope of its own business strategies. Public investment in generating and disseminating formal knowledge can help to correct this market failure.
The need to qualify and certify flight-critical parts makes the need especially great for formal knowledge analogous to that now supporting qualification and certification of conventionally made parts for aerospace applications. As a well-respected senior engineer at a leading aerospace firm noted during an
Economic Analysis of Technology Infrastructure Needs for Advanced Manufacturing: Additive Manufacturing
3-10
This publication is available free of charge from: http://dx.doi.org/10.6028/N
IST.GC
R.16-006
interview with RTI, AM needs “objective evidence of compliance to design intent. When you pull a part out of the machine, how do you know it meets its design intent?” According to another respondent in the same industry, “[you need] empirical evidence of success to build customer confidence.” This is the ultimate goal for AM: achieving a level of confidence that a part be almost certainly free of deformations and functionally sound, while adhering to design standards and guidelines. Combining specialized scientific and engineering expertise with impartiality, NIST is especially well positioned to overcome this barrier—an uncertainty-based market failure—by acting as an honest broker among parties at different tiers of supply chains.
Non-flight-critical parts, including air grates, panel covers, and other interior parts, do not require the same level of standards as flight-critical parts (Hiemenz, 2013). Though these parts are not necessarily advanced in the nature of their functions, the ability to additively manufacture an air grate, for example, could still offer the economic advantages mentioned above.
Because the aerospace industry produces relatively low volumes of aircraft across markets, AM enables these markets to operate without economies of scale. A few advantages of additively producing parts for aircraft and other aerospace applications are as follows:
This method achieves cost savings through reduced scrap rates, faster turnaround times, availability of replacement parts, and (potentially) on-site production.
AM can produce lighter-than-usual parts compared with traditional manufacturing and, therefore, can improve fuel efficiency for aircraft; this advantage is primarily due to redesigns of (complex) customized parts that only AM can produce, thus achieving the same strength with less material.
Design flexibility can lead to new innovations for aerospace applications. An additively manufactured part can be approximately one-third the weight of a subtractively manufactured part if part designs are optimized for AM fabrication (Hiemenz, 2013).
Parts can be 3D-printed in a single piece, making welds unnecessary, thereby eliminating weakness and weight.
The potential for new designs and applications in aerospace is great, but AM can also serve to develop replacement parts for older aircraft in a very short time frame. Helicopters, for

Section 3 — Overview of Additive Manufacturing
3-11
This publication is available free of charge from: http://dx.doi.org/10.6028/N
IST.GC
R.16-006
example, have essentially the same mechanics today as they did decades ago. As the demand for new mechanics has slowed, the defense industry has continually upgraded helicopters that date back to the Vietnam War with new electronics and navigation systems.
Manufacturing replacement parts using traditional manufacturing processes such as casting is extremely time consuming and expensive because of the overhead costs of tooling, such as forging dies for a given part. An advantage of AM is that it can replace these parts essentially on demand, creating a more efficient manufacturing sector (Wysk, 2014).
AM is expected to become integral to aerospace design and production because many large defense contractors and aerospace companies are already working with additive manufacturers (Shipp et al., 2012). Many interviewees from firms and universities who work in aerospace stated that the field anticipates AM to steadily increase its share of manufacturing in this industry within the next 5 to 10 years.
3.3.4 Armaments
The weapons and military systems, or armaments, industry is similar to the aerospace industry in that many high-value parts are produced in relatively low volumes. Because of the significant overhead costs of traditional manufacturing, low-volume production is not economically viable. AM enables cost-effective low-value production of complex parts (Bourell, Leu, and Rosen, 2009). Of particular importance to the armaments industry is the opportunity for additively produced parts to be manufactured in remote locations.
Given the levels of defense spending, the market for armaments is an attractive one: in 2012, arms sales of the Stockholm International Peace Research Institute top 100 arms-producing companies totaled $395 billion (excluding China) (Perlo-Freeman and Wezeman, 2014). Applications for weapons and military systems include
lightweight gear and armor for soldiers,
ground-based robots,
customized gun components, and
camera mounts for military vehicles (Bourell, Leu, and Rosen, 2009; Gausemeier et al., 2011).
Economic Analysis of Technology Infrastructure Needs for Advanced Manufacturing: Additive Manufacturing
3-12
This publication is available free of charge from: http://dx.doi.org/10.6028/N
IST.GC
R.16-006
As additive processes and materials improve over the next 5 to 10 years, the armaments industry is expected to be a major user of these technologies to produce a wide range of military supporting components (Bourell, Leu, and Rosen, 2009).
3.3.5 Automotive
The automotive industry is one of the major users of AM technology. As recent as 2009, the automotive industry contributed 17.5% to the total AM market volume, making it the largest AM user. In this industry, AM is primarily used for concept modeling, functional testing, and rapid prototyping of parts (Roland Berger, 2013; Frost and Sullivan, 2007). However, its usefulness in the motorsports industry has been realized because high performance and weight reduction are critical to racing cars (Gausemeier et al., 2011). Additionally, some low production volume luxury cars have used AM for some of their smaller, more complex parts and are considering AM for entire components because of the faster production time and reduced costs (RAE, 2013). Time to market, weight reduction, customization, and other business-side advantages of additively produced parts will benefit the automotive industry greatly in the medium- to long-term outlook.
3.3.6 Dental
Printing customized dental products such as crowns, bridges, custom orthodontic products, and braces is becoming more widespread in the dental industry. The technology advancements in AM allow significantly faster turnaround and greater production volume of dental products than traditional casting processes (from 20 up to 450 dental frames per day using additive processes) (Gausemeier et al., 2011). Although the dental industry is more mature—in terms of AM—than many other industries mentioned in this section, it is trending toward (1) less costly manufacturing techniques, (2) the development of new materials, and (3) a focus on aesthetics including coloring and shaping of teeth (Manning, 2013).
3.3.7 Biomedical
Implants, prosthetics, and tissue engineering are in early stages of development by companies and researchers alike to design and manufacturer customized parts. Because of the potential issues with biocompatibility (or how the artificial and biologic parts will interact), AM processes are only slowly

Section 3 — Overview of Additive Manufacturing
3-13
This publication is available free of charge from: http://dx.doi.org/10.6028/N
IST.GC
R.16-006
advancing toward the production of end-use applications. Applications in the biomedical industry range from joint replacement and prosthetics13 to printed tissues and organs (Melchels et al., 2012). The advantages of using AM for these applications are the ability to produce customized products, faster turnaround times, and reduced overhead costs.
Future applications for this industry have enormous potential and diversity. In the short term, more functional prosthetics and implants will likely aim to improve patient comfort and mobility. Tissue and organ transplant may be the most far-reaching application, but early research on the repair and regeneration of tissues is promising (Melchels et al., 2012). Implantable devices for monitoring organ function, diagnostics, drug delivery, and communicating with remote devices are other promising applications of AM in combination with other new technologies.
3.3.8 Consumer Goods
AM in the sporting goods industry is frequently used for RP of shoes and other equipment but could be used to produce finished goods for athletes. Given the ever-growing safety concerns in collision sports, creating additively produced protective gear is a potential application in the industry. The complex internal structures that AM is capable of could help, for example, to absorb impacts. Other applications for AM include high-performance equipment such as snowboard bindings, bicycle parts, athletic shoes, and others, provided customers are willing to pay.
Other consumer goods are also exploring AM for more than RP. Textiles, jewelry, and toys are all candidates for additively produced goods. For these applications to be cost-competitive, however, products must feature high performance, complex designs, or customization.
3.4 STAKEHOLDERS Despite the hype and promise of AM and its seemingly limitless possibilities, the technology still has a long way to go before printing becomes the go-to means of creating complex
13 Common use includes custom surgical guides, hearing aids, and
bone implants (e.g., titanium skull implants by Walter Reed Hospital).

Economic Analysis of Technology Infrastructure Needs for Advanced Manufacturing: Additive Manufacturing
3-14
This publication is available free of charge from: http://dx.doi.org/10.6028/N
IST.GC
R.16-006
mechanical parts. The growth and challenges of AM have created a need for new supporting technologies, working groups, and businesses.
3.4.1 Standards Organizations
Given the complexity of the technology, standards organizations are vital to the diffusion and application of the technology to small and medium enterprises (SMEs). ASTM and the International Organization for Standardization (ISO) are the two main organizations that have developed standards for AM, including standards for terminology and nomenclature, file formats, materials as they are applied to AM processes, coordinate systems, and test methods. Dozens of other standards are being developed by ASTM and ISO related to material consistency among suppliers, among other standards.
Specifically, the relevant committees are ASTM International Committee F42 and ISO Technical Committee 261.
Many other standards development organizations have appeared since 2015, including ASME Y14.46, SAE AM-AMS, and AWS D20. Coordination of AM standards development is important and currently in progress. One such effort is the America Makes & ANSI Additive Manufacturing Standardization Collaborative (AMSC), formally launched in March 2016.
3.4.2 Industry Associations
Stakeholders of AM have partnered to form consortia and other associations to tackle some of the core challenges of AM and push the technology forward. America Makes, founded in August 2012 as the National Additive Manufacturing Innovation Institute, consists of a network of more than 100 U.S.-based companies, nonprofits, universities, and government agencies. It is the largest AM industry association. The goal of America Makes is to accelerate the growth and adoption of AM in the United States to foster American competitiveness in the manufacturing sector. America Makes
facilitates the open exchange of research data on AM systems, processes, and materials;
conducts collaborative research to solve challenging problems at various stages of the product life cycle; and
connects and engages stakeholders to improve the capabilities of their technologies and provide access to resources.

Section 3 — Overview of Additive Manufacturing
3-15
This publication is available free of charge from: http://dx.doi.org/10.6028/N
IST.GC
R.16-006
The 3D Printing Association is a membership-based organization tasked with supporting and promoting stakeholders of AM. Education, information exchange, and networking are important components of the 3D Printing Association. Additionally, investment opportunities are available for start-ups and smaller companies.
Several other associations and consortiums exist that have activities relevant to AM, including the Additive Manufacturing Consortium (AMC), CAMM (Amtech effort), ASPE, ASME, SAE, and many others.
The Society of Manufacturing Engineers is a professional society of engineers, students, professors, and companies involved in all areas of manufacturing. AM is a focus area of the Society of Manufacturing Engineers in the Rapid Technologies and Additive Manufacturing group. Its primary goal is education, training, and awareness for AM technologies and their applications.
3.4.3 Federal Investment
President Obama’s Advanced Manufacturing Partnership has spurred the involvement of federal agencies and programs in AM R&D and grant funding opportunities.
The Department of Defense (DoD) is one of the primary agencies focusing efforts toward more timely, cost-effective manufacturing methods. The Navy Manufacturing Technology Program, under the Office of Naval Research (ONR) and DoD, is conducting early research on hybrid AM systems. One of the interest areas for the Navy, as well as the other military branches, is local manufacturing capabilities. An effective AM machine aboard a naval ship could enable the rapid repair or building of parts in the event of a damaged or malfunctioning part. The ONR also oversees the Institute for Manufacturing and Sustainment Technologies (iMAST), part of the Applied Research Laboratory at Penn State. iMAST is exploring AM technologies, nondestructive testing, reverse engineering, and computer-integrated manufacturing. Other DoD-funded R&D programs focus on composite materials for lightweighting equipment in aircraft, ships, submarines, land vehicles, and weapons and missiles.
The National Science Foundation (NSF) is also targeting AM technologies. NSF has several programs dedicated to manufacturing systems in general, many of which involve

Economic Analysis of Technology Infrastructure Needs for Advanced Manufacturing: Additive Manufacturing
3-16
This publication is available free of charge from: http://dx.doi.org/10.6028/N
IST.GC
R.16-006
materials, information systems, and hardware for AM. Aside from the technical aspects of the manufacturing processes, NSF supports supply-chain management and digital integration among local and remote systems.
The Department of Energy (DOE) is investing in energy-capture technologies using AM materials and processes. Of interest to DOE is the efficiency and cost-savings opportunities that could make photovoltaics, organic light-emitting diodes, and other technologies more affordable and prevalent. DOE’s Critical Materials Institute is exploring materials development to be used as substitutes for difficult-to-extract, costly materials (such as rare earth elements) and others that may foster more efficient processes.
The National Aeronautics and Space Administration (NASA) is funding materials research to be applied to spacecraft and equipment. NASA is also funding the Made In Space program, which is developing an AM machine built for use in zero gravity. The printer developed by Made In Space launched in September 2014, aboard a rocket directed to the International Space Station. The printer will serve as an on-site manufacturing system to build parts and tools in zero gravity. Made In Space was founded in 2010.
Oak Ridge National Laboratory (ORNL) and Lawrence Livermore National Laboratory (LLNL) have invested heavily in AM R&D. ORNL has partnered with the University of Cincinnati to develop a large-scale AM machine capable of printing polymer parts up to 10 times the current producible size and several hundred times faster than existing machines. LLNL is striving to accelerate the certification of mission and flight-critical parts through modeling and simulation rather than destructive testing.
Other federal connections to AM include the following: Defense Advanced Research Projects Agency (DARPA) Open Manufacturing funds several large AM efforts. Air Force Research Laboratory manages the award to America Makes. The America Makes public–private partnership includes Air Force, Army, Navy, Defense Logistics Agency, DARPA, DOE, NASA, NSF, NIST, DoEd, FDA, and FAA. The NASA Marshall Space Flight Center is a long-time AM user and has much experience. The FAA and FDA are determining their regulatory guidance for AM parts within their areas.

4-1
This publication is available free of charge from: http://dx.doi.org/10.6028/N
IST.GC
R.16-006
4 Quantitative Results and Economic Impact Analysis
This section summarizes industry stakeholders’ responses to quantitative interview questions, relating to the relative importance of meeting the identified technology infrastructure needs, and presents the potential economic impact of meeting those needs.
4.1 IMPORTANCE RATINGS OF INFRASTRUCTURE TECHNOLOGY NEEDS The six technology needs identified through stakeholder interviews as the most pressing for industry are summarized with examples of potential impacts in Table 4-1 (reprised from Table 1-2 for convenient reference).
RTI collected ‘importance ratings’ for these needs to characterize their relative significance and urgency. We asked respondents to rate, using a Likert scale, the importance of solving each technology need.
Figure 4-1 summarizes the importance of the technology needs based on interview feedback. The results are aggregated by four-digit NAICS code, plus a more general R&D category that includes researchers in academia and national laboratories. As evident in Figure 4-1, standards and best practices were considered to be the most important technology need. In fact, no interview respondent rated it lower than a 3, or “neutral,” and the median response was a 5, or “very important.”

Economic Analysis of Technology Infrastructure Needs for Advanced Manufacturing: Additive Manufacturing
4-2
This publication is available free of charge from: http://dx.doi.org/10.6028/N
IST.GC
R.16-006
Table 4-1. General Industry-Level Needs for Additive Manufacturing
Industry Needs Examples of Potential Impacts
Standards—standards, best practices, and reference data for materials and AM processes
• Improve confidence via reproducibility across manufacturing methods
• Provide greater assurance in raw materials
Metrology—real-time, in situ metrology, enabled by integrated sensors for real-time feedback during a build
• Identify in-build defects in time to correct and continue the build or scrap before using additional material
Design Allowables—design optimization tools and protocols for complex builds
• Improve “design to manufacture” guidance for designing and printing complex parts, including mesh, lightweight, and sacrificial support structures
• Reduce scrap rates and turnaround times and improve reliability and reproducibility of parts
Modeling and Simulation—high-fidelity process modeling and simulation for different materials and designs
• Improve yields, shorter and fewer R&D cycles • Predict anomalies at various stages of a build • Understand material-specific processes leading to new
applications
Surface Finishing—cost-effective approaches to improve surface finishing of metal AM parts and standards for measuring surface finish and tolerances
• Eliminate or greatly reduce the degree of postprocessing required to make production-quality parts
Testing Procedures—innovative mechanical testing procedures
• Improve efficiency and cost savings from nondestructive and other test methods
• Improve confidence in AM processes and materials to speed up adoption and validation of high-value printed parts in various applications
Figure 4-1. Importance of Technology Needs
0%
10%20%
30%40%
50%60%
70%80%
90%
100%
Standards Metrology DesignAllowables
Modeling &Simulation
SurfaceFinishing
TestingProcedures
Shar
e of
resp
onse
s
3s and below 4s and 5s
4.6
Mean score
3.9 3.8 3.8 3.7 3.8
Section 4 — Quantitative Results and Economic Impact Analysis
4-3
This publication is available free of charge from: http://dx.doi.org/10.6028/N
IST.GC
R.16-006
4.2 IMPACTS OF MEETING INFRASTRUCTURE TECHNOLOGY NEEDS RTI quantified the impacts on the costs and production processes resulting from solving the technology needs in Table 4-1 above. The potential expected cost reduction is $4.1 billion—a 9% reduction as a factor of sales. The total cost of goods sold (COGS) for the AM industry is approximately 51% of sales revenue, or $22.3 billion. Therefore, an 18% reduction in the cost of goods sold is expected. Figure 4-2 presents the range of expected impacts by industry. Table 4-2 breaks out these impacts across capital (K), labor, energy, and materials (KLEM).
Among KLEM cost components, meeting technology infrastructure needs is expected to have the greatest relative impact on labor cost, reducing labor costs by 27% on average. This reflects stakeholders’ view that AM is still a comparatively hands-on process, which some interviewees described as “artisan” rather than highly standardized and routinized. Iterative trial and error to identify the ideal process parameters and postprocessing steps were especially labor intensive.
Enhanced infrastructure is also expected to reduce the cost of raw materials, principally the additive feedstocks, by 20% on average. This impact is expected to be realized mainly by reducing the need for iterative trial and error, increasing the ratio of successful to unsuccessful builds. Especially promising is the prospect of enhanced process monitoring and control that enables defects to be detected and ultimately eliminated in real-time.
Capital cost reductions (anticipated to be 11% on average) and energy cost reductions (anticipated to be 7% on average) were mainly associated with increased throughput—the increase in the number of parts successfully built per unit of operating time for a given AM machine. Respondents were somewhat divided in their opinions on the overall effect on capital cost. Some respondents believed that improvements in throughput would drive down the cost of capital overall. Others believed that the cost of capital would rise (offset by greater reduction in the cost of labor) as enhanced technology infrastructure enabled AM to become more routinized and automated.
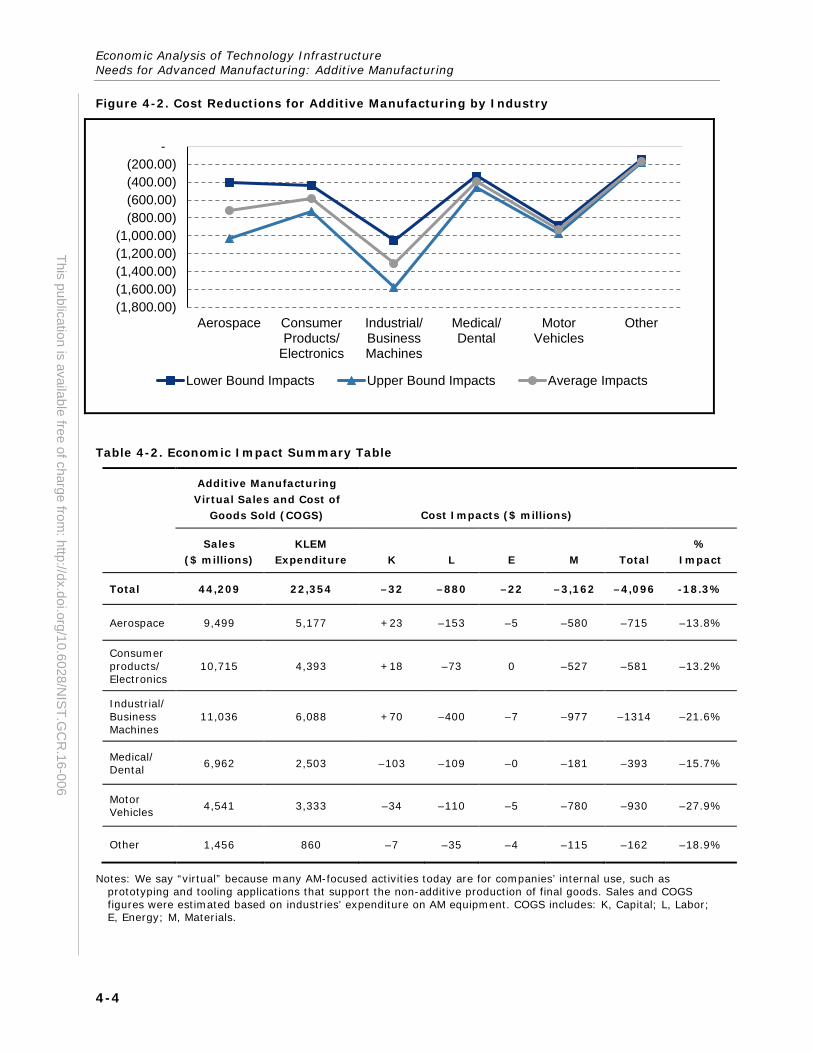
Economic Analysis of Technology Infrastructure Needs for Advanced Manufacturing: Additive Manufacturing
4-4
This publication is available free of charge from: http://dx.doi.org/10.6028/N
IST.GC
R.16-006
Figure 4-2. Cost Reductions for Additive Manufacturing by Industry
Table 4-2. Economic Impact Summary Table
Additive Manufacturing Virtual Sales and Cost of
Goods Sold (COGS) Cost Impacts ($ millions)
Sales ($ millions)
KLEM Expenditure K L E M Total
% Impact
Total 44,209 22,354 –32 –880 –22 –3,162 –4,096 -18.3%
Aerospace 9,499 5,177 +23 –153 –5 –580 –715 –13.8%
Consumer products/ Electronics
10,715 4,393 +18 –73 0 –527 –581 –13.2%
Industrial/ Business Machines
11,036 6,088 +70 –400 –7 –977 –1314 –21.6%
Medical/ Dental 6,962 2,503 –103 –109 –0 –181 –393 –15.7%
Motor Vehicles 4,541 3,333 –34 –110 –5 –780 –930 –27.9%
Other 1,456 860 –7 –35 –4 –115 –162 –18.9%
Notes: We say “virtual” because many AM-focused activities today are for companies’ internal use, such as prototyping and tooling applications that support the non-additive production of final goods. Sales and COGS figures were estimated based on industries’ expenditure on AM equipment. COGS includes: K, Capital; L, Labor; E, Energy; M, Materials.
(1,800.00) (1,600.00) (1,400.00) (1,200.00) (1,000.00)
(800.00) (600.00) (400.00) (200.00)
-
Aerospace ConsumerProducts/
Electronics
Industrial/BusinessMachines
Medical/Dental
MotorVehicles
Other
Lower Bound Impacts Upper Bound Impacts Average Impacts

Section 4 — Quantitative Results and Economic Impact Analysis
4-5
This publication is available free of charge from: http://dx.doi.org/10.6028/N
IST.GC
R.16-006
Underlying these KLEM impacts are impact estimates for the following production variables:
time and cost to test and validate materials,
time and cost to reach first successful build (product development), and
scrap rate (wasted feedstock material and material used in unsuccessful builds).
In some cases, we were able to quantify these impacts, and these results are summarized in Table 4-3. To emphasize, this is a further breakdown of impacts reflected in Table 4-2, not additional impacts.
The impacts on these production processes could result in significant improvements to the current AM environment.
The materials validation component, which encompasses the time and cost to test and validate materials, is expected to drop by 44% on average. There is a wide range in this impact, however, as respondents in the aerospace industry suggest that it would only drop by approximately 10%, whereas a national laboratory (labeled as “government/military” in Table 4-3) suggested a 75% improvement. One respondent in the aerospace industry believes that materials validation would go up by as much as 50% in the short term as these new methods are integrated into current processes, which often requires a learning curve and transition period. Excluding this respondent’s input, the average cost reduction for materials validation is reduced further to −19%.
Table 4-3. Process Improvements
Industry Materials Validation
Product Development Scrap Rate
Aerospace −10% −34% −18%
Consumer products/electronics −25% −15% −25%
Government/military −75% −50% 0%
Industrial/business machines −50% −18% −13%
Medical −34% −67% −10%
Motor vehicles −58% −64% −50%
Other −55% −43% −43%
Total −44% −41% −23%

Economic Analysis of Technology Infrastructure Needs for Advanced Manufacturing: Additive Manufacturing
4-6
This publication is available free of charge from: http://dx.doi.org/10.6028/N
IST.GC
R.16-006
Product development, the time and cost required for a product to reach its first successful build as intended, is also expected to drop significantly. Similarly to the materials validation component, there is a wide range in responses, yet all respondents believed this value would be reduced.
All respondents but one indicated that the scrap rate, the rate at which defects are present during or after a part is printed, is expected to decrease. The average reduction was 23% assuming access to and availability of new technology tools and information.
4.3 IMPACTS APPORTIONED OVER TECHNOLOGY NEEDS Figure 4-3 shows the distribution of total KLEM impacts apportioned across the six technology needs. The distribution of impacts reflects the importance scores provided by end users (shown in Figure 4-1). Enhanced standards, best practices, and reference data are associated with annual cost reductions of nearly $800 million. The cost impacts of meeting each of the other five industry needs is between $600 and $700 million.
A caveat to these results is that there are often strong complementarities or “interaction effects” among technology infrastructure elements that we were not able to quantify. For instance, high-fidelity predictive models would be a valuable tool for optimizing designs for 3D-printed parts and for qualifying parts for demanding applications with less need for destructive testing; building useful models requires large, high-quality scientific and engineering databases linking materials, processes, process conditions, and surface finish with the performance characteristics of the finished part.
With strong complementarities among technology infrastructure elements that meet these needs, the cost of underproviding the elements most directly related to one need is not limited to the amount apportioned to that need in Figure 4-3 but spills over into other needs. For example, investing heavily in high-fidelity predictive models without adequate parallel investment in high-quality data with which to calibrate those models would not realize the $661.5 million benefit and forego the $797.6 million benefit; rather, this unbalanced investment would likely fail to fully realize either potential impact.

Section 4 — Quantitative Results and Economic Impact Analysis
4-7
This publication is available free of charge from: http://dx.doi.org/10.6028/N
IST.GC
R.16-006
Figure 4-3. Total Annual Impact, Apportioned by Technology Need (Millions of 2013 US$)
797.6
680.4 667.8 661.5 635.0 657.7
0
100
200
300
400
500
600
700
800
900
Standards Metrology DesignAllowables
Modeling &Simulation
Surfacefinishing
Testingprocedures

5-1
This publication is available free of charge from: http://dx.doi.org/10.6028/N
IST.GC
R.16-006
5 Qualitative Results: Stakeholder Views
This section summarizes insights into the identified infrastructure needs and qualitatively describes the potential impacts of meeting these needs.
5.1 MATERIALS STANDARDS, PROCESS STANDARDS AND REFERENCE DATABASES Our interview sample was unanimous in their assessment that the most important infratechnology needs at this time are materials standards, process standards, and reference databases. Standards serve the industry by ensuring quality and consistency for the input materials, during a build, and following any postbuild processing.
One aspect of postbuild processing for which standards are important is treatment (for example, by heating or shot peening) to remove stresses and improve mechanical properties. Ideally, standards for these processes could be developed in concert with standards for characterizing properties so that resources are not wasted characterizing properties of additively built parts that are limited by suboptimal postbuild processing.
Some respondents expressed impatience over extant standards for AM falling short of meeting their needs. One end user expressed the opinion that the standards are often vague and thus tend to leave AM systems manufacturers with de facto decision-making authority over best practices.
To some extent, frustration on the part of some stakeholders that standards do not yet meet their specific needs is to be expected of early efforts, because the first standards are necessarily high-level documents.
Economic Analysis of Technology Infrastructure Needs for Advanced Manufacturing: Additive Manufacturing
5-2
This publication is available free of charge from: http://dx.doi.org/10.6028/N
IST.GC
R.16-006
The standards are developed by industry consensus and endeavor to balance the interests of all stakeholders fairly, and ideally all participants have equal opportunity to drive the standards to meet their needs. The perception of some end users that certain gaps in standards may tend to favor the interests of systems manufacturers is worth noting, whether or not it is an issue that can be addressed in the short run as standards continue to take shape.
As the standards become more mature, more detailed specifications can be created for specific niche applications. AM technology is changing very quickly, so it is difficult to standardize the specifics of something until there is industry confidence, hence the current emphasis on higher-level standards.
A lack of fully mature standards forces firms to not only create their own standards, but also to expend additional resources to prove the quality and consistency of the products they build. Although this is less of a problem for large, multibillion dollar companies, small- to medium-sized firms may struggle to invest in this emerging technology. Additionally, the lack of standards has resulted in companies creating their own standards for a number of reasons:
1) to protect the intellectual property of their product, process, material, or other component;
2) to maintain a competitive advantage over other firms in the industry; and
3) industry consortia and collaborative research efforts can be unreliable and expensive.
Not only are materials standards needed for inputs (feedstock materials), but so are reference data for materials properties processed in different batches, under different conditions, and using different methods. Perhaps more important for AM metals are the postbuild heat treatments that are invariably used to remove the residual stresses created by the build process and those used to return the microstructure to one similar to those found for the same alloy in wrought or cast form. Process standards are also very valuable to understanding the best practices for producing parts. Materials and process standards are needed for all material classes, across product categories and AM manufacturing methods.

Section 5 — Qualitative Results: Stakeholder Views
5-3
This publication is available free of charge from: http://dx.doi.org/10.6028/N
IST.GC
R.16-006
A respondent from a large, multinational company with a well-known aerospace division noted that the company has spent ”multiple millions of dollars” (the respondent declined to be more specific) on developing their own central library of materials property data.
A key inhibitor to AM is convincing customers and certifying bodies that an additively produced part has the necessary quality to meet the application. One large manufacturing company shared that it spends $500,000 over a 6-month time frame to obtain mechanical properties just for a single part, made from a single material, using a specific additive manufacturing process with specific parameters. Over the long term, ensuring quality will require having access to an extensive, statistically significant database of materials of interest that one can build parts from and consistently build them using standard processes reliably at high quality. For any given firm, a reference database could accelerate development time by months, eliminating perhaps 20 to 30% of development time. It could also reduce the cost of development by enabling more reliable builds and thus reducing scrap rates.
Material-to-material and part-to-part reliability and reproducibility can depend on, for metal powders, for example, the powder properties and the process parameters in fabricating the powder. Variations exist among materials vendors, including differences in size, shape, and purity of a powder alloy. Powder vendors exhibit significant inconsistencies and single producers report even batch-to-batch variability. Users and vendors alike need standard reference materials and a defined set of specifications to be provided. One interviewee would like to push standardization down to the powder suppliers to reduce the qualification costs they face. A small manufacturer said they were forced to use a more expensive branded powder because the supplier qualifies and publishes its data.
Each of the standard AM process categories has many process parameters; when combined with materials differences, the magnitude of variables has undoubtedly a significant effect on the outcome—the chemical, mechanical, and physical properties of the final part. In one specific example, consider a metal melting process. The metal purity, grain size, and the rate of melting and cooling of the material all play a role in

Economic Analysis of Technology Infrastructure Needs for Advanced Manufacturing: Additive Manufacturing
5-4
This publication is available free of charge from: http://dx.doi.org/10.6028/N
IST.GC
R.16-006
determining the part performance, such as the thermomechanical properties.
Thermal and mechanical properties are particularly critical for the transportation industry, and depending on processes, statistically significant data need to be available at a deep level of detail. One aerospace manufacturer invested more than $1.5 million to study properties for one single part produced using only one powder and one process method. Small manufacturers have noted that they do not have the adequate resources to exhaustively test and validate part properties after fabrication and, thus, are prohibited from entering the transportation markets. Similarly, a second small supplier reported that the development cycle for new materials is too long. They have made new materials that have not been adopted because of the long qualification time and have resisted trying anything new to avoid wasting time and resources. A large engine manufacturer is targeting 2020 for a product launch because of the qualification challenges.
Property data for a set of common process–material pairs could accelerate the introduction of additively built parts into service in existing industries, as well as new industries, and open up additional opportunities for small suppliers and manufacturers. But because of the process-material connection, and the many different process-material pairs relevant across applications (the lack of a single or even a few process-material pairs relevant to wide cross sections of industry), this task is probably beyond the resources, at least for the time being, even of national laboratories. What would be practical, and very useful, would be to standardize the testing protocols, standardize the database schema for what data to collect, make a database available to the public, and allow others to upload property data (obtained using standard procedures) to the database.
Further challenges exist with manufacturing efficiencies. One large manufacturer reported that 30 pounds of powder were needed to produce a 10-pound part, and reuse of powder was not an option for their application. Their primary target for reducing the overall metal AM manufacturing cost is improving powder efficiency. Some suppliers are beginning to perform recertification of powder for re-use, but the practice is not yet standardized.
Section 5 — Qualitative Results: Stakeholder Views
5-5
This publication is available free of charge from: http://dx.doi.org/10.6028/N
IST.GC
R.16-006
Lastly, hybrid processes are beginning to emerge to tackle parts with increased complexity or tighter tolerances; the forerunner is additive-subtractive manufacturing hybrids to address challenges associated with surface finishing following AM (reviewed further below). One interviewee specifically provides machine protocols in terms of defining hierarchies of operations. Establishing a classification system for hybrid processes would be particularly helpful to guide designers and operators in a common language.
5.2 DESIGN OPTIMIZATION FOR AM Accelerating AM will require approaches for optimizing designs. One of the most significant benefits of AM is the ability to create 3D, complex, interlocking pieces in one process. In this manner, additively produced parts may have advantages in both economics and performance over their subtractively built counterparts, but guidance and data to support these novel designs (e.g., angles, sacrificial structures, meshes) are needed.
The challenge lies primarily in the design. With conventional manufacturing (such as castings or injection molded parts), the designer is forced to configure design rules for draft angles. Although design rules have been established for some manufacturing processes, there is no systematic listing of design rules for AM. An agreed-upon set of design rules must be established and communicated to the design community to ensure efficient design of parts for AM. AM design rule standards are now in development in ASTM F42/ISO TC261.
For many processes in AM, it is necessary to build support structures that are temporary parts of a build, subsequently removed and disposed of. More effort needs to be placed on establishing the minimum support structures as a function of process, material, and design. Interviewees suggested that a gap exists in materials development specifically for support structures, such that they could be made dissolvable (for polymer support structures) or easier to remove. Alternatively, are there alterations to design rules that enable manufacturers to avoid support structures altogether? The current function of these structures is to hold horizontal components in place during the build, but their presence is inherently restrictive of geometry and detrimental to the surface finish.

Economic Analysis of Technology Infrastructure Needs for Advanced Manufacturing: Additive Manufacturing
5-6
This publication is available free of charge from: http://dx.doi.org/10.6028/N
IST.GC
R.16-006
One firm noted that when building an AM part for the first time from a CAD file, they are able to do it correctly only two out of three times. On the second attempt, there is a 90% success rate. This comment suggests that improvements to AM design rules could reduce scrap rates and result in more productive machine time.
5.3 MODELING AND SIMULATION Respondents identified a wide range of opportunities for improving the modeling and simulating of AM parts, but there is particularly a need for life-cycle assessment studies. Tools are needed to model and simulate materials properties and establish robust process-structure-property relationships. Most AM modeling efforts are focused on creating predictive capabilities to understand resulting part properties, given material and process inputs. Time-temperature history determines material microstructure, which determines mechanical properties. Measurement and control of that time-temperature history is therefore important. For aerospace and energy applications, in particular, modeling and simulation tools are critical. To date, this field has been held back by the lack of quality inputs. The variability in raw materials and processes, the lack of consistent metrology data, and simply the low number of similar parts produced by AM all contribute to the gap. LLNL has developed 3D models for powder bed fusion AM processes. Because of the physical changes that occur when the powder is melted, sensitive areas of a part such as at overhangs and edges may be distorted. Models can therefore be used to determine the successful means of building a given part (e.g., temperature, materials, and part design) in advance of the actual build.
As in most emerging processes, history and time in use are lacking. The development of accelerated test methods and associated modeling tools could establish the baselines that already exist for mature technologies. The value in AM is the ability to make small volumes of specialized parts—a significant effort making large volumes of relatively simple parts is needed to develop the modeling and simulation tools for the future.
Section 5 — Qualitative Results: Stakeholder Views
5-7
This publication is available free of charge from: http://dx.doi.org/10.6028/N
IST.GC
R.16-006
5.4 REAL-TIME METROLOGY Additively manufactured parts have an advantage in that the inherent layer-by-layer production provides an opportunity to take a snapshot at each fractional stage of a product build. However, the metrology tools and associated real-time feedback processes remain in infancy. Most interviewees saw a need and value for real-time metrology, but few offered solutions or even topics for further research. Academic, government, and consortia groups are heavily pursuing this field, investigating optical (geometric), infrared, and thermal methods.
As reported by the companies surveyed, qualification is primarily done postproduction, with process and materials alterations done primarily by a trial-and-error method. The implementation of real-time metrology has clear benefits in efficiency, throughput, and related cost, replacing subjective reasoning with quantitative decision making. Given the variability in materials and processes as described above, real-time metrology and feedback loops offer a means of control that could compensate for the inputs.
Much like metrology desires in other manufacturing processes, manufacturers seek metrology solutions that are rapid, quantitative, nondestructive, inexpensive, and high resolution and that have wide dynamic range. The range of features that interviewees could monitor varies from geometric distortion to porosity to mechanical and thermal stress.
Interviewees report that standards for metrology are slowly being defined by groups including ASTM, ISO, ASME, SAE, AWS, and others. Consortium and other networks are conducting round robins of metrology and property testing for AM and will publicize the results. However, companies remain skeptical of the reliability and consistency of the aggregate data without standardized methods for testing and data collection.
5.5 SURFACE FINISHING OF METAL ADDITIVE PARTS AND RELATED TESTING Surface finishing is an ongoing issue for prototype and service parts where improved capabilities are needed. Additively built parts naturally have a rougher finish, similar to cast surfaces, requiring some postbuild machining. This surface roughness is

Economic Analysis of Technology Infrastructure Needs for Advanced Manufacturing: Additive Manufacturing
5-8
This publication is available free of charge from: http://dx.doi.org/10.6028/N
IST.GC
R.16-006
a function of both input materials (e.g., metal powder size distribution) and process parameters (beam width, beam power, layer thickness) and is often correlated with the fabrication time.
Industry would like to see a more cost-effective approach to improving surface finishing developed. AM technology has matured and the current technology is being used more effectively than ever before. Innovations continue and performance continues to improve through increased understanding and better measurement methods. The combination of additive and subtractive processes, also known as “hybrid” manufacturing, is the focus of an AMTech-sponsored industry consortium and is one of many AM-related technologies being advanced by America Makes. This process works by overbuilding a part additively and using subtractive manufacturing processes to 1) reduce its size to the desired specifications and 2) eliminate surface roughness. If finishing was automated or processed through hybrid manufacturing techniques, it would reduce labor time.
5.6 MECHANICAL TESTING PROCEDURES Innovative mechanical testing procedures are needed, especially to enable nondestructive testing. Closely linked with the needs for high-quality scientific and engineering data and high-fidelity modeling and simulation based on established process-structure-property relationships, novel mechanical testing procedures are needed to qualify 3D-printed parts for critical applications in aerospace and medicine.
As reported by an interviewee, one challenge with AM technology relates to “objective evidence of compliance to design intent.” When a part is extracted from a machine, it needs to be evaluated to determine whether it meets the design intent. The surface geometry can be analyzed, but there is no nondestructive methodology for determining whether the metal chemistry meets design specifications. A firm can produce a part, but how does one inspect and validate it? There needs to be a methodology to tell an operator that part A matches the history of yield specimens. Presently, firms are using ultrasound, X-ray, and computerized tomography scans to determine some qualities of the final part, but more cost-effective approaches are needed.

6-1
This publication is available free of charge from: http://dx.doi.org/10.6028/N
IST.GC
R.16-006
6 Conclusion
Through in-depth interviews with industry stakeholders, this study identified pressing needs for AM technology infrastructure—the currently unmet needs for measurement science, metrology and test methods, traceable reference data, and other formal knowledge—most closely aligned with NIST’s unique mission and capabilities.
The potential economic impact of meeting these needs is estimated to be $4.1 billion per year. This impact reflects the costs that U.S. manufacturers could avoid if these needs were met. In practice, lowering AM-application-specific costs of capital, labor, energy, and materials for U.S. manufacturers would lead to lower prices for consumers of 3D-printed goods, which in turn would lead to the expansion of these market segments. Of even greater importance, albeit more difficult to quantify, meeting these needs would lead to improvements in the performance characteristics of AM parts, which would increase demand for AM parts and expand these market segments. The emergence of altogether new products and markets would almost certainly also be accelerated.
$4.1 billion is 18% of the annual $22.3 billion cost of goods sold for AM-focused manufacturing activities. We estimate that the (virtual) sales revenue of AM to be $44 billion. We say virtual because many AM-focused activities today are for companies’ internal use—prototyping and tooling applications that support the non-additive production of final goods. The $4.1 billion impact is likely a conservative estimate, because it does not take into account the second-order effect of the growth AM would experience as a direct result of cost reductions being shared with consumers in the form of lower prices, moving AM outward along its demand curve. Our quantitative impact estimate also does not take into account that the demand for AM parts will increase as a direct result of

Economic Analysis of Technology Infrastructure Needs for Advanced Manufacturing: Additive Manufacturing
6-2
This publication is available free of charge from: http://dx.doi.org/10.6028/N
IST.GC
R.16-006
improvements in the performance characteristics of 3D-printed parts and end users enhanced ability to verify and certify those performance characteristics.

R-1
This publication is available free of charge from: http://dx.doi.org/10.6028/N
IST.GC
R.16-006
References
Antonelli, C., and A. N. Link. 2014. Routledge Handbook of the Economics of Knowledge. New York, NY: Routledge.
Bourell, D., M. Leu, and D. Rosen. 2009. Roadmap for Additive Manufacturing—Identifying the Future of Freeform Processing. Austin, TX: The University of Texas.
Caffrey, T., and T. Wohlers. 2015. Wohlers Report 2015: 3D Printing and Additive Manufacturing State of the Industry Annual Worldwide Progress Report. Fort Collins: Wohlers Associates, Inc.
CAMM. 2015, December. Strategic Roadmap for the Next Generation of Additive Manufacturing Materials.
Frazier, W. E. 2014. “Metal Additive Manufacturing: A Review.” Journal of Materials Engineering and Performance 23(6):1917-1928.
Frost & Sullivan. 2007. World Rapid Prototyping Equipment Markets. Frost & Sullivan: San Antonio, TX.
Gausemeier, J., N. Echterhoff, M. Kokoschka, and M. Wall. 2011. Thinking Ahead the Future of Additive Manufacturing—Analysis of Promising Industries. Paderborn, Germany: Heinz Nixdorf Institute, University of Paderborn.
GE Aviation. October 27, 2015. GE Aviation to build unique materials factories. [Press release]. http://www.geaviation.com/press/other/other_20151027.html
Harrysson, O. L., O. Cansizoglu, D. J. Marcellin-Little, D. R. Cormier, and H. A. West II. 2008. “Direct Metal Fabrication of Titanium Implants with Tailored Materials and Mechanical Properties using Electron Beam Melting Technology.” Materials Science & Engineering C 28(3):366-373.

Economic Analysis of Technology Infrastructure Needs for Advanced Manufacturing: Additive Manufacturing
R-2
This publication is available free of charge from: http://dx.doi.org/10.6028/N
IST.GC
R.16-006
Heavy Metal. May 3, 2014. The Economist (Berlin). http://www.economist.com/node/21601528/print.
Hiemenz, J. 2013. Additive Manufacturing Trends in Aerospace: Leading the Way. Eden Prairie, MN: Stratasys. http://web.stratasys.com/rs/objet/images/SSYS-WP-AeroTrends-03-13-FINAL.pdf.
Jaffe, A. B., R. G. Newell, and R. N. Stavins. 2005. “A Tale of Two Market Failures: Technology and Environmental Policy.” Ecological Economics 54(2):164-174.
Kennedy, P. 2013, Nov 22. “Who Made That 3-D Printer?” The New York Times. Permalink: http://nyti.ms/1C188US.
Link, A. N., and J. T. Scott. 2010. Public Goods, Public Gains: Calculating the Social Benefits of Public R&D. New York, NY: Oxford University Press.
Manning, L. May 3, 2013. Dental Restoration Reaping Benefits of Additive Manufacturing. http://medicaldesign.com/design-engineering/dental-restoration-reaping-benefits-additive-manufacturing.
Melchels, F.P., M.A. Domingos, T.J. Klein, J. Malda, P.J. Bartolo, and D.W. Hutmacher. 2012. “Additive Manufacturing of Tissues and Organs.” Progress in Polymer Science 37(8):1079–1104.
National Institute of Standards and Technology. May 2013. Measurement Science Roadmap for Metal-Based Additive Manufacturing. http://www.nist.gov/el/isd/upload/ NISTAdd_Mfg_Report_FINAL-2.pdf.
Perlo-Freeman, S., and P. Wezeman. 2014. The SIPRI Top 100 Arms-Producing and Military Services Companies, 2012. Retrieved from http://www.sipri.org/research/armaments/production/recent-trends-in-arms-industry.
Petrovic, V., J. Vicente Haro Gonzalez, O. Jorda Ferrando, J. Delgado Gordillo, J. Ramon Blasco Puchades, and L. Portoles Grinan. 2011. “Additive Layered Manufacturing: Sectors of Industrial Application Shown through Case Studies.” International Journal of Production Research 49(4):1061-1079.
Roland Berger Strategy Consultants. 2013. Additive Manufacturing: A Game Changer for the Manufacturing Industry? Munich: Roland Berger Strategy Consultants.

References
R-3
This publication is available free of charge from: http://dx.doi.org/10.6028/N
IST.GC
R.16-006
Royal Academy of Engineers (RAE). May 23, 2013. Additive Manufacturing: Opportunities and Constraints. London: Royal Academy of Engineers. https://www.raeng.org.uk/news/publications/list/ reports/Additive_Manufacturing.pdf.
Shipp, S., N. Gupta, B. Lal, and J. Scott. 2012. Emerging Global Trends in Advanced Manufacturing. Alexandria, VA: Institute for Defense Analyses.
Tassey, G. 2008. “Modeling and Measuring the Economic Roles of Technology Infrastructure.” Economics of Innovation and New Technology 17(7-8):615-629.
Thomas, D.S. 2013. Economics of the U.S. Additive Manufacturing Industry. National Institute of Standards and Technology Special Publication 1163. http://dx.doi.org/10.6028/NIST.SP.1163.
Thomas, D.S., and S.W. Gilbert. 2014. Costs and Cost Effectiveness of Additive Manufacturing. National Institute of Standards and Technology Special Publication 1176. http://dx.doi.org/10.6028/NIST.SP.1176.
West, K. February 13, 2011. “Melted Metal Cuts Plane’s Fuel Bill.” The Sunday Times. www.thesundaytimes.co.uk /sto/business/energy_and_environment/article547163.ece.
Wysk, R. April 18, 2014. North Carolina State University. Internal meeting.

This publication is available free of charge from: http://dx.doi.org/10.6028/N
IST.GC
R.16-006
Appendix A: Interview Guide for Additive Systems Developers

A-1
This publication is available free of charge from: http://dx.doi.org/10.6028/N
IST.GC
R.16-006
The National Institute of Standards and Technology (NIST) in the U.S. Department of Commerce has contracted with RTI International to conduct an economic analysis of standards, measurement, and general purpose technology needs that inhibit efficient development and adoption of advanced manufacturing in the United States.
The objectives of this critical strategic planning study are to
identify current and emerging needs related to standards and measurement,
estimate the economic impact of meeting these needs, and
review public policy and investment options.
The study has a particular focus on 4 aspects of advanced manufacturing: (1) robotics and automation, (2) smart manufacturing processes, (3) 3D printing (additive manufacturing), and (4) roll-to-roll manufacturing. The focus of our conversation is additive manufacturing technology.
Your perspective will help guide NIST’s planning and investment process. Participation in this analysis is confidential; only aggregated information will be included in any deliverables or communications. Your name and your company’s name will not be disclosed. We do not wish to discuss specific products, strategies, or technologies; but rather your thoughts about how investments in standards and measurement technologies would affect your company and companies like yours.
Our research products will be an economic analysis, final report, and presentation materials. All deliverables will be publicly available in late 2015 and these will be shared with you as soon as they are released.
If you have questions, please contact:
Troy Scott, Case Study Lead, RTI, 503-428-5680, [email protected]
Alan O’Connor, Principal Investigator, RTI, 919-541-8841 or [email protected]
Gary Anderson, NIST Project Officer, NIST, 301-975-5238 or [email protected]
This collection of information contains Paperwork Reduction Act (PRA) requirements approved by the Office of Management and Budget (OMB). Notwithstanding any other provisions of the law,

Economic Analysis of Technology Infrastructure Needs for Advanced Manufacturing: Additive Manufacturing
A-2
This publication is available free of charge from: http://dx.doi.org/10.6028/N
IST.GC
R.16-006
no person is required to respond to, nor shall any person be subject to a penalty for failure to comply with, a collection of information subject to the requirements of the PRA unless that collection of information displays a currently valid OMB control number. Public reporting burden for this collection is estimated to be 35 minutes per response, including the time for reviewing instructions, searching existing data sources, gathering and maintaining the data needed and completing and reviewing the collection of information. Send comments regarding this burden estimate or any aspect of this collection of information, including suggestions for reducing this burden, to the National Institute of Standards and Technology, Attn., Gary Anderson, [email protected], (301) 975-5238. The OMB Control Number is 0693-0033, with an expiration date of 03/31/2016.
Respondent Background and Information
1. Please give a brief description of your experience with additive manufacturing. How did you come to be in your current position?
About Your Company
2. What types of additive manufacturing systems does your company develop? For which materials, methods?
3. Can you please describe your company’s supply chain for feedstock materials?
4. Approximately what percentage of your company’s sales revenue is associated with customers using additive manufacturing for the purposes of…
Application of AM Technology Customer Share
a Final goods and parts printing %
b Prototyping or design %
c Tooling %
d Repair %
e Research and Development and repair %
Industry Needs
Several industry-level needs have been identified, and discussions with experts have suggested measurement and test methods, material and process standards, reference databases, and general purpose technologies that could meet these needs.

Appendix A — Interview Guide for Additive Systems Developers
A-3
This publication is available free of charge from: http://dx.doi.org/10.6028/N
IST.GC
R.16-006
Table A-1 below provides a list of these needs and examples of the solutions to them. There are also two additional columns, and we ask that you please consider them from the perspective of your company’s products and business opportunities.
Table A-1. General Industry-Level Needs for Additive Manufacturing
Industry Needs Potential Impacts (examples)
Rating of Importance
(1 to 5) 5=Most 1=Least
1. Standards, best practices, and reference data for materials and AM processes
• Improve confidence via reproducibility across manufacturing methods
• Greater assurance in raw materials
2. Real-time metrology—integrated sensors for real-time feedback during a build
• Identify in-build defects in time to correct and continue the build or scrap before using additional material
3. Design optimization tools and protocols for complex builds
• “Design to manufacture” guidance for designing and printing complex parts, including mesh, lightweight, and sacrificial support structures
• Reduce scrap rates and turnaround times, and improve reliability and reproducibility of parts
4. Process modeling and simulation for different materials and designs.
• Improve yields, shorter and fewer R&D cycles
• Predict anomalies at various stages of a build
• Understand material-specific processes leading to new applications
5. Cost-effective approaches to improve surface finishing of metal AM parts, and standards for measuring surface finish and tolerances
• Eliminate or greatly reduce the degree of postprocessing required to make production-quality parts
6. Innovative mechanical testing procedures
• Improve efficiency and cost savings from nondestructive and other test methods
• Confidence in AM processes and materials to speed up adoption and validation of high-value printed parts in various applications
5. Are there items not included in the table that you would include? If so, what are they?
6. Is your company currently investing in R&D towards any of the needs in Table 2, or any others that you have mentioned?
Economic Analysis of Technology Infrastructure Needs for Advanced Manufacturing: Additive Manufacturing
A-4
This publication is available free of charge from: http://dx.doi.org/10.6028/N
IST.GC
R.16-006
For questions 7–10, let’s assume NIST were to solve the relevant needs in Table A-1.
7. Can you describe any impacts on your company’s development and commercialization of additive manufacturing systems that you would expect to observe? Please consider:
a) R&D opportunities (i.e., niche areas)
b) Marketing opportunities (new markets, greater demand, etc.)
c) Improved performance and/or capabilities of your current AM machine models
d) Development of new AM machines with novel capabilities
e) Others
8. Could you describe any outcomes to the AM industry (or your customers, more specifically) that you would expect to observe? Please consider the following:
a) Market share of AM
b) Market penetration of AM
c) Lead times
d) Production costs (materials, energy, labor, capital)
e) Quality or performance of existing product lines
f) New product lines and/or applications
9. Can you describe changes to your company’s sales revenue or growth that you would expect to observe? By what percentage would your sales revenue change? A range is fine.
10. Would you expect any changes in your company’s investment patterns or risk tolerance? If so, what types of changes?
11. Would you say that your answers are representative of your industry (of companies developing/commercializing additive manufacturing technology), or of only a subset? Please explain briefly how, if at all, the anticipated impacts for your company may be different from the industry as a whole, or how different industry segments may be differently impacted.
12. Are there any additional comments you would like to share?

This publication is available free of charge from: http://dx.doi.org/10.6028/N
IST.GC
R.16-006
Appendix B: Interview Guide for Additive End Users

B-1
This publication is available free of charge from: http://dx.doi.org/10.6028/N
IST.GC
R.16-006
The National Institute of Standards and Technology (NIST) in the U.S. Department of Commerce has contracted with RTI International to conduct an economic analysis of standards, measurement, and general purpose technology needs that inhibit efficient development and adoption of advanced manufacturing in the United States.
The objectives of this critical strategic planning study are to
identify current and emerging needs related to standards and measurement,
estimate the economic impact of meeting these needs, and
review public policy and investment options.
The study has a particular focus on 4 aspects of advanced manufacturing: (1) robotics and automation, (2) smart manufacturing processes, (3) 3D Printing (additive manufacturing), and (4) roll-to-roll manufacturing. The focus of our conversation is additive manufacturing technology.
Your perspective will help guide NIST’s planning and investment process. Participation in this analysis is confidential; only aggregated information will be included in any deliverables or communications. Your name and your company’s name will not be disclosed. We do not wish to discuss specific products, strategies, or technologies; but rather your thoughts about how investments in standards and measurement technologies would affect your company and companies like yours.
Our research products will be an economic analysis, final report, and presentation materials. All deliverables will be publicly available in late 2015 and these will be shared with you as soon as they are released.
If you have questions, please contact:
Travis Beaulieu, Case Study Lead, 919-541-5820, [email protected]
Alan O’Connor, Principal Investigator, RTI, 919-541-8841 or [email protected]
Gary Anderson, NIST Project Officer, NIST, 301-975-5238 or [email protected]
This collection of information contains Paperwork Reduction Act (PRA) requirements approved by the Office of Management and Budget (OMB). Notwithstanding any other provisions of the law,

Economic Analysis of Technology Infrastructure Needs for Advanced Manufacturing: Additive Manufacturing
B-2
This publication is available free of charge from: http://dx.doi.org/10.6028/N
IST.GC
R.16-006
no person is required to respond to, nor shall any person be subject to a penalty for failure to comply with, a collection of information subject to the requirements of the PRA unless that collection of information displays a currently valid OMB control number. Public reporting burden for this collection is estimated to be 35 minutes per response, including the time for reviewing instructions, searching existing data sources, gathering and maintaining the data needed and completing and reviewing the collection of information. Send comments regarding this burden estimate or any aspect of this collection of information, including suggestions for reducing this burden, to the National Institute of Standards and Technology, Attn., Gary Anderson, [email protected], (301) 975-5238. The OMB Control Number is 0693-0033, with an expiration date of 03/31/2016.
Respondent Background and Information
1. Please give a brief description of your experience with additive manufacturing technology. How did you come to be in your current position?
About Your Company
2. How does your company use additive manufacturing technology?
a. For what applications (e.g., for prototypes, tooling, or final products)? What factors make additive attractive for those applications? What factors limit additive to only those applications?
b. What types of additive manufacturing technology do you use? In terms of materials, methods?
3. Approximately what percentage of your company’s sales revenue is currently associated with AM manufacturing? A range is fine.
4. As far as you are aware, is your division or company engaged with any industry consortia, standards organizations, or governing bodies specifically for additive manufacturing? If so, in which bodies do you participate and what are the underlying drivers for participation?
Industry Needs
Several industry-level needs have been identified, and discussions with experts have suggested measurement and test methods, material and process standards, reference databases, and general purpose technologies that could meet these needs.
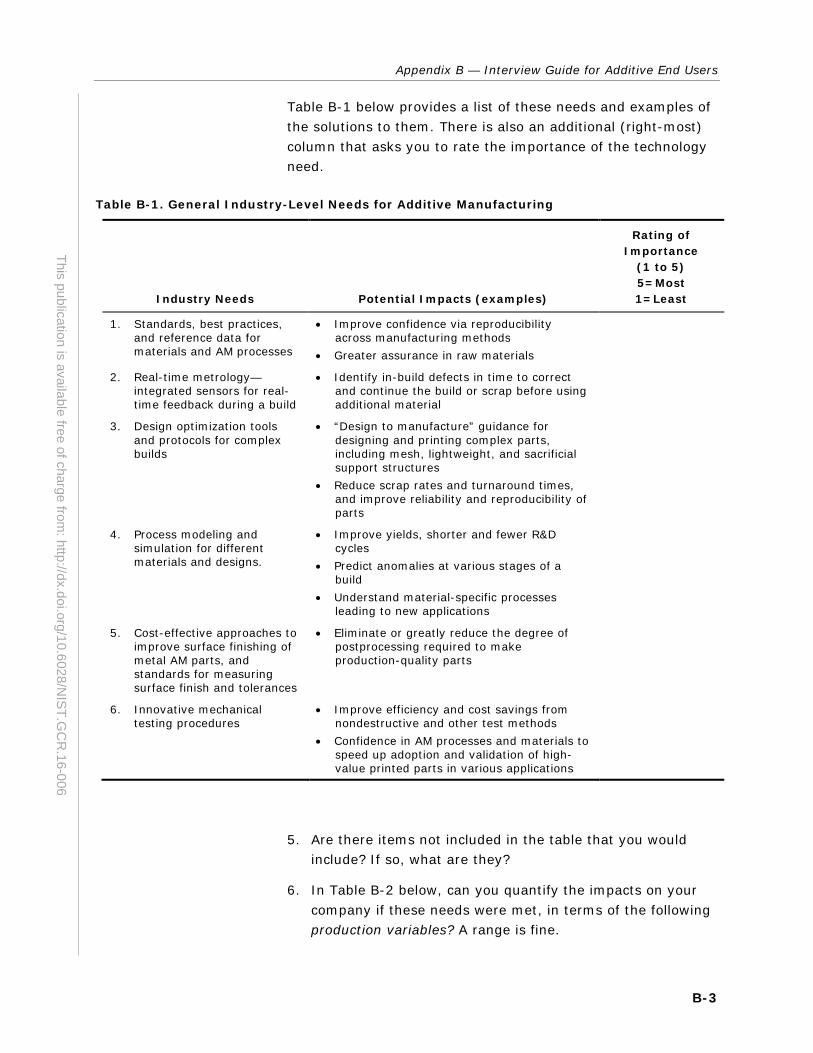
Appendix B — Interview Guide for Additive End Users
B-3
This publication is available free of charge from: http://dx.doi.org/10.6028/N
IST.GC
R.16-006
Table B-1 below provides a list of these needs and examples of the solutions to them. There is also an additional (right-most) column that asks you to rate the importance of the technology need.
Table B-1. General Industry-Level Needs for Additive Manufacturing
Industry Needs Potential Impacts (examples)
Rating of Importance
(1 to 5) 5=Most 1=Least
1. Standards, best practices, and reference data for materials and AM processes
• Improve confidence via reproducibility across manufacturing methods
• Greater assurance in raw materials
2. Real-time metrology—integrated sensors for real-time feedback during a build
• Identify in-build defects in time to correct and continue the build or scrap before using additional material
3. Design optimization tools and protocols for complex builds
• “Design to manufacture” guidance for designing and printing complex parts, including mesh, lightweight, and sacrificial support structures
• Reduce scrap rates and turnaround times, and improve reliability and reproducibility of parts
4. Process modeling and simulation for different materials and designs.
• Improve yields, shorter and fewer R&D cycles
• Predict anomalies at various stages of a build
• Understand material-specific processes leading to new applications
5. Cost-effective approaches to improve surface finishing of metal AM parts, and standards for measuring surface finish and tolerances
• Eliminate or greatly reduce the degree of postprocessing required to make production-quality parts
6. Innovative mechanical testing procedures
• Improve efficiency and cost savings from nondestructive and other test methods
• Confidence in AM processes and materials to speed up adoption and validation of high-value printed parts in various applications
5. Are there items not included in the table that you would include? If so, what are they?
6. In Table B-2 below, can you quantify the impacts on your company if these needs were met, in terms of the following production variables? A range is fine.

Economic Analysis of Technology Infrastructure Needs for Advanced Manufacturing: Additive Manufacturing
B-4
This publication is available free of charge from: http://dx.doi.org/10.6028/N
IST.GC
R.16-006
Table B-2. Impacts on Production Variables
Production Variables +/- % Change
a Time required to test/validate materials %
b Cost to test/validate materials %
c Lead times, or time required to reach first successful (production quality) build
%
d Cost required to reach first successful (production quality) build %
e Scrap rate and number of defects %
f Others
7. In Table B-3 below, could you quantify the impacts on your company if these needs were met in terms of the following production costs? A range is fine.
Table B-3. Impacts on Production Costs
Production Costs +/- % Change
a Cost of materials %
b Cost of energy/electricity %
c Cost of labor %
d Cost of capital equipment %
e Overall cost of production %
8. Switching from thinking about costs to thinking about your company’s product offering, could you briefly describe what changes could be expected if these needs were all met today?
a. Quality of existing products? (e.g., lightweighting, tensile strength, durability)
b. Amount of customization within existing product lines?
c. Introduction of new products or product lines?
9. Could you quantify these impacts in terms of a relative change in your company’s sales? A range is fine.
10. From where do you expect these sources of sales revenue? Please see Table B-4.

Appendix B — Interview Guide for Additive End Users
B-5
This publication is available free of charge from: http://dx.doi.org/10.6028/N
IST.GC
R.16-006
Table B-4. Sources of Sales Revenue
Source of sales revenue % of total expected change in sales revenue
New or improved products or product lines
Entering new markets
Other

This publication is available free of charge from: http://dx.doi.org/10.6028/N
IST.GC
R.16-006
Appendix C: Importance Scores

C-1
This publication is available free of charge from: http://dx.doi.org/10.6028/N
IST.GC
R.16-006
Table C-1. Rating of Importance of Capabilities/Needs (5=most important, 1=least important)
Sta
nd
ard
s an
d
refe
ren
ce d
ata
Rea
l-ti
me
met
rolo
gy
Des
ign
all
ow
able
s
Pro
cess
mo
del
ing
an
d
sim
ula
tio
n
Su
rfac
e fi
nis
hin
g
Mec
han
ical
tes
tin
g
pro
ced
ure
s
All Firms
4.5 4.0 3.9 3.9 3.5 3.7
Developers Mean Score 4.2 4.1 4.0 4.0 3.1 3.5
End Users Mean Score 4.6 3.9 3.8 3.8 3.7 3.8
Figure C-1. Rating of Importance of Capabilities/Needs (5=most important, 1=least important)
4.2 4.1 4.0 4.0
3.13.5
4.6
3.9 3.8 3.8 3.7 3.8
0
1
2
3
4
5
Standards andreference data
Real-timemetrology
Designallowables
Processmodeling and
simulation
Surfacefinishing
Mechanicaltesting
procedures
Developer User