economic analysis of the impact of free school meal …
TRANSCRIPT

ECONOMIC ANALYSIS OF THE IMPACT OF FREE SCHOOL MEAL ACCESS
EXPANSION ON ELEMENTARY SCHOOL CHILDREN IN
COMMUNITY ELIGIBILITY PROVISION
PILOT STATES
by
Anja Felicitas Gruber
A thesis submitted in partial fulfillment
of the requirements for the degree
of
Master of Science
in
Applied Economics
MONTANA STATE UNIVERSITY
Bozeman, Montana
July 2017

©COPYRIGHT
by
Anja Felicitas Gruber
2017
All Rights Reserved

ii
ACKNOWLEDGEMENTS
I would like to thank my thesis committee chair, Dr. Gregory Gilpin, for his
invaluable mentoring and support along this process. I would also like to thank Dr.
Randal Rucker and Dr. Christiana Stoddard for providing their expertise, advice and
guidance in completing this thesis.
Additionally, I would like to acknowledge Dr. Randal Rucker, Jane Boyd, Tamara
Moe, Wanda McCarthy and the entire Department of Agricultural Economics and
Economics for their continuous support and guidance throughout this program, and for a
highly enjoyable and educational learning experience.

iii
TABLE OF CONTENTS
1. INTRODUCTION ...........................................................................................................1
2. BACKGROUND .............................................................................................................4
National School Lunch Breakfast Program ......................................................................4
2010 Healthy, Hunger-Free Kids Act ...............................................................................6
Community Eligibility Provision ......................................................................................7
3. IMPLEMENTATION OF THE COMMUNITY ELIGIBILITY PROVISION ............11
School Take-up of the Community Eligibility Provision ...............................................11
Meal Service Revenues and Federal Reimbursement Influence on
Take-up Decision ............................................................................................................14
Impact on Participation ...................................................................................................20
4. LITERATURE REVIEW ..............................................................................................27
Individual School Meal Participation .............................................................................27
Determinants of School Meal Program Participation .....................................................31
Healthy, Hunger-Free Kids Act of 2010 .........................................................................32
Community Eligibility Provision ....................................................................................24
5. DATA OVERVIEW ......................................................................................................37
Definition of School Level Eligibility ............................................................................40
6. EMPIRICAL SPECIFICATION ...................................................................................53
Difference-in-Difference Estimation ..............................................................................53
Difference-in-Difference-in-Difference Estimation with Control States .......................57
7. RESULTS ......................................................................................................................59
Policy Implications .........................................................................................................65
8. CONCLUSION ..............................................................................................................75
REFERENCES CITED ......................................................................................................78
APPENDIX A: Figures ......................................................................................................84

iv
LIST OF TABLES
Table Page
3.1a. Percentage of Elementary Schools That Have Implemented the CEP ...........22
3.1b. Percentage of Elementary Schools with School-wide Title 1 Status
That Have Implemented the CEP ..................................................................22
3.2. Percentage of Elementary CEP-Schools within a School District ...................23
3.3. Scenarios of Changes in Total School Meal Sales
and Reimbursement Revenue ..........................................................................24
5.1. Summary of ISP Proxy by State ......................................................................48
5.2. Percentage of Elementary Schools Considered Eligible for the CEP ..............48
5.3. Summary of Percentage of Students in ECLS-K Data who
Attend a CEP School .......................................................................................49
5.4. Summary Statistics of Students’ Schools ........................................................50
5.5. Summary Statistics of Student Characteristics ................................................51
5.6. Summary Statistics of Student Outcomes ........................................................52
6.1. Difference-in-Difference Main Regression Results.........................................67
6.2. Impact of Redefining Categories on Ordered Logit Regression Results .........68
6.3. Difference-in-Difference Regression Results with
Different Control Groups .................................................................................69
6.4. Difference-in-Difference-in-Difference Regression Results with
Treatment and Control Group Specific School Year Fixed Effects ................70
6.5. Difference-in-Difference Regression Results with Impact on
Subsidy versus Non-Subsidy Eligible Students ...............................................71
6.6. Difference-in-Difference Regression Results without Students who
Attend Schools with 100 Percent Subsidy Eligibility ......................................72

v
LIST OF TABLES CONTINUED
Table Page
6.7. Difference-in-Difference Regression Results with Impact on
Meal Participating versus Non-Participating Students ....................................73
6.8. Difference-in-Difference-in-Difference Regression Results ...........................74

vi
LIST OF FIGURES
Figure Page
3.1. Percentage of Elementary CEP-Schools within a School District ..................23
3.2. Budget Constraint and Indifference Curve .....................................................26
5.1. ISPs of CEP Participating Elementary Schools ..............................................47
5.2. Proxy ISPs of CEP Participating Elementary Schools ...................................47
6.1. Distribution of Assessment of Student Cooperation,
Motivation and Attention ................................................................................69
A.1. ISPs of Elementary Schools in the Pilot States ..............................................85
A.2. Proxy ISPs of Elementary Schools in the Pilot States ...................................85
A.3. Distribution of the Percentage of Subsidy Eligible Students .........................86
A.4. Distribution of the Percentage of Subsidy Eligible Students
at CEP-Schools ..............................................................................................86

vii
ABSTRACT
In 2010, the Healthy, Hunger-Free Kids Act was passed to update and improve
provisions of the National School Lunch and School Breakfast Programs. Most
prominently, it introduced new meal guidelines and nutritional requirements for school
meals. Additionally, it authorized the Community Eligibility Provision (CEP) that
became available to schools with more than 40 percent of students who are eligible for
free school meals, based on federal means-tested program participation, in ten pilot states
before it was authorized nationally for school year 2014-15. Schools that opt into the
provision are required to provide free breakfast and lunch to all students. While a number
of studies have established that implementation of the provision leads to increased
student participation in school meals, no study is known that empirically analyzes the
impact on individual student outcomes.
Student-level data from the Early Childhood Longitudinal Survey- K: 2011 is
merged with school-level data in six pilot states and a difference-in-difference model
estimates the impact of CEP implementation on students’ health, academic, and
behavioral outcomes. No statistically significant effect of CEP implementation on student
outcomes is identified. Additionally, no indication is found, that students who receive
free or reduced-price meals before CEP implementation are impacted differently than
students who paid full price for school meals is found. Thus, this analysis does not
provide any evidence that CEP implementation in fact benefits individual students, either
by means of participation increases or reductions in stigma and student body
segmentation associated with subsidized school meals. Additionally, it is unlikely that
schools gain financially from implementation of the provision. Consequently, this thesis
questions that there are any significant returns on this public policy.

1
1. INTRODUCTION
Over 90 percent of public and private schools in the United States participate in
the National School Lunch Program (NSLP). A slightly smaller but increasing percentage
of schools also participates in the School Breakfast Program (SBP). About 60 percent of
school children consume these school meals every day, meaning that the majority of
school age children in the United States consume food provided through federally
assisted school meal programs on a daily basis. National school meal programs therefore
provide a significant opportunity to impact children and adolescent nutrition and health in
the United States.
Faced with unprecedented youth obesity and other diet related diseases, in 2010,
U.S. lawmakers passed the Healthy, Hunger-Free Kids Act to update the National School
Lunch and Breakfast Programs in order to ensure access to healthy nutrition. Along with
new meal standards, the act introduced the Community Eligibility Provision (CEP) that
allows schools with high percentages of needy students to provide universally free
breakfast and lunch meals. The provision was authorized first in ten selected states for a
three-year pilot period starting with school year 2011-12. Eligible schools in all states are
now permitted to implement the CEP. Once implemented, all children can participate in
the school’s breakfast and lunch offerings at no charge. In contrast, under traditional
school meal procedures, students may individually apply and qualify for free or reduced
meals based on their parents’ income or participation in other federal aid programs. Non-
eligible students must purchase the meals at full price. In 2015, the average price for
reduced-price meals was $0.40 and the average regular price was $2.50.
2
Due to loss of school meal sales at full and reduced prices, schools that choose to
participate in the CEP likely lose some meal service revenue, but can benefit from
reduced administrative costs and receive increased federal reimbursement. It is
anticipated that schools that opt into the CEP will experience increases in overall school
meal participation. Because students who were eligible to receive subsidized school
meals before the CEP was implemented may experience a reduction in the social stigma
associated with the consumption of subsidized school meals, participation increases are
expected not only for children who experience a price reduction. Furthermore,
participation among subsidy-eligible children may increase because parents no longer
have to complete applications for their children to receive subsidized meals.
The CEP is intended to help combat food insecurity, or the lack of reliable access
to a sufficient quantity of food, among school-age children and increase children’s access
to proper, healthy nutrition. Yet, previous empirical research on school meal participation
suggests that the effects are somewhat difficult to estimate: children who participate in
school meal programs are inherently different, and overall have less nutritious diets than
their peers who bring lunches from home (Millimet et al. 2010). While a number of
studies do find a positive relationship between school meal participation and individual
child outcomes, overall results are ambiguous. Based on the existing literature, empirical
evidence does not support the conclusion that increased participation in the federal lunch
and breakfast programs necessarily positively impacts child outcomes. If implementation
of the CEP leads to increased participation among already eligible children for meal

3
subsidies, as well as among previously non-eligible children, then there may be an impact
on both groups of children.
The goal of this thesis is to determine how school-level implementation of the
CEP impacts children with respect to health, behavioral, and academic outcomes.
Additionally, by estimating these effects for different groups of students, this research
aims to gain understanding of the mechanisms behind the impacts and may provide
additional insights on the impact of school meal participation on students.
Overall, no impact of CEP implementation is found with respect to students’
health, behavioral, and academic outcomes is found, regardless of whether a student
qualifies for subsidized school meals before the CEP is in place. This suggests that there
may lack of return in investment to schools that implement the CEP. Additionally,
conditional on the assumption that CEP implementation leads students who previously
never consumed school meals to participate in the NSLP, these results do not support
findings that suggest that school meal participation has an impact on student outcomes.

4
2. BACKGROUND
National School Lunch Breakfast Program (NSLP)
The National School Lunch Program was established by the National School
Lunch Act in 1946. Based on population and per capita income, the federal government
provided financial assistance and commodities to states to aid schools that chose to offer
lunch that complied with federal guidelines. While funding has evolved from a
population-based formula to reimbursement based on participation, schools still have the
option to participate and receive federal reimbursement conditional on compliance with
federal program requirements. Federally, the program is administered by the Food and
Nutrition Service. Cash subsidies and foods are provided to schools by the United States
Department of Agriculture (USDA). At the state level, the program is administered by the
State Education Agency and is typically operated by local school food authorities or
individual schools.
Federal program requirements state that students in households with income
between 130 and 185 percent of the federal poverty level are eligible for reduced price
meals. Students at or below 130 percent of the federal poverty level are eligible for free
meals. Additionally, Supplemental Nutrition Assistance Program (SNAP), Temporary
Assistance for Needy Families (TANF), and Food Distribution Program on Indian
Reservations (FDPIR) participation as well as migrant, homeless, orphan and foster child
status qualify students to receive free meals through direct certification. While
households are required to complete an application for each school year for their child to

5
qualify for income-based school meal assistance, state agencies identify students that
fulfill the requirements for direct certification by matching enrollment data with
participation records of the means-test programs.1 In other words, direct certification
eliminates the need for schools to provide parents with annual applications that they need
to fill out accurately and return to the school where these applications are processed and
approved. If parents are not willing, interested, or able to accurately complete the
household application, it can pose a barrier to school meal enrollment of children in need.
School meals must comply with meal patterns, dietary specifications, and
nutrition requirements provided by the Food and Nutrition Service. These requirements
include meal targets for calories, sodium, vegetables, fruits, grains, among other
specifications. In return, local school food authorities receive federal reimbursement
based on the number of free, reduced and full priced meals served.2
Currently, more than 90 percent of public and private schools in the United States
offer NSLP meals. Student participation has been fairly steady at 60 percent since 1989,
meaning that today about 31 million children consume NSLP meals every day. About 35
percent of participating children receive their meals for free or at the reduced price
(“National School Lunch Program: Participation and Lunches Served” 2016). Despite
steady overall participation rates, federal program costs have increased immensely from
$3.6 billion in 1990 to $11.2 billion in 2012, partially due to continuous increases in the
1The 2004 Child Nutrition and Special Supplemental Nutrition Program for Women, Infants, and Children
(WIC) Reauthorization Act requires states to develop direct certification systems for school-age SNAP
participants (Ralston 2008). 2For example, for school year 2015-2016 the maximum reimbursement per lunch meal served in contiguous
states was 37 cents per paid meal, $2.84 per reduced price meal and $3.24 per free meal. Reimbursements
were somewhat lower for schools that served 60 percent or less of lunches for free or at reduced price
during the previous school year (“Rates of Reimbursement” 2016).

6
participation of students that qualify for free or reduced-price meals (“Federal Cost of
School Food Programs” 2016).
In 1966, the Child Nutrition Act established the School Breakfast Program (SBP).
Designed to help provide adequate nutrition to children with severe need and to
emphasize participation by schools in severe need areas, over time it has evolved to a
program that is administered similarly to the NSLP. About one half of schools that
participate in the NSLP also offer the SBP. About one third of NSLP participating
children are also enrolled in the SBP, with the large majority of them receiving breakfast
for free or at reduced price (“The School Breakfast Program – Fact Sheet” 2013).
Since the establishment of the SBP, numerous other school meal programs, such
as the Fresh Fruit and Vegetable Program or the Special Milk Program have been
authorized. Additionally, several acts have been passed to update and improve the
procedures and nutrition guidelines of the NSLP and SBP.3
2010 Healthy, Hunger-Free Kids Act
The 2010 Healthy, Hunger-Free Kids Act (HHFKA) represents the most recent
effort to improve federal school meal programs. Its objective was to update and extend
national school meal programs to include more students. It also updated WIC, the Child
3In the 1980s, the Omnibus Budget Reconciliation Acts reduced federal subsidies for reduced-price eligible
students but decreased the minimum income threshold that qualifies students to be eligible for free meals.
The 1994 Healthy Meals for Americans Act required schools to meet the Dietary Guidelines for Americans
and under the 2002 Child Nutrition and WIC Reauthorization Act, schools were required to develop
nutrition guidelines for all foods offered (Ralston 2008).

7
and Adult Care Food Program, the After School Meal and Summer Food Programs,
SNAP, as well as the SBP and NSLP. The law increases reimbursements to NSLP and
SBP participating schools and requires these schools to comply with new nutrition
standards. The new standards represent efforts to provide children with more fruit,
vegetables, whole grain and lean protein but to limit the intake of sugar, fat and sodium.
The new guidelines were phased in and largely went into effect starting in July 2012.
Community Eligibility Provision (CEP)
The Healthy, Hunger-Free Kids Act of 2010 authorizes the Community Eligibility
Provision (CEP) which allows schools and local education agencies with 40 percent or
more direct certified students to provide free breakfast and lunch meals to the entire
student body. Schools can qualify for and implement the CEP individually if the
percentage of direct certified students, the identified student percentage (ISP), exceeds 40
percent.4 Analogously, local education agencies can qualify and implement the CEP as a
whole if the district’s ISP exceeds 40 percent. Additionally, individual schools within a
school district can collaborate to form a group of schools that combined achieve an ISP
of 40 percent of higher.5 This means that schools with ISP of less than 40 percent may
4The CEP is implemented at the beginning of a school year, in September. Eligibility and reimbursement
are based on enrollment data from April 1st during the previous school year. 5For an individual school, the identified student percentage is calculated by dividing the number of direct
certified students by total enrollment. Similarly, for an entire district or a group of schools, the identified
student percentage can be calculated by adding up every school’s number of direct certified students and
dividing this number by the sum of every school’s total enrollment. Groups of CEP schools can consist of
any number of schools. To clarify,
ISP = Percentage of direct certified students
= Percentage of students that are eligible for free school meals because of TANF, SNAP, or FDPIR
participation or due to homeless, migrant, runaway or foster child status
= Total number of direct certified students
Total number of students

8
also become eligible to participate in the CEP if they are able to collaborate with another
school or schools that have an identified student percentage that is higher than 40 percent.
Eligible schools or local education agencies can choose to implement the CEP for
a four year period. Once implemented, all children attending these schools can consume
both breakfast and lunch at no charge, regardless of their individual certification status.
Even if a school did not previously offer school breakfast meals, it must do so after
implementation of the CEP. During the four-year period, schools receive federal
reimbursement based on enrollment numbers as of April 1st in the year before the CEP
was implemented. Schools can drop out of the provision at any time. In order to receive
increased federal reimbursement, schools can choose to restart their four year CEP
participation cycle early if the percentage of direct certified students increased.
Recalculation of a school’s ISP is only mandatory if the school’s attendance area
changes. Similarly, recalculation for groups of schools or whole districts is only
mandatory if the composition of the group or school district changes. In other words, if a
school’s or district’s ISP drops below 40 percent during the four year cycle, the school or
district can continue CEP participation and receives reimbursement based on its initial
ISP for the remainder of the four-year period. If during the fourth year the ISP is below
the 40 percent threshold but above 30 percent, schools, groups of schools or school
districts can maintain CEP participation for the duration of a one-year grace period. After
the grace year, either a new four-year cycle is started, conditional on the ISP again
For example, for a group of two schools:
ISP = Number of direct certified students at school A+Number of direct certified students at school B
total enrollment school A+total enrollment school B
9
exceeding 40 percent, or standard meal and reimbursement practices are restored. CEP
schools receive federal reimbursement for 1.6 times the number of direct certified
students at the free meal rate and reimbursement at the paid meal rate for all additional
meals served.6
The CEP became available nationally for school year 2014-15. Prior to that, ten
states were identified by the Food and Nutrition Service to participate in a three-year pilot
period of the program, based on their potential to reach the highest numbers of qualifying
schools and school districts. During school year 2011-12, schools in Michigan, Illinois
and Kentucky were the first to be able to adopt CEPs. In these three states, 665 schools or
roughly 4 percent of schools participated in the CEP during this first pilot year
(“Community Eligibility Provision. Planning and Implementation Guidance” 2016).
Three additional states, New York, Ohio and West Virginia, and the District of Columbia
were added as pilot states for school year 2012-13. Georgia, Florida, Maryland and
Massachusetts were identified as the four final pilot states where eligible schools and
school districts were able to implement the CEP for school year 2013-14. After the pilot
period, the CEP became available in all states for school year 2014-15. Over 14,000
schools chose to participate nationally during school year 2014-15, including schools in
6In comparison, under the traditional reimbursement scheme schools receive payments at the free meal rate
(the highest reimbursement) for all meals served to students at no charge and payments at the reduced meal
rate for all meals served at the reduced price. The number of direct certified students is likely smaller than
the number of students who are eligible to receive free school meals because students can qualify for free
meals based on their parents’ income, additionally to the criteria for direct certification. Multiplying this
number of direct certified students by 1.6 is intended to approximate the sum of meals served for free and
for reduced price. If this is accurate, under the CEP schools receive higher reimbursement for meals served
to students that would qualify for free or reduced meals than they do under traditional procedures, and
equal reimbursement for meals served to students that have to pay full price under traditional procedures.
The Food Nutrition Service is authorized to change this multiplier to a number between 1.3 and 1.6.
10
every state except New Hampshire. School participation increased to over 17,000
schools, or about 50 percent of eligible schools, for school year 2015-16.
State agencies are responsible for collecting and posting lists with eligible schools
and school districts by April 15th each year. Eligible schools and districts must declare
their intent to participate by June 30th. Not all states maintain accurate records of each
school’s ISP. These states recalculate a school’s or district’s identified student percentage
once the school or district declares its intention to implement the CEP based on eligibility
according to its own calculations.7
7Of the pilot states, this applies to Illinois, New York, Ohio and Georgia.
11
3. IMPLEMENTATION OF THE COMMUNITY ELIGIBILITY PROVISION
School Take-up of the Community Eligibility Provision
Based on the pilot states’ records of Community Eligibility Provision (CEP)
participating schools that were collected for this analysis and merged with the Common
Core Data, only 4.8 percent of elementary schools in the first three pilot states (Michigan,
Illinois and Kentucky) implemented the CEP for school year 2011-12. In 2012-13, 6.6
percent of elementary schools in the first six pilot states implemented the CEP. This
percentage increased to 15.9 percent in 2013-14 and 19.1 percent in 2014-15, when the
provision was available in all pilot states (see table 3.1a). State-level school
implementation rates continuously increased from initial authorization of the CEP in all
states except Florida and Georgia. Large differences exist in the percentage of elementary
schools that opted into CEP between pilot states. This holds true for school
implementation of the CEP across all schools. Yet, on average, take-up is slightly higher
for elementary schools than for secondary schools. Specifically, 3.9 percent of all schools
in the first three pilot states implemented the CEP for school year 2011-12, 5.7 percent of
all schools in the pilot states implemented the CEP for school year 2012-13, 13.2 percent
for school year 2013-14 and 15.6 percent for school year 2014-15.
Table 3.1b summarizes the percentage of elementary schools with school-wide
Title 1 status that also implemented the CEP. Title 1 of the Elementary and Secondary
Act provides federal financial assistance to local education agencies and schools with
high percentages of children from low-income families to ensure that all children meet
state academic standards. Elementary schools are eligible to implement Title 1 as a

12
school-wide program if at least 40 percent of enrolled children are from low income
families. While different combinations of data may be used as poverty measures to
determine Title 1 eligibility, the eligibility standards are comparable to the requirement
for CEP eligibility.8 Contingent on the assumption that schools with school-wide Title 1
status are highly likely to also be eligible to implement the CEP, this provides an estimate
of the percentage of eligible elementary schools that have the CEP in place. Using this
proxy, 80.7 percent of elementary schools that have the CEP in place also have
continuous school-wide Title 1 status. Based on this definition of eligibility, 9.5 percent
of eligible elementary schools in the first three pilot states implemented the CEP in 2011-
12, 13.4 percent implemented it in the first 5 pilot states in 2012-13 and 28.1 percent of
eligible schools implemented the CEP in 2013-14 when it was authorized in all pilot
states. The implementation rate increased further to 33.7 percent in all pilot states in
2014-15. Of the pilot states, the highest take-up of the CEP occurred in West Virginia
with 66.6 percent of eligible schools in 2013-14 and 70.1 percent of eligible schools in
2014-15 compared to the lowest take-up in Maryland with 0.9 percent in 2013-14 and 3.4
percent in 2014-15. Tables 3.1a and 3.1b exhibit that take-up was low but increasing
among all schools and among schools that were considered eligible to implement the
CEP. Yet, differences in the take-up rate within and between states are fairly consistent
when looking at all schools and schools that are considered eligible. Thus, it appears that
school-level eligibility is relatively uniform across states and time.
8Depending on availability of data, schools can measure poverty by the percentage of children that are
enrolled in subsidized meal programs, the percentage of students that are direct certified, or the share of
students from low-income families determined through state income surveys.

13
Evaluating data on elementary, middle and high schools, the USDA’s Evaluation
Report of the CEP provided by Logan et al. (2014) finds that there are large differences
between states in the percentage of eligible schools and districts that implement the CEP
in the first seven pilot states. According to Logan et al. (2014), on average 32 percent of
eligible districts and 29 percent of eligible schools implemented the CEP during the first
two pilot years.9 In this study, in all seven states, schools and districts in more urban
areas, with lower enrollments, higher ISPs, higher percentages of students in lower
grades and higher percentages of black students on average, are found more likely to
have implemented the CEP, as were charter schools. Logan et al. (2014) also suggest that
the decision to implement the CEP may depend on unobservable factors, such as the
perceived financial benefit for an eligible school or local education agency.
The decision to implement the CEP can be made by an individual school, by a
group of schools, or by a school district. Because school meal providers often serve more
than one school, grouped CEP implementation might not only occur strategically to
qualify schools that would not be eligible individually, but also to continue school meal
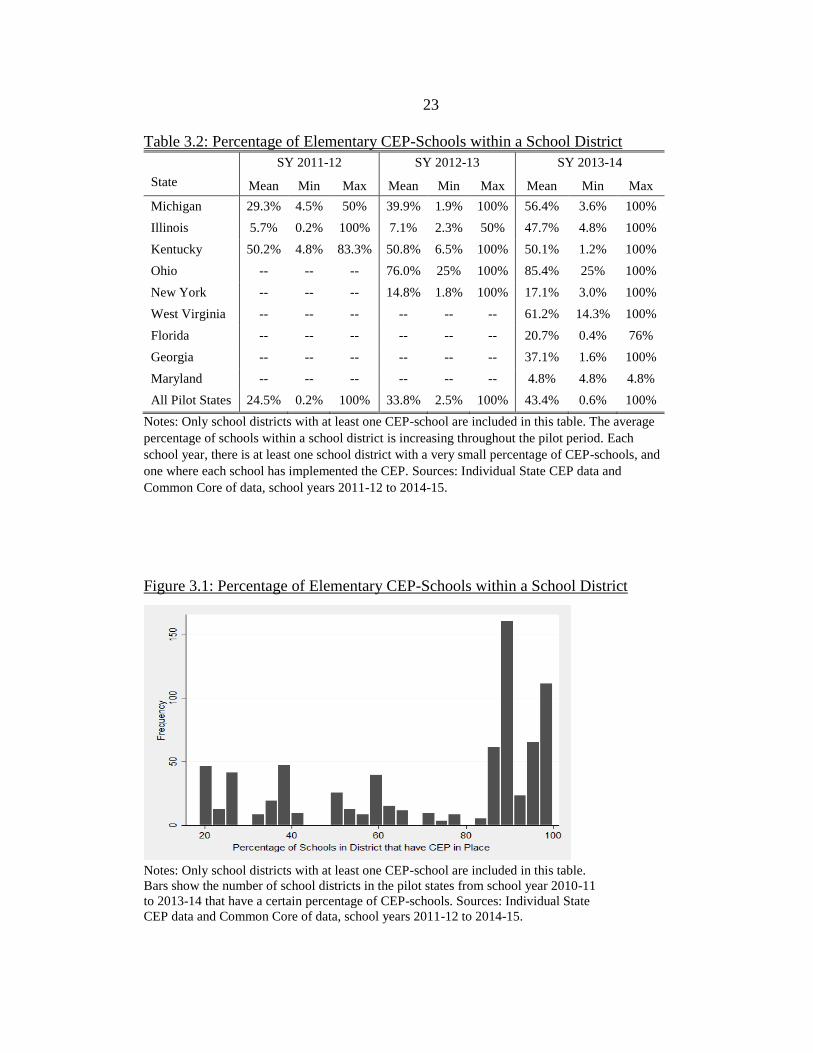
provision without disruption. Table 3.2 summarizes the percentage of schools that have
the CEP in place within a district where at least one school implemented the CEP by state
and school year. It illustrates that in all states except for Kentucky, the percentage of
CEP-schools within a school district where at least one school has the CEP in place
increases over time. During school year 2013-14, in school districts with at least one CEP
school, on average, almost 50 percent of schools participate in the CEP. Additionally,
9A school district or local education agency is defined as eligible, non-participating if it has at least one
eligible school with ISP at 40 percent, but no participating schools.
14
almost all pilot states have at least one school district where all schools have the CEP in
place during school year 2013-14. Yet, in each state there is also at least one school
district where only a very small percentage of schools implemented the CEP.
Consequently, table 3.2 suggests that CEP take-up decision in fact is made by various
decision authorities. Figure 3.1 further illustrates this. It provides a graphical summary of
the average percentage of CEP schools within a school district. The figure excludes all
school districts where no school has the CEP in place.
While a number of school districts implement the CEP at every school, in a
significant number of school districts the majority of schools do not have the CEP in
place. Yet, the distribution is skewed to the right, indicating that a school is more likely
to have the CEP in place if the majority of schools in its district has it in place as well.
Meal Service Revenues and Federal Reimbursement Influence on Take-up Decision
This section outlines the financial incentives of a school or school district to take-
up the CEP. In the following it is assumed that a school maximizes its meal service
profits, and will only consider CEP implementation if it expects that it does not lead to
significant reductions in the funding of its meal service. While this is likely a gross
simplification of a school’s objective function, it allows for better understanding why
some eligible schools may be more or less inclined to implement the CEP. Additionally, a
school might include factors such as students’ wellbeing, state or local funding for its
meal service, as well as revenues from food sales outside of the NSLP in its
considerations for whether or not to implement the CEP. Another factor that may lead

15
schools to financially benefit from CEP implementation that has recently been discussed
in the media are schools’ difficulties collecting outstanding student meal payments. In
fact, the School Nutrition Association estimates that as many as 76 percent of school
districts reported unpaid meal debt at the end of school year 2014-15 (“School Meal
Trends& Stats” 2017). Consequently, schools may decide to implement the CEP to
minimize losses rather than to maximize meal service profits. Even if a school’s meal
service revenue from reimbursement and sales revenue does not increase due to CEP
implementation, the meal service may still benefit financially if CEP implementation
significantly decreases costs of service or costs of student certification processes.
A number of school meal service profit maximization scenarios, based on average
reimbursement rates and meal prices for the NSLP for school year 2014-15, are
summarized in table 3.3 to provide insights into schools’ financial incentives to
implement the CEP. The table provides calculations based on a school with 100 students
and an ISP of 40 percent and 60 percent, respectively. Federal reimbursements are
assumed to be the same for all three types of schools at $3.06 for every free meal served,
$2.66 for every reduced-price meal served and $0.36 for every meal served at full price.10
Consistent with average prices for school year 2014-15 in the United States, students are
assumed to be paying $2.50 for a full price lunch and $0.40 for a reduced-price lunch at
all schools. Separate calculations are performed for a school where only subsidized
10Reimbursement rates are contingent on the percentage of free and reduced price meals a school served
during the previous school year, as well as on a school’s performance. During school year 2014-15, an
average school in the contiguous states received $3.06 for every free lunch served, $2.66 for every reduced-
price lunch served, and $0.36 for every full priced meal served (“School Programs Meal, Snack and Milk
Payments to States and School Food Authorities” 2015).

16
students consume meals, for a school where all students consume school meals, and for a
school where only subsidized students consume school meals before CEP
implementation, but all students consume school meals once the CEP is in place. The first
two rows of each scenario summarize which students participate in the NSLP prior to and
under the CEP.
Under the CEP, schools receive federal reimbursement at the free meal rate for
the number of meals that corresponds to the Identified Student Percentage (ISP)
multiplied by 1.6. The Food and Nutrition Service authorizes this multiplier to reimburse
approximately all meals served to free and reduce-price eligible students at the free meal
reimbursement rate. In fact, Logan et al. (2014) find that this multiplier corresponds to
the average ratio of a school’s ISP and its percentage of subsidy eligible students. The
calculations in this section also rely on this assumption that multiplying the ISP by 1.6
gives a percentage that is approximately equal to the percentage of subsidy eligible
students at a school. Finally, the calculations in table 3.3 depend on the assumption that if
participation increases when a school implements the CEP, meal service costs to the
school’s meal service provider will increase by $1.00 per every new student. This is
consistent with the assumption that 37 percent of the cost of providing a meal stems from
actual food cost, as estimated by the school nutrition association (“School Meal Trends&
Stats” 2017). The first part of table 3.3 shows different calculation scenarios that all
assume that 100 percent of students who are eligible for subsidized school lunches
participate in the program. The second part of table 3.3 shows the same scenarios with
the assumption that only 50 percent of subsidy eligible students participate in the NSLP.

17
Upon implementation of the CEP, reimbursement for meals served to students
who previously consumed free meals remains the same. Reimbursement for meals served
to students who previously consumed reduced-price meals increases by 40 cents per
meal, while 40 cents of reduced-price meal revenue is lost per meal, leading to no change
in total revenue from meals served to reduced-price eligible students. This can easily be
seen when considering the following equations (1) and (2) for total school meal service
revenue with and without the CEP in place where FME and RME stand for the number of
students that are eligible to receive free and reduced meals, FULL0 stands for the number
of students who purchase full-price meals without the CEP and FULL1 for the number of
additional students who consume meals under the CEP and had to pay for school meals
prior to CEP implementation. The percentage of subsidy eligible students who participate
in the NSLP without the CEP is given by α and the percentage of subsidy eligible
students who participate in the NSLP with the CEP is given by β.
Revenue without CEP= $3.06*α*(FME+RME) + $2.86* FULL0 (1)
Revenue after CEP implementation=$3.06*β*(FME+RME) + $0.36*(FULL0+FULL1) -
$1*FULL1-$1*(β- α)*(FME+RME) (2)
Consequently, regardless of a school’s ISP, if only subsidized students consume
school meals, CEP implementation has little impact on the total of revenue and
reimbursement (scenarios 1 and 4). In contrast, for every meal served at full price under
the standard meal program, the net loss in revenue and reimbursement due to CEP
implementation equals $2.14 per meal, so that a school will incur a substantial loss in

18
total revenue and reimbursement if the entire student body consumes school meals with
and without the CEP in place. These losses are greater for schools with a lower ISP
(scenario 3). Somewhat smaller losses are incurred if schools experience increases in
participation when the CEP is in place (scenario 2). However, scenarios 5 and 6 illustrate
that schools at which only a portion of subsidy eligible students participate in the NSLP
can financially benefit from CEP implementation, especially if participation among
subsidized students increases and a school has a high ISP (scenario 5).
Consider scenario 5 for a school with an ISP of 40 percent and 100 students that is
displayed in the second part of table 3.3. Prior to CEP implementation only 50 percent of
subsidy eligible students participate in school meals, meaning that of 40 free meal
eligible students only 20 participate, and of 24 reduced-price eligible students only 12
students participate ((40*1.6-40)*0.5=12). For every free eligible student the school
receives $3.06 federal reimbursement and for every reduced eligible students it receives
$2.66 federal reimbursement and $0.40 sales revenue, so that total revenue prior to the
CEP equals $97.92. Now assume that CEP implementations leads to the entire student
body participating in the NSLP, meaning that additionally 32 subsidy eligible and 36
non-subsidy eligible students participate. Under the CEP, the school receives $3.06
federal reimbursement for each of its 64 subsidy eligible students and $0.36 federal
reimbursement for the remaining 36 students. Meal service costs increase by $1 for each
of the 68 new meal participants. In this scenario, in total, the school earns $42.88 more
meal service revenue and reimbursement after CEP implementation.
19
In contrast, scenario 2 illustrates that the same school is highly unlikely to benefit
financially from CEP implementation if it differs only with respect to the percentage of
subsidy eligible students who consume school meals (100 percent in scenario 2 and 50
percent in scenario 4). In this scenario, before the CEP is implemented the school
receives $3.06 reimbursement each for its 40 direct certified students and $2.66
reimbursement and $0.40 sales revenue for each reduced-price eligible students, so
$195.84 in total. With the CEP in place, the school receives this same amount in
reimbursement for its 64 subsidy eligible students, but only receives $0.36
reimbursement for each of the 36 newly participating students. This does not cover the
additional cost per student, meaning that in total the school loses $23.05 by implementing
the CEP.
In the sample of this analysis, elementary schools, on average, have 618 students.
This, means that if school meals are provided for 180 school days, a $90 loss of revenue
when implementing the CEP with full NSLP participation and an ISP of 40 percent
(scenario 3) means that a school would lose $100,500 of meal service revenue in one
school year. Thus, even if CEP implementation only leads to small changes in daily meal
services revenues, it may have a significant financial impact over the course of one or
multiple school years.
Overall, based on these calculations a school’s meal service is more likely to
benefit financially from CEP implementation if its revenues from meal sales are very
small, if CEP implementation leads to large increases in student participation, or if a large
portion of direct certified students do not consume school meals. Generally, it is unlikely

20
that a school’s meal service would be able to achieve significant financial gains from
CEP implementation.
Impact on Participation
The CEP is designed to help ensure that children in need participate at greater
rates in school meal programs. It eliminates the need for income-based free and reduced
meal applications, thus decreasing the administrative burden to low-income households
and to schools. If children in need choose not to participate in subsidized school meals
because they fear judgement from their peers, such stigma may be reduced by the CEP
because it eliminates segmentation of the student body. Participation may increase as a
consequence.
Economic theory predicts that unless school meals are a giffen good, school-wide
CEP implementation will lead to increases in student meal participation rates. This is
especially true if reductions in stigma and application cost are treated as further price
reductions, additional to the price reductions to students who previously had to pay the
full or a reduced price for school meals. Figure 2 displays a budget constraint and
indifference curve model for a student with income M for whom the cost of school meals
decreases from a positive price per meal (as reflected by the slope of BC1) to zero cost, up
to the maximum number of school meals the student is able to consume in a year
(reflected by the slope of BC2). Initially, this student consumes s1 school meals. After the
student’s budget constraint becomes horizontal, his or her consumption will increase
from A to B due to the substitution effect. Final consumption of school meals will depend
21
on the size and sign of the income effect. If school meals are a normal good, the final
consumption point C will lie to the right of B. If school meals are an inferior good, the
final consumption point C will lie to the left of point B, but to the right of point A, unless
the income effect is negative and larger in absolute value than the substitution effect. In
this unlikely case, school meals would be a giffen good and the income effect would lead
to a decrease in the number of school meals consumed. Consequently, even if school
meals are an inferior good, but the income effect is smaller than the substitution effect,
economic theory predicts that the CEP will lead to increases in students’ school meal
consumption.
Additionally, it is plausible that the CEP may have an impact on students’
behavior and academic performance, even if no significant or only small changes in
participation occur as a result of CEP implementation. Again, such effects could stem
from decreases in segmentation of the student body and possible reductions of
stigmatization of students who are eligible for meal subsidies.

22
Table 3.1a: Percentage of Elementary Schools That Have Implemented the CEP State SY 2011-12 SY 2012-13 SY 2013-14 SY 2014-15
Michigan 7.0% 10.8% 12.7% 16.6%
Illinois 1.3% 2.2% 14.4% 25.2%
Kentucky 8.2% 15.6% 28.1% 49.0%
New York -- 3.1% 5.3% 6.6%
Ohio -- 9.2% 10.4% 15.2%
West Virginia -- -- 53.3% 57.4%
Florida -- -- 21.0% 14.1%
Maryland -- -- 0.3% 1.5%
Georgia -- -- 34.0% 25.1%
Massachusetts -- -- No data No data
All Pilot States 4.8% 6.6% 15.9% 19.1%
Notes: Among all pilot states CEP take-up for school year 2014-15 was highest in West Virginia and
lowest in Maryland. In all states except for Florida and Georgia take-up is continuously increasing over
time.
Sources: Individual State CEP data and Common Core of data, school years 2011-12 to 2014-15.
Table 3.1b: Percentage of Elementary Schools with School-wide Title 1
Status That Have Implemented the CEP
State SY 2011-12 SY 2012-13 SY 2013-14 SY 2014-15
Michigan 12.8% 20.3% 25.2% 29.7%
Illinois 2.5% 4.8% 32.7% 53.3%
Kentucky 10.3% 18.7% 34.2% 58.5%
New York -- 8.0% 11.2% 12.9%
Ohio -- 16.7% 16.8% 23.5%
West Virginia -- -- 66.6% 70.1%
Florida -- -- 13.3% 22.9%
Maryland -- -- 0.9% 3.4%
Georgia -- -- 46.8% 35.6%
Massachusetts -- -- -- --
All Pilot States 9.5% 13.4% 28.1% 33.7%
Notes: Similarly to take-up among all schools, CEP take-up of elementary schools that are
considered eligible to implement the CEP has increased throughout the pilot period and
varies largely by state. A significant portion of eligible schools do not have the CEP in
place. Sources: Individual State CEP data and Common Core of data, school years
2011-12 to 2014-15.
23
Table 3.2: Percentage of Elementary CEP-Schools within a School District SY 2011-12 SY 2012-13 SY 2013-14
State Mean Min Max Mean Min Max Mean Min Max
Michigan 29.3% 4.5% 50% 39.9% 1.9% 100% 56.4% 3.6% 100%
Illinois 5.7% 0.2% 100% 7.1% 2.3% 50% 47.7% 4.8% 100%
Kentucky 50.2% 4.8% 83.3% 50.8% 6.5% 100% 50.1% 1.2% 100%
Ohio -- -- -- 76.0% 25% 100% 85.4% 25% 100%
New York -- -- -- 14.8% 1.8% 100% 17.1% 3.0% 100%
West Virginia -- -- -- -- -- -- 61.2% 14.3% 100%
Florida -- -- -- -- -- -- 20.7% 0.4% 76%
Georgia -- -- -- -- -- -- 37.1% 1.6% 100%
Maryland -- -- -- -- -- -- 4.8% 4.8% 4.8%
All Pilot States 24.5% 0.2% 100% 33.8% 2.5% 100% 43.4% 0.6% 100%
Notes: Only school districts with at least one CEP-school are included in this table. The average
percentage of schools within a school district is increasing throughout the pilot period. Each
school year, there is at least one school district with a very small percentage of CEP-schools, and
one where each school has implemented the CEP. Sources: Individual State CEP data and
Common Core of data, school years 2011-12 to 2014-15.
Figure 3.1: Percentage of Elementary CEP-Schools within a School District
Notes: Only school districts with at least one CEP-school are included in this table.
Bars show the number of school districts in the pilot states from school year 2010-11
to 2013-14 that have a certain percentage of CEP-schools. Sources: Individual State
CEP data and Common Core of data, school years 2011-12 to 2014-15.

Table 3.3: Scenarios of Changes in Total School Meal Sales and Reimbursement Revenue
Student body
composition Source of revenue
Scenario 1 Scenario 2 Scenario 3
Prior to
CEP
Under
CEP Change
Prior to
CEP
Under
CEP Change
Prior to
CEP
Under
CEP Change
NSLP participants prior to CEP:
NSLP participants with CEP in place:
Subsidized students only
Subsidized students only
Subsidized students only
All students
All students
All students
ISP=40%.
Assumes 40 direct
certified students
are eligible for
free meals,
40*1.6= 64
students are
eligible for
subsidized meals,
and
64-40=24 students
are eligible for
reduced meals.
Reimbursement for meals
served for free 40*$3.06
=$122.40
64*$3.06
=$195.84 +$73.44
40*$3.06
=$122.40
64*$3.06
=$195.84 +$73.44
40*$3.06
=$122.40
64*$3.06
=$195.84 +$73.44
Reimbursement for meals
sold at reduced price 24*$2.66
=$63.84 --
-$63.84
24*$2.66
=$63.84 -- -$63.84
24*$2.66
=$63.84 -- -$63.84
Reimbursement for meals
sold at full price -- -- --
--
36*$0.36
=$12.96 +$12.96
36*$0.36
=$12.96
36*$0.36
=$12.96 --
Revenue from reduced-
price meal sales 24*$0.40
=$9.60 -- -$9.60
24*$0.40
=$9.60 -- -$9.60
24*$0.40
=$9.60 --
-$9.60
Revenue from full price
meal sales -- -- --
-- --
36*$2.50
=$90.00 -- -$90.00
Change in meal cost due
to change in participation -- -- --
-- -36*$1.00 =-$36.00 -$36.00 -- -- --
Total $195.84 $195.84 -- $195.84 $172.80 -$23.05 $ 98.80 $208.80 -$90.00
ISP=60%.
Assume 60 direct
certified students
are eligible for
free meals,
60*1.6= 96
students are
eligible for
subsidized meals,
and
96-60=36 students
are eligible for
reduced meals.
Reimbursement for meals
served for free 60*$3.06 =$183.60
96*$3.06 =$293.76 +$110.16
60*$3.06 =$183.60
96*$3.06 =$293.76 +$110.16
60*$3.06 =$183.60
96*$3.06 =$293.76 +$110.16
Reimbursement for meals
sold at reduced price 36*$2.66
=$95.76 --
-$95.76
36*$2.66
=$95.76 --
-$95.76
36*$2.66
=$95.76 --
-$95.76
Reimbursement for meals
sold at full price -- -- -- -- 4*$0.36
=$1.44 +$1.44
4*$0.36
=$1.44
4*$0.36
=$1.44 --
Revenue from reduced-
price meal sales 36*$0.40
=$14.40 --
-$14.40
36*$0.40
=$14.40 -- -$14.40
36*$0.40
=$14.40 --
-$2.50
Revenue from full price
meal sales -- -- -- -- -- -- 4*$2.50
=$10.00 --
-$10.00
Change in meal cost due
to change in participation -- -- -- -- -4*$1
=-$4.00 -$4.00 -- -- --
Total $293.76 $293.76 -- $293.76 $291.20 -$2.56 $ 305.20 $295.20 -$10.00
Notes: This table summarizes different scenarios of changes in a school’s meal service revenue and meal reimbursements due to CEP implementation
at a school with 100 students. If all subsidized students participate in the NSLP, a school can earn equal revenues from sales revenue and federal
reimbursement by switching from traditional meal service to the CEP if it does not have any full price meal sales, regardless of its ISP. It is highly
unlikely that a school where all subsidized students participate in the NSLP can financially benefit from CEP implementation.
24

Table 3.3 continued: Scenarios of Changes in Total School Meal Sales and Reimbursement Revenue
Student body
composition Source of revenue
Scenario 4 Scenario 5 Scenario 6
Prior to
CEP
Under
CEP Change
Prior to
CEP
Under
CEP Change
Prior to
CEP
Under
CEP Change
NSLP participants prior to CEP:
NSLP participants with CEP in place:
50% of subsidy eligible students
50% of subsidy eligible students
50% of subsidy eligible students
All students
50% of subsidy students and all others
50% of subsidy students and all others
ISP=40%.
Assume 40 direct
certified students
are eligible for
free meals.
40*1.6= 64
students are
eligible for
subsidized meals.
64-40=24 students
are eligible for
reduced meals.
Reimbursement for meals
served for free 20*$3.06
=$61.20
32*$3.06
=$97.92 +$36.72
20*$3.06
=$61.20
64*$3.06
=$195.84 +$134.64
20*$3.06
=$61.20
64*$3.06
=$195.84 +$134.64
Reimbursement for meals
sold at reduced price 12*$2.66
=$31.92 --
-$31.92
12*$2.66
=$31.92 --
-$31.92
12*$2.66
=$31.92 --
-$31.92
Reimbursement for meals
sold at full price -- -- -- -- 36*$0.36
=$12.96 +$12.96
36*$0.36
=$12.96
36*$0.36
=$12.96 --
Revenue from reduced-
price meal sales 12*$0.40 =$4.80
-- -$4.80
12*$0.40 =$4.80
-- -$4.80
24*$0.40 =$9.60
-- -$9.60
Revenue from full price
meal sales -- -- -- -- -- -- 36*$2.50
=$90.00 --
-$90.00
Change in meal cost due
to change in participation -- -- -- -- -68*$1.00
=-$68.00 -$68.00 -- -- --
Total $97.92 $97.92 -- $97.92 $172.80 +$42.88 $168.96 $197.28 +$28.32
ISP=60%.
Assume 60 direct
certified students
are eligible for
free meals.
60*1.6= 96
students are
eligible for
subsidized meals.
96-60=36 students
are eligible for
reduced meals.
Reimbursement for meals
served for free 30*$3.06
=$91.80
48*$3.06
=$146.88 +$55.08
30*$3.06
=$91.80
96*$3.06
=$293.76 +$201.96
30*$3.06
=$91.80
52*$3.06
=$159.12 +$67.32
Reimbursement for meals
sold at reduced price 18*$2.66
=$47.88 --
-$47.88
18*$2.66
=$47.88 -$47.88
18*$2.66
=$47.88 --
-$47.88
Reimbursement for meals
sold at full price -- --
-- --
4*$0.36
=$1.44 +$1.44
4*$0.36
=$1.44
4*$0.36
=$1.44 --
Revenue from reduced-
price meal sales 36*$0.40 =$14.40
-- -$14.40
36*$0.40 =$14.40 -- -$14.40
36*$0.40 =$14.40
-- -$14.40
Revenue from full price
meal sales -- -- -- -- -- -- 4*$2.50
=$10.00 --
-$10.00
Change in meal cost due
to change in participation -- -- --
--
-4*$1
=-$4.00 -$4.00 -- -- --
Total $146.88 $146.88 -- $146.88 $243.20 +$96.32 $156.32 $159.12 +$2.80
Notes: This table shows different scenarios of changes in a school’s meal service revenue and meal reimbursements due to CEP implementation at a
school with 100 students. Schools can benefit in terms of meal service revenues from implementing the CEP if only a portion of meal subsidy eligible
students participate in the NSLP if non-subsidy eligible students participate (scenario 6) or participation of subsidized students increases under the CEP.
25

26
Figure 3.2: Budget Constraint and Indifference Curve
Notes: This figure illustrates the budget constraints and indifference curves for a student who experiences a
reduction in cost, through a decrease in price and through decreased stigma and administrative burden, due
to CEP implementation, as shown by a shift from BC1 to BC2.
The number of school meals consumed per year is plotted on the X-axis and dollars spent on
goods other than school meals per year are plotted on the Y-axis. This simplification arises from M= PxX +
∑PyYi, = PxX + PyY, where Py=1. BC1 displays the initial budget constraint and BC2 displays the budget
constraint after CEP implementation. It is horizontal up until the maximum amount of school meals a
student can consume in one year because those meals can be consumed at no charge.
Economic theory predicts that a student who initially consumes s1 school meals will increase his
or her consumption of school meals, unless school meals are a giffen good. Point C illustrates a scenario
were school meals are an inferior good. Yet, school meal consumption will increase after CEP
implementation because the substitution effect is bigger than the negative income effect.

27
4. LITERATURE REVIEW
It is well established that greater dietary quality and food security is linked to
improved health, behavioral and academic outcomes. National school meal programs
provide a significant opportunity to impact children’s nutrition and food security and
therefore have been studied extensively with respect to these outcomes. Additionally, a
number of studies examine the relationship between school meal availability and
participation and academic and weight outcomes directly. Empirical studies typically
distinguish between National School Lunch (NSLP) and School Breakfast Program
(SBP) participation. Less empirical work has been conducted on the effects of the
changes implemented under the 2010 Healthy, Hunger Free Kids Act (HHFKA). Studies
that analyze the Community Eligibility Provision (CEP) to date have mainly focused on
school-level participation and changes in student participation rates. This chapter
provides a brief overview of the existing literature in the above described areas of focus.
Individual School Meal Participation
Existing studies, mainly found in the medial literature, establishes that there is a
positive relationship between food sufficiency and academic outcomes, child behavior
(Alaimo et al. 2001), and a healthy weight (Gundersen and Kreider 2009). Similarly,
students that consume higher quality diets are found to perform better (Glewwe et al.
2001, Winicki and Jemison 2003, Alderman 2006). Economic literature also finds that
the quality of school meals is positively related to student achievement. Belot and James
(2011) and Andersen et al. (2017) come to this conclusion when looking at the impact of

28
schools switching to a new food service provider that serves healthier meals on students’
academics.
Studies that have looked at the impact of NSLP or SBP participation on food security
and dietary quality have also largely found a positive effect. While Gao (2012), using the
time a child has available to eat lunch as an instrumental variable, does not find a
significant effect on food security, Huang and Barridge (2016) find that NSLP
participation is associated with a reduction in food insufficiency risk by 14 percent, using
a fixed effect regression model. Artega and Heflin (2014) have similar conclusions.
Looking at the impact of SBP participation on food security, Bartfeld and Ahn (2011)
find no change in a child’s risk of being considered food insecure, but a reduction in a
child’s risk of being close to the food insecurity threshold.
Gleason and Suitor (2003) employ student-level fixed effects to estimate the impact
of NSLP participation on nutrient intake and find that it increases both the intake of
valuable nutrients and the intake of fat, and decreases the intake of sugar. Bhattacharya et
al. (2016) also conclude that NSLP participation leads to increased nutritional quality of
the foods consumed. These findings are strengthened further by Gordon (1995) and Akin
et al. (1983) who find a positive impact on children’s nutrition, especially for low income
children. In contrast, Campell et al. (2011) find that NSLP participants consume a higher
quantity of food, but do not consume higher quality food. Using a fixed effect regression
model, this paper finds no significant difference in dietary outcomes. With respect to SBP
participation, Crepinsek et al. (2006) randomly assign schools to offer universally free
breakfast and find that students at the treatment schools consume higher nutritional

29
quality breakfasts, but daily nutrient intake was not impacted. Yet, Bhattacharya et al.
(2004) find that SBP participation leads to improvements in a variety of nutritional
outcomes. It is worth noting that, as Bhattachary et al. (2016) point out, studies that focus
on nutrition outcomes rely on highly unreliable 24 hour recall data.
Despite the overwhelmingly positive evidence of school meal participation on food
security and diet quality, the results of empirical research with respect to the effect of
NSLP participation on weight and academic outcomes are inconclusive. In contrast,
research with respect to the impact of SBP participation points to a positive impact on
weight and academic outcomes. Discrepancies in findings likely arise due to endogenous
selection and selection bias. Because there is a positive relationship between school meal
participation and children’s weight, and a negative relationship between school meal
participation and dietary quality (Millimet et al. 2010), a causal effect of school meal
participation on individual outcomes is difficult to identify.
Schanzenbach (2009) employs a regression discontinuity design that takes advantage
of the income cutoff of reduced price meal eligibility and finds that NSLP participation
increases a child’s likelihood of being obese. Using data from the same survey, the Early
Childhood Longitudinal Study (1998-1999), Millimet et al. (2010) analyze the impact of
long term NSLP and SBP participation and similarly concluded that NSLP participation
exacerbates youth obesity issues. Additionally, this study points out that the mechanism
by which NSLP participation impacts weight outcomes is not clear. Capogrossi et al.
(2016) find that both short and long term participation in the NSLP increases the
probability of being overweight. In contrast, Gundersen et al. (2012) employ an

30
instrumental variable strategy and find that under weak assumptions NSLP actually leads
to a decrease in the likelihood of being obese and other negative health outcomes.
Gleason and Dodd (2009) find that SBP participation, but not NSLP participation, is
associated with a lower Body Mass Index (BMI). This result is strengthened by Millimet
et al. (2010) who point out that there is non-random selection into the program. When
accounting for selection bias, SBP participation is found to lead to decreased rates of
obesity.
Most studies that look at academic outcomes focus on the SBP. Yet, Hinrichs (2010)
employs a change in the formula used to allocate state funding as an instrumental variable
to estimate the effect of NSLP participation on adult health outcomes and educational
attainment. He finds no effect on long term health outcomes, but a positive impact on
adult educational attainment. Imberman and Kugler (2014) and Frisvold (2015), using a
regression discontinuity design as well as a difference-in-difference model, find that SBP
availability leads to increased student achievement. In contrast, Schwanzenbach and Zaki
(2014) and Leos-Urbel et al. (2013) do not find an effect of SBP access on academic
outcomes.
While school meal participation is largely found to positively impact children’s food
security and nutrient intake, studies that look directly at the impact on student outcomes
provide less clear conclusions. Overall, evidence for the impact of NSLP participation is
mixed, and recent studies seem to point to predominantly higher weight outcomes. This is
important because obesity has become the number one health problem facing children in
the United States (Cawley 2010) and is especially prevalent among lower socio-economic

31
populations (Rosin 2008). With respect to the SBP, evidence points to mostly decreased
weight outcomes, and to a somewhat weaker but mostly positive relationship between
SBP participation and academic achievement.
Determinants of School Meal Program Participation
Literature that examines the determinants of individual’s school meal program
participation can provide insights into the mechanism of how the CEP leads to increased
participation rates. Moore et al. (2009) find that school type is the biggest determinant of
participation. Elementary students are more likely than middle school students to
participate and high school students are the least likely to participate (Moore et al. 2009,
Newman and Ralston, 2006). Ohri-Vachaspati (2014) argues that students whose parents
perceive the quality of school meals to be greater are more likely to participate. With
respect to the effect of price changes on participation, Akin et al. (1983) find that a 50
percent increase in the price of school lunch is expected to reduce participation by 20
percent. Analogously, Gleason (1995) finds a negative relationship between meal
participation and price.
The SBP was made available to all students at no charge in New York City schools
starting in school year 2003. Leos-Urbel et al. (2013) find that this change to universally
free breakfast resulted in increases in participation, both for students who previously
were eligible to receive reduced price and free breakfast meals, as well as for students
who had to pay full price before the policy change. Similarly, schools with a high
32
portion of needy schools in Guildford County in North Carolina offered free breakfasts to
all students during school year 2007-08. Ribar and Haldeman (2013) exploit the reversal
of this policy and find that the switch from universally free to eligibility-based pricing led
to significant reductions in SBP participation for students who were eligible for breakfast
subsidy before and after the policy change and for students that were no longer eligible.
Leos-Urbel et al. (2013) conclude that these findings suggest that there is some type of
non-price mechanism that affects school meal participation, but that it is difficult to
conclude that participation increases due to a reduction in stigma.
Other studies have found a direct relationship between peer effects and student
meal participation. Holford (2015) looks at the take-up of free school meals in the United
Kingdom and finds that a 10 percentage point increase in peer-group take-up reduces
non-participation by 29 to 35 percent. Similarly, Mirtcheva (2009) estimates that a 10
percent higher free meal eligibility rate at a student’s school is associated with a 1.8
percentage point increase in the probability of school meal participation, a 6.7 percentage
point increase in the probability of participation in reduced price school meals and a 2.6
percentage point increase in free school meal participation.
Healthy, Hunger Free Kids Act of 2010
Implementation of the updated nutrition standards was highly controversial with
concerns of decreased student meal participation, increased food waste, and increased
food service costs. Accordingly, a few studies have looked into the impact on plate waste,
and some research has been conducted that evaluates the impact of meal standard updates
33
on student’s food selection and meal participation. Overall, there is evidence of
improvements in children’s nutrition, specifically increased fruit and vegetable
consumption, and little indication that there is a decrease in student participation or an
increase in plate waste in response to the updates. Consistent with the results of a number
of previous studies that have looked at different nutrition intervention or obesity
prevention programs that have been implemented on a more local level (Cluss et al. 2014,
Taber et al. 2013, Nanney et al. 2014, Struempler et al. 2014), overall evidence points to
improvements in children’s nutrition, specifically increased fruit and vegetable
consumption, and little indication that there is a decrease in student participation or an
increase in plate waste in response to the new standards.
To estimate the effect of the updated nutrition standards on food selection and
consumption, Schwartz et al. (2015) collect data at 12 middle schools in an urban, low-
income school district during school year 2011-12 and during school years 2012-13 and
2013-14, after the nutrition requirement updates went into effect. They find that the
percentage of students choosing to consume fruit increased significantly from 54 to 66
percent and find that fewer entrees and vegetables were thrown away after the new meal
standards were implemented. Johnson et al. (2016) look at daily food selection data from
January 2011 through January 2014 in an urban school district in Washington State and
find no real changes to student meal participation rates, but improvements to the
nutritional quality of food consumed by students after implementation of the nutrition
updates. Cohen et al. (2014) examine several elementary schools in a low-income, urban
school district in Massachusetts before and after implementation of the nutrition updates

34
and find that schools mostly comply with the standards before and after the update. On an
individual student level, they find no impact on student selection of entrees and
vegetables, but a 23 percent increase of fruit selection. Additionally, this study also finds
that entrée consumption increases by 15.6 percent and vegetable consumption by 16.2
percent post implementation of the updated standards, suggesting that the Act in fact has
contributed to improvements in school meal nutrition and has not led to increased plate
waste.
Community Eligibility Provision
Much of the existing literature on the Community Eligibility Provision (CEP)
focuses on the effect of school level implementation on school-level participation rates.
As mandated by the HHFKA, an evaluation of the CEP was published in February 2014,
and its year 3 addendum in January 2015 by the USDA. These reports provide
information on the implementation of the CEP as well as incentives and barriers for
adoption, and operational issues in administering the CEP. Additionally, an impact study
aims to gain insights in the impact of CEP implementation on students’ participation,
school meal revenues and costs, certification errors and meal quality (Logan et al. 2014
and Harkness et al. 2015).
Using a matched comparison design approach, Logan et al. (2014) find that local
education agency and school CEP implementation leads to a 5-10 percent increase in
breakfast and lunch program participation compared to similar, eligible, non-participation
local education agencies or school (similar results are found by Harkness et al (2015) in
35
the Year 3 Addendum of the CEP evaluation report). The studies find no evidence that
CEP implementation has an impact on meal quality or overall meal claiming error but
suggest that CEP implementation eliminated errors and cost associated with the
processing of income-based free or reduced meal applications. However, due to the
design of the studies, these results assess the effect on school districts or schools that
have chosen to participate. Generalization of these results is difficult because CEP
implementation is likely determined by unobserved, heterogeneous district or school
characteristics (Logan et al. 2014).
Kwon et al. (2015) and Henry (2015) also find an increase in participation
associated with the first year of CEP implementation in Chicago elementary schools and
Kansas, respectively. Kwon et al. (2015) evaluate monthly meal count data for school
years 2011-2012 and 2012-13 at six schools that adopted the CEP for this school year.
They estimate a 28 percent increase in SBP participation and a 7 percent increase in
NSLP participation. Henry (2015) finds a 6.5 percent increase in breakfast program
participation and a 3.4 percent increase in lunch program participation. This study
additionally examines the impact of CEP implementation on local education agencies and
food service departments and finds that schools that implemented the CEP in Kansas, on
average, receive increased meal reimbursement of 4 percent per meal.
Moore (2016) examines the perception of principals and food service workers in a
qualitative analysis by administering surveys regarding implementation of the CEP to 68
CEP schools in a county in Kentucky. Based on the participants’ perceptions, this study

36
concludes that perceived benefits seem to outweigh barriers to implementation. Overall
satisfaction with the provision among schools that have implemented appears to be high.
In conclusion, existing literature has found increases in school meal participation
due CEP implementation. Findings from the literature on school meal participation
suggest that these increases likely stem from both a price and a non-price effect.
Participation increases among students who already qualified to receive subsidized school
meals indicate the presence of a non-price mechanism, such as a reduction in social
stigma. In essence, CEP implementation can be seen as a way to increase all students’
access to school meals.
While school meal access and participation overall is found to be positively
related to students’ food security and nutrient intake, the impact of participation on
weight and academic outcomes is controversial. Consequently, it is not clear that CEP
implementation benefits students’ health, behavior, and academic performance. This
thesis contributes to the existing literature by empirically evaluating the impact of school-
level CEP implementation on these outcomes. Additionally, because it exploits a natural
experiment that provides increased incentive to participate in school meals to all students,
the results of this study may help provide understanding for how students who do not
self-select into school meal programs prior to CEP implementation are impacted by
participation in national school meal programs.

37
4. DATA OVERVIEW
The analysis combines three data sets. First, annual data on public schools that
participate in the National School Lunch Program (NSLP) in Michigan, Illinois,
Kentucky, Ohio, West Virginia, New York, Florida, Maryland, Texas and California with
specific information on each school’s annual Community Eligibility Provision (CEP)
eligibility and participation status were received by request from each state’s education
agency. These data are then merged with the Common Core Data (CCD) of the
Department of Education’s National Center for Education Statistics, an annual collection
of information on all public schools in the United States. Together, the data provide
information on every public school in the CEP pilot states from 2010-11 to 2014-15
school years.
Student data used in this analysis are provided by the restricted-access versions of
the Early Childhood Longitudinal Survey, Kindergarten Class of 2010-11 (ECLS-K:
2011). This study comprises a nationally representative sample of children that are
followed from kindergarten through fifth grade. It conducts individual assessments and
provides information from interviews with students’ schools, their teachers and parents.
The restricted-access version provides the NCES School ID, allowing for the data to be
combined with the above data set by school and school year. The ECLS-K: 2011 initially
collected data from a nationally representative sample of 18,170 children enrolled in 970
schools across the United States, during school year 2010-11.11
11Observations rounded to nearest 10 as per data license restriction.

38
Due to students dropping out of the study, these data are an unbalanced panel over
four consecutive school years. This analysis focuses on students that attend a school in a
CEP pilot state during 2010-11 to 2013-14 school years. It excludes students that change
schools during a school year, but retains students that change schools between school
years. Currently, ECLS-K data are only available to school year 2013-14 and the most
recent data were collected in the spring of 2014. This limits the analysis to school years
2010-2011 (pre-CEP), 2011-12 (Michigan, Illinois and Kentucky authorize the CEP),
2012-13 (New York, West Virginia and Ohio authorize the CEP) and 2013-14 (Florida,
Georgia, Maryland and Massachusetts authorize the CEP).
While schools implement the CEP at the beginning of a school year, ECLS-K
variables are collected throughout the fall and spring of each school year.12 For some
variables and children, two observations, one for the fall and one for the spring semester,
per school year are available. For most variables only one observation per school year is
available, collected either during the fall or the spring. To determine the impact of the
CEP, the spring observation is used when available, even if two observations are
available for the school year. When only a fall observation is available, this observation is
used and a binary variable is coded in order to indicate that the data point was collected
during the fall. This allows to control for more exact timing of effects.
12The restricted ECLS data to date are available for seven periods. Period one data were collected during
the fall of school year 2010-11, period 2 data were collected during the spring of school year 2010-11,
period 3 data were collected during the fall of school year 2011-12, and so forth. During school year 2013-
14, only one round of data collection occurred. These data, period 7 data, were collected in the spring of
school year 2013-14.

39
One challenge of this analysis stems from the limitations of states’ records on
Identified Student Percentages rates (ISPs). While all states provided annual lists with
records of all CEP participating schools, not all states maintain records of every school’s
ISP. Specifically, Illinois did not provide ISPs for any of its schools and New York and
Georgia do not maintain records of non-CEP schools’ ISP. For these states, schools or
school districts calculate their ISP and the state verifies this once a school or district
applies for CEP participation. Thus, for New York and Georgia, the ISP is only available
for CEP participants. Additionally, for their first year of CEP implementation, Michigan,
Illinois and West Virginia only provided lists with CEP participating schools.
Consequently, for school year 2011-12 in Michigan and Illinois and for school year 2012-
13 in West Virginia, the ISP is also only available for these participating schools. Hence,
school-level CEP eligibility cannot consistently be defined based on a school’s ISP.
Additionally, schools can apply jointly to implement the CEP, even when an individual
school’s ISP does not exceed 40 percent. Figure 5.1 shows the distribution of CEP
participating schools’ ISPs.13 The data indicate that the 40 percent cutoff is somewhat
arbitrary as a number of schools with an ISP of less than 40 percent participate in the
CEP by combining with other schools. Still, a large majority of schools that have the CEP
in place in fact have an ISP that exceeds 40 percent.
13Only CEP schools for which the ISP is provided in the state data are included in the figure.

40
Definition of School-level Eligibility
A measure of school-level eligibility to implement the CEP that is available for all
schools is required to define a control group of students who attend schools that are
eligible for the CEP but have not implemented it. To avoid selection bias, four different
measures are constructed for this thesis.
The primary definition of school-level CEP eligibility used in this analysis is
based on a school’s school-wide Title 1 status throughout the sample. As described in
Chapter 3, schools are eligible for school-wide Title 1 that provides federal financial
assistance to the school if at least 40 percent of enrolled children are from low income
families. Schools and districts are allowed some flexibility in the measuring of the
percentage of low income families. Consequently, while eligibility for school-wide Title
1 can be based on the same criteria as eligibility for the CEP, it may differ slightly in
some cases.14 However, schools that have school-wide Title 1 in place are highly likely to
also qualify for the CEP. This definition of CEP eligibility leads to the smallest control
group in the analysis. 31 percent of students in the sample attend a school that has school-
wide Title 1 status during all years of the sample period.
Secondly, school-wide eligibility is relaxed to a school having school-wide Title 1
status at some point in the sample instead of throughout the sample. The control group
constructed with this definition is bigger and may include schools that experience
changes in the composition of the student body or schools that are closer to the eligibility
14Again, depending on availability of data, schools may measure poverty by the percentage of children that
are in enrolled in subsidized meal programs, the percentage of students that are direct certified, or the share
of students from low-income families determined through state income surveys.

41
cutoff and consequently don’t have Title 1 status during all years of the sample. 63
percent of students in the sample attend a school that has school-wide Title 1 status at
some point during the sample period.
Alternatively, a measure of a school’s percentage of students who are direct
certified, a proxy for ISP, is used to define a control group according to the criteria that is
used by the states to determine CEP eligibility. The proxy is calculated by dividing a
school’s percentage of free and reduced-price eligible students from the states’ CEP data
by 1.6, the reimbursement multiplier used by the Food and Nutrition Service (FNS).15
Where the percentage of free and reduced price students is not available, it is calculated
by dividing the number of free and reduced price eligible students by total enrollment.
Where this count is missing in the CEP data, the number of free and reduced price
eligible students from the CCD data is used. When no information other than the ISP on
the number of eligible students is available, the ISP is also used as the proxy. Figure 5.2
shows the distribution of CEP participating schools’ proxy ISPs.
Discrepancies between Figure 5.1 and 5.2 arise because the ISP is missing for a
number of schools, but also because schools self-report the number of meal-subsidy
eligible students and these number appear to be somewhat unreliable.16 When the ISP
proxy is calculated based on the percentage of free and reduced price eligible students, it
15Because students who are eligible for free school meals based on their household income falling below
the 130 percent threshold of the FPL are also eligible to enroll in SNAP, a school’s percentage of students
who are eligible for free meals should be roughly equal to a school’s percentage of direct certified students.
Yet, large discrepancies exist in the CCD data so that the measure of the percentage of free-eligible
students is determined unreliable and thus eliminated as an alternative measure of a school’s percentage of
direct certified students for this analysis. 16 For example, a number of schools in the CCD report a number for students who are eligible for free and
reduced-price meals that exceeds the school’s total enrollment in a given year.
42
cannot exceed 62.5 percent so that Figure 5.2 shows a large number of schools with a
proxy of 62.5 percent.17 Distributions of ISPs and proxy ISPs of all elementary schools in
pilot states are shown in figures A.1 and A.2 in Appendix A.
Based on the ISP proxy, the last two definitions of eligibility are constructed. The
third definition of school-level eligibility includes all schools with a proxy ISP that is
greater than 40 percent. The last definition also includes schools that lie just below this
threshold, but may be eligible to implement the CEP when grouped with other schools,
eligibility is constructed on a state-to-state basis. A school is considered eligible to
implement the CEP if its ISP Proxy exceeds the minimum ISP Proxy of all CEP
participating schools in a state.
Table 5.1 summarizes schools’ proxy ISPs in each state. The average proxy ISP
of all CEP participating schools in the pilot states is 53.4 percent. In comparison, the
average proxy ISP for non-CEP elementary schools is 33.4 percent. In all pilot states, the
average proxy ISP for CEP schools lies above the 40 percent threshold, but except for
Maryland there is at least one CEP-school in each state with a proxy ISP that is lower
than 40 percent. Again, this table illustrates that schools do implement the CEP in groups.
In all pilot states the average proxy ISP for CEP schools is between 45.3 percent (West
Virginia) and 59.7 percent (Maryland). In Illinois the minimum proxy ISP of all CEP-
schools equals 13.4 percent, representing the smallest proxy ISP of all CEP-schools in the
17If the percentage of free and reduced price eligible students at a school equals 100 percent, the
corresponding proxy is 62.5 percent= 100/1.6. However, a school’s actual ISP may exceed this percentage
if a bigger percentage of meal subsidy eligible students than 62.5 are direct certified to receive free school
meals.

43
pilot states. On the other hand, all pilot states except for West Virginia have at least one
non-CEP school with an ISP proxy that is smaller than 1 percent.
Table 5.2 provides a summary of the percentage of schools that are considered
eligible to implement the CEP according to the four definitions of eligibility in this
analysis. Based on all four definitions, the percentage of eligible CEP participating
schools exceeds the percentage of eligible non-participating schools by substantial
margins. 80.7 percent of CEP schools are considered eligible if school-wide Title 1
throughout the sample is used to define eligibility. Basing eligibility on the minimum ISP
Proxy of all CEP schools leads to 100 percent of CEP schools being considered eligible
to implement the CEP. The percentage of CEP schools that are considered eligible to
implement the CEP lies in between these two percentages for the remaining definitions of
eligibility. Of schools that have not implemented the CEP, 37.8 percent are considered
eligible according to the minimum Proxy ISP definition and 52 percent are considered
eligible if school-wide Title 1 is used to define eligibility. Again, the percentage of non-
CEP schools that are considered eligible to implement the CEP according to the
remaining definitions lies in between the two percentages. Regardless of the definition
for school-level eligibility to implement the CEP, a significant percentage of schools that
have not implemented the CEP are considered eligible to do so, which is consistent with
estimates based on schools’ actual ISPs.
After merging the ECLS-K data with state CEP and CCD data, Table 5.3
summarizes the percentage of students in each school year and state that attend a school
that has authorized the CEP. Due to the nature of the sampling process of the ECLS-K,

44
there are no student observations in Kentucky in the ECLS-K data set. None of the
students in the data in West Virginia and Maryland attend a school that has implemented
the CEP. Consequently, West Virginia and Maryland are omitted from the analysis and
this analysis is limited to Michigan, Illinois, Kentucky, New York, Ohio, Florida, and
Georgia. With 410 student-level observations from 270 students over time who attend a
school that implements the CEP, the treatment group is small and limits this analysis.18
To provide an overview of the student-level data from the ECLS-K, summary
statistics are provided in the following section. Table 5.4 provides a summary of school
characteristics, table 5.5 summarizes student characteristics and Table 5.6 summarizes
the outcomes. Means are provided for all students, for students that attend a school that
has implemented the CEP, and for students that attend a school with school-wide Title 1
status during the entire sample, that has not implemented the CEP. School-wide Title 1
status throughout the sample is chosen as the definition for school-level eligibility
because it most conservatively constructs the control group.
Table 5.4 provides an overview of the average racial composition of schools in
the sample, as well as their size, location, Title 1 status, and percentage of students who
are eligible for meal subsidies. CEP-schools, on average, have more black students, are
smaller, and more likely to be located in a rural area than non-CEP schools. Of the
students at non-CEP schools, on average, 72.9 percent are eligible for meal subsidies,
compared to 82.4 percent at CEP schools. Yet, this percentage is significantly higher than
18Observations rounded to nearest 10 as per data license restriction.

45
the average percentage of students that qualify for subsidized meals at all schools in the
sample, 51.2 percent.
Table 5.5 summarizes the characteristics of students, including race, gender, age,
birthweight, highest parental education, household size, eligibility for meal subsidies and
whether a student reports consumption of school meals. The indicator variable “eligible
for meal subsidy” equals one when a child is eligible to receive free or reduced school
meals based on his or her parent’s income or participation in federal means tested
programs. The indicator variable “school meal participation” indicates whether a student
participated in the NSLP at some point during the analysis. Because the ECLS-K
collected this variable only during the first two years of the survey, the data available do
not allow for inferences of how CEP implementation affect student school meal
participation. Based on t-tests, students who attend a CEP school, on average, are more
often black, older, have parents with less education and are more likely to qualify for
meal subsidies than students at non-CEP schools. Students at CEP schools are more
likely to report that they consume school meals than students at all schools, but equally
likely to report consumption as students at the control schools. Similarly to school
characteristics, the averages for students who are part of the control group lie in between
the averages of all students and students who attend a CEP school.
Table 5.6 summarizes individual student outcomes. BMI is included in this
analysis as a variable for students’ health. It is a continuous variable with a mean of 17.5.
Reading, math, science, cognitive flexibility and working memory test scores are
included as academic outcomes. Instead of raw scores, item response theory (IRT)

46
calculated test scores are used for these direct cognitive assessments to allow for better
comparison across students and time. All five direct cognitive assessment variables are
continuous, but ranges are different for each score. Next, teacher assessments of
attentional focus and inhibitory control, as well as whether a student is held back a grade,
are included. Assessments of attentional focus and inhibitory control are based on the
judgement of a student’s teacher and rated on a continuous scale from one to seven.
Based on the grade a student attains at each round of data collection, a binary variable for
whether the student has been held back a grade is calculated and included as a teacher
assessment. Finally, behavioral assessments of motivation, cooperation, and attention, as
evaluated during administration of the survey, are included. These variables are
categorical and have five initial categories that are collapsed into three.
Differences in the number of observations stem from a number of missing data
points throughout the data set. Most notably, students who attend a CEP school, on
average, appear to have a higher BMI, higher math, reading and science test scores, but
lower assessment test and teacher assessment scores, and are more likely to be held back
a grade than students at control schools.

47
Figure 5.1: ISPs of CEP Participating Elementary Schools
Notes: Figure displays the number of CEP schools for a given ISP where ISP is the percentage of students
at a school who are direct certified and therefore automatically qualify for free school meals. A school’s
ISP has to exceed 40 percent in order for it to implement the CEP individually. Schools with ISPs below 40
percent may qualify to implement the CEP when grouped with other schools that have an ISP above 40
percent. N=6,888. Mean=61.7. Standard Deviation=14.4.
Source: Individual State CEP data, school years 2011-12 to 2014-15.
Figure 5.2: Proxy ISPs of CEP Participating Elementary Schools
Notes: Figure displays the number of CEP schools for a given proxy ISP, where the proxy is calculated by
dividing the percentage of students that qualify for free or reduced-price schools meals by 1.6, the
reimbursement multiplier authorized by the Food and Nutrition Service. By calculation, schools where 100
percent of students are eligible for subsidized school meals have a proxy of 62.5 percent. The proxy is
calculated because the ISP is not available for all schools.
N=10,113. Mean=53.4. Standard Deviation =10.2.
Sources: Individual State CEP data and Common Core of data, school years 2011-12 to 2014-15.
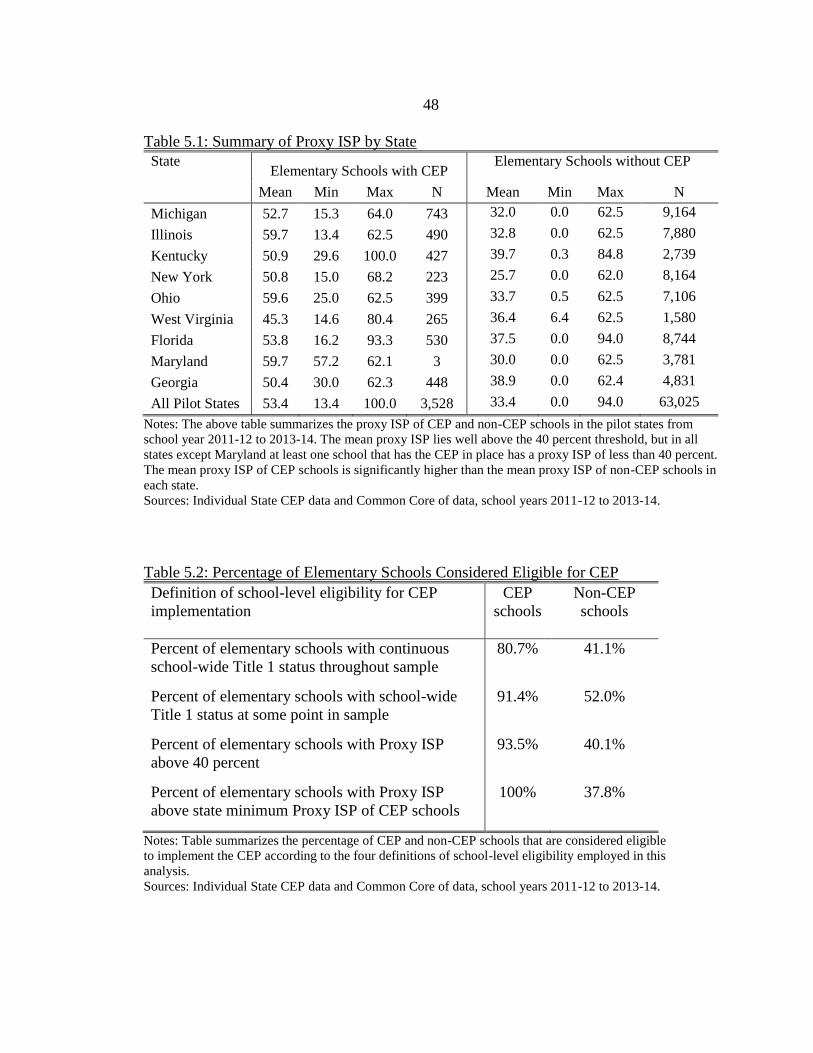
48
Table 5.1: Summary of Proxy ISP by State
State Elementary Schools with CEP
Elementary Schools without CEP
Mean Min Max N Mean Min Max N
Michigan 52.7 15.3 64.0 743 32.0 0.0 62.5 9,164
Illinois 59.7 13.4 62.5 490 32.8 0.0 62.5 7,880
Kentucky 50.9 29.6 100.0 427 39.7 0.3 84.8 2,739
New York 50.8 15.0 68.2 223 25.7 0.0 62.0 8,164
Ohio 59.6 25.0 62.5 399 33.7 0.5 62.5 7,106
West Virginia 45.3 14.6 80.4 265 36.4 6.4 62.5 1,580
Florida 53.8 16.2 93.3 530 37.5 0.0 94.0 8,744
Maryland 59.7 57.2 62.1 3 30.0 0.0 62.5 3,781
Georgia 50.4 30.0 62.3 448 38.9 0.0 62.4 4,831
All Pilot States 53.4 13.4 100.0 3,528 33.4 0.0 94.0 63,025
Notes: The above table summarizes the proxy ISP of CEP and non-CEP schools in the pilot states from
school year 2011-12 to 2013-14. The mean proxy ISP lies well above the 40 percent threshold, but in all
states except Maryland at least one school that has the CEP in place has a proxy ISP of less than 40 percent.
The mean proxy ISP of CEP schools is significantly higher than the mean proxy ISP of non-CEP schools in
each state.
Sources: Individual State CEP data and Common Core of data, school years 2011-12 to 2013-14.
Table 5.2: Percentage of Elementary Schools Considered Eligible for CEP
Definition of school-level eligibility for CEP
implementation
CEP
schools
Non-CEP
schools
Percent of elementary schools with continuous
school-wide Title 1 status throughout sample
80.7% 41.1%
Percent of elementary schools with school-wide
Title 1 status at some point in sample
91.4% 52.0%
Percent of elementary schools with Proxy ISP
above 40 percent
93.5% 40.1%
Percent of elementary schools with Proxy ISP
above state minimum Proxy ISP of CEP schools
100% 37.8%
Notes: Table summarizes the percentage of CEP and non-CEP schools that are considered eligible
to implement the CEP according to the four definitions of school-level eligibility employed in this
analysis.
Sources: Individual State CEP data and Common Core of data, school years 2011-12 to 2013-14.

49
Table 5.3: Percentage of Students in ECLS-K Data who Attend a CEP School
by State
Notes: A total of 410 observations are associated with students at a CEP. Of the sample, 210 students
attend a school that has the CEP in place at some point during the sample period.19 There are no
observations of students who attend a school that implements the CEP in West Virginia or Maryland
in the ECLS-K data.
19Observations rounded to nearest 10 as per data license restriction.
State SY 2011-12 SY 2012-13 SY 2013-14
Michigan 7.2% 9.8% 1.3%
Illinois 0% 0% 6.5%
New York -- 10.7% 9.5%
Ohio -- 19.6% 20.9%
West Virginia -- 0% 0%
Florida -- -- 5.2%
Georgia -- -- 32.2%
Maryland -- -- 0%
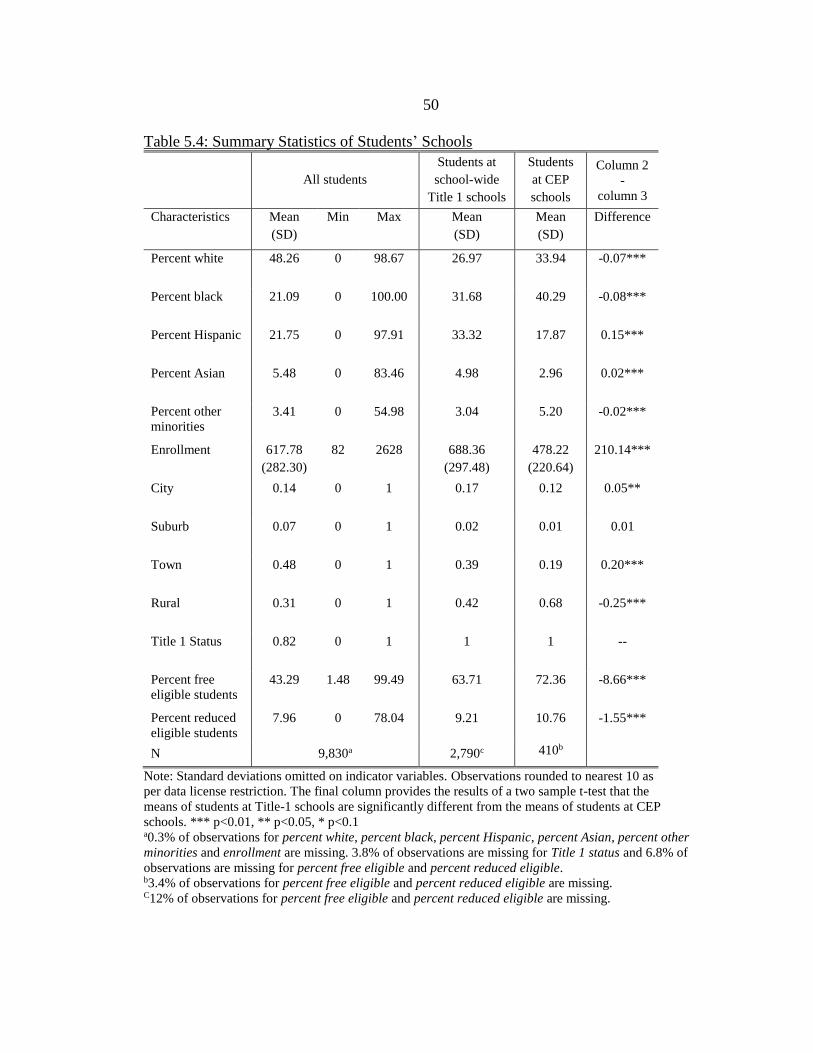
50
Table 5.4: Summary Statistics of Students’ Schools
All students
Students at
school-wide
Title 1 schools
Students
at CEP
schools
Column 2
-
column 3
Characteristics Mean
(SD)
Min Max Mean
(SD)
Mean
(SD)
Difference
Percent white 48.26 0 98.67 26.97 33.94 -0.07***
Percent black 21.09 0 100.00 31.68 40.29 -0.08***
Percent Hispanic 21.75 0 97.91 33.32 17.87 0.15***
Percent Asian 5.48 0 83.46 4.98 2.96 0.02***
Percent other
minorities 3.41 0 54.98 3.04 5.20 -0.02***
Enrollment 617.78
(282.30)
82 2628 688.36
(297.48)
478.22
(220.64)
210.14***
City 0.14 0 1 0.17 0.12 0.05**
Suburb 0.07 0 1 0.02 0.01 0.01
Town 0.48 0 1 0.39 0.19 0.20***
Rural 0.31 0 1 0.42 0.68 -0.25***
Title 1 Status
0.82 0 1 1 1 --
Percent free
eligible students 43.29 1.48 99.49 63.71 72.36 -8.66***
Percent reduced
eligible students 7.96 0 78.04 9.21 10.76 -1.55***
N 9,830a 2,790c 410b
Note: Standard deviations omitted on indicator variables. Observations rounded to nearest 10 as
per data license restriction. The final column provides the results of a two sample t-test that the
means of students at Title-1 schools are significantly different from the means of students at CEP
schools. *** p<0.01, ** p<0.05, * p<0.1 a0.3% of observations for percent white, percent black, percent Hispanic, percent Asian, percent other
minorities and enrollment are missing. 3.8% of observations are missing for Title 1 status and 6.8% of
observations are missing for percent free eligible and percent reduced eligible. b3.4% of observations for percent free eligible and percent reduced eligible are missing. C12% of observations for percent free eligible and percent reduced eligible are missing.

51
Table 5.5: Summary Statistics of Student Characteristics
All students
Students
at school-
wide Title
1 schools
Students
at CEP
schools
Column 2
-
column 3
Characteristics
Mean
(SD)
Min Max Mean
(SD)
Mean
(SD)
Difference
White 0.69 0 1 0.59 0.55 0.04
Black 0.23 0 1 0.36 0.47 -0.12***
Hispanic 0.25 0 1 0.37 0.21 0.16***
Asian 0.10 0 1 0.10 0.04 0.06***
Native 0.02 0 1 0.03 0.03 -0.01
Male 0.51 0 1 0.52 0.50 0.01
Age (months) 91.20
(15.80) 62.93 133.89
91.13
(15.81)
106.00
(11.59) -14.88***
Birth weight (lbs.) 6.82 0 1 6.76 6.60 0.16*
Highest Parental
Education: No Degree 0.09 0 1 0.17 0.16 0.01
High school 0.51 0 1 0.60 0.68 -0.08***
Bachelor 0.35 0 1 0.21 0.14 0.07***
Masters 0.05 0 1 0.02 0.01 0.00
Household size 4.59
(1.34) 2 14
4.62
(1.31)
4.67
(1.11) -0.05
Subsidy eligible 0.53 0 1 0.77 0.81 -0.05*
Free meal eligible 0.42 0 1 0.65 0.72 -0.07**
Reduced meal eligible 0.10 0 1 0.12 0.09 0.03
Meal participant 0.76 0 1 0.89 0.89 0.01
N 9,800a 2,790c 400b
Note: Standard deviations omitted on indicator variables. Observations rounded to nearest 10 as per
data license restriction. The final column provides the results of a two sample t-test that the means
of students at Title-1 schools are significantly different from the means of students at CEP schools.
*** p<0.01, ** p<0.05, * p<0.1 a18% of observations for subsidy eligible, free meal eligible, reduced meal eligible and household
size are missing. More than 25% of observations are missing for birth weight. b29% of observations for subsidy eligible, free meal eligible, reduced meal eligible and household
size are missing. More than 25% of observations are missing for birth weight.
c22% of observations for subsidy eligible, free meal eligible, reduced meal eligible and household
size are missing. More than 25% of observations are missing for birth weight.
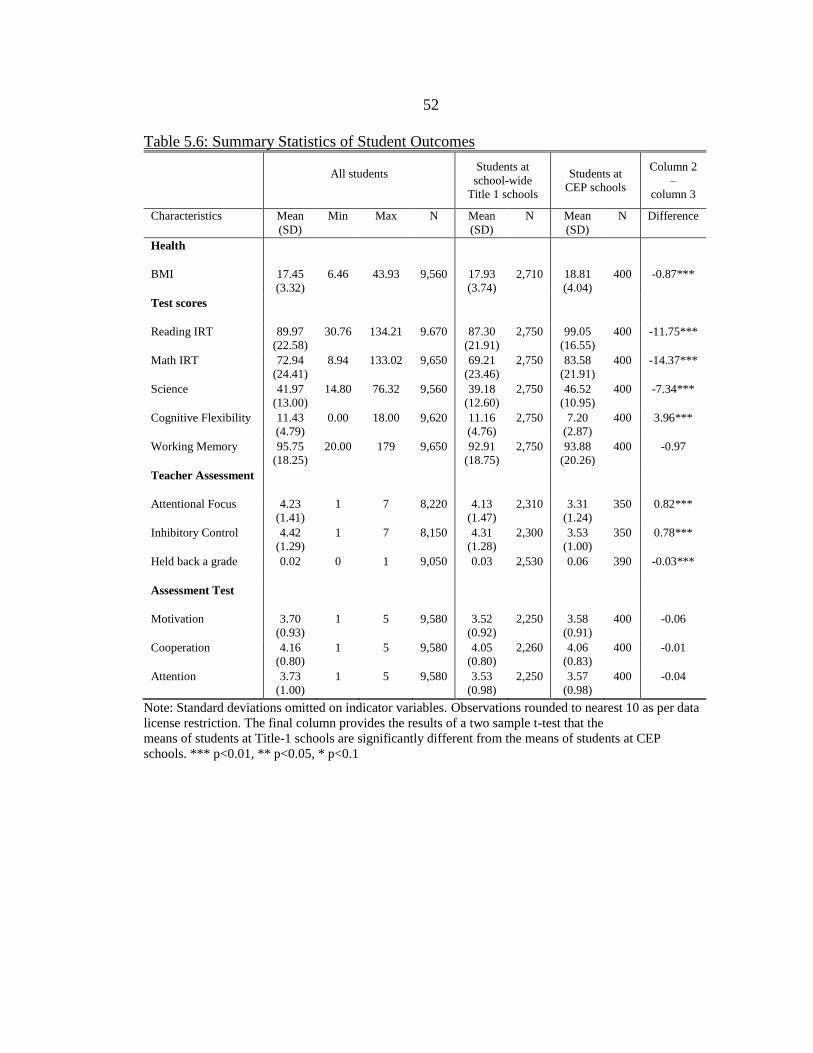
52
Table 5.6: Summary Statistics of Student Outcomes
All students Students at
school-wide
Title 1 schools
Students at
CEP schools
Column 2
–
column 3
Characteristics Mean
(SD)
Min Max N Mean
(SD)
N Mean
(SD)
N Difference
Health
BMI 17.45
(3.32)
6.46 43.93 9,560 17.93
(3.74)
2,710 18.81
(4.04)
400 -0.87***
Test scores
Reading IRT 89.97
(22.58)
30.76 134.21 9.670 87.30
(21.91)
2,750 99.05
(16.55)
400 -11.75***
Math IRT 72.94
(24.41)
8.94 133.02 9,650 69.21
(23.46)
2,750 83.58
(21.91)
400 -14.37***
Science 41.97
(13.00)
14.80 76.32 9,560 39.18
(12.60)
2,750 46.52
(10.95)
400 -7.34***
Cognitive Flexibility 11.43
(4.79)
0.00 18.00 9,620 11.16
(4.76)
2,750 7.20
(2.87)
400 3.96***
Working Memory 95.75
(18.25)
20.00 179 9,650 92.91
(18.75)
2,750 93.88
(20.26)
400 -0.97
Teacher Assessment
Attentional Focus 4.23
(1.41)
1 7 8,220 4.13
(1.47)
2,310 3.31
(1.24)
350 0.82***
Inhibitory Control 4.42
(1.29)
1 7 8,150 4.31
(1.28)
2,300 3.53
(1.00)
350 0.78***
Held back a grade 0.02 0 1 9,050 0.03 2,530 0.06 390 -0.03***
Assessment Test
Motivation 3.70
(0.93)
1 5 9,580 3.52
(0.92)
2,250 3.58
(0.91)
400 -0.06
Cooperation 4.16
(0.80)
1 5 9,580 4.05
(0.80)
2,260 4.06
(0.83)
400 -0.01
Attention 3.73
(1.00)
1 5 9,580 3.53
(0.98)
2,250 3.57
(0.98)
400 -0.04
Note: Standard deviations omitted on indicator variables. Observations rounded to nearest 10 as per data
license restriction. The final column provides the results of a two sample t-test that the
means of students at Title-1 schools are significantly different from the means of students at CEP
schools. *** p<0.01, ** p<0.05, * p<0.1

53
5. EMPIRICAL SPECIFICATION
Difference-in-Difference Estimation
The effect of school-level implementation of the Community Eligibility Provision
(CEP) on individual student outcomes is estimated by a difference-in-difference (DD)
approach that compares within variation in outcomes between students at CEP schools
and students at non-CEP schools over time. The model is estimated by
𝑌𝑖𝑗𝑡 = 𝛽0 + 𝛽1𝐼(𝐶𝐸𝑃)𝑗 + 𝛽2𝐼(𝐶𝐸𝑃)𝑗 ∗ 𝑃𝑜𝑠𝑡𝑗𝑡 + 𝛽3𝑋𝑖𝑡 + 𝛽4𝑋𝑗𝑡 + 𝛽5𝐼(𝐹𝑎𝑙𝑙)𝑖𝑗𝑡 + 𝛿𝑠 + 𝛿𝑡 + 𝑒𝑖𝑗𝑡 (1)
where Yijt is the outcome of interest for student i in school j for school year t. I(CEP)j is
an indicator variable equal to one for students that attend a school j that implements the
CEP at some point during the sample. POSTjt is a binary variable that equals one in the
years a student’s school has the CEP in place. The effect of CEP implementation is
identified by the difference between the change in outcomes between students at CEP
schools, before and after CEP implementation, and the change in the outcomes of
students at non-CEP schools. The coefficient β2 on the interaction term I(CEP)j* POSTjt
estimates the effect of school-level CEP implementation on student outcomes Yijt. Xit is a
vector of individual student control variables and Xjt is a vector of individual school
control variables of school j that individual i attends during school year t. I(Fall)it is an
indicator variable that equals one when the variable is taken during the fall data
collection. δs is a vector of state fixed effects and δt is a vector of school-year fixed
effects. Finally, eijt is the idiosyncratic, time varying error term clustered at the school
district level.
54
In an ideal experiment, students’ schools would randomly be assigned the
treatment, CEP implementation, and this treatment group could be compared to the
control group over an extended period of time, both before and after CEP
implementation. While the staggered implementation across states resembles randomized
assignment on the state level in the form of a natural experiment, the pilot states were
chosen by the Food and Nutrition Service as the states with the greatest likelihood of
succeeding in the provision. Moreover, schools become eligible to implement the CEP
based on their ISP so that CEP treatment within a state is non-random. It is also important
to note that eligible schools that choose to implement the CEP are likely different from
eligible schools that choose to not implement the CEP, possibly because of different
characteristics of their student body. Recall that the sample used in the analysis does not
include all students in the pilot states. Rather, the control group is constructed narrowly,
based on school-level eligibility to implement the CEP, in order to minimize the
differences between CEP schools and non-CEP schools. For the main part of the analysis,
school level eligibility is defined by school-wide Title 1 status throughout the sample
period.
The model removes unobserved heterogeneity between students and relies on the
assumptions that the treatment (school-level CEP implementation) is exogenous and the
treatment and control group exhibit parallel trends. Previous research suggests that a
number of school-level characteristics are associated with greater probability of school-
level CEP participation (Logan et al. 2014, Harkness et al. 2015). Thus, to assist in
controlling for non-random selection into the CEP on a school level, ISP, enrollment,

55
racial composition of the student body, charter school status, and urbanicity of the school
are included as school control variables. Student-level control variables include a child’s
gender, race, parent’s income and the number of household members, as well as a
student’s eligibility to receive school meal subsidies. Because the rate of CEP
implementation among eligible schools varies greatly between the different states, it
appears likely that state differences in the implementation of the provision, for example
in providing the relevant information or advertising the CEP to eligible schools, are
additional determinants of school level CEP implementation. Therefore, state fixed
effects (δs) are included. It is important to note that this analysis does not evaluate the
impact of the meal standard updates that occur during the same time frame as CEP
implementation. The updates affect all students in the analysis equally. Therefore, this
effect is absorbed in the school-year fixed effects.
Three of the outcome variables, attention assessment, cooperation assessment and
motivation assessment are categorical variables. To address these limited dependent
variables and the fact that the impact likely varies across different categories, a panel
ordered logit model is used to estimate the impact of CEP implementation on the
outcomes of assessments of students’ attention, cooperation and motivation. For all
continuous variables, as well as for the binary outcome variable that indicates whether a
student is held back a grade, the regression models are estimated by panel ordinary least
squares.
The second part of the analysis studies the CEP impact between subsidized and
non-subsidized students. Because the effect of school-wide CEP implementation may be

56
expected to differ if a student was eligible to receive subsidized school meals before
universal free meals became available, relative to students who would have to pay full
price for meals without the CEP, the base line model is extended to a difference-in-
difference-in-difference estimation by adding the interaction terms
I(CEP)j*I(SubsidyEligible)it , I(CEP)j* POSTjt*I(SubsidyEligible)it and
I(SubsidyEligible)it *δt. Note that I(SubsidyEligible)it is included in Xit in the baseline
specification.
𝑦𝑖𝑗𝑡 = 𝛽0 + 𝛽1𝐼(𝐶𝐸𝑃)𝑗 + 𝛽2𝐼(𝐶𝐸𝑃)𝑗 ∗ 𝑃𝑜𝑠𝑡𝑗𝑡 + 𝛽3𝐼(𝑆𝑢𝑏𝑠𝑖𝑑𝑦𝐸𝑙𝑖𝑔𝑖𝑏𝑙𝑒)𝑖𝑡 ∗ 𝐼(𝐶𝐸𝑃)𝑗 +
𝛽4𝐼(𝑆𝑢𝑏𝑠𝑖𝑑𝑦𝐸𝑙𝑖𝑔𝑖𝑏𝑙𝑒)𝑖𝑡 ∗ 𝐼(𝐶𝐸𝑃)𝑗 ∗ 𝑃𝑜𝑠𝑡𝑗𝑡 + 𝛽5𝐼(𝑆𝑢𝑏𝑠𝑖𝑑𝑦𝐸𝑙𝑖𝑔𝑖𝑏𝑙𝑒)𝑖𝑡 ∗ 𝛿𝑡 + 𝛽6𝑋𝑖𝑡 +
𝛽7𝑋𝑗𝑡 + 𝛽8𝐼(𝐹𝑎𝑙𝑙)𝑖𝑗𝑡 + 𝛿𝑠 + 𝛿𝑡 + 𝑒𝑖𝑗𝑡 (2)
This specification allows an analysis on how students who were eligible to
receive subsidized school meals before the CEP was implemented are impacted by its
implementation, relative to students that would have to had paid full price for school
meals.
A sub analysis similar to the differential effect between subsidy eligible and non-
subsidy eligible students is differentiating between students that are eligible to receive
reduced-price school meals and students that are eligible to receive free school meals.
This allows for differentiation between the effect of CEP implementation on students that
previously were eligible to receive free meals and students that previously were eligible
to receive reduced meals, compared to students that did not receive any meal subsidies
prior to CEP implementation.

57
𝑦𝑖𝑗𝑡 = 𝛽0 + 𝛽1𝐼(𝐶𝐸𝑃)𝑗 + 𝛽2𝐼(𝐶𝐸𝑃)𝑗 ∗ 𝑃𝑜𝑠𝑡𝑗𝑡 + 𝛽3𝐼(𝐹𝑟𝑒𝑒𝐸𝑙𝑖𝑔𝑖𝑏𝑙𝑒)𝑖𝑡 ∗ 𝐼(𝐶𝐸𝑃)𝑗 +
𝛽4𝐼(𝐹𝑟𝑒𝑒𝐸𝑙𝑖𝑔𝑖𝑏𝑙𝑒)𝑖𝑡 ∗ 𝐼(𝐶𝐸𝑃)𝑗 ∗ 𝑃𝑜𝑠𝑡𝑗𝑡 + 𝛽5𝐼(𝐹𝑟𝑒𝑒𝐸𝑙𝑖𝑔𝑖𝑏𝑙𝑒)𝑖𝑡 ∗ 𝛿𝑡 +
𝛽6𝑅𝑒𝑑𝑢𝑐𝑒𝑑𝐸𝑙𝑖𝑔𝑖𝑏𝑙𝑒𝑖𝑡 ∗ 𝐼(𝐶𝐸𝑃)𝑗 + 𝛽7𝐼(𝑅𝑒𝑑𝑢𝑐𝑒𝑑𝐸𝑙𝑖𝑔𝑖𝑏𝑙𝑒)𝑖𝑡 ∗ 𝐼(𝐶𝐸𝑃)𝑗 ∗
𝑃𝑜𝑠𝑡𝑗𝑡 + 𝛽8𝐼(𝑅𝑒𝑑𝑢𝑐𝑒𝑑𝐸𝑙𝑖𝑔𝑖𝑏𝑙𝑒)𝑖𝑡 ∗ 𝛿𝑡 + 𝛽9𝐼(𝐹𝑎𝑙𝑙)𝑖𝑗𝑡 + 𝛽10𝑋𝑖𝑡 + 𝛽11𝑋𝑗𝑡 + 𝛿𝑠 + 𝛿𝑡 +
𝛿𝑗 + 𝑒𝑖𝑗𝑡 (3)
Difference-in-Difference-in-Difference Estimation with Control States
For robustness, a triple difference (DDD) approach is explored. The basic strategy
is to estimate the difference-in-difference estimates between the “experimented” group,
where the “experimented” group is made up of the previous model’s treatment and
control group, and a new control group, students in schools in other non-pilot states
during the sample period. In order to include students at schools of similar composition
as the CEP schools in the pilot states, students who attend a school in Texas or California
that are considered eligible to implement the CEP are included. Additionally, an indicator
variable is created for each school in Texas and California that equals one throughout the
sample if the school implements the CEP during school-year 2014-15. In other words,
this estimator compares the difference between the change in outcomes of students at
eligible, non-implementing pilot state schools and students at pilot state schools that
implement the CEP to the difference between eligible schools in Texas and California
and schools in Texas and California that implement the CEP during school year 2014-15,

58
the year following the sample period. Again, in all states school-level eligibility is
defined by school-wide Title 1 status throughout the sample period.
The difference-in-difference-in-difference model is estimated by
𝑦𝑖𝑡 = 𝛽0 + 𝛽1𝐼(𝐶𝐸𝑃)𝑗 + 𝛽2𝐼(𝐶𝐸𝑃)𝑗𝑡 ∗ 𝑃𝑖𝑙𝑜𝑡𝑗 + 𝛽3𝐼(𝐶𝐸𝑃)𝑗 ∗ 𝑃𝑖𝑙𝑜𝑡𝑗 ∗
𝑃𝑜𝑠𝑡𝑗𝑡 + 𝛽4𝐼(𝐶𝐸𝑃)𝑗 ∗ 𝛿𝑡 + 𝛽5𝐼(𝐹𝑎𝑙𝑙)𝑖𝑡 + 𝛽6𝑋𝑖𝑡 + 𝛽7𝑋𝑗𝑡 + 𝛿𝑠 + 𝛿𝑡 +
𝑒𝑖𝑡 (4)
where I(CEP)j equals one for students who attend a school that implements the CEP at
some point during the pilot period if it is in a pilot state and for students who attend a
school in Texas or California that implemented the during 2014-15 school year. All of the
variables are included as previously specified. The effect of CEP implementation on the
individual student outcomes of interest Yit is captured by the coefficient β4 on the
interaction term I(CEP)j* POSTjt* Pilotj.
This estimation strategy takes into account non-CEP factors that differentially
affect individual student outcomes at CEP schools. By including students from states that
did not implement the CEP before school year 2014-15, it can be controlled for general
trends in individual child outcome variables that are different for students at CEP schools
than for students at non-CEP schools.

59
6. RESULTS
This section discusses the results of the regressions that estimate the impact of
implementing the Community Eligibility Provision (CEP) on individual students.
Overall, this analysis does not find a significant effect on a student’s health, test scores,
teacher assessment, and behavioral assessment scores. No evidence is found that suggests
that providing all students at a school with high rates of poverty with access to free
school meals leads to improvements of these individual student outcomes.
Table 6.1 presents the main results of the analysis, corresponding to equation (1).
Each column reports the coefficients and standard errors of the dependent variables,
including all control variables, for each outcome. State and school year fixed effects are
not reported in the table. Results for the behavioral assessment outcomes are presented as
marginal effects at the median outcome, outcome 2. The first row of table 6.1 shows that
a student attending a school that implements the CEP during the pilot period is associated
with a decrease in the student’s science score, a decreased in attentional focus and
inhibitory control, and an increase in cooperation and attention, all significant at the 10
percent level. Yet, the effect during and after CEP implementation, β2 in equation (1), is
not found to be significant with respect to any of the outcomes. This suggests no
differential effect on any outcomes once the CEP is implemented.
For the results presented in table 6.1, the control group is defined as all students
who attend a school that has school-wide Title 1 in place throughout all years of the
sample. This allows for the construction of a control group that includes all students who
attend a school that is eligible to implement the CEP but does not do so. Estimations of
60
equation (1) are extended by using one of the four definitions of school-level CEP
eligibility defined in the data section. The results using the different control groups are
provided in table 6.2 and suggest no significant effect of CEP post implementation on
any of the outcomes. The differences in outcomes of students in the treatment and
students in the control group are fairly consistent across all four definitions. Table 6.2
demonstrates that the results of the difference-in-difference analysis are robust to
different definitions of the control group. Because it most narrowly defines the control
group, school-wide Title 1 status throughout the sample is being used to identify students
who attend a schools that is eligible to implement the CEP for the reminder of the
analysis.
The results presented for the behavioral assessment variables in table 6.1 are
based on redefining of the five initial categories into three categories. The median
category, in all three cases labeled as “matter of fact”, remains the median category, but
the two categories below, for example “very unmotivated” and “unmotivated”, are
grouped into one and the two categories above, “motivated” and “very motivated”, are
grouped into a third category. Redefining the categories addresses potential discrepancies
between the assessments of different students as well as low frequency of the first two
outcomes, as seen in figure 6.1. The results of the ordered logit regression with the
original five categories in comparison to the results after redefining the categories are
presented in table 6.3. Both sets of coefficients are reported as marginal effects at the
median outcome. It can be seen that the results only change slightly due to the
redefinition. In both cases, no significant effect of CEP implementation on the behavioral

61
outcomes is found. Due to the distribution of the categorical variables, the redefined
categories are used for the remainder of this analysis.
An extension of the baseline regression analysis that includes interaction terms
between I(CEP)j and school year fixed effects is presented in table 6.4. Coefficients and
standard errors are reported for the impact of being a student at a treatment school, for the
impact of CEP implementation, as well as for school year fixed effects for students of the
control and students of the treatment group. This extension allows to control for a change
in the difference between treatment and control group students’ outcomes over time. It
does not appear to lead to large changes in the results in terms of the impact of a student
attending a school that implements the CEP compared to a student attending a non-CEP
school. Yet, a statistically significant, positive effect of CEP implementation on a
student’s math score is found. No evidence is found that CEP implementation has an
effect on any of the other outcome variables.
The results of regressions using equation (2) that include interaction terms with
student eligibility to receive meal subsidies in order to differentiate between the effects of
CEP implementation on subsidy eligible versus non-eligible students are presented in the
first part of table 6.5. The second part presents the results of regressions using equation
(3) that separates subsidy eligible students into students who are eligible to receive free
meals and students who are eligible to receive reduced-price school meals. In both cases,
students at treatment schools are found to have significantly lower math test scores and
lower attentional focus. Additionally, in both cases being eligible for free school meals is
associated with a significantly lower math score and eligibility for reduced-price school

62
meals is associated with a significantly higher BMI and lower attention and attentional
focus, compared to non-subsidy eligible students. The coefficients of interest, being a
student receiving subsidized school meals post-CEP implementation, show that there is
no significant difference between subsidy eligible and non-eligible students at treatment
schools. Additionally, no significant effect of CEP implementation on students with any
subsidy eligibility status is found, relative to non-eligible students. A negative effect on
student’s cognitive flexibility test score, significant at the 10 percent level only, is found
on non-subsidy eligible students post CEP implementation. A very similar effect is found
in the second set of regressions of table 6.5. Yet again, no significant impact of CEP
implementation on outcomes of students who are eligible for free or reduced-price meals
is identified. Because non-subsidy eligible students are less likely to participate school
lunch programs before CEP implementation and are provided with an exogenous
incentive by the CEP, the effect of CEP implementation on non-subsidy eligible students
can be interpreted as the effect of school meal participation on students. This analysis
does not find an impact on students’ weight, behavioral, or academic outcomes.
The above results do not provide evidence that CEP implementation impacts
student outcomes. In particular, the results do not provide evidence that students who
were eligible for reduce-price or free school meals even before meals became available to
all students at no charge are impacted any differentially than students who experience a
sudden price decrease when the CEP is implemented. One explanation for this lack of
evidence could be that schools that implemented the CEP during the pilot period already
had a large portion of their student body qualify for federal meal subsidies. The

63
distribution of the percentage of students who are eligible for subsidized meals at schools
included in the analysis, and at CEP schools specifically, are provided in figures A.3 and
A.4 in Appendix A. At schools with high rates of subsidy eligible students, CEP
implementation may not lead to large changes in the way school meals are served.
Therefore, a bigger impact may be expected at schools with lower rates of subsidy
eligible students. One way to test this hypothesis is to estimate equation (2), omitting all
students who attend a school where all students are eligible to receive free or reduced-
price meals. Table 6.6 presents the results of the regressions. Little deviation from the
results of regression equation 2 with all students, as shown in the first part of table 6.5, is
found.
Due to limitations of the student data that do not provide an indicator variable for
whether or not a student participates in school meals for the most recent two years of the
survey, it is unknown in this analysis if a particular student participated in school meals
when the CEP was in place. Additionally, no conclusions can be reached if school meal
participation increased or if individual students choose to alter their participation decision
when the CEP is implemented. To mitigate this gap in the analysis, a variable is coded to
indicate if a student ever reported school meal participation. The first part of table 6.7
summarizes the results of a regression that estimates the impact of CEP implementation
on students who report participation at some point during the sample, compared to
students who never report school meal participation.20 First, it can be seen that meal
20For this estimation the following regression equation is used:
𝑦𝑖𝑗𝑡 = 𝛽0 + 𝛽1𝐼(𝐶𝐸𝑃)𝑗 + 𝛽2𝐼(𝐶𝐸𝑃)𝑗 ∗ 𝑃𝑜𝑠𝑡𝑗𝑡 + 𝛽3𝐼(𝑃𝑎𝑟𝑡𝑖𝑐𝑖𝑝𝑎𝑛𝑡)𝑖 ∗ 𝐼(𝐶𝐸𝑃)𝑗 + 𝛽4𝐼(𝑃𝑎𝑟𝑡𝑖𝑐𝑖𝑝𝑎𝑛𝑡)𝑖 ∗
𝐼(𝐶𝐸𝑃)𝑗 ∗ 𝑃𝑜𝑠𝑡𝑗𝑡 + 𝛽5𝐼(𝑃𝑎𝑟𝑡𝑖𝑐𝑖𝑝𝑎𝑛𝑡)𝑖 ∗ 𝛿𝑡 + 𝛽6𝑋𝑖𝑡 + 𝛽7𝑋𝑗𝑡 + 𝛽8𝐼(𝐹𝑎𝑙𝑙)𝑖𝑗𝑡 + 𝛿𝑠 + 𝛿𝑡 + 𝑒𝑖𝑗𝑡
64
participants at schools that implement the CEP are different than non-participants at CEP
schools only with regard to working memory and inhibitory control. A positive effect on
non-participating students’ memory scores and a positive effect on their likelihood to be
held back a grade, as well as a negative effect on their inhibitory control is found.
Conversely, a negative effect on participating students’ memory, their likelihood to be
held back a grade and a positive effect on their inhibitory control are observed. However,
because it is not clear if students who did not report school meal participation at the
beginning of the survey in fact choose to participate at a later point, or possibly even due
to CEP implementation, these results need to be interpreted with caution. Instead, the
second part of table 6.7 shows a summary of results for regression equation 2, where only
students who report school meal participation are included. While some slight differences
to the initial results, as reported in table 6.5 can be observed, no significant impact of
CEP implementation on non-subsidy eligible, and only a negative effect on the attention
assessment of subsidy eligible children can be observed.
Lastly, table 6.8 summarizes the results of regression equation 4, the difference-
in-difference-in-difference estimation. Students who attend a school that implements the
CEP in the pilot states and in Texas or California have significantly lower reading, math
and science scores, are more likely to be held back a grade, but have a better attention
assessment than students at similar non-CEP schools. Students at schools that implement
the CEP in the pilot states are not found to be significantly different from students at
schools in California or Texas that implement the CEP in 2014-15. Equivalent to the
65
findings from the results of the difference-in-difference models used in this analysis, no
significant effect of CEP implementation on any of the student outcomes is found.
Overall, the analyses do not find significant effects of CEP implementation on
student outcomes, regardless of specification or control group. While a small number of
coefficients throughout the analyses seem to point to some effects, none are consistently
significant, thus little weight is put on them. However, it can be noted that almost none
point to positive impacts of CEP implementation. The lack of evidence may reflect the
small treatment group used in this analysis or the short time span of the analysis,
especially if CEP implementation does not have an immediate impact. Further analysis
using a larger and longer dataset data set may or may not find positive impacts.
Policy Implications
The CEP was established as a tool to allow schools with students in need to
provide universally free school meals to combat issues of malnourishment that are likely
highly related to children’s health, academic and behavioral performance. Yet, as
discussed in chapter 3 of this thesis, it appears unlikely that schools benefit financially
from implementation, even when potential administrative cost savings are considered.
Low take-up rates among eligible schools suggest may be explained by the financial
impact on schools and suggest that decision makers are aware of the limitations of the
CEP. Furthermore, this policy leads to increased federal reimbursement to participating
schools, potentially increasing the cost of the National School Lunch Program (NSLP)
and School Breakfast Program (SBP) significantly if take-up among eligible schools

66
continues to increase over time. While the intended benefits to students, improved meal
access and better nourishment, as well as decreased stigma associated with universally
free school meals are straight forward, previous research on the impact of school meal
participation on student outcomes has found ambiguous effects and indicates that
precaution should be taken in jumping to conclusions about the benefits of universal
school meal participation.
This analysis suggests that no statistically significant improvements in students’
weight, test scores, or behaviors are achieved by expanding free meal access to all
students at a school with high rates of poverty. It provides no support for the theory that
students who are eligible for subsidized school meals before CEP implementation benefit
from it as it reduces segmentation of the student body, social stigma, and administrative
barriers associated with subsidized school meals. Additionally, no effect is found on
students who do not qualify for subsidized meals and may not self-select into school meal
programs before CEP implementation. Because these students are provided with
incentive to participate in school meals by the CEP, this result suggests that school meal
participation does not impact students health, behavior, and academics. Overall, this
thesis indicates that there is a lack of return in investment, at least in the short term, if
students in fact are not impacted by implementation of this policy.
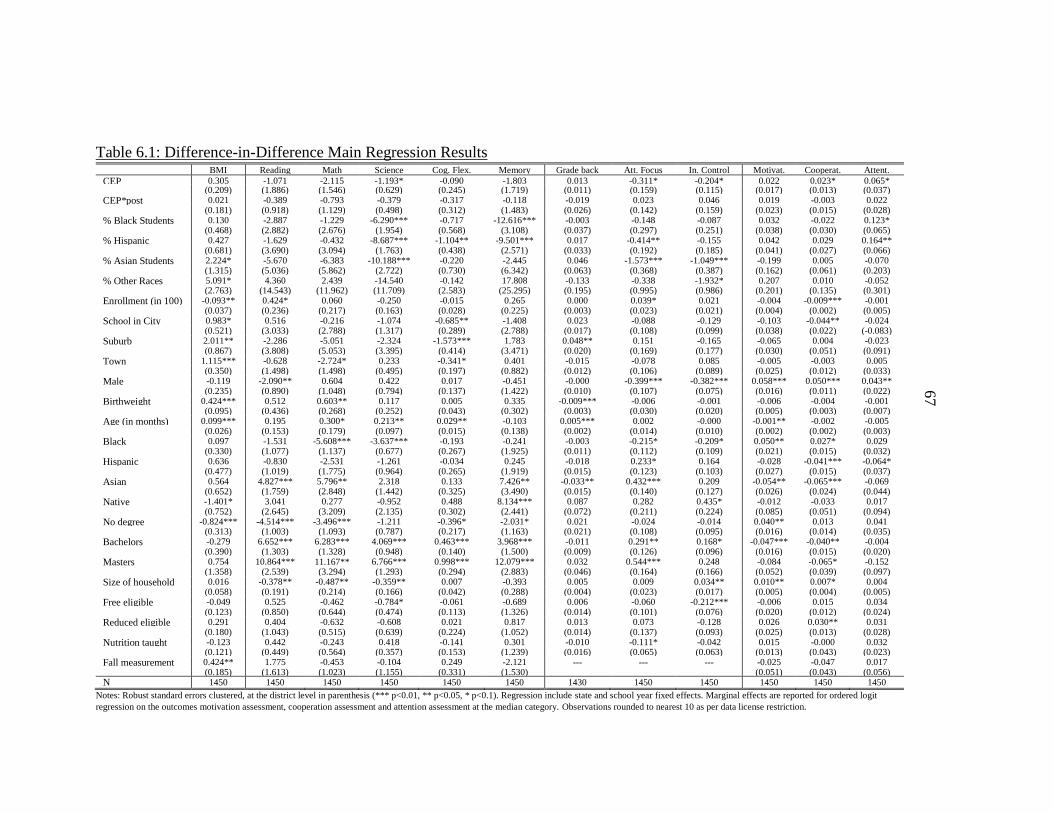
Table 6.1: Difference-in-Difference Main Regression Results BMI Reading Math Science Cog. Flex. Memory Grade back Att. Focus In. Control Motivat. Cooperat. Attent.
CEP
0.305 -1.071 -2.115 -1.193* -0.090 -1.803 0.013 -0.311* -0.204* 0.022 0.023* 0.065* (0.209) (1.886) (1.546) (0.629) (0.245) (1.719) (0.011) (0.159) (0.115) (0.017) (0.013) (0.037)
CEP*post 0.021 -0.389 -0.793 -0.379 -0.317 -0.118 -0.019 0.023 0.046 0.019 -0.003 0.022 (0.181) (0.918) (1.129) (0.498) (0.312) (1.483) (0.026) (0.142) (0.159) (0.023) (0.015) (0.028)
% Black Students 0.130 -2.887 -1.229 -6.290*** -0.717 -12.616*** -0.003 -0.148 -0.087 0.032 -0.022 0.123* (0.468) (2.882) (2.676) (1.954) (0.568) (3.108) (0.037) (0.297) (0.251) (0.038) (0.030) (0.065)
% Hispanic
Students
0.427 -1.629 -0.432 -8.687*** -1.104** -9.501*** 0.017 -0.414** -0.155 0.042 0.029 0.164** (0.681) (3.690) (3.094) (1.763) (0.438) (2.571) (0.033) (0.192) (0.185) (0.041) (0.027) (0.066)
% Asian Students 2.224* -5.670 -6.383 -10.188*** -0.220 -2.445 0.046 -1.573*** -1.049*** -0.199 0.005 -0.070 (1.315) (5.036) (5.862) (2.722) (0.730) (6.342) (0.063) (0.368) (0.387) (0.162) (0.061) (0.203)
% Other Races 5.091* 4.360 2.439 -14.540 -0.142 17.808 -0.133 -0.338 -1.932* 0.207 0.010 -0.052 (2.763) (14.543) (11.962) (11.709) (2.583) (25.295) (0.195) (0.995) (0.986) (0.201) (0.135) (0.301)
Enrollment (in 100) -0.093** 0.424* 0.060 -0.250 -0.015 0.265 0.000 0.039* 0.021 -0.004 -0.009*** -0.001 (0.037) (0.236) (0.217) (0.163) (0.028) (0.225) (0.003) (0.023) (0.021) (0.004) (0.002) (0.005)
School in City 0.983* 0.516 -0.216 -1.074 -0.685** -1.408 0.023 -0.088 -0.129 -0.103 -0.044** -0.024 (0.521) (3.033) (2.788) (1.317) (0.289) (2.788) (0.017) (0.108) (0.099) (0.038) (0.022) (-0.083)
Suburb 2.011** -2.286 -5.051 -2.324 -1.573*** 1.783 0.048** 0.151 -0.165 -0.065 0.004 -0.023 (0.867) (3.808) (5.053) (3.395) (0.414) (3.471) (0.020) (0.169) (0.177) (0.030) (0.051) (0.091)
Town 1.115*** -0.628 -2.724* 0.233 -0.341* 0.401 -0.015 -0.078 0.085 -0.005 -0.003 0.005 (0.350) (1.498) (1.498) (0.495) (0.197) (0.882) (0.012) (0.106) (0.089) (0.025) (0.012) (0.033)
Male -0.119 -2.090** 0.604 0.422 0.017 -0.451 -0.000 -0.399*** -0.382*** 0.058*** 0.050*** 0.043** (0.235) (0.890) (1.048) (0.794) (0.137) (1.422) (0.010) (0.107) (0.075) (0.016) (0.011) (0.022)
Birthweight 0.424*** 0.512 0.603** 0.117 0.005 0.335 -0.009*** -0.006 -0.001 -0.006 -0.004 -0.001 (0.095) (0.436) (0.268) (0.252) (0.043) (0.302) (0.003) (0.030) (0.020) (0.005) (0.003) (0.007)
Age (in months) 0.099*** 0.195 0.300* 0.213** 0.029** -0.103 0.005*** 0.002 -0.000 -0.001** -0.002 -0.005 (0.026) (0.153) (0.179) (0.097) (0.015) (0.138) (0.002) (0.014) (0.010) (0.002) (0.002) (0.003)
Black 0.097 -1.531 -5.608*** -3.637*** -0.193 -0.241 -0.003 -0.215* -0.209* 0.050** 0.027* 0.029 (0.330) (1.077) (1.137) (0.677) (0.267) (1.925) (0.011) (0.112) (0.109) (0.021) (0.015) (0.032)
Hispanic 0.636 -0.830 -2.531 -1.261 -0.034 0.245 -0.018 0.233* 0.164 -0.028 -0.041*** -0.064* (0.477) (1.019) (1.775) (0.964) (0.265) (1.919) (0.015) (0.123) (0.103) (0.027) (0.015) (0.037)
Asian 0.564 4.827*** 5.796** 2.318 0.133 7.426** -0.033** 0.432*** 0.209 -0.054** -0.065*** -0.069 (0.652) (1.759) (2.848) (1.442) (0.325) (3.490) (0.015) (0.140) (0.127) (0.026) (0.024) (0.044)
Native -1.401* 3.041 0.277 -0.952 0.488 8.134*** 0.087 0.282 0.435* -0.012 -0.033 0.017 (0.752) (2.645) (3.209) (2.135) (0.302) (2.441) (0.072) (0.211) (0.224) (0.085) (0.051) (0.094)
No degree -0.824*** -4.514*** -3.496*** -1.211 -0.396* -2.031* 0.021 -0.024 -0.014 0.040** 0.013 0.041 (0.313) (1.003) (1.093) (0.787) (0.217) (1.163) (0.021) (0.108) (0.095) (0.016) (0.014) (0.035)
Bachelors -0.279 6.652*** 6.283*** 4.069*** 0.463*** 3.968*** -0.011 0.291** 0.168* -0.047*** -0.040** -0.004 (0.390) (1.303) (1.328) (0.948) (0.140) (1.500) (0.009) (0.126) (0.096) (0.016) (0.015) (0.020)
Masters 0.754 10.864*** 11.167**
*
6.766*** 0.998*** 12.079*** 0.032 0.544*** 0.248 -0.084 -0.065* -0.152 (1.358) (2.539) (3.294) (1.293) (0.294) (2.883) (0.046) (0.164) (0.166) (0.052) (0.039) (0.097)
Size of household 0.016 -0.378** -0.487** -0.359** 0.007 -0.393 0.005 0.009 0.034** 0.010** 0.007* 0.004 (0.058) (0.191) (0.214) (0.166) (0.042) (0.288) (0.004) (0.023) (0.017) (0.005) (0.004) (0.005)
Free eligible -0.049 0.525 -0.462 -0.784* -0.061 -0.689 0.006 -0.060 -0.212*** -0.006 0.015 0.034 (0.123) (0.850) (0.644) (0.474) (0.113) (1.326) (0.014) (0.101) (0.076) (0.020) (0.012) (0.024)
Reduced eligible 0.291 0.404 -0.632 -0.608 0.021 0.817 0.013 0.073 -0.128 0.026 0.030** 0.031 (0.180) (1.043) (0.515) (0.639) (0.224) (1.052) (0.014) (0.137) (0.093) (0.025) (0.013) (0.028)
Nutrition taught -0.123 0.442 -0.243 0.418 -0.141 0.301 -0.010 -0.111* -0.042 0.015 -0.000 0.032 (0.121) (0.449) (0.564) (0.357) (0.153) (1.239) (0.016) (0.065) (0.063) (0.013) (0.043) (0.023)
Fall measurement 0.424** 1.775 -0.453 -0.104 0.249 -2.121 --- --- --- -0.025 -0.047 0.017 (0.185) (1.613) (1.023) (1.155) (0.331) (1.530) (0.051) (0.043) (0.056) N 1450 1450 1450 1450 1450 1450 1430 1450 1450 1450 1450 1450
Notes: Robust standard errors clustered, at the district level in parenthesis (*** p<0.01, ** p<0.05, * p<0.1). Regression include state and school year fixed effects. Marginal effects are reported for ordered logit
regression on the outcomes motivation assessment, cooperation assessment and attention assessment at the median category. Observations rounded to nearest 10 as per data license restriction.
67

Table 6.2: Difference-in-Difference Regression Results with Different Control Groups Health Test Scores Teacher Assessment Behavioral Assessment
Variable BMI Reading Math Science Cognitive
Flexibility
Working
Memory
Grade
back
Attentional
Focus
Inhibitory
Control
Motiva-
tion
Coopera-
tion
Atten-
tion
Control group: Students at non-CEP schools that have school-wide Title 1 Status throughout sample.
CEP 0.305 -1.071 -2.115 -1.193* -0.090 -1.803 0.013 -0.311* -0.204* 0.022 0.023* 0.065*
(0.209) (1.886) (1.546) (0.629) (0.245) (1.719) (0.011) (0.159) (0.115) (0.017) (0.013) (0.037)
CEP*post 0.021 -0.389 -0.793 -0.379 -0.317 -0.118 -0.019 0.023 0.046 0.019 -0.003 0.022
(0.181) (0.918) (1.129) (0.498) (0.312) (1.483) (0.026) (0.142) (0.159) (0.023) (0.015) (0.028)
N 1450 1450 1450 1450 1450 1450 1430 1450 1450 1450 1450 1450
Control group: Students at non-CEP schools with Proxy ISP greater than 40 percent.
CEP 0.232 -1.814 -2.127* -1.514*** -0.049 -1.055 0.018 -0.257* -0.178 0.004 0.027 0.016
(0.187) (1.247) (1.221) (0.454) (0.227) (1.397) (0.015) (0.148) (0.123) (0.017) (0.032) (0.016)
CEP*post -0.077 -0.637 -0.803 0.096 -0.300 -0.702 -0.013 -0.016 0.004 0.005 0.030 -0.012
(0.187) (0.987) (1.068) (0.442) (0.304) (1.388) (0.024) (0.150) (0.158) (0.020) (0.023) (0.014)
N 1970 1980 1980 1970 1970 1980 1950 1970 1970 1980 1980 1980
Control group: Students at non-CEP schools that have school-wide Title 1 Status for at least one year of sample.
CEP 0.137 -1.760 -2.137 -1.124** 0.039 -1.087 0.015 -0.218 -0.185 0.011 0.037 0.024
(0.205) (1.467) (1.411) (0.540) (0.244) (1.472) (0.013) (0.144) (0.123) (0.016) (0.029) (0.016)
CEP*post 0.121 -1.006 -1.266 -0.472 -0.261 -0.399 -0.014 -0.031 0.013 0.025 0.029 0.007
(0.192) (1.038) (1.003) (0.426) (0.333) (1.454) (0.024) (0.139) (0.154) (0.020) (0.025) (0.016)
N 2840 2840 2840 2830 2830 2840 2800 2830 2830 2850 2850 2850
Control group: Students at non-CEP schools with Proxy ISP greater than minimum Proxy ISP of all CEP schools in state.
CEP 0.097 -2.625* -2.949** -1.173** -0.106 -1.536 0.015 -0.286* -0.208* 0.021 0.052 0.042**
(0.224) (1.484) (1.344) (0.498) (0.271) (1.559) (0.014) (0.162) (0.122) (0.020) (0.032) (0.018)
CEP*post 0.159 -0.654 -1.227 -0.521 -0.124 -0.572 -0.015 -0.008 0.040 0.020 0.018 0.006
(0.193) (1.039) (0.950) (0.441) (0.346) (1.418) (0.026) (0.136) (0.151) (0.022) (0.025) (0.019)
N 3100 3120 3110 3100 3100 3110 3070 3100 3100 3120 3120 3120
Notes: Robust standard errors, clustered at the district level in parenthesis (*** p<0.01, ** p<0.05, * p<0.1). Regression include full set of control
variables, state and school year fixed effects. Marginal effects are reported for ordered logit regression on the outcomes motivation assessment,
cooperation assessment and attention assessment at the median category. Observations rounded to nearest 10 as per data license restriction.
68

69
Figure 6.1: Distribution of Assessment of Student Cooperation, Motivation and Attention
The figures show the distribution of the three categorical, behavior assessment variables that are included
in the analysis as outcome variables. Because of their distribution, the main results in this analysis rely on
redefinition of the five categories into three categories, so for example “unmotivated”, “matter of fact”, and
“motivated”.
Table 6.3: Impact of Redefining Categories on Ordered Logit Regression Results
Dependent
Variable Motivation Cooperation Attention Motivation Cooperation Attention
CEP 0.022 0.023* 0.065* 0.025 0.046* 0.024
(0.017) (0.013) (0.037) (0.016) (0.026) (0.014)
CEP*post 0.019 -0.003 0.022 0.015 0.039 0.006
(0.023) (0.015) (0.028) (0.022) (0.027) (0.017)
N 1450 1450 1450 1450 1450 1450
Notes: Robust standard errors, clustered at the district level in parenthesis (*** p<0.01, ** p<0.05, *
p<0.1). Regressions include full set of control variables, state and school year fixed effects. Marginal
effects are reported for ordered logit regression at the median category.
Categories are assigned as unmotivated=1, unmotivated=2, matter of fact=3, motivated=4, and very
motivated=5 for the first three columns, and as very unmotivated and unmotivated=1, matter of fact=2,
motivated and very motivated=3 for the last three columns.
Observations rounded to nearest 10 as per data license restriction.

Table 6.4: Difference-in-Difference Regression Results with Treatment and Control Group Specific Year Fixed Effects Health Test Scores Teacher Assessment Behavioral Assessment
BMI Reading Math Science Cognitive
Flexibility
Working
Memory
Grade
back
Attention-
al Focus
Inhibitory
Control
Motiva-
tion
Coopera-
tion
Atten-
tion
CEP 0.155 -0.095 -1.006 -0.788 -0.046 -0.145 0.038 -0.379** -0.212 0.013 0.086** 0.035***
(0.196) (1.543) (1.349) (0.670) (0.292) (2.004) (0.026) (0.157) (0.136) (0.021) (0.039) (0.013)
CEP*post -0.344 1.562 2.218*** 0.451 -0.384 1.805 -0.005 -0.118 -0.159 -0.014 0.011 -0.004
(0.321) (1.155) (0.631) (0.534) (0.334) (1.463) (0.015) (0.159) (0.143) (0.021) (0.031) (0.016)
CEP*11 0.187 0.340 -0.229 -0.143 -0.016 -2.939* -0.050 0.128 -0.078 -0.009 -0.070 -0.047*
(0.195) (1.910) (1.115) (0.686) (0.369) (1.525) (0.036) (0.210) (0.201) (0.036) (0.064) (0.027)
CEP*12 0.316 -5.106*** -4.101** -1.575 -0.273 -3.344* -0.052 0.083 0.054 0.055* -0.040 0.008
(0.322) (1.607) (1.612) (1.022) (0.452) (1.745) (0.038) (0.214) (0.148) (0.031) (0.048) (0.021)
CEP*13 0.714 -2.286 -4.910** -1.269 0.200 -4.102** -0.032 0.310 0.365 0.049* 0.018 -0.016
(0.485) (1.605) (1.990) (1.096) (0.496) (2.079) (0.054) (0.314) (0.240) (0.030) (0.044) (0.026)
2011 -0.333 22.904*** 18.788*** 5.818*** 0.825** 2.727 -0.099*** -0.074 0.037 -0.051 0.014 -0.004
(0.376) (1.989) (2.746) (1.430) (0.402) (2.981) (0.034) (0.156) (0.157) (0.032) (0.037) (0.028)
2012 -0.552 34.996*** 30.583*** 11.995*** -8.651*** 2.936 -0.161*** -1.502*** -1.383*** -0.036 0.058 0.019
(0.655) (3.368) (4.782) (2.590) (0.553) (4.472) (0.056) (0.339) (0.268) (0.072) (0.078) (0.048)
2013 -1.915* 36.405*** 36.669*** 15.813*** -8.974*** 12.807** -0.187** -1.645*** -1.483*** -0.037 0.146 0.017
(1.089) (6.291) (7.450) (4.603) (0.668) (5.953) (0.091) (0.572) (0.433) (0.099) (0.107) (0.070)
N 1450 1450 1450 1450 1450 1450 1430 1450 1450 1450 1450 1450
Notes: Robust standard errors, clustered at the district level in parenthesis (*** p<0.01, ** p<0.05, * p<0.1). Regressions include full set of control
variables, state and school year fixed effects. Marginal effects are reported for ordered logit regression on the outcomes motivation assessment,
cooperation assessment and attention assessment at the median category. Observations rounded to nearest 10 as per data license restriction.
70
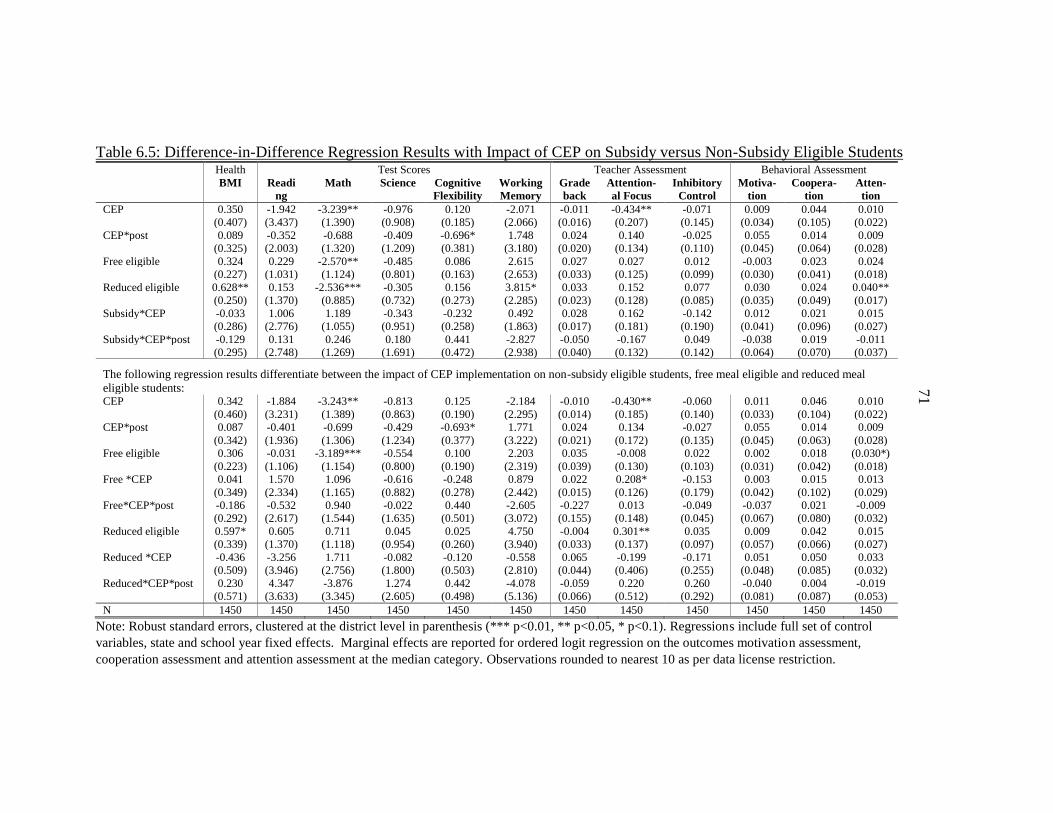
Table 6.5: Difference-in-Difference Regression Results with Impact of CEP on Subsidy versus Non-Subsidy Eligible Students Health Test Scores Teacher Assessment Behavioral Assessment
BMI Readi
ng
Math Science Cognitive
Flexibility
Working
Memory
Grade
back
Attention-
al Focus
Inhibitory
Control
Motiva-
tion
Coopera-
tion
Atten-
tion
CEP 0.350 -1.942 -3.239** -0.976 0.120 -2.071 -0.011 -0.434** -0.071 0.009 0.044 0.010
(0.407) (3.437) (1.390) (0.908) (0.185) (2.066) (0.016) (0.207) (0.145) (0.034) (0.105) (0.022)
CEP*post 0.089 -0.352 -0.688 -0.409 -0.696* 1.748 0.024 0.140 -0.025 0.055 0.014 0.009
(0.325) (2.003) (1.320) (1.209) (0.381) (3.180) (0.020) (0.134) (0.110) (0.045) (0.064) (0.028)
Free eligible 0.324 0.229 -2.570** -0.485 0.086 2.615 0.027 0.027 0.012 -0.003 0.023 0.024
(0.227) (1.031) (1.124) (0.801) (0.163) (2.653) (0.033) (0.125) (0.099) (0.030) (0.041) (0.018)
Reduced eligible 0.628** 0.153 -2.536*** -0.305 0.156 3.815* 0.033 0.152 0.077 0.030 0.024 0.040**
(0.250) (1.370) (0.885) (0.732) (0.273) (2.285) (0.023) (0.128) (0.085) (0.035) (0.049) (0.017)
Subsidy*CEP -0.033 1.006 1.189 -0.343 -0.232 0.492 0.028 0.162 -0.142 0.012 0.021 0.015
(0.286) (2.776) (1.055) (0.951) (0.258) (1.863) (0.017) (0.181) (0.190) (0.041) (0.096) (0.027)
Subsidy*CEP*post -0.129 0.131 0.246 0.180 0.441 -2.827 -0.050 -0.167 0.049 -0.038 0.019 -0.011
(0.295) (2.748) (1.269) (1.691) (0.472) (2.938) (0.040) (0.132) (0.142) (0.064) (0.070) (0.037)
The following regression results differentiate between the impact of CEP implementation on non-subsidy eligible students, free meal eligible and reduced meal
eligible students: CEP 0.342 -1.884 -3.243** -0.813 0.125 -2.184 -0.010 -0.430** -0.060 0.011 0.046 0.010
(0.460) (3.231) (1.389) (0.863) (0.190) (2.295) (0.014) (0.185) (0.140) (0.033) (0.104) (0.022)
CEP*post 0.087 -0.401 -0.699 -0.429 -0.693* 1.771 0.024 0.134 -0.027 0.055 0.014 0.009
(0.342) (1.936) (1.306) (1.234) (0.377) (3.222) (0.021) (0.172) (0.135) (0.045) (0.063) (0.028)
Free eligible 0.306 -0.031 -3.189*** -0.554 0.100 2.203 0.035 -0.008 0.022 0.002 0.018 (0.030*)
(0.223) (1.106) (1.154) (0.800) (0.190) (2.319) (0.039) (0.130) (0.103) (0.031) (0.042) (0.018)
Free *CEP 0.041 1.570 1.096 -0.616 -0.248 0.879 0.022 0.208* -0.153 0.003 0.015 0.013
(0.349) (2.334) (1.165) (0.882) (0.278) (2.442) (0.015) (0.126) (0.179) (0.042) (0.102) (0.029)
Free*CEP*post -0.186 -0.532 0.940 -0.022 0.440 -2.605 -0.227 0.013 -0.049 -0.037 0.021 -0.009
(0.292) (2.617) (1.544) (1.635) (0.501) (3.072) (0.155) (0.148) (0.045) (0.067) (0.080) (0.032)
Reduced eligible 0.597* 0.605 0.711 0.045 0.025 4.750 -0.004 0.301** 0.035 0.009 0.042 0.015
(0.339) (1.370) (1.118) (0.954) (0.260) (3.940) (0.033) (0.137) (0.097) (0.057) (0.066) (0.027)
Reduced *CEP -0.436 -3.256 1.711 -0.082 -0.120 -0.558 0.065 -0.199 -0.171 0.051 0.050 0.033
(0.509) (3.946) (2.756) (1.800) (0.503) (2.810) (0.044) (0.406) (0.255) (0.048) (0.085) (0.032)
Reduced*CEP*post 0.230 4.347 -3.876 1.274 0.442 -4.078 -0.059 0.220 0.260 -0.040 0.004 -0.019
(0.571) (3.633) (3.345) (2.605) (0.498) (5.136) (0.066) (0.512) (0.292) (0.081) (0.087) (0.053)
N 1450 1450 1450 1450 1450 1450 1450 1450 1450 1450 1450 1450
Note: Robust standard errors, clustered at the district level in parenthesis (*** p<0.01, ** p<0.05, * p<0.1). Regressions include full set of control
variables, state and school year fixed effects. Marginal effects are reported for ordered logit regression on the outcomes motivation assessment,
cooperation assessment and attention assessment at the median category. Observations rounded to nearest 10 as per data license restriction.
71
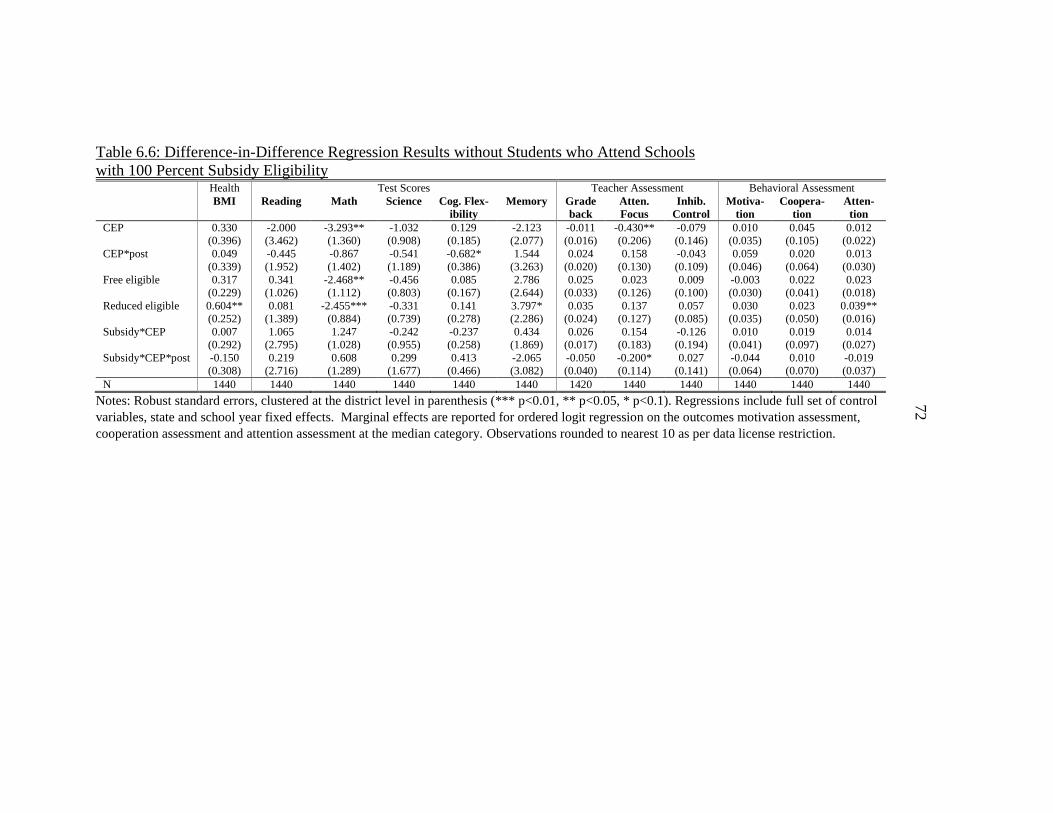
Table 6.6: Difference-in-Difference Regression Results without Students who Attend Schools
with 100 Percent Subsidy Eligibility Health Test Scores Teacher Assessment Behavioral Assessment
BMI Reading Math Science Cog. Flex-
ibility
Memory Grade
back
Atten.
Focus
Inhib.
Control
Motiva-
tion
Coopera-
tion
Atten-
tion
CEP 0.330 -2.000 -3.293** -1.032 0.129 -2.123 -0.011 -0.430** -0.079 0.010 0.045 0.012
(0.396) (3.462) (1.360) (0.908) (0.185) (2.077) (0.016) (0.206) (0.146) (0.035) (0.105) (0.022)
CEP*post 0.049 -0.445 -0.867 -0.541 -0.682* 1.544 0.024 0.158 -0.043 0.059 0.020 0.013
(0.339) (1.952) (1.402) (1.189) (0.386) (3.263) (0.020) (0.130) (0.109) (0.046) (0.064) (0.030)
Free eligible 0.317 0.341 -2.468** -0.456 0.085 2.786 0.025 0.023 0.009 -0.003 0.022 0.023
(0.229) (1.026) (1.112) (0.803) (0.167) (2.644) (0.033) (0.126) (0.100) (0.030) (0.041) (0.018)
Reduced eligible 0.604** 0.081 -2.455*** -0.331 0.141 3.797* 0.035 0.137 0.057 0.030 0.023 0.039**
(0.252) (1.389) (0.884) (0.739) (0.278) (2.286) (0.024) (0.127) (0.085) (0.035) (0.050) (0.016)
Subsidy*CEP 0.007 1.065 1.247 -0.242 -0.237 0.434 0.026 0.154 -0.126 0.010 0.019 0.014
(0.292) (2.795) (1.028) (0.955) (0.258) (1.869) (0.017) (0.183) (0.194) (0.041) (0.097) (0.027)
Subsidy*CEP*post -0.150 0.219 0.608 0.299 0.413 -2.065 -0.050 -0.200* 0.027 -0.044 0.010 -0.019
(0.308) (2.716) (1.289) (1.677) (0.466) (3.082) (0.040) (0.114) (0.141) (0.064) (0.070) (0.037)
N 1440 1440 1440 1440 1440 1440 1420 1440 1440 1440 1440 1440
Notes: Robust standard errors, clustered at the district level in parenthesis (*** p<0.01, ** p<0.05, * p<0.1). Regressions include full set of control
variables, state and school year fixed effects. Marginal effects are reported for ordered logit regression on the outcomes motivation assessment,
cooperation assessment and attention assessment at the median category. Observations rounded to nearest 10 as per data license restriction.
72

Table 6.7: Difference-in-Difference Regression Results with Impact of CEP on Meal Participating versus Non-Participating
Students Health Test Scores Teacher Assessment Behavioral Assessment
BMI Reading Math Science Cognitive
Flexibility
Working
Memory
Grade
back
Attention-
al Focus
Inhibitory
Control
Motiva-
tion
Coopera-
tion
Atten-
tion
The following regression results differentiate between the impact of CEP implementation on students who report school meal consumption and the impact on students who do
not report school meal consumption.
CEP 0.276 1.282 -1.511 -2.709** 0.213 -2.741 0.011 0.688** 0.986*** 0.103* 0.119 0.030
(0.915) (4.160) (3.234) (1.337) (0.462) (4.783) (0.029) (0.334) (0.376) (0.056) (0.097) (0.030)
CEP*post -0.343 -4.479 -0.409 1.436 -0.230 6.549** -0.127** -0.446 -0.598* -0.003 0.029 0.007
(0.416) (3.600) (1.212) (1.226) (0.406) (2.741) (0.059) (0.419) (0.345) (0.065) (0.074) (0.034)
Meal 0.583 -1.591 -0.041 -0.383 0.495 0.568 0.012 -0.186 -0.203 0.045 0.056 -0.010
Participant (0.368) (1.982) (2.357) (1.106) (0.606) (2.441) (0.019) (0.176) (0.174) (0.043) (0.090) (0.030)
Participant -0.099 -3.150 -1.191 1.381 -0.447 -0.670 -0.001 -1.063*** -1.273*** -0.086 -0.051 -0.006
*CEP (0.930) (3.844) (3.563) (1.532) (0.569) (4.635) (0.023) (0.386) (0.383) (0.062) (0.090) (0.036)
Participant 0.382 4.784 -0.587 -2.417 -0.017 -6.485** 0.138** 0.459 0.706* 0.022 -0.021 -0.016
*CEP*post (0.594) (3.975) (1.485) (1.477) (0.498) (2.998) (0.055) (0.453) (0.396) (0.084) (0.080) (0.050)
N 1330 1330 1330 1330 1330 1330 1310 1330 1330 1330 1330 1330
Only students who reported participation in school meals at some point of sample were included in the following regression:
CEP 0.177 -3.563 -3.112* -0.306 -0.013 -3.913** -0.014 -0.706*** -0.297 0.001 0.075 0.024
(0.504) (3.189) (1.656) (1.206) (0.347) (1.911) (0.014) (0.212) (0.246) (0.034) (0.129) (0.029)
CEP*post 0.437 2.231 -0.891 -1.014 -0.641 2.395 0.056*** 0.322** 0.148 0.055 -0.067 -0.013
(0.552) (1.777) (1.725) (1.305) (0.488) (2.862) (0.020) (0.138) (0.120) (0.047) (0.104) (0.036)
Free Eligible 0.366* 1.261 -1.906 -0.616 0.001 2.701 0.043 0.038 0.029 -0.005 -0.008 0.014
(0.210) (0.999) (1.340) (0.971) (0.166) (2.949) (0.031) (0.149) (0.120) (0.027) (0.040) (0.019)
Reduced Elig 0.709*** 0.754 -2.154* -0.721 0.061 3.717 0.038 0.132 0.029 0.031 -0.016 0.025
(0.219) (1.087) (1.190) (0.920) (0.281) (2.549) (0.024) (0.129) (0.106) (0.032) (0.051) (0.020)
Subsidy*CEP 1.247 -0.828 -0.084 2.117 0.009 -0.018 0.045 1.247 -0.828 -0.003 0.028* 0.379*
(1.458) (1.127) (0.397) (1.626) (0.041) (0.125) (0.300) (1.458) (1.127) (0.036) (0.016) (0.215)
Subsidy 0.364 0.616 0.364 -4.169 -0.035 0.112 -0.083 0.364 0.616 0.016 -0.070 -0.327**
*CEP*post (1.926) (1.701) (0.582) (2.797) (0.066) (0.117) (0.208) (1.926) (1.701) (0.051) (0.046) (0.156)
N 1260 1270 1260 1260 1260 1260 1250 1260 1260 1270 1270 1270
Notes: Robust standard errors, clustered at the district level in parenthesis (*** p<0.01, ** p<0.05, * p<0.1). Regressions include full set of control
variables, state and school year fixed effects. Marginal effects are reported for ordered logit regression on the outcomes motivation assessment,
cooperation assessment and attention assessment at the median category. Observations rounded to nearest 10 as per data license restriction.
73

Table 6.8: Difference-in-Difference-in-Difference Regression Results Health Test Scores Teacher Assessment Behavioral Assessment
BMI Reading Math Science Cognitive
Flexibility
Working
Memory
Grade
back
Attention-
al Focus
Inhibitory
Control
Motiva-
tion
Coopera-
tion
Atten-
tion
CEP 0.502* -2.070** -2.128** -1.310* 0.082 -0.745 0.026** -0.105 -0.134 -0.269 0.029 0.032** (0.266) (0.865) (1.011) (0.751) (0.118) (1.325) (0.011) (0.077) (0.089) (0.179) (0.020) (0.013) CEP*pilot -0.191 0.879 1.410 0.892 0.048 0.216 -0.018 -0.194 -0.115 -0.293 0.032 0.009 (0.358) (2.027) (1.923) (1.044) (0.302) (2.352) (0.017) (0.175) (0.143) (0.354) (0.038) (0.022) CEP*pilot*post -0.013 -0.317 -1.556 -0.425 -0.330 -1.057 -0.027 -0.039 -0.023 -0.086 0.009 -0.031 (0.223) (1.130) (1.128) (0.348) (0.325) (1.373) (0.023) (0.154) (0.149) (0.228) (0.025) (0.019)
N 5080 5080 5070 5000 5060 5080 4980 5040 5050 5090 5090 5090
Notes: Robust standard errors, clustered at the district level in parenthesis (*** p<0.01, ** p<0.05, * p<0.1). Regressions include full set of control
variables, state and school year fixed effects. Marginal effects are reported for ordered logit regression on the outcomes motivation assessment,
cooperation assessment and attention assessment at the median category. Observations rounded to nearest 10 as per data license restriction.
74

75
8. CONCLUSION
The Community Eligibility Provision was made available to schools and school
districts with a large percentage of students who are eligible for subsidized school meals.
If an eligible district or school implements the provision, it is required to provide
breakfast and lunch to all students at no charge. While implementation of the provision
may lead to some administrative cost savings associated with reduced processing of
household applications for meal subsidies, this analysis finds that a school’s meal service
is unlikely to financially benefit from implementation, unless a substantial portion of
subsidy eligible students does not participate in the school meals.
This analysis uses a difference-in-difference model, as well as a triple difference
model to estimate the impact of CEP implementation on students’ health, test scores, and
behavior. Additionally, it estimates the effect on students who are eligible to receive
subsidized school meals, regardless of the school’s CEP status, compared to non-subsidy
eligible students. The CEP is intended to positively impact student outcomes by
increasing participation among non-subsidy eligible students through a decrease in price,
and by increasing participation among subsidy eligible students through reductions in the
burden to apply and in stigma associated with subsidized meal participation. Yet, while
previous literature has well established that school meal participants typically perform
worse with respect to health, academics and behavior, it is not clear that participation
increases, especially in the school lunch program, inevitably benefit students. This
analysis looks at the impact of the CEP as a cumulative, regardless of a student’s
participation status in school meals.

76
No statistically significant impact is found on any of the student outcomes,
suggesting that there may be a lack of return in investment to schools. This findings offer
an explanation for low take-up rates among eligible schools. Additionally, no evidence is
found that students who were eligible for school meal subsidies before the CEP was
implemented are impacted any differently than students who paid full-price. The lack of
evidence that there is an impact on non-subsidy eligible students provides indication for
how students who traditionally do not self-select into school meal programs are affected
by participation. It strengthens the findings of Leos-Urbel et al. (2003) who does not find
an impact on academic outcomes with respect to universally free breakfast offerings in
New York City. While this analysis cannot differentiate between the impact of NSLP and
SBP on students, this result is consistent with a number of previous studies that have
found no impact of increased school meal access on weight and academic outcomes
(Gleason and Dodd 2009, Schwanzenbach and Zaki, 2014) and differs from
Schwanzenbach (2009) and Millimet et al. (2010) who both find an negative impact on
weight outcomes using the previous version of the Early Childhood Longitudinal Data
(ECLS-K 1998-99).
Schools and school districts need to assess on a case by case basis whether
implementing this policy, shown to have a lack of any positive impact on the student
body in this analysis, is viable and beneficial for their school meal provision. Further
quantitative research, applied to a larger and longer data sample, is required to gain
further evidence of the impact on school districts, schools and individual students. Most
obviously, an impact on students’ BMI may take more than one or two years post CEP

77
implementation to appear. The impact may also differ for non-pilot states. Future
research should also aim to determine a connection between individual students’
propensity to participate in school meals, before and after CEP implementation, and how
this impacts student outcomes.

78
REFERENCES CITED

79
Akin, John S., David K. Guilkey, and Barry M. Popkin. "The school lunch program and
nutrient intake: A switching regression analysis." American Journal of Agricultural
Economics 65, no. 3 (1983): 477-485.
Akin, John S., David K. Guilkey, Barry M. Popkin, and James H. Wyckoff. "The demand
for school lunches: An analysis of individual participation in the school lunch
program." Journal of Human Resources (1983): 213-230.
Alaimo, Katherine, Christine M. Olson, and Edward A. Frongillo. "Food insufficiency
and American school-aged children's cognitive, academic, and psychosocial
development." Pediatrics 108, no. 1 (2001): 44-53.
Alderman, Harold, John Hoddinott, and Bill Kinsey. "Long term consequences of early
childhood malnutrition." Oxford economic papers 58, no. 3 (2006): 450-474.
Anderson, Michael L. "School Lunch Quality and Academic Performance Michael L.
Anderson, Justin Gallagher, and Elizabeth Ramirez Ritchie April 16, 2017." (2017).
Arteaga, Irma, and Colleen Heflin. "Participation in the National School Lunch Program
and food security: An analysis of transitions into kindergarten." Children and Youth
Services Review 47 (2014): 224-230.
Bartfeld, Judith S., and Hong-Min Ahn. "The School Breakfast Program strengthens
household food security among low-income households with elementary school
children." The Journal of nutrition 141.3 (2011): 470-475.
Bhattacharya, Jayanta, Janet Currie, and Steven J. Haider. "Breakfast of champions? The
School Breakfast Program and the nutrition of children and families." Journal of Human
Resources 41.3 (2006): 445-466.
Bhattacharya, Jayanta, Janet Currie, and Steven J. Haider. "Evaluating the Impact of
School Nutrition Programs. Final Report. E-FAN-04-008." US Department of
Agriculture (2004).
Belot, Michèle, and Jonathan James. "Healthy school meals and educational
outcomes." Journal of health economics 30, no. 3 (2011): 489-504.
Campbell, Benjamin L., et al. "Does the National School Lunch Program improve
children’s dietary outcomes?." American Journal of Agricultural Economics 93.4 (2011):
1099-1130.
Capogrossi, Kristen, and Wen You. "The Influence of School Nutrition Programs on the
Weight of Low‐Income Children: A Treatment Effect Analysis." Health
economics (2016).
Cawley, John. "The economics of childhood obesity." Health affairs 29.3 (2010): 364-
371.

80
Cluss, Patricia A., LuAnn Fee, Rebecca J. Culyba, Kiran B. Bhat, and Kay Owen. "Effect
of food service nutrition improvements on elementary school cafeteria lunch purchase
patterns." Journal of School Health 84, no. 6 (2014): 355-362.
Cohen, Juliana FW, Scott Richardson, Ellen Parker, Paul J. Catalano, and Eric B. Rimm.
"Impact of the new US Department of Agriculture school meal standards on food
selection, consumption, and waste." American journal of preventive medicine 46, no. 4
(2014): 388-394.
Crepinsek, M. K., Singh, A., Bernstein, L. S., & McLaughlin, J. E. (2006). Dietary
effects of universal-free school breakfast: findings from the evaluation of the school
breakfast program pilot project. Journal of the American Dietetic Association, 106(11),
1796-1803.
Frisvold, David E. "Nutrition and cognitive achievement: An evaluation of the School
Breakfast Program." Journal of public economics 124 (2015): 91-104.
Gao, Xiang, Ariun Ishdorj, and Lindsey M. Higgins. Impact of the National School
Lunch Program on children's food security. Diss. Texas A & M University, 2012.
Gleason, Philip M. "Participation in the National School Lunch Program and the School
Breakfast Program." The American Journal of Clinical Nutrition 61.1 (1995): 213S-220S.
Gleason, Philip M., and Allison Hedley Dodd. "School breakfast program but not school
lunch program participation is associated with lower body mass index." Journal of the
American Dietetic Association 109.2 (2009): S118-S128.
Gleason, Philip M., and Carol W. Suitor. "Eating at school: How the National School
Lunch Program affects children's diets." American Journal of Agricultural
Economics 85.4 (2003): 1047-1061.
Glewwe, Paul, Hanan G. Jacoby, and Elizabeth M. King. "Early childhood nutrition and
academic achievement: a longitudinal analysis." Journal of public economics 81, no. 3
(2001): 345-368.
Gordon, Anne R., Barbara L. Devaney, and John A. Burghardt. "Dietary effects of the
National School Lunch Program and the School Breakfast Program." The American
Journal of Clinical Nutrition 61, no. 1 (1995): 221S-231S.
Gundersen, Craig, Brent Kreider, and John Pepper. "The impact of the National School
Lunch Program on child health: A nonparametric bounds analysis." Journal of
Econometrics 166.1 (2012): 79-91.
Gundersen, Craig, and Brent Kreider. "Bounding the effects of food insecurity on
children’s health outcomes." Journal of health economics 28, no. 5 (2009): 971-983.

81
Harkness, Joseph, Christopher W. Logan, Azim Shivji, Hiren Nisar, and Patty Connor.
"Community Eligibility Provision Evaluation: Year 3 Addendum. Nutrition Assistance
Program Report." US Department of Agriculture (2015).
Henry, Julie Anne. Analysis of the first Year Implementation of the Community
Eligibility Provision of the Healthy Hunger-Free Kids Act in Kansas. Diss. University of
Kansas, 2015.
Hinrichs, Peter. "The effects of the National School Lunch Program on education and
health." Journal of Policy Analysis and Management 29.3 (2010): 479-505.
Holford, Angus. "Take‐up of Free School Meals: Price Effects and Peer
Effects." Economica 82.328 (2015): 976-993.
Huang, Jin, and Ellen Barnidge. "Low-income Children's participation in the National
School Lunch Program and household food insufficiency." Social Science &
Medicine 150 (2016): 8-14.
Imberman, Scott A., and Adriana D. Kugler. "The effect of providing breakfast in class
on student performance." Journal of Policy Analysis and Management 33, no. 3 (2014):
669-699.
Johnson, Donna B., Mary Podrabsky, Anita Rocha, and Jennifer J. Otten. "Effect of the
healthy hunger-free kids act on the nutritional quality of meals selected by students and
school lunch participation rates." JAMA pediatrics 170, no. 1 (2016): e153918-e153918.
Kwon, Sowang. (2015). Evaluation of the Community Eligibility Provision in low-
income elementary schools. In 2015 APHA Annual Meeting & Expo (Oct. 31-Nov. 4,
2015). APHA.
Leos-Urbel, Jacob, Amy Ellen Schwartz, Meryle Weinstein, and Sean Corcoran. "Not
just for poor kids: The impact of universal free school breakfast on meal participation and
student outcomes." Economics of education review 36 (2013): 88-107.
Logan, Christopher W., Patty Connor, Eleanor L. Harvill, Joseph Harkness, Hiren Nisar,
Amy Checkoway, Laura R. Peck et al. "Community Eligibility Provision Evaluation.
Nutrition Assistance Program Report." US Department of Agriculture (2014).
Millimet, Daniel L., Rusty Tchernis, and Muna Husain. "School nutrition programs and
the incidence of childhood obesity." Journal of Human Resources 45.3 (2010): 640-654.
Mirtcheva, Donka M., and Lisa M. Powell. "Participation in the National School Lunch
Program: Importance of School‐Level and Neighborhood Contextual Factors." Journal of
School Health 79.10 (2009): 485-494.

82
Moore, Quinn, Lara Hulsey, and Michael Ponza. "Factors Associated with School Meal
Participation and the Relationship between Different Participation Measures. Final
Report." Mathematica Policy Research, Inc. (2009).
Moore, Shirlena M. "Principals' and School Food Service Workers' Perceptions of the
Implementation of the Community Eligibility Provision." (2016).
Nanney, Marilyn S., Richard MacLehose, Martha Y. Kubik, Cynthia S. Davey, Brandon
Coombes, and Toben F. Nelson. "Recommended school policies are associated with
student sugary drink and fruit and vegetable intake." Preventive medicine 62 (2014): 179-
181.
Newman, Constance, and Katherine Ralston. "Profiles of Participants in the National
School Lunch Program: Data from Two National Surveys. Economic Information
Bulletin Number 17." US Department of Agriculture (2006).
Ohri-Vachaspati, Punam. "Parental perception of the nutritional quality of school meals
and its association with students’ school lunch participation." Appetite 74 (2014): 44-47.
Ralston, Katherine, et al. "The National School Lunch Program: Background, Trends,
and Issues. Economic Research Report Number 61." US Department of Agriculture
(2008).
Ribar, David C., and Lauren A. Haldeman. "Changes in meal participation, attendance,
and test scores associated with the availability of universal free school breakfasts." Social
Service Review 87.2 (2013): 354-385.
Rosin, Odelia. "The economic causes of obesity: a survey." Journal of Economic
Surveys 22.4 (2008): 617-647.
Schanzenbach, Diane Whitmore. "Do school lunches contribute to childhood
obesity?." Journal of Human Resources 44.3 (2009): 684-709.
Schwartz, Marlene B., Kathryn E. Henderson, Margaret Read, Nicole Danna, and
Jeannette R. Ickovics. "New school meal regulations increase fruit consumption and do
not increase total plate waste." Childhood Obesity 11, no. 3 (2015): 242-247.
Schanzenbach, Diane Whitmore, and Mary Zaki. Expanding the school breakfast
program: Impacts on children's consumption, nutrition and health. No. w20308. National
Bureau of Economic Research, 2014.
Struempler, Barbara J., Sondra M. Parmer, Lisa M. Mastropietro, Dilbur Arsiwalla, and
Robert R. Bubb. "Changes in fruit and vegetable consumption of third-grade students in
body quest: food of the warrior, a 17-class childhood obesity prevention
program." Journal of nutrition education and behavior 46, no. 4 (2014): 286-292.
83
Taber, Daniel R., Jamie F. Chriqui, Lisa Powell, and Frank J. Chaloupka. "Association
between state laws governing school meal nutrition content and student weight status:
implications for new USDA school meal standards." JAMA pediatrics 167, no. 6 (2013):
513-519.
Winicki, Joshua, and Kyle Jemison. "Food insecurity and hunger in the kindergarten
classroom: its effect on learning and growth." Contemporary economic policy 21, no. 2
(2003): 145-157.
“Community Eligibility Provision. Planning and Implementation Guidance.” USDA,
Food and Nutrition Service, 2016.
“Federal Cost of School Food Programs.” USDA, Food and Nutrition Service, October
2016.
“National School Lunch Program: Participation and Lunches Served.” USDA, Food and
Nutrition Service, September 2016.
“Rates of Reimbursement.” School Meals. USDA, Food and Nutrition Service, August
2016.
“School Meal Trends& Stats.” USDA, Food and Nutrition Service, 2017.
“School Programs Meal, Snack and Milk Payments to States and School Food
Authorities.” USDA, Food and Nutrition Service, 2015.
“The School Breakfast Program – Fact Sheet.” USDA, Food and Nutrition Service,
September 2013.

84
APPENDIX A
FIGURES

85
Figure A.1: ISPs of Elementary Schools in the Pilot States
Notes: Figure displays the number of elementary schools for a given ISP, when it is available.
Sources: Individual State CEP data and Common Core of data, school years 2011-12 to 2014-15.
Figure A.2: Proxy ISPs of Elementary Schools in the Pilot States
Notes: Figure displays the number of CEP schools for a given proxy ISP, where the proxy is calculated by
dividing the percentage of students that qualify for free or reduced-price schools meals by 1.6, the
reimbursement multiplier authorized by the Food and Nutrition Service. By calculation, schools where 100
percent of students are eligible for subsidized school meals have a proxy of 62.5 percent.
Sources: Individual State CEP data and Common Core of data, school years 2011-12 to 2014-15.

86
Figure A.3: Distribution of Percentage of Subsidy Eligible Students
Notes: Bars display the number schools with a certain percentage of subsidy eligible students. Percentages
are included for all students who are a part of the sample of analysis when the control group includes all
students who attend a school that has school-wide Title 1 status throughout the sample.
Sources: Individual State CEP data, Common Core of data and ECLS-K data in pilot states, school years
2011-12 to 2013-14.
Figure A.4: Distribution of Percentage of Subsidy Eligible Students at CEP Schools
Notes: Bars display the number schools with a certain percentage of subsidy eligible students. Percentages
are included for all students who attend a school that has the CEP in place for the school-year.
Sources: Individual State CEP data, Common Core of data and ECLS-K data in pilot states, school years
2011-12 to 2013-14.