economic and retirement insecurity · includes $185 billion in social security surpluses for fiscal...
TRANSCRIPT

Joint Colloquium of the IACA, PBSS and IAAHS SectionsJoint Colloquium of the IACA, PBSS and IAAHS Sections
of the International Actuarial Associationof the International Actuarial Association
Westin Copley Place Hotel, Boston, U.S.A. Westin Copley Place Hotel, Boston, U.S.A. ––
44--7 May 20087 May 2008
Economic and Retirement Insecurity
The Hon. David M. WalkerPresident and CEO
The Peter G. Peterson Foundationand
Former Comptroller General of the United States
http://www.PGPF.org© The Peter G. Peterson Foundation 2008

The Case for Change
The federal government is on a “burning platform,” and the status quo way of doing business is unacceptable for a variety of reasons, including:
Past fiscal trends and significant long-range challengesSelected trends and challenges having no boundariesAdditional resource demands due to Iraq, Afghanistan, incremental homeland security needs, and recent natural disasters in the United StatesNumerous government performance/accountability and high risk challengesOutdated federal organizational structures, policies, and practicesRising public expectations for demonstrable results and enhanced responsiveness

1967 1987 2007
Defense Social SecurityNet interest
Medicare & MedicaidAll other spending
Source: GAO analysis of Office of Management and Budget data.
Composition of Federal Spending

Federal Spending for Mandatory and Discretionary Programs
Net Interest Discretionary Mandatory
1967 1987 2007
Source: GAO analysis of Office of Management and Budget data.

Composition of Federal Receipts by Source
Note: Numbers do not add to 100 percent due to rounding.
Source: GAO analysis of Office of Management and Budget data.

Fiscal Year 2006 and 2007 Deficits and Net Operating Costs
Fiscal Year 2006
Fiscal Year 2007
($ Billion)On-Budget Deficit (434) (344)
Unified Deficita (248) (163)Net Operating Cost (450) (276)
Sources: GAO analysis of Office of Management and Budget and Department of the Treasury data.aIncludes $185 billion in Social Security surpluses for fiscal year 2006 and $186 billion for fiscal year 2007; $1 billion in Postal Service surpluses for fiscal year 2006 and a $5 billion deficit for fiscal year 2007.

Surplus or Deficit as a Share of GDP (1797-2007)
Source: GAO analysis of Department of Commerce, Office of Management and Budget, and Congressional Budget Office.Note: Data until 1929 are shown as a percent of gross national product (GNP); data from 1930 to present are shown as a percent of GDP.
Percent of GNP/GDP

Debt Held by the Public as a Share of GDP (1797-2007)
Percent of GNP/GDP
Source: GAO analysis of data from the Department of Commerce, Office of Management and Budget, and Congressional Budget Office.Note: Data until 1929 are shown as a percent of gross national product (GNP); data from 1930 to present are shown as a percent of GDP.

Foreign Ownership Share of Federal Debt Held by the Public Has Increased
FY 2007Total Debt Held by the Public: $5.04 trillion
Foreign and international investors Federal ReserveDomestic investors and state and local governments
Source: Department of the Treasury.
Note: Totals and percent increases may not add due to rounding
FY 1996Total Debt Held by the Public: $3.73 trillion

Major Fiscal Exposures ($ trillions)
2000 2007 % IncreaseExplicit liabilities $6.9 $10.8 57
Publicly held debtMilitary & civilian pensions & retiree healthOther
Commitments & contingencies 0.5 1.1 97E.g., PBGC, undelivered orders
Implicit exposures 13.0 40.8 213Future Social Security benefits 3.8 6.8
Future Medicare Part A benefits 2.7 12.3
Future Medicare Part B benefits 6.5 13.4
Future Medicare Part D benefits -- 8.4
Total $20.4 $52.7 158Source: GAO analysis of 2000 and 2007 Financial Report of the United States Government.Note: Totals and percent increases may not add due to rounding. Estimates for Social Security and Medicare are at present value as of January 1 of each year and all other data are as of September 30.

How Big is Our Growing Fiscal Burden?
Total –major fiscal exposures $52.7 trillion
Total household net worth1 $58.6 trillion
Burden/Net worth ratio 90 percentBurden2
Per person $175,000Per full-time worker $410,000Per household $455,000
IncomeMedian household income3 $48,201Disposable personal income per capita4 $33,253
This fiscal burden can be translated and compared as follows:
Source: GAO analysis.
Notes: (1) Federal Reserve Board, Flow of Funds Accounts, Table B.100, 2007:Q3 (December 6, 2007); (2) Burdens are calculated using estimated total U.S. population as of 10/1/2007, from the U.S. Census Bureau; full-time workers reported by the Bureau of Economic Analysis, in NIPA table 6.5D (Aug. 1, 2007); and households reported by the U.S. Census Bureau, in Income, Poverty, and Health Insurance Coverage in the United States: 2006 (Aug. 2007); (3) U.S. Census Bureau, Income, Poverty, and Health Insurance Coverage in the United States: 2006 (Aug. 2007); and (4) Bureau of Economic Analysis, Personal Income and Outlays, table 2, (Nov. 29, 2007).

Potential Fiscal Outcomes Under Baseline Extended (January 2001)
Revenues and Composition of Spending as a Share of GDP
Revenue
Source: GAO’s January 2001 analysis.aAll other spending is net of offsetting interest receipts.
Percent of GDP

Potential Fiscal Outcomes Under Alternative Simulation (August 2007)
Revenues and Composition of Spending as a Share of GDP
Revenue
Source: GAO August 2007 analysis.
Notes: AMT exemption amount is retained at the 2006 level through 2017 and expiring tax provisions are extended. After 2017, revenue as a share of GDP returns to its historical level of18.3 percent of GDP plus expected revenues from deferred taxes, i.e. taxes on withdrawals from retirement accounts. Medicare spending is based on the Trustees April 2007 projections adjusted for the Centers for Medicare and Medicaid Services alternative assumption that physician payments are not reduced as specified under current law.
Percent of GDP

Social Security, Medicare and Medicaid Spending as a Percent of GDP
0
5
10
15
20
25
30
2008 2020 2030 2040 2050 2060 2070 2080
Percent of GDP
Social Security
Medicaid
Medicare
Source: GAO analysis of data from the Office of the Chief Actuary, Social Security Administration, Office of the Actuary, Centers for Medicare and Medicaid Services, and the Congressional Budget Office.
Note: Social Security and Medicare projections based on the intermediate assumptions of the 2008 Trustees’ Reports. Medicaid projections based on CBO’s January 2008 short-term Medicaid estimates and CBO’s December 2007 long-term Medicaid projections adjusted to reflect excess cost growth consistent with the 2008 Trustees intermediate assumptions.

Growth in Spending for Social Security, Medicare and Medicaid Expected to
Outpace Economic Growth
75%
123%
221% 229%
0%
50%
100%
150%
200%
250%
GDP Social SecuritySpending
MedicaidSpending
MedicareSpending
Source: GAO analysis of data from the Office of the Chief Actuary, Social Security Administration; Office of the Actuary, Centers for Medicare and Medicaid Services; and the Congressional Budget Office.
Note: GDP, Social Security and Medicare projections based on the intermediate assumptions of the 2008 Trustees’ Reports. Medicaid projections based on CBO’s January 2008 short-term Medicaid estimates and CBO’s December 2007 long-term Medicaid projections adjusted to reflect excess cost growth consistent with the 2008 Trustees intermediate assumptions.
Growth in constant dollars 2008-2033

Debt Held by the Public Under GAO’s Alternative Simulation
Source: GAO’s January 2008 analysis.

Debt per Capita Could Exceed GDP Per Capita Before 2030
Under GAO’s Alternative Simulation
0
25,000
50,000
75,000
100,000
125,000
150,000
175,000
2008 2030 2040Debt per Capita GDP per Capita
Source: GAO’s January 2008 analysis.Notes: Discretionary spending grows with GDP after 2008. AMT exemption amount is retained at the 2007 level through 2018 and expiring tax provisions are extended. After 2018, revenue as a share of GDP returns to its historical level of 18.3 percent of GDP plus expected revenues from deferred taxes, (i.e. taxes on withdrawals from retirement accounts). Medicare spending is based on the Trustees April 2007 projections adjusted for the Centers for Medicare and Medicaid Services alternative assumption that physician payments are not reduced as specified under current law.
Per capita 2008 dollars

Federal Tax Expenditures Exceeded Discretionary Spending for
Half of the Last DecadeDollars in billions (in 2006 dollars)
Source: GAO analysis of OMB budget reports on tax expenditures, fiscal years 1976-2008.Note: Summing tax expenditure estimates does not take into account interactions between individual provisions. Outlays associated with refundable tax credits are included in mandatory spending.

Revenue Loss Estimates for the Largest Tax Expenditures Reported
for Fiscal Year 2006
Source: GAO analysis of OMB, Analytical Perspectives, Budget of the United States Government, Fiscal Year 2008.aThe value of employer-provided health insurance is excluded from Medicare and Social Security payroll taxes. Some researchers have estimated that payroll tax revenue losses amounted to more than half of the income tax revenue losses in 2004, and we use this estimate for 2006. The research we are aware of dealt only with health care, therefore the 50 percent figure may not apply to other items that are excluded from otherwise applicable income and payroll taxes.
Revenue loss estimates (dollars in billions)
Treasury estimated income tax revenue losses Approximate payroll tax revenue losses
Exclusion of employer contributions for medical insurance premiums and medical care
Net exclusion of employer- sponsored pension contributions and earnings
Deductibility of mortgage interest on owner- occupied homes
Capital gains (except agriculture, timber, iron ore, and coal)
Deductibility of nonbusiness states and local taxes other than on owner- occupied homes
187.5
a

State and Local Governments Face Increasing Fiscal Challenges
Percent of GDP
Operating Surplus/Deficit Measure
Sources: GAO’s analysis of historical data from National Income and Product Accounts. Historical data from 1980 – 2006, GAO projections from 2007– 2050 using many CBO projections and assumptions, particularly for next 10 years.
Net Lending / Net Borrowing
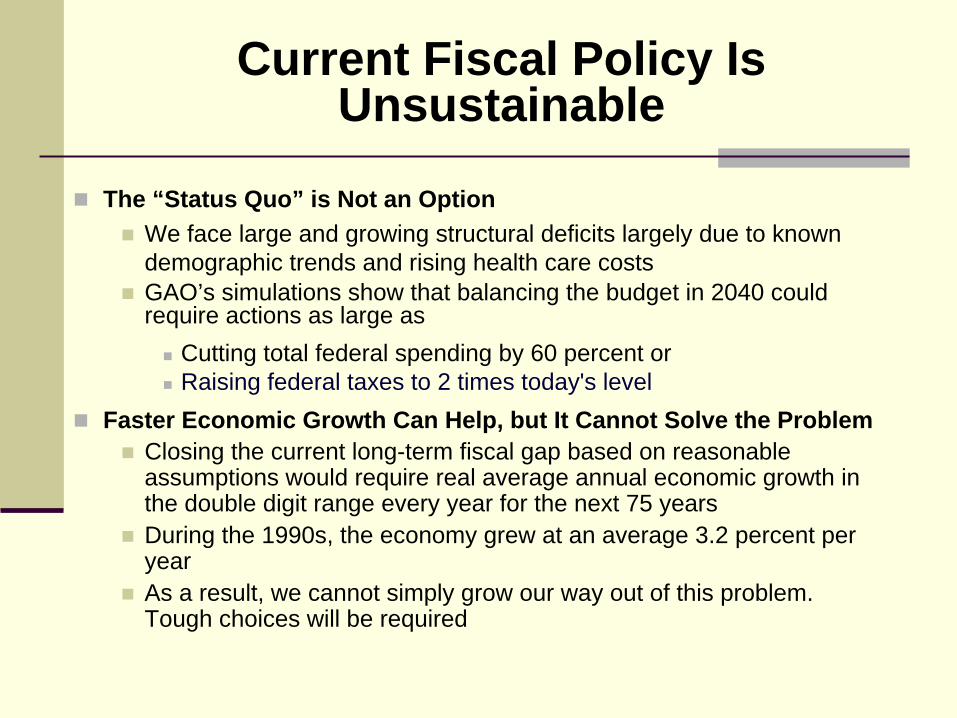
Current Fiscal Policy Is Unsustainable
The “Status Quo” is Not an OptionWe face large and growing structural deficits largely due to known demographic trends and rising health care costsGAO’s simulations show that balancing the budget in 2040 could require actions as large as
Cutting total federal spending by 60 percent orRaising federal taxes to 2 times today's level
Faster Economic Growth Can Help, but It Cannot Solve the ProblemClosing the current long-term fiscal gap based on reasonable assumptions would require real average annual economic growth inthe double digit range every year for the next 75 yearsDuring the 1990s, the economy grew at an average 3.2 percent peryear As a result, we cannot simply grow our way out of this problem. Tough choices will be required

A Disturbing Parallel: The Current Sub-Prime Crisis & Long-Term Fiscal Challenges
There are disturbing parallels between the current sub-prime crisis and our nation’s larger fiscal challenge:
A disconnect between those who benefit from current policies & practices, and those who bear the risk and pay the price
Lack of transparency
Importance of both confidence and cash flow
Inadequate oversight, and action delayed until a crisis hits

The Way Forward: A Three-Pronged Approach
1. Improve Financial Reporting, Public Education, and Performance Metrics
2. Strengthen Budget and Legislative Processes and Controls
3. Fundamentally Reexamine & Transform for the 21st Century (i.e., entitlement programs, other spending, and tax policy)
Solutions Require Active Involvement from both the Executive and Legislative Branches

The Way Forward: Improve Financial Reporting, Public Education
and Performance MetricsImprove transparency & completeness of President’s budget proposal:
Return to 10-year estimates in budget both for current policies and programs and for policy proposalsInclude in the budget estimates of long-term cost of policy proposals & impact on total fiscal exposuresImprove transparency of tax expenditures
Consider requiring President’s budget to specify & explain a fiscal goal and a path to that goal within 10-year window—or justify an alternative deadline
Require annual OMB report on existing fiscal exposures [liabilities, obligations,explicit & implied commitments]
Require enhanced financial statement presentation to address fiscal sustainabilityand intergenerational equity issues
Prepare and distribute a summary of the annual report that is both useful and used
Increase information on long-range fiscal sustainability issues in Congressional Budget Resolution & Budget Process
Develop key national (outcome-based) indicators (e.g. economic, security, social, environmental) to chart the nation’s posture, progress and position relative to the other major industrial countries

The Way Forward: Strengthen Budget and Legislative
Processes and ControlsRestore discretionary spending caps & PAYGO rules on both the spendingand tax sides of the ledger
Develop mandatory spending triggers [with specific defaults] and other action-forcing provisions (e.g., sunsets) for both direct spending programs and tax preferences
Develop, impose and enforce modified rules for selected items (e.g., earmarks, emergency designations and use of supplementals)
Require long-term cost estimates (e.g. present value) for any legislative debate on all major tax and spending bills, including entitlement programs. Cost estimates should usually assume no sunset
Extend accrual budgeting to insurance and federal employee pensions; develop techniques for extending it to retiree health and to environmental liabilities
Consider biennial budgeting
Consider expedited line-item rescissions from the President that would only require a majority vote to override the proposed rescission(s)

The Way Forward: Fundamentally Re-Examine & Transform
Restructure existing entitlement programs
Re-examine and restructure the base of all other spending
Review and revise existing tax policy, including tax preferencesand enforcement programs
Expand scrutiny of all proposed new programs, policies and activities
Re-engineer internal agency structures and processes, including more emphasis on long-term planning, integrating federal activities, and partnering with others both domestically and internationally
Strengthen and systematize Congressional oversight processes
Increase transparency associated with government contracts and other selected items
Consider a capable, credible, bi-partisan commission for budget, entitlement, and tax reform

Key National Indicators
WHAT: A portfolio of economic, social and environmental outcome-based measures that could be used to help assess the nation’s and other governmental jurisdictions’ positions and progress
WHO: Many countries and several states, regions and localities have already undertaken related initiatives (e.g., Australia, New Zealand,Canada, the United Kingdom, Oregon, Silicon Valley (California)and Boston)
WHY: Development of such a portfolio of indicators could have a number of possible benefits, including:
Serving as a framework for related strategic planning effortsEnhancing performance and accountability reportingInforming public policy decisions, including much needed baseline reviewsof existing government policies, programs, functions and activitiesFacilitating public education and debate as well as an informed electorate
WAY FORWARD: Through a consortium of key players housed in the National Academies domestically, and through related efforts by the OECD and others internationally
Source: GAO

Key National Indicators: Where the United States RanksThe United States may be the only superpower, but compared to most other OECD countries on selected key economic, social, and environmental indicators, on average, the U.S. ranks
OECD Categories for Key Indicators(2006 OECD Factbook)
Population/Migration Energy Environment Quality of Life
Macroeconomic Trends Labor Market Education Economic
Globalization
Prices Science & Tech.
Public Finance
16 OUT OF 2816 OUT OF 28
Source: GAO’s analysis of 2006 OECD Factbook.

Key Elements / Players for Economic Security in Retirement
Adequate retirement incomeSavingsSocial SecurityPensionsEarnings from continued employment (e.g., part-time)
Affordable health careMedicareRetiree health care
Long-term care (a hybrid)The Major Players involved
EmployersGovernmentIndividuals, Family, Community
Source: GAO
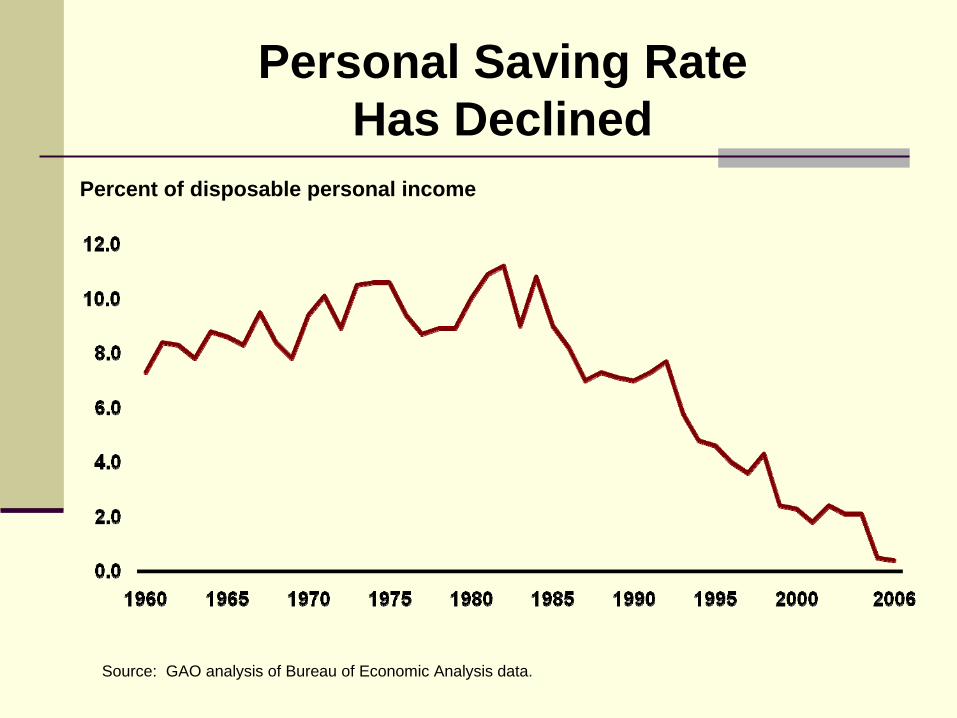
Personal Saving Rate Has Declined
Source: GAO analysis of Bureau of Economic Analysis data.
Percent of disposable personal income

Aged Population as a Share of Total U.S. Population
Percent of total population
Source: GAO analysis of data from the Office of the Chief Actuary, Social Security Administration. Note: Projections based on the intermediate assumptions of the 2008 Trustees’ Reports.
Population aged 65 and over

Labor Force Growth
Percentage change (5-yr moving average)
Source: GAO analysis of data from the Office of the Chief Actuary, Social Security Administration.
Note: Percentage change is calculated as a centered 5-yr moving average of projections based on the intermediate assumptions of the 2008 Trustees Reports.

Social Security Workers per Beneficiary
Covered workers per OASDI beneficiary
Source: Office of the Chief Actuary, Social Security Administration. Note: Projections based on the intermediate assumptions of the 2008 Trustees’ Reports.

Working Longer May Help Address the Challenges of an Aging Population
Impact on the EconomyLarger labor forceAdditional economic growth
Impact on the Federal BudgetAdditional tax revenueReduced expenditures: Social Security & Medicare
Impact on IndividualsEnhanced retirement security and quality of life
Source: GAO

Why Older Americans Don’t Work Longer
Cultural Expectation to Retire in Mid-60sSocial Security early retirement age is 62Many private pensions have similar or lower eligibility ages
Older Americans Perceive Few OpportunitiesFew older workers felt they had opportunities for partial retirement Most older workers and retirees saw low-wage and low-skilled jobs as their primary employment opportunities
Most Employers Do Not Make a Special Effort to Hire and Retain Older Workers
Many employers say they are willing to implement policies to recruit and retain older workers, but few have actually done soEmployers cite barriers such as federal pension regulations, in regard to pursuing flexible employment options for older workers
Source: GAO

Key Dates Highlight Long-Term Challenges of the Social Security System
Date Event
OASI DI OASDI
2011 -- 2011 Cash surplus begins to decline
2018 2005 2017 Annual benefit costs exceed cash revenue from taxes
2028 2012 2027Trust fund ceases to grow because even taxes plus interest fall short of benefits
2042 2025 2041 Trust fund exhausted
Source: GAO analysis of data from the Office of the Chief Actuary, Social Security Administration.Note: Based on the intermediate assumptions of the 2008 Trustees’ Report.

Possible Way Forward on Social Security Reform
Make little or no changes to those who are near retirement or already retired, and make a number of adjustments that would affect younger workers:
Phase in an increase in the normal retirement age and index itto life expectancyConsider phasing in an increase in the early retirement age andindex it to life expectancy, with a modified disability access provisionModify income replacement and/or indexing formulas for middleand upper income earnersStrengthen the minimum benefitConsider a modest adjustment to the COLA formulaIncrease the taxable wage base, if necessaryConsider supplemental individual accounts and mandatory individual savings on a payroll deduction basis (e.g., a minimum 2 percent payroll contribution and a program designed much like the Federal Thrift Savings Plan with a real trust fund and real investments)

Growth in Health Care Spending: Health Care Spending as a Percentage of GDP
Source: GAO analysis of The Centers for Medicare & Medicaid Services, Office of the Actuary.Note: The figure for 2015 is projected.
Percent
Year

Growth in Health Care Spending: Cumulative Growth in Real Health Care Spending Per Capita and Real GDP Per Capita, 1960-2005
Average annual growth rate of 4.9%
Average annual growth rate of 2.3%
Percentage
Source: GAO analysis of data from the Centers for Medicare & Medicaid Services, Office of the Actuary, and the Bureau of Economic Analysis.
Note: The most current data available on health care spending per capita are for 2005.

Growth in Health Care Spending: U.S Compared to Other OECD
Countries, 2004Percent of GDP spent on health care
Source: OECD Health Data, 2006 Notes: All of the data on per capita spending and GDP have been translated into U.S. dollar equivalents, with exchange rates based on purchasing power parities (PPPs) of the national currencies
United States 15.3% and $6,102
Turkey7.7% and $580
South Korea5.6% and $1,149

Number of Non-Elderly Uninsured Americans, 1999-2005
Sources: GAO and Urban Institute and Kaiser Commission on Medicaid and the Uninsured analyses. Notes: Figures for 1999-2000 are from Urban Institute and Kaiser Commission on Medicaid and the Uninsured. The figures for 2001- 2005 are from GAO analyses of the Bureau of the Labor Statistics and the Bureau of the Census Current Population Survey, Annual Social and Economic Supplement.
Population in millions

Where the United States Ranks on Selected Health Outcome Indicators
Source: GAO analysis of OECD Health Data 2006 and 2007Notes: Data are the most recent available for all countries. Life expectancy at birth for the total population is estimated by the OECD Secretariat for all countries, as the unweighted average of the life expectancy of men and women. Infant mortality is measured as the number of deaths per 1,000 live births. Potential years of life lost (PYLL) is the sum of the years of life lost prior to age 70, given current age-specific death rates (e.g., a death at 5 years of age is counted as 65 years of PYLL).
Outcome RankLife expectancy at birthU.S. = 77.8 years in 2004
23 out of 30 in 2004
Infant MortalityU.S. = 6.8 deaths in 2004
26 out of 30 in 2004
Potential Years of Life LostU.S. = 5,066 in 2002
23 out of 26 in 2002
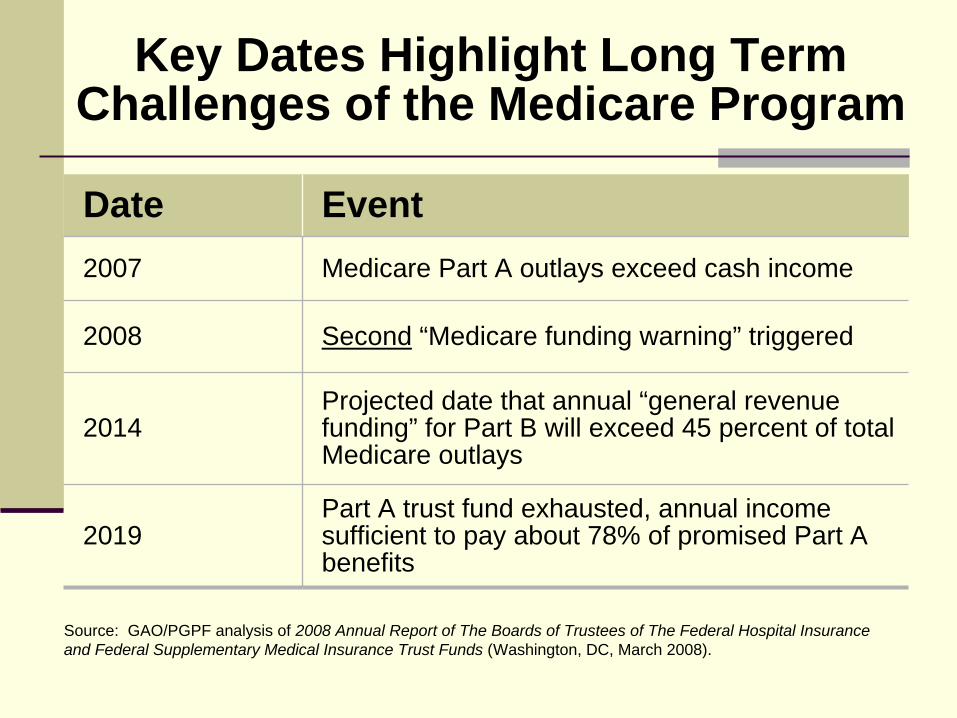
Key Dates Highlight Long Term Challenges of the Medicare Program
Date Event2007 Medicare Part A outlays exceed cash income
2008 Second “Medicare funding warning” triggered
2014Projected date that annual “general revenue funding” for Part B will exceed 45 percent of total Medicare outlays
2019Part A trust fund exhausted, annual income sufficient to pay about 78% of promised Part A benefits
Source: GAO/PGPF analysis of 2008 Annual Report of The Boards of Trustees of The Federal Hospital Insurance and Federal Supplementary Medical Insurance Trust Funds (Washington, DC, March 2008).
The public needs to be educated about the differences between wants, needs, affordability, and sustainability at both the individual and aggregate level
Ideally, health care reform proposals will:
Align Incentives for providers and consumers to make prudent decisions about the use of medical services,
Foster Transparency with respect to the value and costs of care, and
Ensure Accountability from insurers and providers to meet standards for appropriate use and quality.
Ultimately, we need to address four key dimensions: access, cost, quality, and personal responsibility
Issues to Consider in Examining Our Health Care System
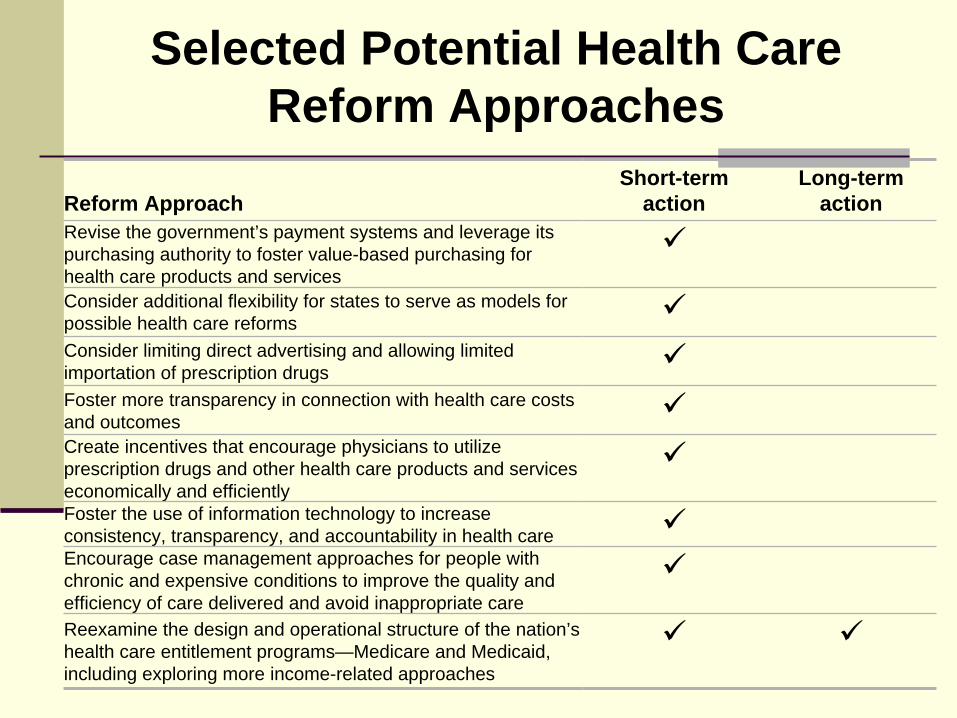
Selected Potential Health Care Reform Approaches
Reform ApproachShort-term
actionLong-term
actionRevise the government’s payment systems and leverage its purchasing authority to foster value-based purchasing for health care products and servicesConsider additional flexibility for states to serve as models for possible health care reformsConsider limiting direct advertising and allowing limited importation of prescription drugsFoster more transparency in connection with health care costs and outcomesCreate incentives that encourage physicians to utilize prescription drugs and other health care products and services economically and efficientlyFoster the use of information technology to increase consistency, transparency, and accountability in health careEncourage case management approaches for people with chronic and expensive conditions to improve the quality and efficiency of care delivered and avoid inappropriate careReexamine the design and operational structure of the nation’s health care entitlement programs—Medicare and Medicaid, including exploring more income-related approaches

Selected Potential Health Care Reform Approaches
Reform ApproachShort-term
actionLong-term
actionRevise certain federal tax preferences for health care to encourage more efficient use of health care products and servicesFoster more preventative care and wellness services and capabilities, including fighting obesity and encouraging better nutrition
Promote more personal responsibility in connection with health care
Limit spending growth for government-sponsored health care programs (e.g., percentage of the budget and/or economy)Develop a core set of basic and essential services. Create insurance pools for alternative levels of coverage, as necessaryDevelop a set of evidence-based national practice standards to help avoid unnecessary care, improve outcomes, and reduce litigationPursue multinational approaches to investing in health care R&D

Moving the Debate Forward
The Sooner We Get Started, the BetterThe miracle of compounding is currently working against usLess change would be needed, and there would be more time to make adjustments Our demographic changes will serve to make reform more difficult over time
We Need Public Education, Discussion and Debate The role of government in the 21st CenturyWhich programs and policies should be changed and howHow government should be financed

Three Key Illnesses
MyopiaTunnel VisionSelf-Centeredness

Four National Deficits
BudgetBalance of PaymentsSavingsLeadership

Key Leadership Attributes Needed for These Challenging and Changing Times
CourageIntegrityCreativityPartnershipStewardship

The Peter G. Peterson Foundation Target Groups
The Business and Professional CommunityYoung AmericansThe Media

The Peter G. Peterson Foundation Priorities
To solve 6 key unsustainable challenges:
Deficits (budget, savings and balance of payments)Entitlement programsBallooning health care costsGaps in our educational system (e.g., financial and
literary crisis)Excessive energy consumption Proliferation of nuclear and biological warfare materials

Joint Colloquium of the IACA, PBSS and IAAHS SectionsJoint Colloquium of the IACA, PBSS and IAAHS Sections
of the International Actuarial Associationof the International Actuarial Association
Westin Copley Place Hotel, Boston, U.S.A. Westin Copley Place Hotel, Boston, U.S.A. ––
44--7 May 20087 May 2008
Economic and Retirement Insecurity
The Hon. David M. WalkerPresident and CEO
The Peter G. Peterson Foundationand
Former Comptroller General of the United States
http://www.PGPF.org© The Peter G. Peterson Foundation 2008