economic and revenue review - home | vermont general ... briefings/december 2015... · economic and...
TRANSCRIPT


Economic and Revenue Review
for the Vermont State Legislature
Montpelier, Vermont December 1, 2015
Thomas E. Kavet, President
Dr. Nicolas O. Rockler, CEO
State Economist and Principal Economic Advisor to the Vermont State Legislature Since 1996
Kavet, Rockler & Associates, LLC
Economic and Public Policy Consulting
985 Grandview Road Williamstown, Vermont 05679-9003 USA Telephone: 802-433-1360 Facsimile: 866-433-1360 Cellular: 802-433-1111 Website: www.kavetrockler.com E-Mail: [email protected]

$- $50.0 $100.0 $150.0 $200.0 $250.0 $300.0 $350.0 $400.0 $450.0 $500.0
Education Fund (Partial)
Transportation Fund
General Fund
$64.3
$89.9
$451.9
$63.7
$90.4
$456.4
FY16 Revenues by Fund Through October 2015 Actual Revenues (Green) vs. Targets (Red), Percent Variance by Fund in Box, Source: VT Joint Fiscal Office
Actual
Target
+1.0%
+0.6%
-1.0%

Vermont Year-To-Date FY16 Revenues Have
Been Close to Expectations
• Total Revenues through October (General, Transportation and derived Education Funds) are about $4.4M above targets on a base of about $610M - a variance of about +0.7%, with characteristic volatility in Corporate receipts a plus, and in Estate tax revenues, a minus
• Consumption taxes (Sales & Use, Meals & Rooms and Motor Vehicle Purchase & Use) were very close to estimates (+0.1%) at about $166.7M through October vs. a target of $166.5M. Personal income tax revenues were $1.1M above targets, a variance of +0.5%
• The Education Fund components from the General and Transportation Funds were about $0.7M below targets (-1.5%), due to year-to-date weakness in highly variable Lottery receipts
• Corporate Income tax revenues continued to be strong through the first 4 months of the fiscal year, but mounting refunds and lower profits reported by some firms still represent a substantial risk to revenues over the balance of this year and next
• Total Transportation Fund revenues were about $0.6M above targets through October, a minor variance of about 0.6%
• Preliminary November revenues may take a few extra days to process and analyze due to the Phase 2 expansion of the VTax system in November. This may also result in some November revenue accruing in December
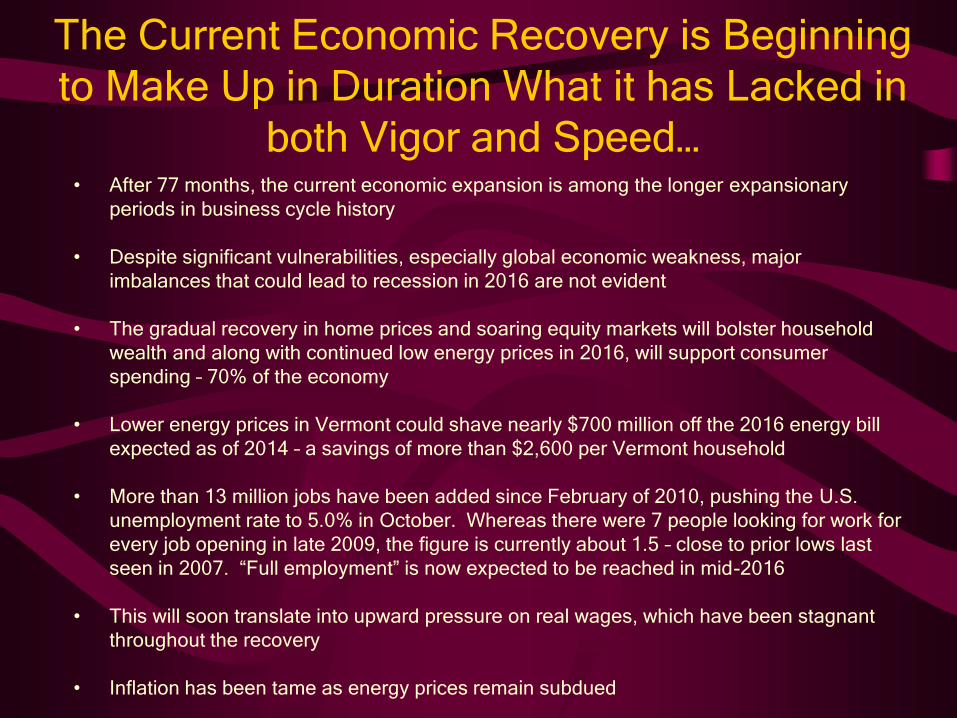
The Current Economic Recovery is Beginning
to Make Up in Duration What it has Lacked in
both Vigor and Speed…
• After 77 months, the current economic expansion is among the longer expansionary
periods in business cycle history
• Despite significant vulnerabilities, especially global economic weakness, major
imbalances that could lead to recession in 2016 are not evident
• The gradual recovery in home prices and soaring equity markets will bolster household
wealth and along with continued low energy prices in 2016, will support consumer
spending – 70% of the economy
• Lower energy prices in Vermont could shave nearly $700 million off the 2016 energy bill
expected as of 2014 – a savings of more than $2,600 per Vermont household
• More than 13 million jobs have been added since February of 2010, pushing the U.S.
unemployment rate to 5.0% in October. Whereas there were 7 people looking for work for
every job opening in late 2009, the figure is currently about 1.5 – close to prior lows last
seen in 2007. “Full employment” is now expected to be reached in mid-2016
• This will soon translate into upward pressure on real wages, which have been stagnant
throughout the recovery
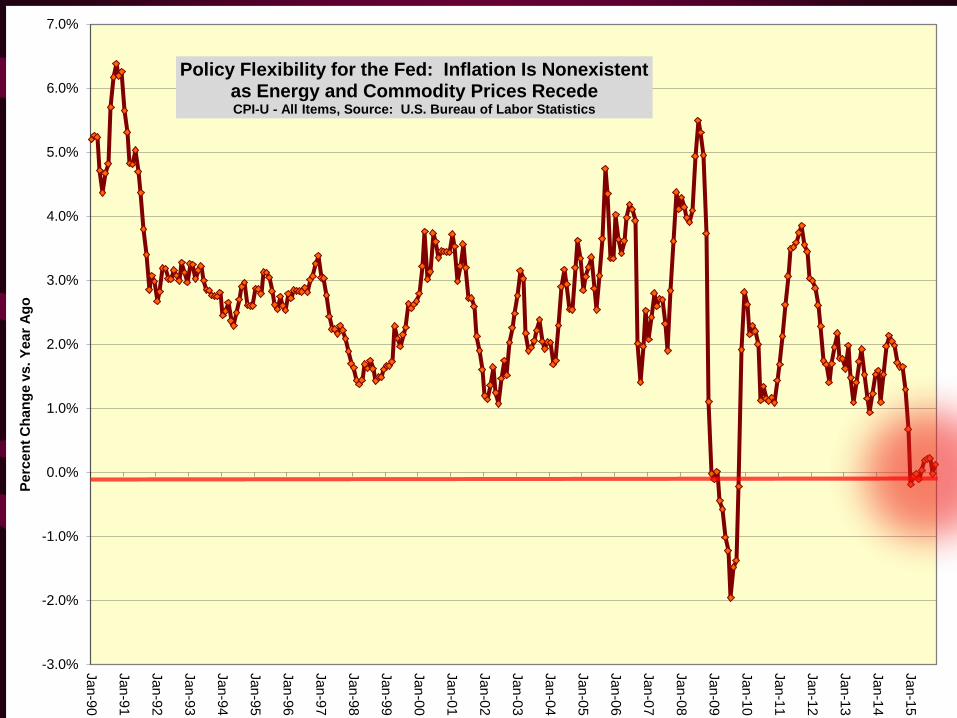
• Inflation has been tame as energy prices remain subdued
-75 -50 -25 0 25 50 75 100 125
June 1857
October 1860
April 1865
June 1869
October 1873
March 1882
March 1887
July 1890
January 1893
December 1895
June 1899
September 1902
May 1907
January 1910
January 1913
August 1918
January 1920
May 1923
October 1926
August 1929
May 1937
February 1945
November 1948
July 1953
August 1957
April 1960
December 1969
November 1973
January 1980
July 1981
July 1990
March 2001
December 2007
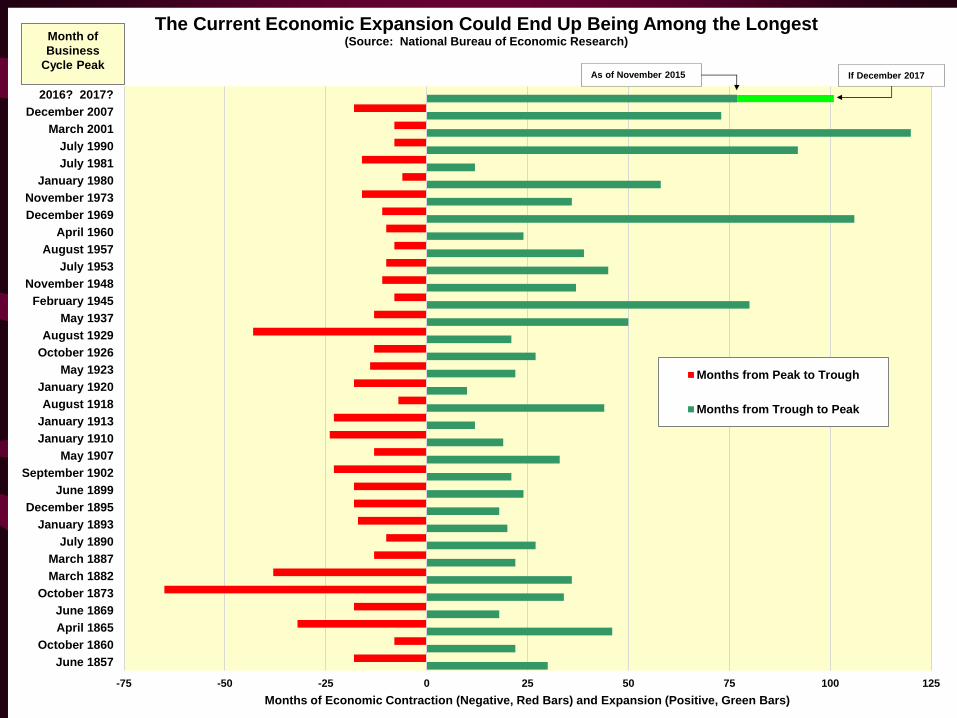
2016? 2017?
Months of Economic Contraction (Negative, Red Bars) and Expansion (Positive, Green Bars)
The Current Economic Expansion Could End Up Being Among the Longest (Source: National Bureau of Economic Research)
Months from Peak to Trough
Months from Trough to Peak
If December 2017 As of November 2015
Month of
Business
Cycle Peak
-10.0%
-8.0%
-6.0%
-4.0%
-2.0%
0.0%
2.0%
4.0%
6.0%
20
05Q
1
20
05Q
2
20
05Q
3
20
05Q
4
20
06Q
1
20
06Q
2
20
06Q
3
20
06Q
4
20
07Q
1
20
07Q
2
20
07Q
3
20
07Q
4
20
08Q
1
20
08Q
2
20
08Q
3
20
08Q
4
20
09Q
1
20
09Q
2
20
09Q
3
20
09Q
4
20
10Q
1
20
10Q
2
20
10Q
3
20
10Q
4
20
11Q
1
20
11Q
2
20
11Q
3
20
11Q
4
20
12Q
1
20
12Q
2
20
12Q
3
20
12Q
4
20
13Q
1
20
13Q
2
20
13Q
3
20
13Q
4
20
14Q
1
20
14Q
2
20
14Q
3
20
14Q
4
20
15Q
1
20
15Q
2
20
15Q
3
Pe
rce
nt
Ch
an
ge
Vs
. Y
ea
r A
go
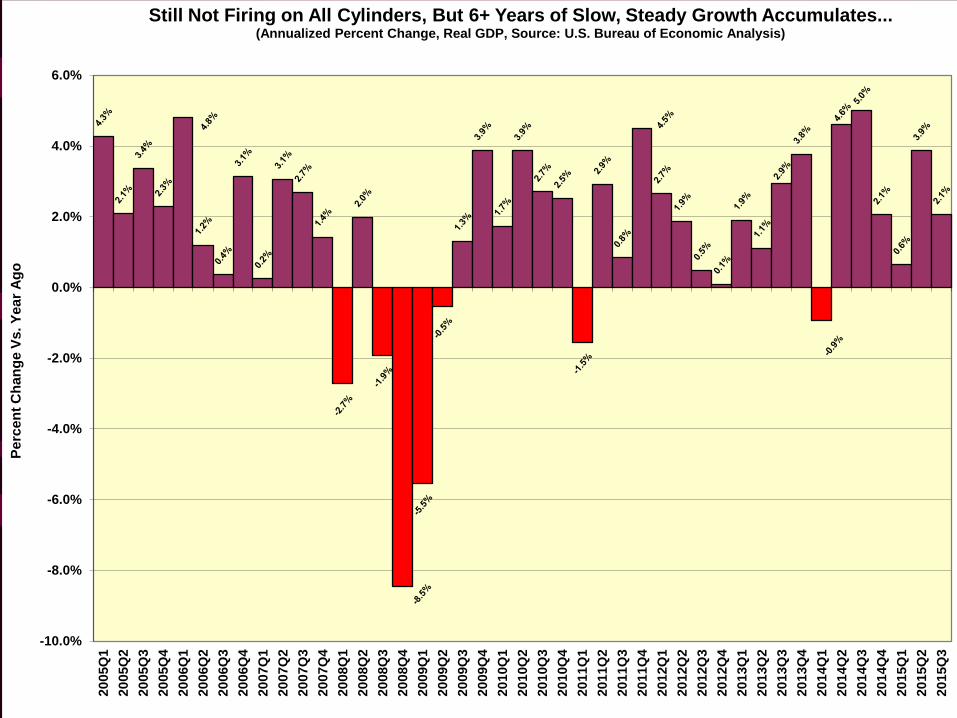
Still Not Firing on All Cylinders, But 6+ Years of Slow, Steady Growth Accumulates...
(Annualized Percent Change, Real GDP, Source: U.S. Bureau of Economic Analysis)

-900
-600
-300
0
300
600
Ju
n-0
7
Se
p-0
7
Dec
-07
Ma
r-08
Ju
n-0
8
Se
p-0
8
Dec
-08
Ma
r-09
Ju
n-0
9
Se
p-0
9
Dec
-09
Ma
r-10
Ju
n-1
0
Se
p-1
0
Dec
-10
Ma
r-11
Ju
n-1
1
Se
p-1
1
Dec
-11
Ma
r-12
Ju
n-1
2
Se
p-1
2
Dec
-12
Ma
r-13
Ju
n-1
3
Se
p-1
3
Dec
-13
Ma
r-14
Ju
n-1
4
Se
p-1
4
Dec
-14
Ma
r-15
Ju
n-1
5
Se
p-1
5
Mo
nth
to
Mo
nth
Ch
an
ge
in
To
tal N
on
ag
ric
ult
ura
l E
mp
loym
en
t (T
ho
us
an
ds
, S
AA
R)
13 Million New Jobs Over 64 Months Finally Results in Firming Labor Markets (Monthly Change in Total Payroll Employment, Seasonally-Adjusted, Source: U.S. Bureau of Labor Statistics)

$0
$10
$20
$30
$40
$50
$60
$70
$80
$90
$100
$110
$120
$130
$140
$150
Jan
-47
Jan-4
9
Jan
-51
Jan
-53
Jan
-55
Jan
-57
Jan
-59
Jan
-61
Jan
-63
Jan
-65
Jan
-67
Jan
-69
Jan-7
1
Jan
-73
Jan
-75
Jan
-77
Jan
-79
Jan
-81
Jan
-83
Jan
-85
Jan
-87
Jan
-89
Jan
-91
Jan-9
3
Jan
-95
Jan
-97
Jan
-99
Jan
-01
Jan
-03
Jan
-05
Jan
-07
Jan
-09
Jan
-11
Jan
-13
Jan
-15
Pri
ce
Pe
r B
arr
el -
Oc
tob
er
20
15
Co
ns
tan
t U
.S. D
olla
rs
Sources: Wall Street Journal, Moody's Analytics, KRA
Transformative Oil Price Declines Now Expected to Persist Into 2016 (West Texas Intermediate Crude Oil, PPB in October 2015 Constant Dollars)
(June 2008 - $145 per Barrel)
(April 2011 - $116 per Barrel)
(February 2009 - $44 per
(August 2015 - $43 per Barrel)
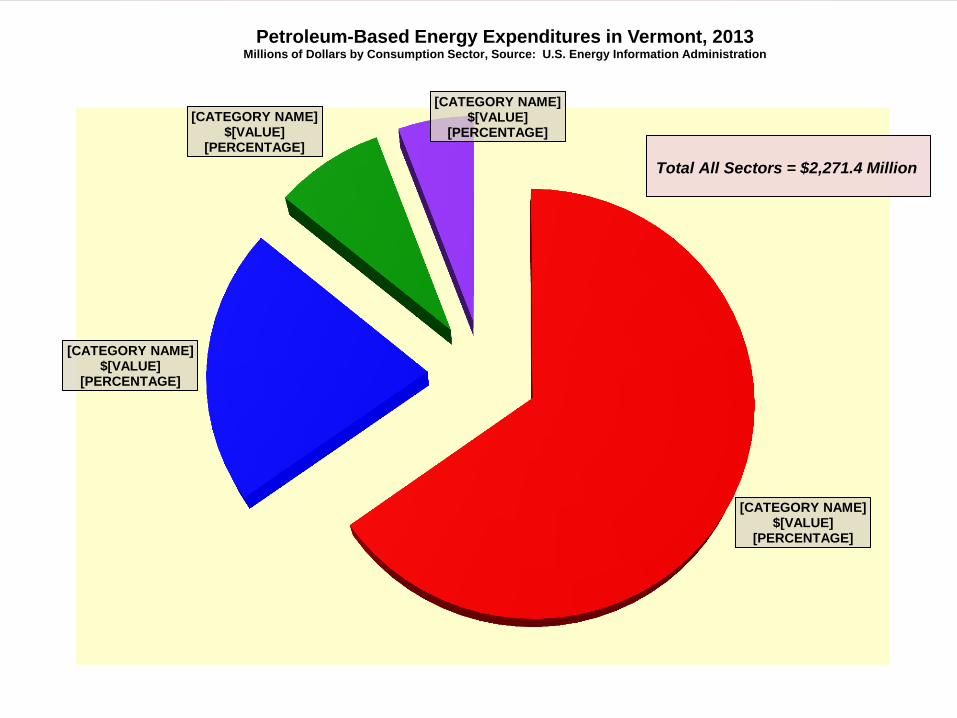
[CATEGORY NAME] $[VALUE]
[PERCENTAGE]
[CATEGORY NAME] $[VALUE]
[PERCENTAGE]
[CATEGORY NAME] $[VALUE]
[PERCENTAGE]
[CATEGORY NAME] $[VALUE]
[PERCENTAGE]
Petroleum-Based Energy Expenditures in Vermont, 2013 Millions of Dollars by Consumption Sector, Source: U.S. Energy Information Administration
Total All Sectors = $2,271.4 Million

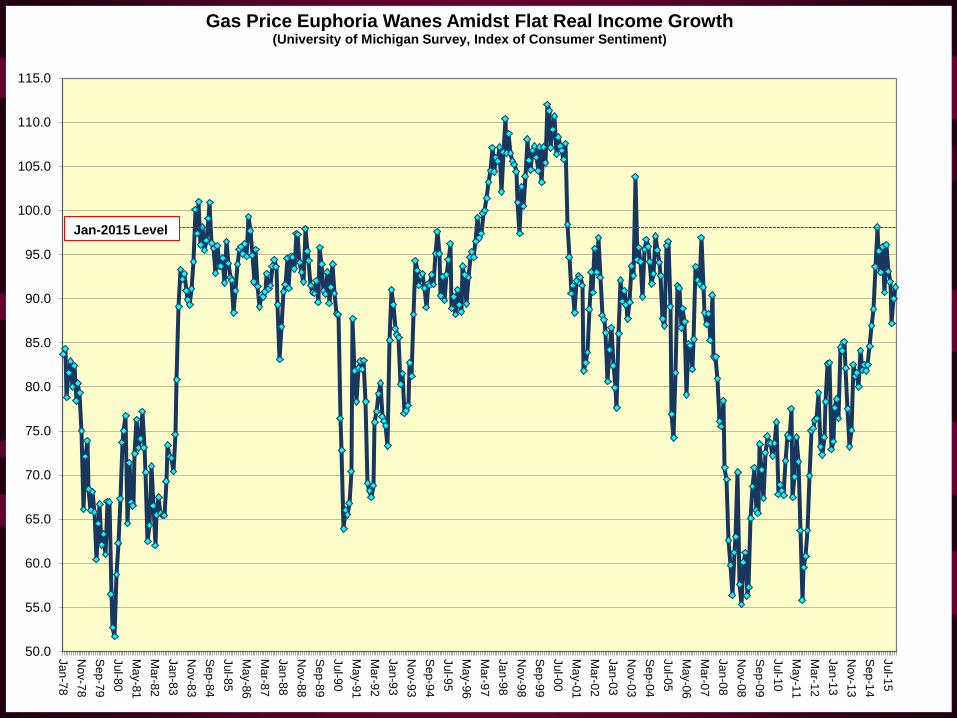
50.0
55.0
60.0
65.0
70.0
75.0
80.0
85.0
90.0
95.0
100.0
105.0
110.0
115.0
Jan
-78
No
v-7
8
Se
p-7
9
Jul-8
0
Ma
y-8
1
Ma
r-82
Jan
-83
No
v-8
3
Se
p-8
4
Jul-8
5
Ma
y-8
6
Ma
r-87
Jan
-88
No
v-8
8
Se
p-8
9
Jul-9
0
Ma
y-9
1
Ma
r-92
Jan
-93
No
v-9
3
Se
p-9
4
Jul-9
5
Ma
y-9
6
Ma
r-97
Jan
-98
No
v-9
8
Se
p-9
9
Jul-0
0
Ma
y-0
1
Ma
r-02
Jan
-03
No
v-0
3
Se
p-0
4
Jul-0
5
Ma
y-0
6
Ma
r-07
Jan
-08
No
v-0
8
Se
p-0
9
Jul-1
0
Ma
y-1
1
Ma
r-12
Jan
-13
No
v-1
3
Se
p-1
4
Jul-1
5
Gas Price Euphoria Wanes Amidst Flat Real Income Growth (University of Michigan Survey, Index of Consumer Sentiment)
Jan-2015 Level
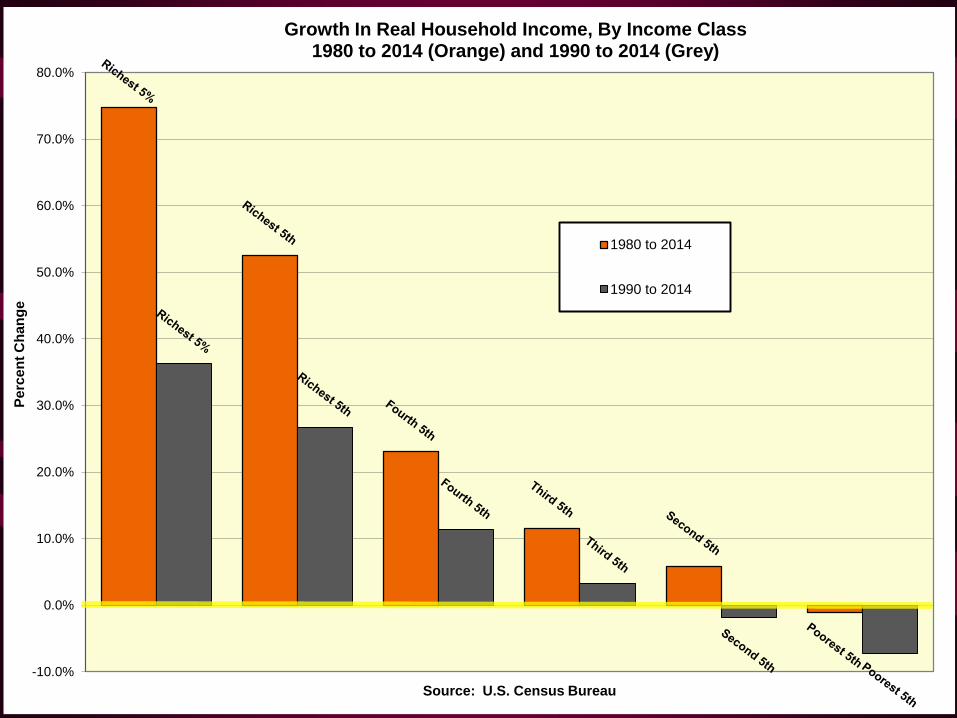
-10.0%
0.0%
10.0%
20.0%
30.0%
40.0%
50.0%
60.0%
70.0%
80.0%
Pe
rce
nt
Ch
an
ge
Source: U.S. Census Bureau
Growth In Real Household Income, By Income Class 1980 to 2014 (Orange) and 1990 to 2014 (Grey)
1980 to 2014
1990 to 2014
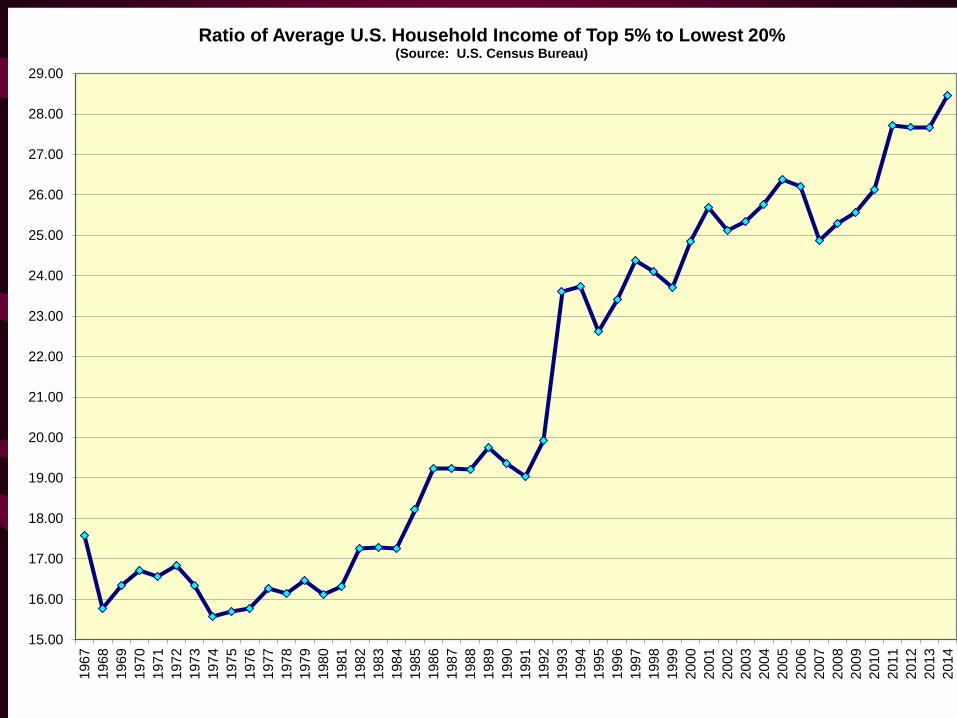
15.00
16.00
17.00
18.00
19.00
20.00
21.00
22.00
23.00
24.00
25.00
26.00
27.00
28.00
29.001
96
7
196
8
196
9
1970
197
1
197
2
197
3
197
4
197
5
197
6
1977
197
8
197
9
198
0
198
1
198
2
198
3
198
4
198
5
198
6
198
7
198
8
198
9
199
0
199
1
199
2
199
3
199
4
199
5
199
6
199
7
199
8
199
9
200
0
200
1
200
2
2003
200
4
200
5
200
6
200
7
200
8
200
9
2010
201
1
201
2
201
3
201
4
Ratio of Average U.S. Household Income of Top 5% to Lowest 20% (Source: U.S. Census Bureau)

-12.0%
-10.0%
-8.0%
-6.0%
-4.0%
-2.0%
0.0%
2.0%
4.0%
6.0%
8.0%
10.0%
12.0%
14.0%
Ja
n-6
6
Ja
n-6
7
Ja
n-6
8
Ja
n-6
9
Ja
n-7
0
Ja
n-7
1
Ja
n-7
2
Ja
n-7
3
Ja
n-7
4
Ja
n-7
5
Ja
n-7
6
Ja
n-7
7
Ja
n-7
8
Ja
n-7
9
Ja
n-8
0
Ja
n-8
1
Ja
n-8
2
Ja
n-8
3
Ja
n-8
4
Ja
n-8
5
Ja
n-8
6
Ja
n-8
7
Ja
n-8
8
Ja
n-8
9
Ja
n-9
0
Ja
n-9
1
Ja
n-9
2
Ja
n-9
3
Ja
n-9
4
Ja
n-9
5
Ja
n-9
6
Ja
n-9
7
Ja
n-9
8
Ja
n-9
9
Ja
n-0
0
Ja
n-0
1
Ja
n-0
2
Ja
n-0
3
Ja
n-0
4
Ja
n-0
5
Ja
n-0
6
Ja
n-0
7
Ja
n-0
8
Ja
n-0
9
Ja
n-1
0
Ja
n-1
1
Ja
n-1
2
Ja
n-1
3
Ja
n-1
4
Ja
n-1
5
Pe
rce
nt
Ch
an
ge
vs
. Y
ea
r A
go
Oil Price Declines and Wage Growth Will Eventually Benefit Consumer Spending
Total Constant Dollar U.S. Retail Sales - Percent Change from Year Ago, Source: U.S. Census Bureau
Series1 6 Month Moving Average (Real U.S. Retail Sales)
Recession
RECESSION
Recession
Recession Recession
Recession
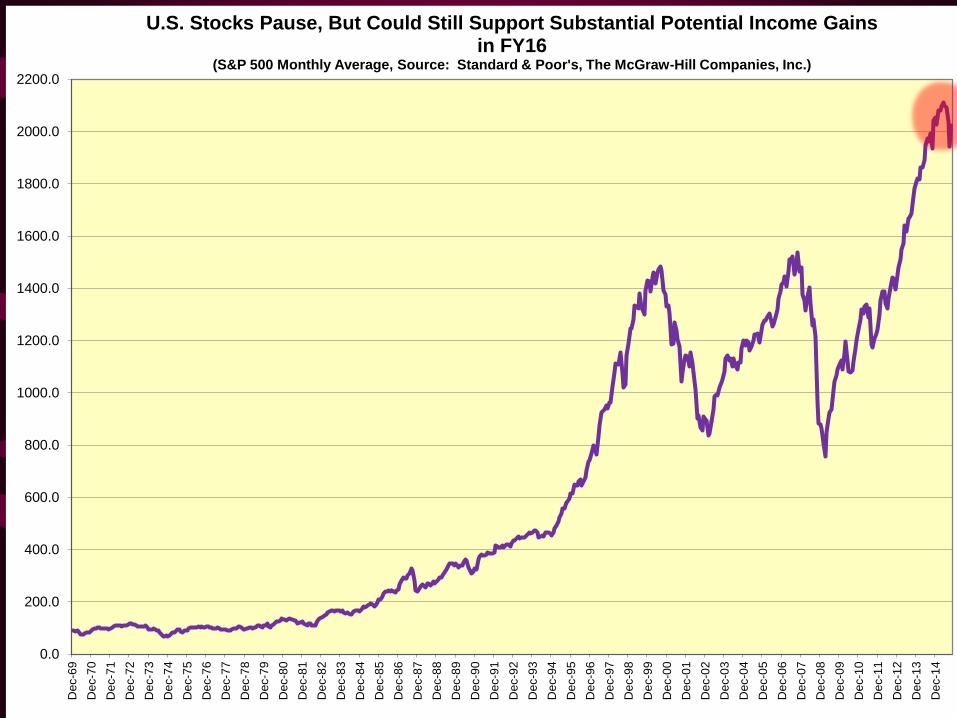
0.0
200.0
400.0
600.0
800.0
1000.0
1200.0
1400.0
1600.0
1800.0
2000.0
2200.0D
ec-6
9
Dec-7
0
Dec-7
1
Dec-7
2
Dec-7
3
Dec-7
4
Dec-7
5
Dec-7
6
Dec-7
7
Dec-7
8
Dec-7
9
Dec-8
0
Dec-8
1
Dec-8
2
Dec-8
3
Dec-8
4
Dec-8
5
Dec-8
6
Dec-8
7
Dec-8
8
Dec-8
9
Dec-9
0
Dec-9
1
Dec-9
2
Dec-9
3
Dec-9
4
Dec-9
5
Dec-9
6
Dec-9
7
Dec-9
8
Dec-9
9
Dec-0
0
Dec-0
1
Dec-0
2
Dec-0
3
Dec-0
4
Dec-0
5
Dec-0
6
Dec-0
7
Dec-0
8
Dec-0
9
Dec-1
0
Dec-1
1
Dec-1
2
Dec-1
3
Dec-1
4
U.S. Stocks Pause, But Could Still Support Substantial Potential Income Gains in FY16
(S&P 500 Monthly Average, Source: Standard & Poor's, The McGraw-Hill Companies, Inc.)
-3.0%
-2.0%
-1.0%
0.0%
1.0%
2.0%
3.0%
4.0%
5.0%
6.0%
7.0%
Jan
-90
Jan
-91
Jan
-92
Jan
-93
Jan
-94
Jan
-95
Jan
-96
Jan-9
7
Jan
-98
Jan
-99
Jan
-00
Jan
-01
Jan
-02
Jan
-03
Jan-0
4
Jan
-05
Jan
-06
Jan
-07
Jan
-08
Jan
-09
Jan
-10
Jan-1
1
Jan
-12
Jan
-13
Jan
-14
Jan
-15
Pe
rce
nt
Ch
an
ge
vs
. Y
ea
r A
go
Policy Flexibility for the Fed: Inflation Is Nonexistent as Energy and Commodity Prices Recede CPI-U - All Items, Source: U.S. Bureau of Labor Statistics

Labor Markets Are Approaching Full
Employment • Total U.S. nonagricultural employment has increased for 61
consecutive months and after losing 8.7M jobs between January 2008 and February 2010, the U.S. economy has now regained more than 13M jobs, averaging more than 230,000 jobs per month during the past 12 months
• Vermont payroll employment finally topped its pre-recession peak in June of 2014 and is currently about 18,500 jobs above its recessionary trough, reached in July of 2009
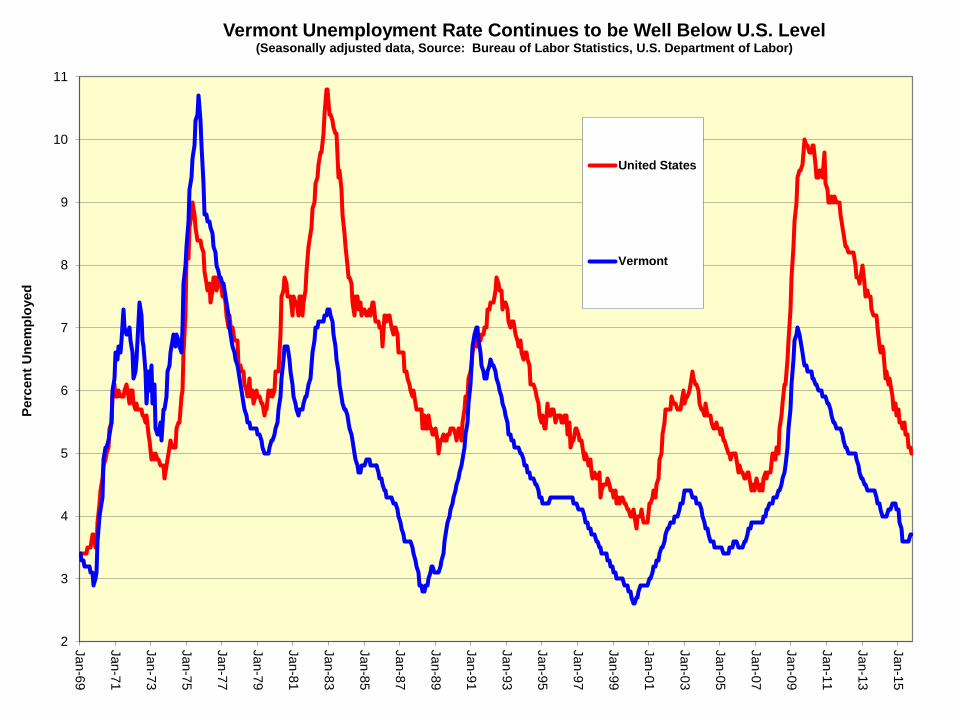
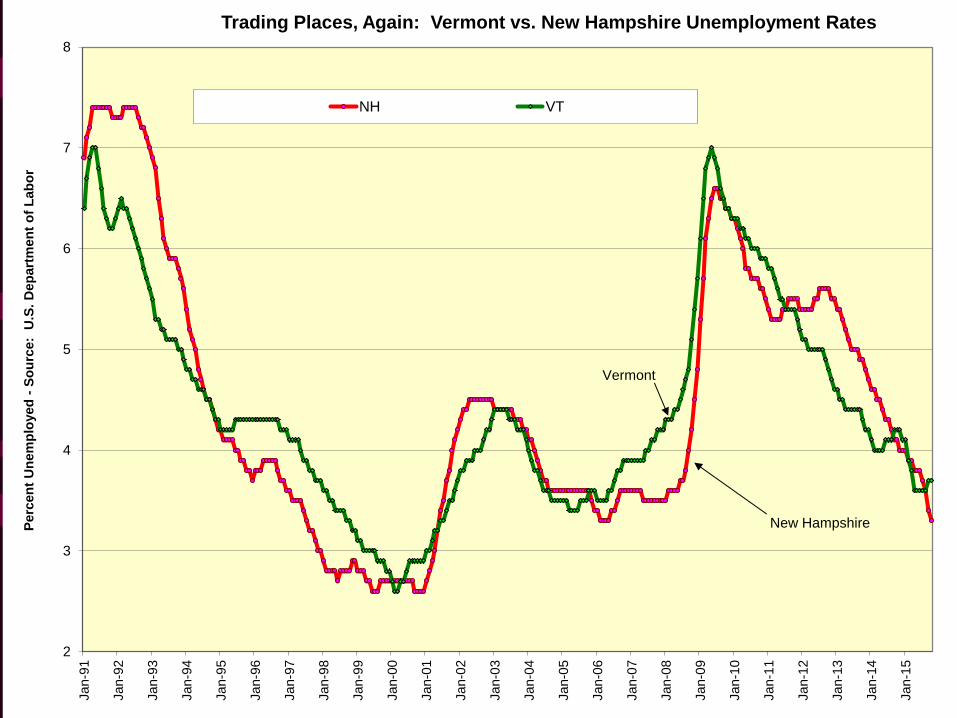
• Vermont’s unemployment rate is still among the top ten U.S. states, at 3.7%, however, it has been surpassed in the last two months in New England by New Hampshire, currently at 3.3%
• Initial Claims for Unemployment Insurance in Vermont dropped to their lowest levels in more than 25 years in September and portend continued improvement in the State labor market
• Real wage and income growth has remained flat or negative for lower income groups, with virtually all recent gains in income accruing to the highest income quintile
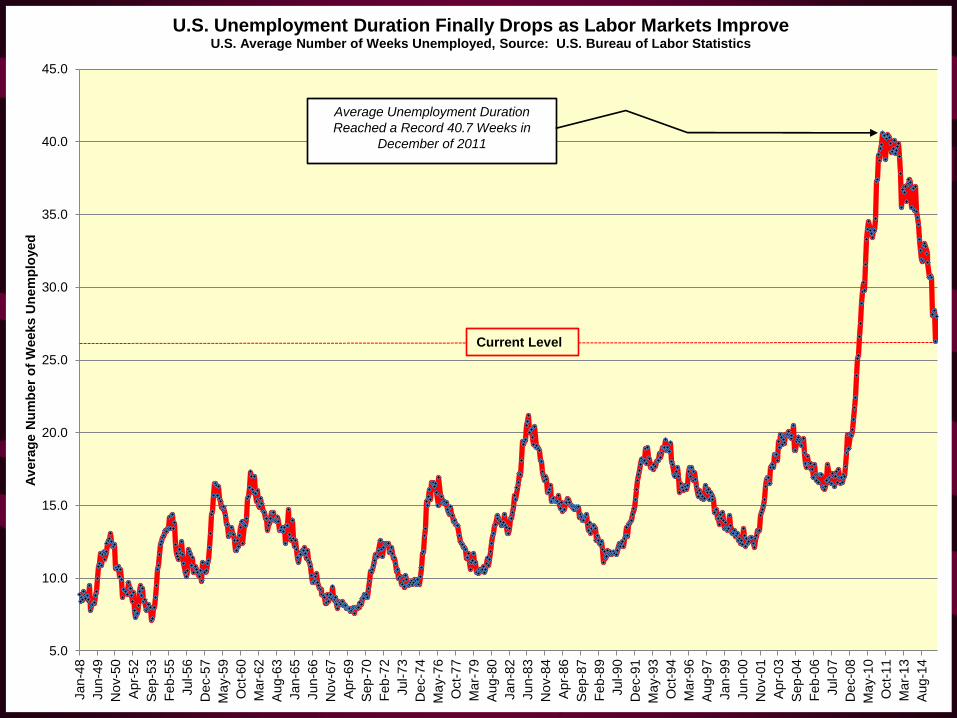
• Although chronic unemployment is reflected in a still elevated share of long-term unemployed workers, almost every measure of unemployment has improved in the last year
2
3
4
5
6
7
8
9
10
11
Jan-6
9
Jan-7
1
Jan-7
3
Jan-7
5
Jan-7
7
Jan-7
9
Jan-8
1
Jan-8
3
Jan-8
5
Jan-8
7
Jan-8
9
Jan-9
1
Jan-9
3
Jan-9
5
Jan-9
7
Jan-9
9
Jan-0
1
Jan-0
3
Jan-0
5
Jan-0
7
Jan-0
9
Jan-1
1
Jan-1
3
Jan-1
5
Perc
en
t U
nem
plo
yed
Vermont Unemployment Rate Continues to be Well Below U.S. Level
(Seasonally adjusted data, Source: Bureau of Labor Statistics, U.S. Department of Labor)
United States
Vermont

6.9%
6.8%
6.6%
6.6%
6.4%
6.2%
6.1%
6.0%
5.9%
5.9%
5.8%
5.7%
5.7%
5.6%
5.6%
5.4%
5.4%
5.3%
5.2%
5.1%
5.1%
5.1%
5.1%
5.1%
5.1%
5.0%
5.0%
4.9%
4.8%
4.6%
4.4%
4.4%
4.4%
4.3%
4.3%
4.3%
4.2%
4.1%
4.1%
4.0%
4.0%
3.8%
3.7%
3.7%
3.6%
3.5%
3.3%
3.3%
3.2%
2.9%
2.8%
0.0% 1.0% 2.0% 3.0% 4.0% 5.0% 6.0% 7.0%
West Virginia
New Mexico
District of Columbia
Nevada
Alaska
Louisiana
Arizona
Oregon
Alabama
Mississippi
California
Georgia
North Carolina
South Carolina
Tennessee
Illinois
New Jersey
Rhode Island
Washington
Arkansas
Connecticut
Delaware
Florida
Maryland
Pennsylvania
Michigan
Missouri
Kentucky
New York
Massachusetts
Indiana
Ohio
Texas
Maine
Oklahoma
Wisconsin
Virginia
Kansas
Montana
Idaho
Wyoming
Colorado
Minnesota
Vermont
Utah
Iowa
Hawaii
New Hampshire
South Dakota
Nebraska
North Dakota
Unemployment Rate by State - October 2015 Seasonally Adjusted Data, Source: U.S. Bureau of Labor Statistics
2
3
4
5
6
7
8
Jan-9
1
Jan-9
2
Jan-9
3
Jan-9
4
Jan-9
5
Jan-9
6
Jan-9
7
Jan-9
8
Jan-9
9
Jan-0
0
Jan-0
1
Jan-0
2
Jan-0
3
Jan-0
4
Jan-0
5
Jan-0
6
Jan-0
7
Jan-0
8
Jan-0
9
Jan-1
0
Jan-1
1
Jan-1
2
Jan-1
3
Jan-1
4
Jan-1
5
Perc
en
t U
nem
plo
yed
- S
ou
rce:
U.S
. D
ep
art
men
t o
f L
ab
or
Trading Places, Again: Vermont vs. New Hampshire Unemployment Rates
NH VT
Vermont
New Hampshire

500
550
600
650
700
750
800
850
900
950
1000
1050
1100
1150
1200
1250
1300
1350
1400
1450
1500
1550
1600Jan
-87
Jan
-88
Jan
-89
Jan
-90
Jan
-91
Jan-9
2
Jan
-93
Jan
-94
Jan
-95
Jan
-96
Jan
-97
Jan
-98
Jan
-99
Jan
-00
Jan
-01
Jan-0
2
Jan
-03
Jan
-04
Jan
-05
Jan
-06
Jan
-07
Jan
-08
Jan
-09
Jan
-10
Jan
-11
Jan-1
2
Jan
-13
Jan
-14
Jan
-15
Ave
rag
e W
ee
kly
Nu
mb
er
of
Cla
ims
Vermont Unemployment Insurance Claims Recede to a 25 Year Low,
Portending Tighter Labor Market Ahead (Average Weekly Initial Claims for Unemployment in Vermont, Seasonally Adjusted, Source: BLS and Boston Fed)
Tropical
Storm
Irene

0
2
4
6
8
10
12
14
16
18Jan-9
4
Jul-
94
Jan-9
5
Jul-
95
Jan-9
6
Jul-
96
Jan-9
7
Jul-
97
Jan-9
8
Jul-
98
Jan-9
9
Ju
l-9
9
Jan-0
0
Jul-
00
Jan-0
1
Jul-
01
Jan-0
2
Jul-
02
Jan-0
3
Jul-
03
Jan-0
4
Jul-
04
Jan-0
5
Jul-
05
Jan-0
6
Jul-
06
Jan-0
7
Jul-
07
Jan-0
8
Jul-
08
Jan-0
9
Jul-
09
Jan-1
0
Jul-
10
Jan-1
1
Jul-
11
Jan-1
2
Ju
l-1
2
Jan-1
3
Jul-
13
Jan-1
4
Jul-
14
Jan-1
5
Jul-
15
Perc
en
t U
nem
plo
yed
More Inclusive U.S. Unemployment Measures Depict Improvement,
as Steady Job Growth Firms Labor Markets Source: U.S. Bureau of Labor Statistics
Most Commonly Cited
"Official" Unemployment
Measure: U3
More Broadly Defined
Unemployment Measure,
Including Underemployed and
Discouraged Workers: U6
Long Term Unemployed: Out of
Work for More Than 6 Months
(and still looking for work)
5.0
10.0
15.0
20.0
25.0
30.0
35.0
40.0
45.0Jan-4
8
Jun-4
9
No
v-5
0
Apr-
52
Sep-5
3
Fe
b-5
5
Jul-5
6
De
c-5
7
Ma
y-5
9
Oct-
60
Ma
r-6
2
Aug-6
3
Jan-6
5
Jun-6
6
No
v-6
7
Apr-
69
Sep-7
0
Feb
-72
Jul-7
3
De
c-7
4
Ma
y-7
6
Oct-
77
Ma
r-7
9
Aug-8
0
Jan-8
2
Jun-8
3
No
v-8
4
Apr-
86
Sep-8
7
Feb
-89
Jul-9
0
De
c-9
1
Ma
y-9
3
Oct-
94
Ma
r-9
6
Aug-9
7
Jan-9
9
Jun-0
0
No
v-0
1
Apr-
03
Sep-0
4
Feb
-06
Jul-0
7
De
c-0
8
Ma
y-1
0
Oct-
11
Ma
r-1
3
Aug-1
4
Av
era
ge N
um
ber
of
Weeks U
nem
plo
yed
U.S. Unemployment Duration Finally Drops as Labor Markets Improve
U.S. Average Number of Weeks Unemployed, Source: U.S. Bureau of Labor Statistics
Average Unemployment Duration
Reached a Record 40.7 Weeks in
December of 2011
Current Level

0.80
0.85
0.90
0.95
1.00
1.05
1.10
1.15
1.20
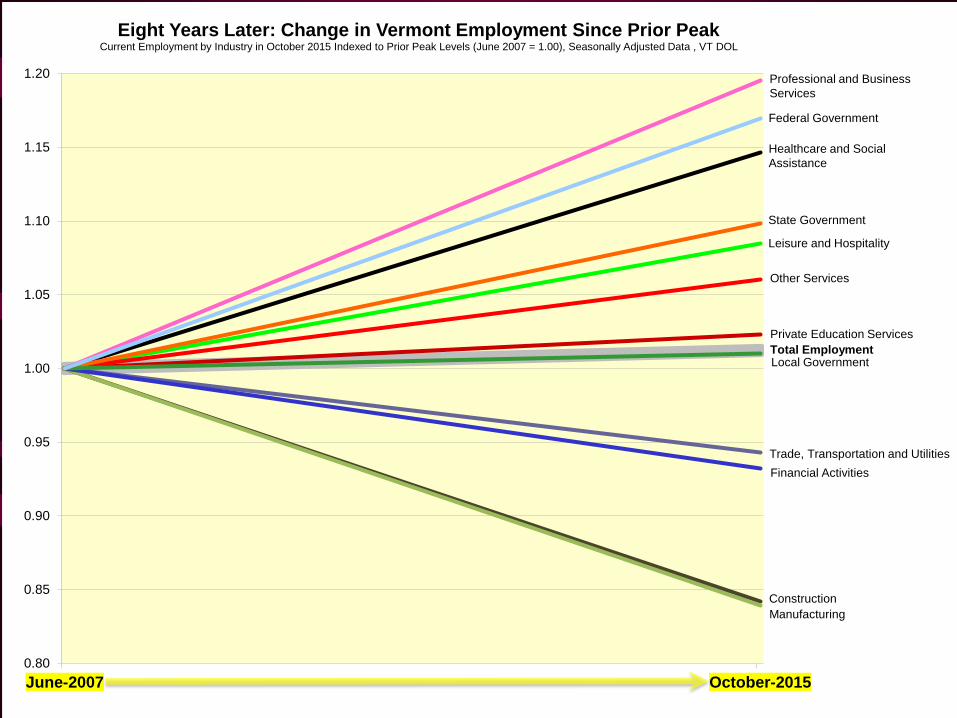
June-2007 October-2015
Eight Years Later: Change in Vermont Employment Since Prior Peak Current Employment by Industry in October 2015 Indexed to Prior Peak Levels (June 2007 = 1.00), Seasonally Adjusted Data , VT DOL
Trade,,Transportation and Utilities
Financial Activities
Construction
Manufacturing
Private Education Services
Other Services
Leisure and Hospitality
Federal Government
Healthcare and Social
Assistance
Professional and Business
Services
State Government
Local Government Total Employment
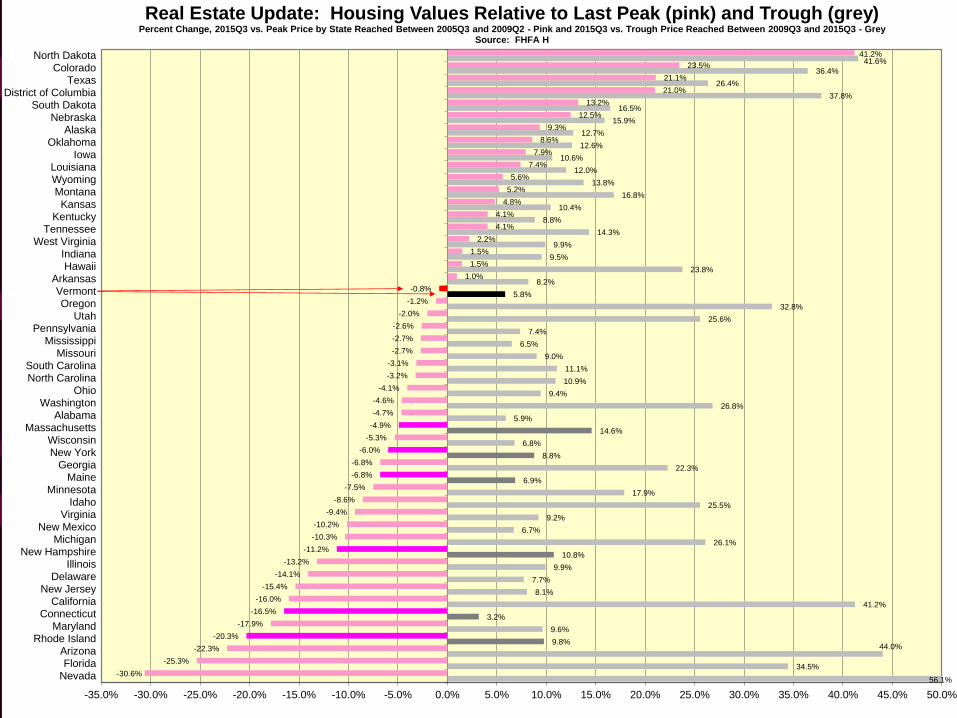
Real Estate Markets have Bottomed Out
but Full Recovery is Still Elusive • Real estate markets are characterized by pronounced cyclicality and regional variation
• For the sixth consecutive quarter, housing prices increased on a year over year basis
in every U.S. state. As of the third quarter of 2015 (the most recent available), 19
states equaled or exceeded their pre-recession peak levels (ND, DC, TX, CO, SD,
NE, AK, IA, OK, LA, WY, KY, KS, MT, TN, WV, IN, HI and AR)
• Vermont is the closest New England state to exceeding its pre-recession valuations,
currently just 0.8% shy of this. The next closest NE state is Massachusetts, which,
despite recovering 15% above its recessionary low, is still about 5% below its prior
peak. Continued home price weakness in surrounding regional states, especially CT,
MA, NY and NJ, will affect second home markets in Vermont, via wealth effects
• Real estate markets attracting international investment – especially large US cities -
have experienced some of the strongest price appreciation of late
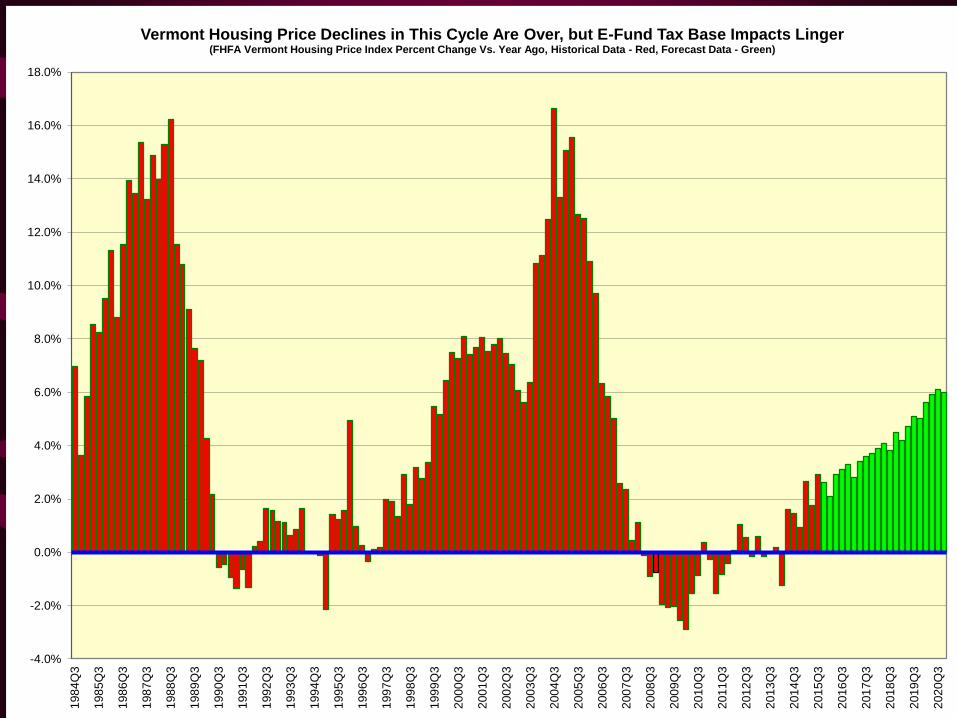
• As previously forecast, the Vermont Property Tax base (Grand List) will not exceed
2009 peak levels until 2017, putting continued pressure on tax rates to cover rising
education costs
34.5%
44.0% 9.8%
9.6%
3.2%
41.2%
8.1%
7.7%
9.9%
10.8%
26.1%
6.7%
9.2%
25.5%
17.9%
6.9%
22.3%
8.8%
6.8%
14.6%
5.9%
26.8%
9.4%
10.9%
11.1%
9.0%
6.5%
7.4%
25.6%
32.8%
5.8%
8.2%
23.8%
9.5%
9.9%
14.3%
8.8%
10.4%
16.8%
13.8%
12.0%
10.6%
12.6%
12.7%
15.9%
16.5%
37.8%
26.4%
36.4%
41.6%
-30.6%
-25.3%
-22.3%
-20.3%
-17.9%
-16.5%
-16.0%
-15.4%
-14.1%
-13.2%
-11.2%
-10.3%
-10.2%
-9.4%
-8.6%
-7.5%
-6.8%
-6.8%
-6.0%
-5.3%
-4.9%
-4.7%
-4.6%
-4.1%
-3.2%
-3.1%
-2.7%
-2.7%
-2.6%
-2.0%
-1.2%
-0.8%
1.0%
1.5%
1.5%
2.2%
4.1%
4.1%
4.8%
5.2%
5.6%
7.4%
7.9%
8.6%
9.3%
12.5%
13.2%
21.0%
21.1%
23.5%
41.2%
-35.0% -30.0% -25.0% -20.0% -15.0% -10.0% -5.0% 0.0% 5.0% 10.0% 15.0% 20.0% 25.0% 30.0% 35.0% 40.0% 45.0% 50.0%
NevadaFlorida
ArizonaRhode Island
MarylandConnecticut
CaliforniaNew Jersey
DelawareIllinois
New HampshireMichigan
New MexicoVirginia
IdahoMinnesota
MaineGeorgia
New YorkWisconsin
MassachusettsAlabama
WashingtonOhio
North CarolinaSouth Carolina
MissouriMississippi
PennsylvaniaUtah
OregonVermont
ArkansasHawaii
IndianaWest Virginia
TennesseeKentucky
KansasMontanaWyomingLouisiana
IowaOklahoma
AlaskaNebraska
South DakotaDistrict of Columbia
TexasColorado
North Dakota
Real Estate Update: Housing Values Relative to Last Peak (pink) and Trough (grey) Percent Change, 2015Q3 vs. Peak Price by State Reached Between 2005Q3 and 2009Q2 - Pink and 2015Q3 vs. Trough Price Reached Between 2009Q3 and 2015Q3 - Grey
Source: FHFA H
56.1%
-4.0%
-2.0%
0.0%
2.0%
4.0%
6.0%
8.0%
10.0%
12.0%
14.0%
16.0%
18.0%1
98
4Q
3
198
5Q
3
198
6Q
3
198
7Q
3
198
8Q
3
198
9Q
3
199
0Q
3
199
1Q
3
199
2Q
3
199
3Q
3
199
4Q
3
199
5Q
3
199
6Q
3
199
7Q
3
199
8Q
3
199
9Q
3
200
0Q
3
200
1Q
3
200
2Q
3
200
3Q
3
200
4Q
3
200
5Q
3
200
6Q
3
200
7Q
3
200
8Q
3
200
9Q
3
201
0Q
3
201
1Q
3
201
2Q
3
201
3Q
3
201
4Q
3
201
5Q
3
201
6Q
3
201
7Q
3
201
8Q
3
201
9Q
3
202
0Q
3
Vermont Housing Price Declines in This Cycle Are Over, but E-Fund Tax Base Impacts Linger (FHFA Vermont Housing Price Index Percent Change Vs. Year Ago, Historical Data - Red, Forecast Data - Green)

66.7
118.1
169.4
220.7
272.1
323.4
374.7
426.1
477.4
528.7
580.1
5.0
15.0
25.0
35.0
45.0
55.0
65.0
75.0
85.0
95.0
105.0
19
79
19
80
19
81
19
82
19
83
19
84
19
85
19
86
19
87
19
88
19
89
19
90
19
91
19
92
19
93
19
94
19
95
19
96
19
97
19
98
19
99
20
00
20
01
20
02
20
03
20
04
20
05
20
06
20
07
20
08
20
09
20
10
20
11
20
12
20
13
20
14
20
15
20
16
20
17
20
18
20
19
20
20
Ho
me
Pri
ce
In
de
x, 1
98
0Q
1=
10
0
Eq
ua
lize
d E
du
ca
tio
n G
ran
d L
ist
- B
illi
on
s o
f D
oll
ars
Sources: Vermont PVR; U.S. FHFA; Prepared for the Joint Fiscal Office by Kavet, Rockler & Associates, October 2014
Vermont Adjusted Equalized Education Grand List (thick red line, left scale) Vs. FHFA Vermont Home Price Index, (Index 1980Q1 = 100)
Lagged Five Quarters (thin green line, right scale)
FORECAST
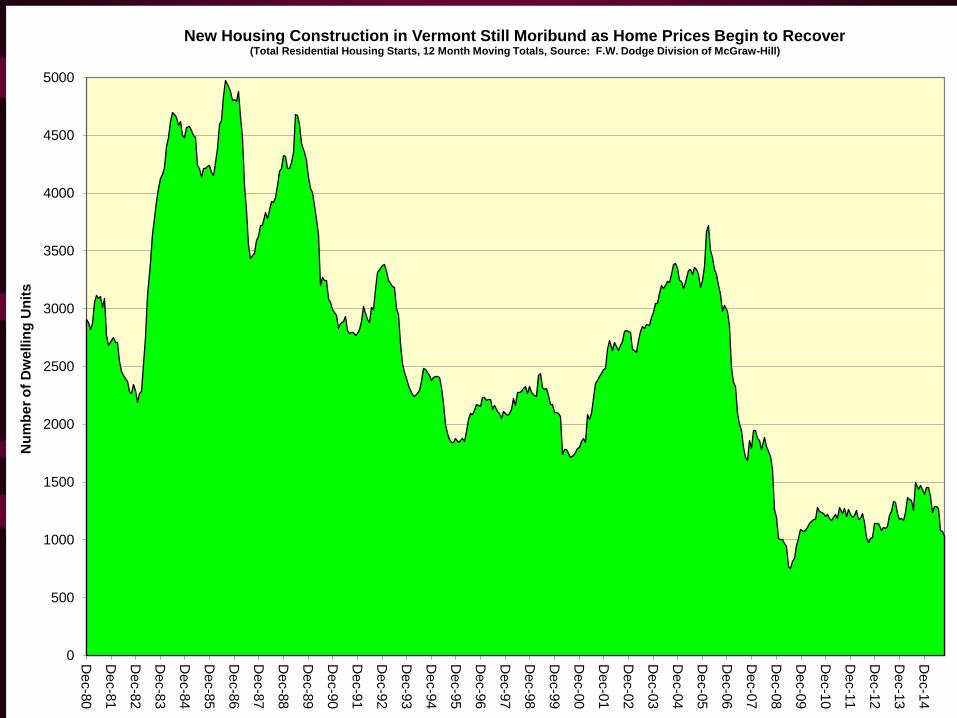
0
500
1000
1500
2000
2500
3000
3500
4000
4500
5000
De
c-8
0
De
c-8
1
De
c-8
2
De
c-8
3
Dec-8
4
Dec-8
5
De
c-8
6
De
c-8
7
De
c-8
8
De
c-8
9
De
c-9
0
De
c-9
1
De
c-9
2
De
c-9
3
De
c-9
4
Dec-9
5
De
c-9
6
De
c-9
7
De
c-9
8
De
c-9
9
De
c-0
0
De
c-0
1
De
c-0
2
De
c-0
3
De
c-0
4
De
c-0
5
Dec-0
6
De
c-0
7
De
c-0
8
De
c-0
9
De
c-1
0
De
c-1
1
De
c-1
2
De
c-1
3
De
c-1
4N
um
be
r o
f D
we
llin
g U
nit
s
New Housing Construction in Vermont Still Moribund as Home Prices Begin to Recover (Total Residential Housing Starts, 12 Month Moving Totals, Source: F.W. Dodge Division of McGraw-Hill)

The Economy is About People:
Vermont Demographics
• A major new State demographic analysis is currently being undertaken by JFO and Administration economists, using detailed, and previously unavailable, Health Department data at the Town level. Output from this analysis should be available within the next year
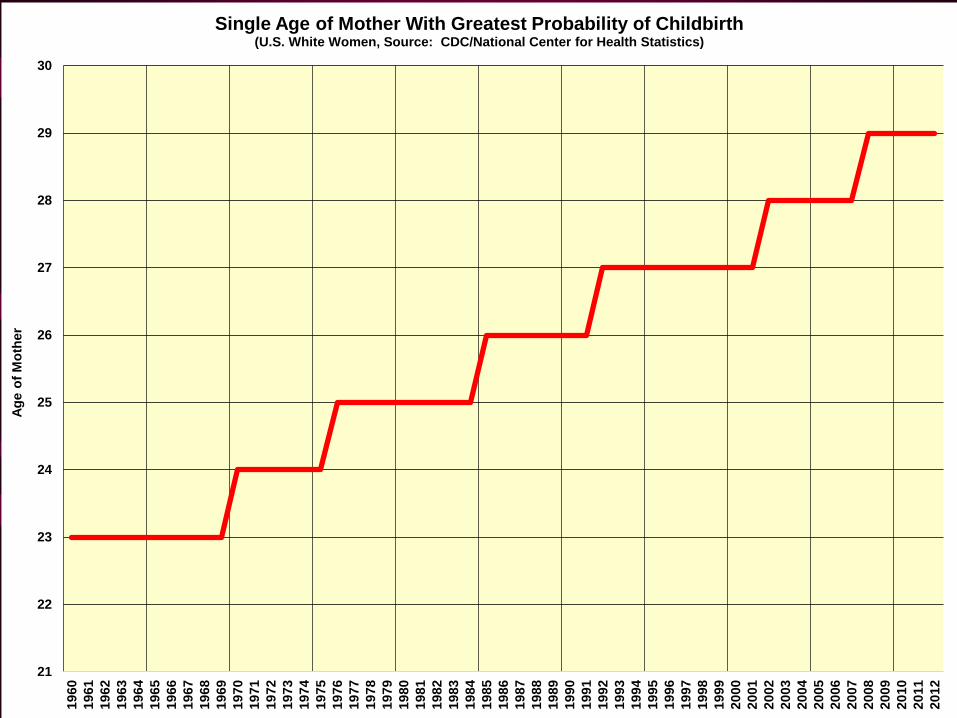
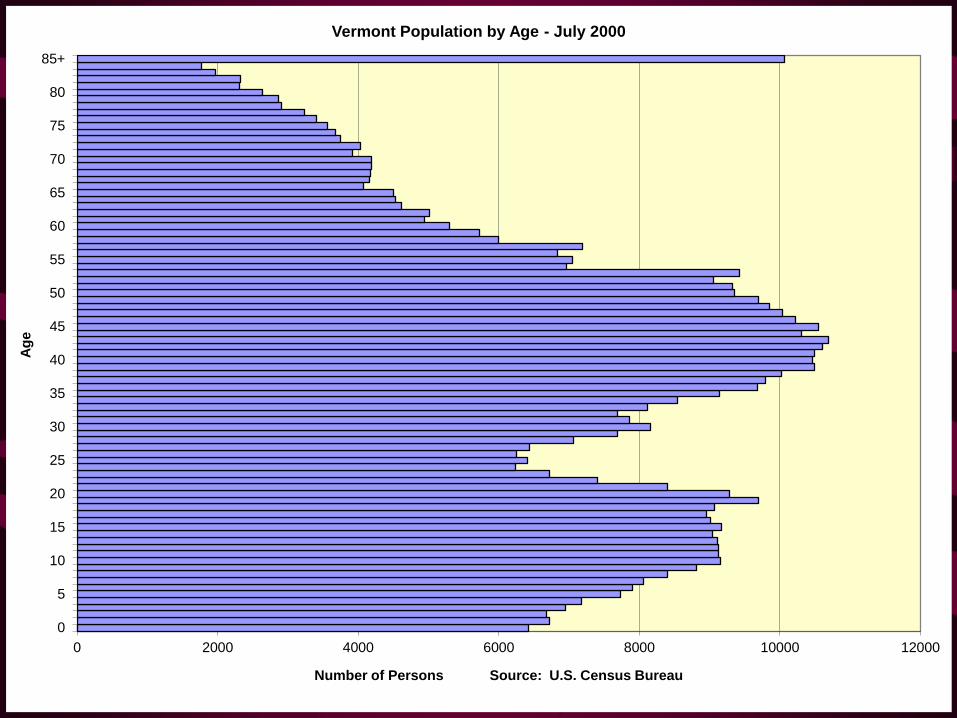
• The movement over time of the “baby-boom” population bulge continues to dominate VT and U.S. demographics, and is responsible for the aging profile of both. The children of this large cohort, referred to as the “baby-boom echo,” represents a much more diffuse wave, as families have fewer children and at older ages
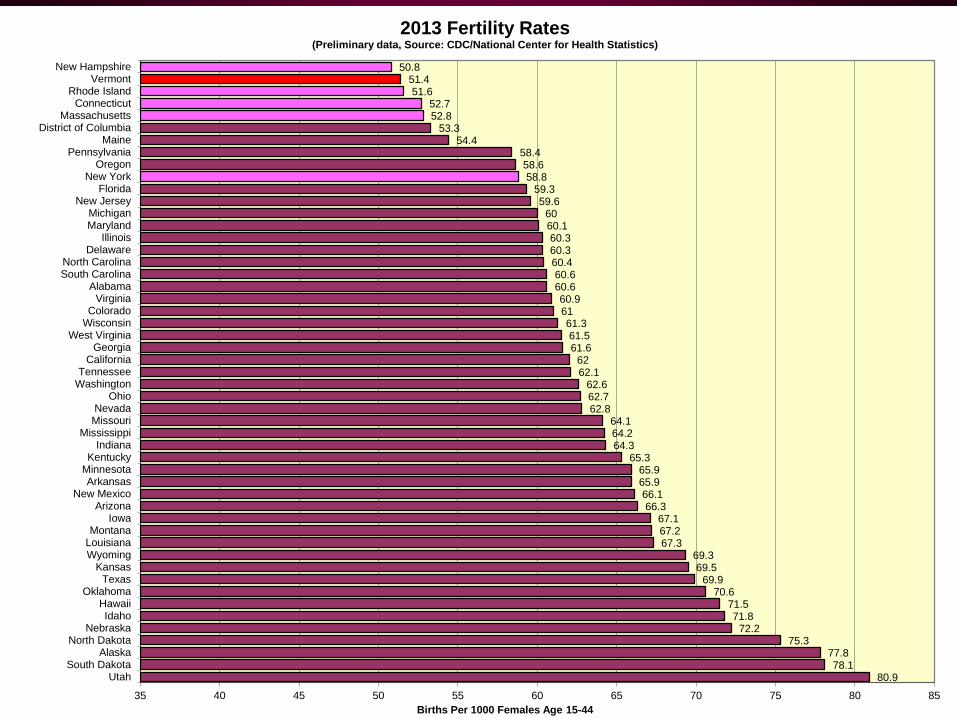
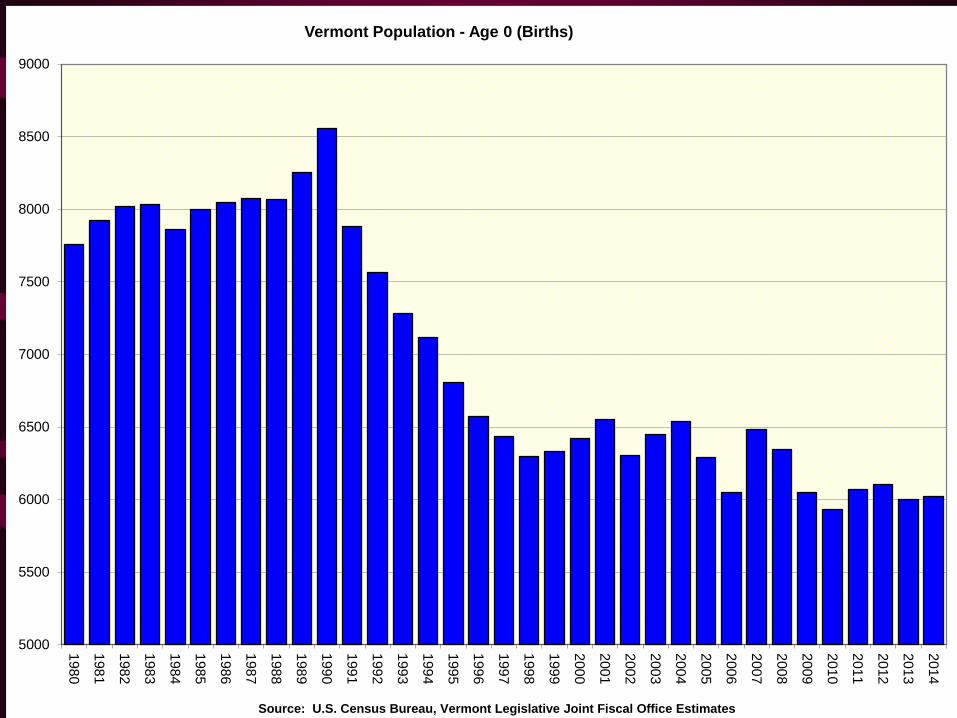
• Significant declines in fertility rates in the past 20 years have dropped Vermont births from about 8,000 per year in the early 1990’s to about 6,000 per year at present
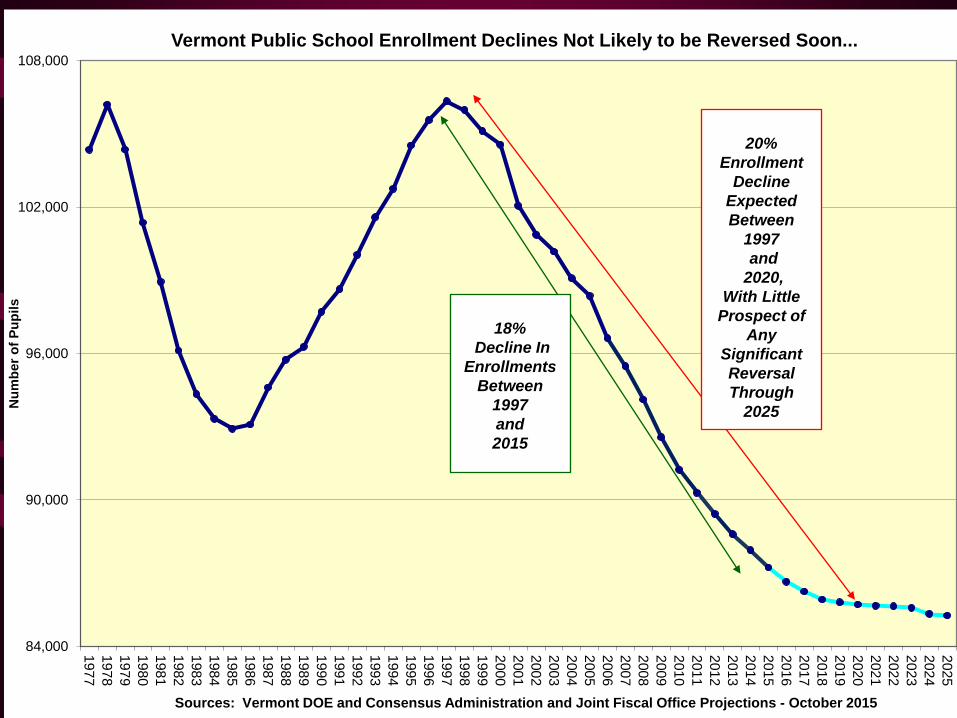
• In addition to the large declines in enrollments experienced in the State over the past 20 years, these two demographic events have (since 2011) and will combine to create declines in the prime working age population, ages 25-64 over the next 20 years. This, in turn, will affect employment, earned income and selected tax revenues in the State
80.9 78.1
77.8 75.3
72.2 71.8
71.5 70.6
69.9 69.5
69.3 67.3 67.2 67.1
66.3 66.1
65.9 65.9
65.3 64.3 64.2 64.1
62.8 62.7 62.6
62.1 62
61.6 61.5
61.3 61 60.9
60.6 60.6
60.4 60.3 60.3
60.1 60
59.6 59.3
58.8 58.6
58.4 54.4
53.3 52.8 52.7
51.6 51.4
50.8
35 40 45 50 55 60 65 70 75 80 85
UtahSouth Dakota
AlaskaNorth Dakota
NebraskaIdaho
HawaiiOklahoma
TexasKansas
WyomingLouisianaMontana
IowaArizona
New MexicoArkansas
MinnesotaKentucky
IndianaMississippi
MissouriNevada
OhioWashingtonTennessee
CaliforniaGeorgia
West VirginiaWisconsinColorado
VirginiaAlabama
South CarolinaNorth Carolina
DelawareIllinois
MarylandMichigan
New JerseyFlorida
New YorkOregon
PennsylvaniaMaine
District of ColumbiaMassachusetts
ConnecticutRhode Island
VermontNew Hampshire
Births Per 1000 Females Age 15-44
2013 Fertility Rates (Preliminary data, Source: CDC/National Center for Health Statistics)
5000
5500
6000
6500
7000
7500
8000
8500
9000
198
0
198
1
198
2
198
3
198
4
198
5
198
6
198
7
198
8
198
9
199
0
199
1
199
2
199
3
1994
1995
1996
1997
1998
1999
2000
2001
2002
2003
2004
2005
200
6
200
7
200
8
200
9
201
0
201
1
201
2
201
3
201
4
Source: U.S. Census Bureau, Vermont Legislative Joint Fiscal Office Estimates
Vermont Population - Age 0 (Births)
21
22
23
24
25
26
27
28
29
3019
60
19
61
19
62
19
63
19
64
19
65
19
66
19
67
19
68
19
69
19
70
19
71
19
72
19
73
19
74
19
75
19
76
19
77
19
78
19
79
19
80
19
81
19
82
19
83
19
84
19
85
19
86
19
87
19
88
19
89
19
90
19
91
19
92
19
93
19
94
19
95
19
96
19
97
19
98
19
99
20
00
20
01
20
02
20
03
20
04
20
05
20
06
20
07
20
08
20
09
20
10
20
11
20
12
Ag
e o
f M
oth
er
Single Age of Mother With Greatest Probability of Childbirth (U.S. White Women, Source: CDC/National Center for Health Statistics)
84,000
90,000
96,000
102,000
108,000
197
7
197
8
197
9
198
0
198
1
198
2
198
3
198
4
198
5
198
6
198
7
198
8
198
9
199
0
199
1
199
2
199
3
199
4
199
5
199
6
199
7
199
8
199
9
200
0
200
1
200
2
200
3
200
4
200
5
200
6
200
7
200
8
200
9
201
0
201
1
201
2
201
3
201
4
201
5
201
6
201
7
201
8
201
9
202
0
202
1
202
2
2023
2024
2025
Nu
mb
er
of
Pu
pils
Sources: Vermont DOE and Consensus Administration and Joint Fiscal Office Projections - October 2015
Vermont Public School Enrollment Declines Not Likely to be Reversed Soon...
18%
Decline In
Enrollments
Between
1997
and
2015
20%
Enrollment
Decline
Expected
Between
1997
and
2020,
With Little
Prospect of
Any
Significant
Reversal
Through
2025

0 2000 4000 6000 8000 10000 12000
0
5
10
15
20
25
30
35
40
45
50
55
60
65
70
75
80
85+
Number of Persons Source: U.S. Census Bureau
Ag
e
Vermont Population by Age - July 1980

0 2000 4000 6000 8000 10000 12000
0
5
10
15
20
25
30
35
40
45
50
55
60
65
70
75
80
85+
Number of Persons Source: U.S. Census Bureau
Ag
e
Vermont Population by Age - July 1990
0 2000 4000 6000 8000 10000 12000
0
5
10
15
20
25
30
35
40
45
50
55
60
65
70
75
80
85+
Number of Persons Source: U.S. Census Bureau
Ag
e
Vermont Population by Age - July 2000

0 2000 4000 6000 8000 10000 12000
0
5
10
15
20
25
30
35
40
45
50
55
60
65
70
75
80
85+
Number of Persons Source: U.S. Census Bureau
Ag
e
Vermont Population by Age - July 2010
Age 85+ = 12,874

0 2000 4000 6000 8000 10000 12000
0
5
10
15
20
25
30
35
40
45
50
55
60
65
70
75
80
85+
Number of Persons Source: U.S. Census Bureau
Ag
e
Vermont Population by Age - July 2020
Age 85+ = 16,320

-1.50%
-1.00%
-0.50%
0.00%
0.50%
1.00%
1.50%
2.00%
2.50%
3.00%
Perc
en
t C
han
ge v
s. Y
ear-
Ag
o
Prime Working Age Population Growth vs. Total Population Growth in Vermont
Total Population
Ages 25 to 64
$0
$10,000
$20,000
$30,000
$40,000
$50,000
$60,000
$70,000
$80,000
17 19 21 23 25 27 29 31 33 35 37 39 41 43 45 47 49 51 53 55 57 59 61 63 65 67 69 71 73 75 77 79 81 83 85
Ad
jus
ted
Gro
ss
In
co
me
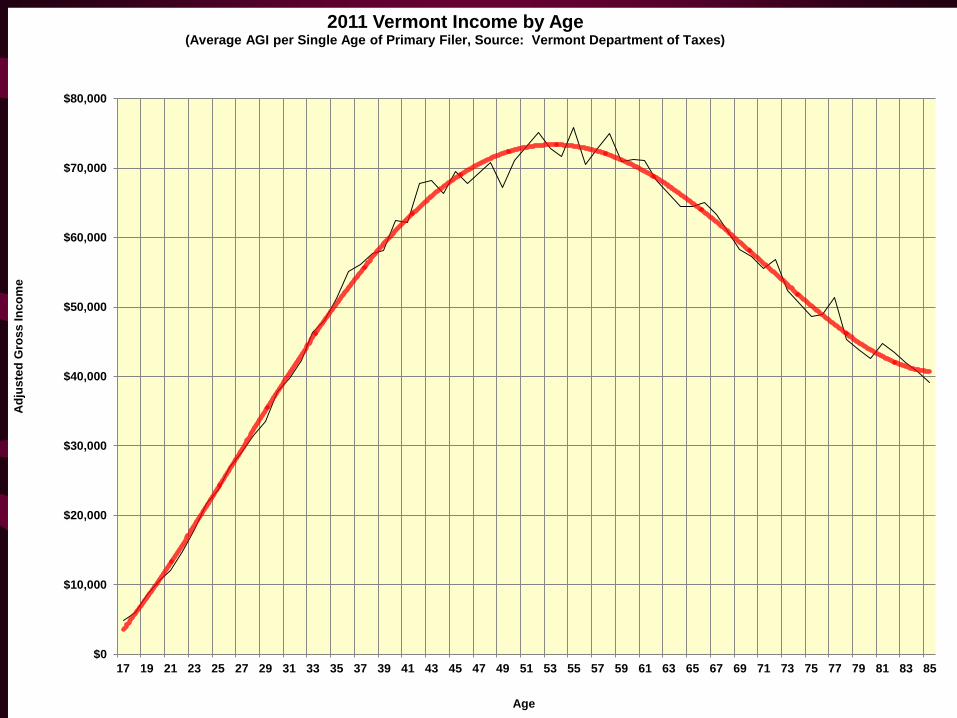
Age
2011 Vermont Income by Age (Average AGI per Single Age of Primary Filer, Source: Vermont Department of Taxes)

Forecast Risks Remain
• The age and tenuity of the recovery makes the current expansion more susceptible to external shocks, such as severe weather, Fed miscalculation and other policy mistakes, and external global economic crises (especially emanating from China and other emerging countries), including military conflict
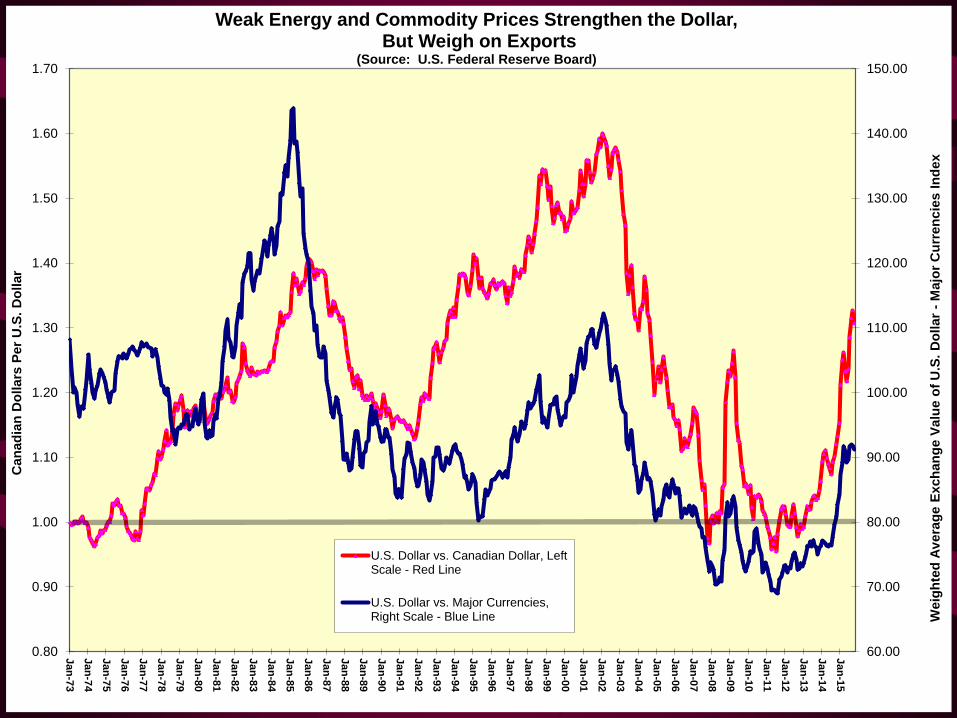
• Prominent near-term hazards include continued strengthening of the U.S. dollar and attendant export weakness and domestic industrial stress. Vermont has already experienced a 24% decline in exports over the past three years, during this period of rising exchange rates. The exchange rate with Canada, our largest trading partner, has been particularly impacted, rising more than 35%
• Slumping productivity growth of late threatens to limit non-inflationary potential economic growth to under 1%. New business formations, despite ample credit, are also abnormally low – only slightly above recessionary lows. Unless these important components of economic health recover, it could cripple future growth
• Widening income distribution inequality in the U.S. will dampen demand and slow growth relative to “normal” demographic-based indicators
• The rapid recent rise in equity markets could make them vulnerable to correction and amplify impacts from other negative events affecting market valuations and/or psychology

-30.0%
-20.0%
-10.0%
0.0%
10.0%
20.0%
30.0%
40.0%
50.0%
60.0%
196
0Q
1
196
1Q
3
196
3Q
1
196
4Q
3
196
6Q
1
196
7Q
3
196
9Q
1
197
0Q
3
1972Q
1
1973Q
3
1975Q
1
197
6Q
3
197
8Q
1
197
9Q
3
198
1Q
1
198
2Q
3
198
4Q
1
198
5Q
3
198
7Q
1
198
8Q
3
199
0Q
1
199
1Q
3
199
3Q
1
199
4Q
3
199
6Q
1
1997Q
3
1999Q
1
200
0Q
3
200
2Q
1
200
3Q
3
200
5Q
1
200
6Q
3
200
8Q
1
200
9Q
3
201
1Q
1
201
2Q
3
201
4Q
1
Pe
rce
nt
Ch
an
ge
Vs
. Y
ea
r A
go
(T
rou
gh
to
Pe
ak
Pe
rce
nt
Ch
an
ge
in
Bu
bb
les
)
Running Out of Steam? Corporate Profit Growth Slows as Recovery Ages U.S. corporate profits with inventory valuation and capital consumption adjustment; Source: US BEA;
Data in bubbles indicate number of consecutive quarters of growth and trough to peak p
20 Q
+118% 12 Q
+63%
12 Q
+66% 18 Q
+111%
22 Q
+91%
10 Q
+32% 29 Q
+115%
17Q
+111%
60.00
70.00
80.00
90.00
100.00
110.00
120.00
130.00
140.00
150.00
0.80
0.90
1.00
1.10
1.20
1.30
1.40
1.50
1.60
1.70
Jan
-73
Jan
-74
Jan
-75
Jan
-76
Jan
-77
Jan
-78
Jan
-79
Jan
-80
Jan
-81
Jan
-82
Jan
-83
Jan
-84
Jan
-85
Jan
-86
Jan
-87
Jan
-88
Jan
-89
Jan
-90
Jan
-91
Jan
-92
Jan
-93
Jan
-94
Jan
-95
Jan
-96
Jan
-97
Jan
-98
Jan
-99
Jan
-00
Jan
-01
Jan
-02
Jan
-03
Jan
-04
Jan
-05
Jan
-06
Jan
-07
Jan
-08
Jan
-09
Jan
-10
Jan
-11
Jan
-12
Jan
-13
Jan
-14
Jan
-15
Weig
hte
d A
vera
ge E
xch
an
ge V
alu
e o
f U
.S.
Do
llar
- M
ajo
r C
urr
en
cie
s I
nd
ex
Can
ad
ian
Do
llars
Per
U.S
. D
ollar
Weak Energy and Commodity Prices Strengthen the Dollar, But Weigh on Exports
(Source: U.S. Federal Reserve Board)
U.S. Dollar vs. Canadian Dollar, LeftScale - Red Line
U.S. Dollar vs. Major Currencies,Right Scale - Blue Line

0.0%
3.0%
6.0%
9.0%
12.0%
15.0%
18.0%
21.0%
24.0%
27.0%
30.0%
33.0%
36.0%
39.0%
42.0%
45.0%
48.0%
51.0%
54.0%
57.0%
60.0%
63.0%
66.0%
69.0%
72.0%
2250
2500
2750
3000
3250
3500
3750
4000
4250
4500
4750
199
7Q
4
199
8Q
2
199
8Q
4
199
9Q
2
199
9Q
4
200
0Q
2
200
0Q
4
200
1Q
2
200
1Q
4
200
2Q
2
200
2Q
4
200
3Q
2
200
3Q
4
200
4Q
2
200
4Q
4
200
5Q
2
200
5Q
4
200
6Q
2
200
6Q
4
200
7Q
2
200
7Q
4
200
8Q
2
200
8Q
4
200
9Q
2
200
9Q
4
201
0Q
2
201
0Q
4
201
1Q
2
201
1Q
4
201
2Q
2
201
2Q
4
201
3Q
2
201
3Q
4
201
4Q
2
Sh
are
of
Verm
on
t E
xp
ort
s t
o C
an
ad
a a
nd
Ch
ina -
4 Q
uart
er
Mo
vin
g T
ota
ls
To
tal V
T E
xp
ort
s -
Millio
ns o
f D
ollars
- 4
Qu
art
er
Mo
vin
g T
ota
ls
Canada and China Account for About 65% of All Vermont Exports (Source: World Institute of Strategic Economic Research, Federal Reseve Bank of Boston)
Total Vermont Exports - Left Scale
Canadian Share of VT Exports - Right Scale
China Share of Vermont Exports - Right Scale
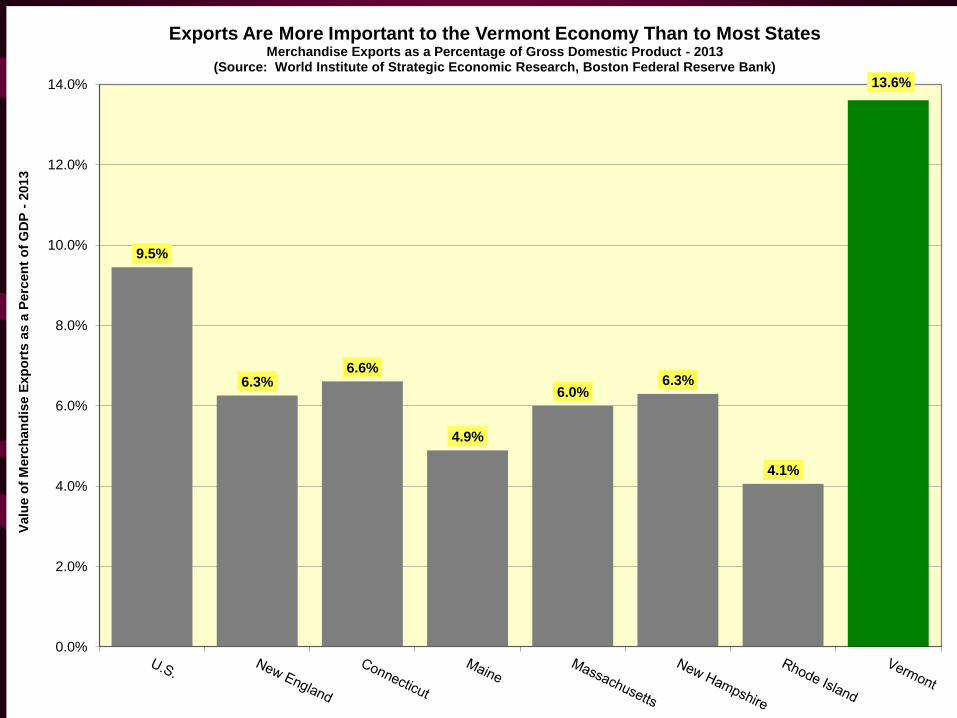
9.5%
6.3% 6.6%
4.9%
6.0% 6.3%
4.1%
13.6%
0.0%
2.0%
4.0%
6.0%
8.0%
10.0%
12.0%
14.0%
Valu
e o
f M
erc
han
dis
e E
xp
ort
s a
s a
Perc
en
t o
f G
DP
- 2
013
Exports Are More Important to the Vermont Economy Than to Most States Merchandise Exports as a Percentage of Gross Domestic Product - 2013
(Source: World Institute of Strategic Economic Research, Boston Federal Reserve Bank)


For Further Information, Contact
The Vermont Joint Fiscal Office or:
Thomas E. Kavet, President
Dr. Nicolas O. Rockler, CEO
State Economist and Principal Economic Advisor to the Vermont State Legislature Since 1996
Kavet, Rockler & Associates, LLC
Economic and Public Policy Consulting
985 Grandview Road Williamstown, Vermont 05679-9003 USA Telephone: 802-433-1360 Facsimile: 866-433-1360 Cellular: 802-433-1111 Website: www.kavetrockler.com E-Mail: [email protected]