economic and social impact of cultural and creative sectors
TRANSCRIPT

1
G20 ROME GUIDELINES FOR THE FUTURE OF TOURISM
Economic and social impact of cultural and creative sectors
Note for Italy G20 Presidency Culture Working Group

| 1
ECONOMIC AND SOCIAL IMPACT OF CULTURAL AND CREATIVE SECTORS © OECD 2021
Economic and social impact of cultural and creative sectors
Note for Italy G20 Presidency Culture Working Group
PUBE

2 |
ECONOMIC AND SOCIAL IMPACT OF CULTURAL AND CREATIVE SECTORS © OECD 2021
Cultural and creative sectors are a significant source of jobs and income, and also generate important spillovers to the wider economy. They are a driver of innovation, a source of creative skills with strong backward and forward linkages in the economy, and act as a magnet that helps drive growth in other sectors such as tourism. Beyond their economic impacts, they also have significant social impacts, from supporting health and well-being, to promoting social inclusion and local social capital. However, the absence of internationally comparable statistics that reveal their full economic and social impacts also means that the sectors remain largely undervalued in the policy debate.
As governments across the G20 reconsider growth models in the wake of COVID-19, cultural and creative sectors can be a driver in a resilient recovery. There is an opportunity for culture to play an even greater role in driving economic, social and indeed environmental outcomes. For this potential to be realised, efforts are needed not only to ensure the sector survives the COVID-19 crisis but also that these opportunities are exploited and the longer-term challenges facing the sector are addressed, from high rates of precarious employment to the structural fragility of many businesses in the sector.
This implies a need for policymakers to consider:
• Viewing culture as an economic and social investment, not simply a cost;
• Culture proofing a range of policies to create a level playing field for creative professionals and firms in terms of access to employment, innovation and business support measures;
• Mainstreaming culture as an integral part of wider policy agendas, such as social cohesion, innovation, health and well-being, the environment and sustainable local development;
• Improving internationally comparable statistics and the evidence base on the scale, scope and impacts of cultural and creative sectors, both as a driver of economic growth but also well-being, social cohesion and sustainability; and
• Building the capacity of national and local governments to integrate culture into broader economic and social development strategies, in line with the Sustainable Development Goals.
Economic and social impact of cultural and creative sectors

| 3
ECONOMIC AND SOCIAL IMPACT OF CULTURAL AND CREATIVE SECTORS © OECD 2021
Table of contents
Economic and social impact of cultural and creative sectors 2 Cultural and creative sectors are major sources of economic value and jobs 4 The sector was hit hard by COVID-19 9 A resilient recovery can leverage culture’s ability to drive innovation and entrepreneurship 11 The benefits of a strong cultural sector go far beyond economic impacts: culture makes our societies healthier, happier and more inclusive 15 Future policy directions 18
Annex: Data sources and methodology 19
FIGURES Figure 1. Cultural and creative sectors as a share of employment and value added 5 Figure 2. Regions with the highest share of employment in cultural and creative sectors 6 Figure 3. Total consumption expenditure of households by type of expenditure, and share of expenditure on recreation and culture 7 Figure 4. Trends in household expenditure: recreation and culture compared to overall expenditures 8 Figure 5. The share of creative goods in total exports and imports 9 Figure 6. Total government expenditure on recreation, culture, and religion 18
Annex Table 1. Indicator sources 19 Annex Table 2. Cultural and creative sector employment and value added indicators, G20 countries 20 Annex Table 3. Cultural and creative sector expenditure indicators, G20 countries 22 Annex Table 4. Creative goods trade performance indicators, G20 countries 24

4 |
ECONOMIC AND SOCIAL IMPACT OF CULTURAL AND CREATIVE SECTORS © OECD 2021
Box 1. What are cultural and creative sectors and how are they measured?
Cultural and creative sectors (CCS) typically include heritage, archives and libraries; books and press; visual and performing arts; audio-visual and multimedia; architecture; design; cultural education and art crafts. Organisational models vary from publicly-funded museums and heritage sites to large private firms such as Netflix or Spotify to micro-firms and freelancers, such as designers, artists and musicians.
Whilst there have been considerable efforts, such as those of UNESCO and Eurostat (the statistics arm of the European Commission), and UNCTAD’s efforts on trade, differences in concepts remain. They in part reflect differences in targets, e.g. value-added generated by the sector, direct jobs created by the sector, jobs classed by the occupation (as opposed to industry) of workers, international trade in cultural and creative products, and measures of household final consumption of cultural and creative products.
This means that care is needed in international comparisons, not least because the ability of countries to align to any particular definition will also differ depending on the sectors present in the country and the availability of granular data. Some countries for example will include gastronomy, indigenous heritage, fashion, software and games industry, or virtual/artificial reality in their national CCS definitions, while challenges around measuring jobs and income from informal, secondary, non-standard forms employment affect most countries. For more information on how the statistics for this note are calculated, see the Annex.
In addition, significant shares of cultural and creative output and consumption, and indeed employment, are treated as non-market transactions and largely invisible in statistical measures, despite their impact on well-being and spillovers to the market economy.
More fundamentally, little systematic evidence beyond ad-hoc surveys currently exists on the broader concept (and benefits from) cultural participation. This is the case despite its relevance for achieving broader social outcomes, in particular with respect to health, social cohesion and well-being, and indeed the material benefits this can bring (e.g. lower government health spending).
A concerted effort by G20 countries and international organisations is needed to help build better evidence on the sectors’ economic and social impacts, and in turn provide scope for policies that can better leverage on the full benefits of the sector.
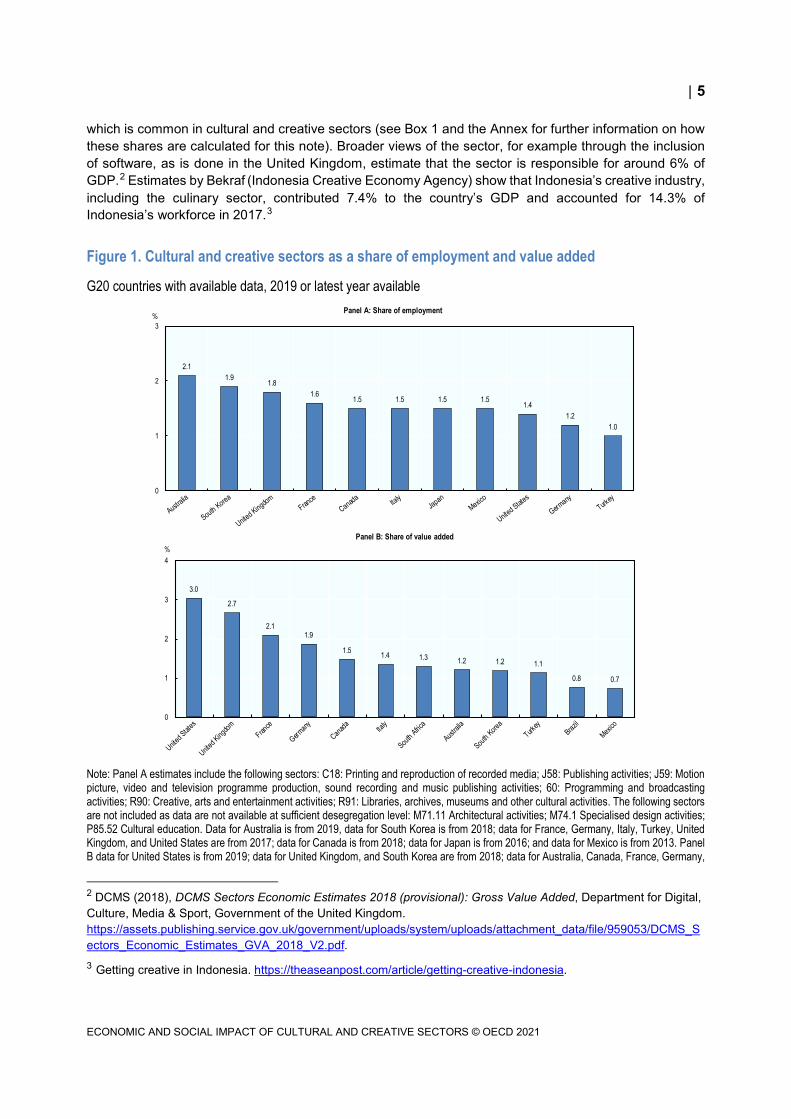
Cultural and creative sectors are major sources of economic value and jobs Although there is a growing appreciation of the economic and social importance of cultural and creative sectors, the absence of internationally comparable statistics means that it remains largely undervalued in the policy debate (see Box 1). One often cited estimate notes cultural and creative sectors generate annual revenues of USD 2.25 trillion and account for 29.5 million jobs globally1 (more than the telecoms or automotive sector in many economies). In G20 countries with available data, estimates prepared for this note show that cultural and creative sectors account for between 1% and 2% of jobs, and 1% and 3% of value added (see Figure 1). These estimates are conservative as they do not include jobs in sectors such as architecture, design or cultural education and do not capture creative jobs in non-creative sectors (e.g. designers working in the automotive industry) and or volunteer employment
1 EY (2015), Cultural Times: The First Global Map of Cultural and Creative Industries, CISAC – The International Confederation of Societies of Authors and Composers, New York, NY.
| 5
ECONOMIC AND SOCIAL IMPACT OF CULTURAL AND CREATIVE SECTORS © OECD 2021
which is common in cultural and creative sectors (see Box 1 and the Annex for further information on how these shares are calculated for this note). Broader views of the sector, for example through the inclusion of software, as is done in the United Kingdom, estimate that the sector is responsible for around 6% of GDP.2 Estimates by Bekraf (Indonesia Creative Economy Agency) show that Indonesia’s creative industry, including the culinary sector, contributed 7.4% to the country’s GDP and accounted for 14.3% of Indonesia’s workforce in 2017.3
Figure 1. Cultural and creative sectors as a share of employment and value added
G20 countries with available data, 2019 or latest year available
Note: Panel A estimates include the following sectors: C18: Printing and reproduction of recorded media; J58: Publishing activities; J59: Motion picture, video and television programme production, sound recording and music publishing activities; 60: Programming and broadcasting activities; R90: Creative, arts and entertainment activities; R91: Libraries, archives, museums and other cultural activities. The following sectors are not included as data are not available at sufficient desegregation level: M71.11 Architectural activities; M74.1 Specialised design activities; P85.52 Cultural education. Data for Australia is from 2019, data for South Korea is from 2018; data for France, Germany, Italy, Turkey, United Kingdom, and United States are from 2017; data for Canada is from 2018; data for Japan is from 2016; and data for Mexico is from 2013. Panel B data for United States is from 2019; data for United Kingdom, and South Korea are from 2018; data for Australia, Canada, France, Germany,
2 DCMS (2018), DCMS Sectors Economic Estimates 2018 (provisional): Gross Value Added, Department for Digital, Culture, Media & Sport, Government of the United Kingdom. https://assets.publishing.service.gov.uk/government/uploads/system/uploads/attachment_data/file/959053/DCMS_Sectors_Economic_Estimates_GVA_2018_V2.pdf. 3 Getting creative in Indonesia. https://theaseanpost.com/article/getting-creative-indonesia.
2.11.9
1.81.6
1.5 1.5 1.5 1.51.4
1.21.0
0
1
2
3%
Panel A: Share of employment
3.0
2.7
2.11.9
1.5 1.4 1.3 1.2 1.2 1.1
0.8 0.7
0
1
2
3
4%
Panel B: Share of value added

6 |
ECONOMIC AND SOCIAL IMPACT OF CULTURAL AND CREATIVE SECTORS © OECD 2021
Italy, and South Africa are from 2017; data for Mexico is from 2013; and data for Turkey is from 2012. For further information on required data imputations, see Annex. Source: OECD.stat, National Accounts Database, Use, Value added, and its components, GFCF and assets by activity, stats.oecd.org/Index.aspx?DataSetCode=SNA_TABLE30#.
The weight of the sector is particularly high in capital regions and cities National estimates mask the often higher shares of employment and GDP in cities and capital regions.4 In South Korea, France, the United Kingdom, Japan, Mexico, Italy, and Canada, for example, the capital regions, which typically have a country’s largest city, have the highest shares of employment in cultural and creative sectors (see Figure 2). Other studies, using varying methodologies, estimate that the share of jobs in cultural and creative sectors is over 10% in cities such as Austin (US), Guangzhou (China), London (UK), Los Angeles (US), Milan (Italy), Seoul (South Korea), and Tokyo (Japan).5,6
Figure 2. Regions with the highest share of employment in cultural and creative sectors
G20 countries with available data, 2019 or latest year available, TL2 regions
Note: TL2 regions represent the first administrative tier of subnational government (see OECD territorial grid, http://www.oecd.org/fr/regional). For further details see Annex in OECD (2020), Culture shock: COVID-19 and the cultural and creative sectors. Source: OECD (2020), OECD Regional Statistics. Ad-hoc data collection.
4 OECD (2020), Culture shock: COVID-19 and the cultural and creative sectors. OECD Publishing, Paris. http://www.oecd.org/coronavirus/policy-responses/culture-shock-covid-19-and-the-cultural-and-creative-sectors-08da9e0e/. 5 Economic Modeling Specialists International (EMSI), through Creative Vitality Suite (2016); Guangzhou Statistics Bureau (2017); Greater London Authority (2017); Otis College (2018); Fondazione Symbola e Unionecamere (2017); Statistics Korea (2012); Bureau of Industrial and Labor Affairs (2014). 6 These figures are not directly comparable to the national shares in Figure 1, as they are drawn from different sources.
0 1 2 3 4 5 6
Ontario (CAN)
Lazio (ITA)
Hamburg (DEU)
Victoria (AUS)
City of Mexico (MEX)
California (USA)
Tokyo (JPN)
Greater London (GBR)
Île-de-France (FRA)
Seoul (KOR)
%
Printing and reproduction of recorded media (C18) Publishing activities (J58)Motion picture, video, TV, radio (J59, J60) Creative, arts and entertainment activities (R90)Libraries, archives, museums and other cultural activities (R91)

| 7
ECONOMIC AND SOCIAL IMPACT OF CULTURAL AND CREATIVE SECTORS © OECD 2021
The economic footprint of cultural and creative sectors is even larger. . .
The value-added generated directly by the sector itself does not reveal its full importance, particularly as it has large backward linkages in the economy that drive upstream production. Consumers spend more on culture and recreation combined than restaurants and hotels; household furnishings and maintenance; and apparel (see Figure 3; more detailed breakdowns separating out culture from recreation spending are not available). Across G20 countries with available data, the share of household expenditures (in the domestic economy) on recreation and culture ranges from 4.2% (South Africa) to 11.2% (UK).
Figure 3. Total consumption expenditure of households by type of expenditure, and share of expenditure on recreation and culture
G20 countries with available data, 2019 or latest available year
Note: Data is based on consumption expenditure of households on the territory. Numbers over the bars in Panel A indicate the share (%) of total expenditure. Indicators are based on G20 countries with available data: Australia, Canada, France, Germany, Italy, Japan, South Korea, Mexico, Russia, South Africa, Turkey, United States, and United Kingdom. The G20 average reflects only those countries with available data. Data for Japan, and Russia are based on 2018, while data for South Africa is based on 2014. Panel B shows household expenditures on recreation and culture expressed as a share of national total household expenditures. Source: OECD.stat, National Accounts Database Final consumption expenditure of households, stats.oecd.org/Index.aspx?DataSetCode=SNA_TABLE5#.
20.1
12.9 12.8 11.7 11.0
8.57.0
4.9 4.0 2.8 2.3 1.9
0
1
2
3
4
5
6
7Trillions of USD PPP
Panel A: Total household expenditure of G20 countries with available data
11.2 10.9
9.6 9.1 8.7 8.6 8.57.9 7.9 7.7 7.4
6.8 6.4 6.25.4
4.2
0
2
4
6
8
10
12
14%
Panel B: Share of household expenditures on recreation and culture

8 |
ECONOMIC AND SOCIAL IMPACT OF CULTURAL AND CREATIVE SECTORS © OECD 2021
. . . and was growing in most countries prior to the pandemic
Pre-pandemic, growth in cultural and creative sectors was outpacing growth more generally in many countries. In the EU-27, for example, cultural employment increased by over 11% between 2011 and 2019 compared to a 5.8% increase in total employment.7 Growth in household final consumption on recreation and culture also outpaced total household consumption, increasing by 20% compared to 10% between 2011 and 2019 in G20 countries with available data (see Figure 4).
Figure 4. Trends in household expenditure: recreation and culture compared to overall expenditures
G20 countries with available data, 2011-2019 or closest years available
Note: Data is based on consumption expenditure of households on the territory for G20 countries with available data: Australia, Canada, France, Germany, Italy, Japan, South Korea, Mexico, Russia, South Africa, Turkey, United States, and United Kingdom. The G20 average reflects only those countries with available data. Growth rates are based on constant prices, constant USD PPP. Growth rates for Japan are based on 2011-2018, for Russia on 2011-2018, and for South Africa on 2011-2014. Source: OECD.stat, National Accounts Database, Final consumption expenditure of households, stats.oecd.org/Index.aspx?DataSetCode=SNA_TABLE5#.
Creative goods are a significant driver of trade Between 2002 and 2015, the size of the global market for creative goods more than doubled, reaching over USD 500 billion by 20158 (comparable data on creative services is not available). The
7 Eurostat (2021), “Cultural employment by sex”, Eurostat Data Browser (database) https://ec.europa.eu/eurostat/databrowser/view/cult_emp_sex/default/table?lang=en (accessed on 4 June 2021); and Eurostat (2021) “Employment and activity by sex and age – annual data”, Eurostat Data Browser (database) https://ec.europa.eu/eurostat/databrowser/view/lfsi_emp_a/default/table?lang=en (accessed on 4 June 2021).
8 UNCTAD (2018), Creative economy outlook: Trends in international trade in creative industries 2002-2015. Country profiles 2005-2014. United Nations Publications, New York, NY. https://unctad.org/system/files/official-document/ditcted2018d3_en.pdf.
-10
0
10
20
30
40
50
60
70%
Recreation and culture Total

| 9
ECONOMIC AND SOCIAL IMPACT OF CULTURAL AND CREATIVE SECTORS © OECD 2021
ASEAN +3 countries9 accounted for almost 40% of global exports of creative goods, while Europe, including the United Kingdom, accounted for a further third. China, the United States, and France are the top three exporters of creative goods globally. Even ignoring the spillovers generated by the cultural sector as a magnet for tourism10, in China, France, India, Italy, the United Kingdom, and Turkey, creative goods account for 5% or more of total national exports (see Figure 5). In countries such as France, the United Kingdom, the United States, and Australia, creative goods also represent a sizeable share of imports.
Figure 5. The share of creative goods in total exports and imports
G20 countries with available data, 2015 or latest year available
Note: Creative goods include art crafts, audiovisuals, design, new media, performing arts, publishing, and visual arts. Data for Indonesia and South Korea are from 2014. Source: United Nations Conference on Trade and Development (UNCTAD STAT), unctadstat.unctad.org/wds.
The sector was hit hard by COVID-19
Cultural and creative sectors have been heavily affected by the pandemic, particularly venue-based sectors like museums, theatres, cinema, performing and live arts.11,12 The total turnover of the sector in the EU-27 plus the United Kingdom is estimated to have fallen by over 30% (almost EUR 200 billion)
9 Brunei Darussalam, Cambodia, Indonesia, Lao People's Democratic Republic, Malaysia, Myanmar, the Philippines, Singapore, Thailand, and Viet Nam plus China, Japan, and Republic of Korea. 10 Data on trade in creative services is more difficult to measure, and not available for most countries. 11 UNESCO, Culture and Covid-19: Impact and Response Tracker, https://en.unesco.org/news/culture-covid-19-impact-and-response-tracker. 12 UNESCO/The WORLD BANK (2021), Cities, Culture, Creativity: Leveraging culture and creativity for sustainable urban development and inclusive growth. https://documents1.worldbank.org/curated/en/104121621556036559/pdf/Cities-Culture-Creativity-Leveraging-Culture-and-Creativity-for-Sustainable-Urban-Development-and-Inclusive-Growth.pdf.
0
1
2
3
4
5
6
7
8
9%
Share of exports Share of imports

10 |
ECONOMIC AND SOCIAL IMPACT OF CULTURAL AND CREATIVE SECTORS © OECD 2021
between 2019 and 2020.13 This has wider repercussions through backward and forward linkages in value chains. For example, festivals have extensive infrastructure requirements, from stages to tents and catering, so their temporary closures had large repercussions throughout these supply chains.
The impact on livelihoods was immediate. . .
The falls in economic output have translated into significant job and income losses for cultural and creative workers. Emergency relief measures, such as furlough schemes and income support for the self-employed, were put in place in many countries to support workers throughout the economy. However, the measures were not always well-suited for workers in cultural and creative sectors, reflecting the often precarious nature of their employment status. For example, self-employment support schemes were not always well adapted to the types of portfolio working and hybrid working that are more common for creative professions. Relief schemes were not always well-suited to provide income support to the sole-proprietors of incorporated companies, which is the case of many creative professionals.14 The situation of creative professionals is even more precarious in countries with large shares of informal employment in the sector.
. . .and pre-existing challenges in the sector were amplified
The crisis has amplified pre-existing challenges such as lack of employment security and income instability due to reliance on multiple and often temporary jobs. A large proportion of cultural and creative professionals are either self-employed, work in very small or micro companies, or operate in the informal sector. In Europe, in 2019, 32% of the workforce are self-employed – more than twice as many as in the European economy as a whole (14%).15 This reflects in large part the project-based nature of work in the sector. Both public cultural institutions and large private firms alike rely on an interconnected network of freelancers and micro-firms which provide creative content, goods and services. While informal employment in the sector is more widely spread in developing countries, even in more developed countries, informality in certain creative jobs (such as handicrafts) also exists.16
The effects could be long-lasting and slow the recovery
Cultural and creative workers tend to transition to work outside the sector during recessionary periods and may even stay outside the sector post-recession. The resulting skills losses and shortages could slow the sector’s recovery. In a September 2020 survey, over one-quarter of freelance museum professionals reported that they were considering changing their career entirely.17 This could limit the sector’s ability to contribute to entrepreneurship and employment growth more generally during the recovery. Evidence suggests that the sector played an important role in the recovery in earlier downturns,
13 EY (2021), Rebuilding Europe: The cultural economy before and after the COVID-19 crisis, GESAC – The European Grouping of Societies of Authors and Composers, Brussels. https://1761b814-bfb6-43fc-9f9a-775d1abca7ab.filesusr.com/ugd/4b2ba2_1ca8a0803d8b4ced9d2b683db60c18ae.pdf. 14 OECD (2020). 15 Eurostat, Culture Statistics – Cultural Employment, data extracted in May 2021 , https://ec.europa.eu/eurostat/statistics-explained/index.php?title=Culture_statistics_-_cultural_employment#Self-employment. 16 UNESCO (2013), Creative Economy Report 2013. Special edition. Widening local development pathways. UNDP-UNESCO, New York – Paris. http://www.unesco.org/culture/pdf/creative-economy-report-2013.pdf. 17 ICOM (2020), Museums, museum professionals and COVID-19: follow-up survey, https://icom.museum/wp-content/uploads/2020/11/FINAL-EN_Follow-up-survey.pdf.
| 11
ECONOMIC AND SOCIAL IMPACT OF CULTURAL AND CREATIVE SECTORS © OECD 2021
such as the 2008 financial crisis.18,19 Between 2013 and 2017, the survival rates of companies in the sector in Europe were higher than a benchmark of services companies in the short and longer term.20 If unattended, this could seriously affect the long-term viability and competitiveness of cultural and creative sectors in many countries whilst also slowing the sector’s ability to drive recovery in the broader economy, notably tourism but also in broader innovation-driven ecosystems.
A resilient recovery can leverage culture’s ability to drive innovation and entrepreneurship
Cultural and creative sectors, as well as cultural participation and education, drive innovation across national and local economies through a number of channels. Cultural and creative sectors produce a multitude of new products and services, and they are also important suppliers of ideas and new approaches for other activities. Beyond these linear inputs, arts and culture are increasingly recognised as part of a wider innovation system though cross-innovation in other sectors, the role that arts education can play in building a more innovative workforce, and innovation in the culture sector itself.21 An example of such innovation is the capacity to engage audiences (consumers) in the co-production/co-creation of content, for example when users (creative enterprises, other businesses and consumers) engage with the innovation process, especially in video games, music and design.
Strong business-to-business linkages to the creative sectors are associated with high levels of innovative activity and performance. Research in the United Kingdom22 and Austria23 has shown that industries with stronger links to the creative industries had considerably stronger innovation performance. This could be explained by the products being direct inputs into innovation, but also by supply-side linkages facilitating the transfer of knowledge and ideas, including through workforce mobility.
In addition, creative jobs tend to be more high-skilled than average, and many occupations are at lower risk of automation. In 2019, in the EU-27, the share of people working in the field of culture that had a tertiary level of educational attainment (59%) was considerably higher than the average for all workers (34%).24 Evidence suggests that the nature of creative jobs (non-repetitive tasks) makes them 18 Stolarick, K., & E. Currid-Halkett (2012), “Creativity and the crisis: The impact of creative workers on regional unemployment”, Cities, Vol. 33, pp. 5-14. 19 Boschma, R. A., & M. Fritsch, M. (2009), “Creative class and regional growth: Empirical evidence from seven European countries”, Economic Geography, Vol. 85, pp. 391–423; Stolarick, K., J. Lobo, J.,& D. Strumsky , D. (2011), “Are creative metropolitan areas also entrepreneurial?”, Regional Science Policy & Practice, Vol. 3, pp. 271–286. doi:10.1111/j.1757-7802.2011.01041. 20 KEA European Affairs (2020), New Market Analysis of the Cultural and Creative Sectors in Europe. European Investment Fund, Luxembourg. https://keanet.eu/wp-content/uploads/ccs-market-analysis-europe-012021_EIF-KEA.pdf. 21 Crossick, G. and P. Kaszynska (2016), Understanding the Value of Arts and Culture, Arts and Humanities Research Council. 22Bakhshi, H., McVittie, E., & Simmie, J. (2008). Creating Innovation: Do the creative industries support innovation in the wider economy?. London: Nesta. 23 Kimpeler, S. and P. Georgieff (2009), The roles of creative industries in regional innovation and knowledge transfer–The case of Austria. 24 Eurostat, Culture Statistics – Cultural Employment, data extracted in May 2021 , https://ec.europa.eu/eurostat/statistics-explained/index.php?title=Culture_statistics_-_cultural_employment#Self-employment.

12 |
ECONOMIC AND SOCIAL IMPACT OF CULTURAL AND CREATIVE SECTORS © OECD 2021
less prone to automation. A recovery in the sector is therefore less likely to take the form of “jobless” growth, where technology and digitalisation cause a displacement of workers.25
A more innovative workforce benefits from arts education and cultural participation. Creative occupations, i.e. the creative workers found in most industrial sectors, drive innovation across the economy. For example, the sector has been identified as critical to revitalising high-value-added manufacturing.26 In fact, tertiary graduates in the arts play an important role in innovation, with one study finding that they are just as likely to participate in product innovation as graduates in engineering and computing.27 Critical thinking and creativity are crucial for innovation, even beyond traditional product or technology innovations typically driven by engineers, scientists and mathematicians.28
The entrepreneurship and innovation potential of culture is often poorly acknowledged and not well integrated into national and local development policies. Supporting new cultural and creative businesses is not only a way to promote the growth of the sector, but also to support cross fertilisation with other sectors. This requires better access to credit and venture capital (e.g. in Indonesia, in 2017, around 92.4% of firms were self-funded and did not receive outside funding either through bank loans or fintech assistance);29 and other instruments to increase the financial sustainability of the sector. The Art Bonus tax exemption measure in Italy incentivises private and corporate investment in cultural heritage preservation and cultural production. It exceeded EUR 500 million in donations since its introduction in 2014.30 More substantial efforts are also needed to facilitate the birth of new firms and support promising start-ups; and support connections with major industry players in non-creative fields. Innovation support mechanisms, largely catering to technological innovations, could be adapted to other forms of innovation more common in the sector, such as innovations in format and content, including through mixed use of different media. They could also recognise that the sector generates innovation through creative skills, new ways of working, new business models, and new forms of co-production.
. . . through digitalisation . . .
Cultural and creative sectors have long been at the vanguard of experimenting with innovative models of digital production and distribution. Digital cultural goods such as e-books, music, video and games are, by far, the biggest revenue source for the digital economy. One study estimates approximately USD 66 billion of B2C sales of digital cultural content and USD 22 billion of advertising revenues for online media and streaming websites globally in 2013. Digital cultural goods also fuel sales of digital devices and demand for high-bandwidth telecom services.31 Digitalisation has also contributed to a democratisation of cultural participation and production, which has made creating, sharing and collaborating on artistic
25 Bakhshi, H., C.B. Frey, & M. Osborne (2015), Creativity vs. Robots. The creative economy and the future of employment, Nesta, London. https://media.nesta.org.uk/documents/creativity_vs._robots_wv.pdf. 26 Propris, L.E. (2012), “How Are Creative Industries Weathering the Crisis?” Cambridge Journal of Regions, Economy and Society, Vol. 6/1, pp. 23-35. 27 Avvisati, F., G. Jacotin and S. Vincent-Lancrin (2013), “Educating higher education students for innovative economies: What international data tell us”, Tuning Journal for Higher Education, Vol. 1/1. 28 Vincent-Lancrin, S., et al. (2019), Fostering Students' Creativity and Critical Thinking: What it Means in School, Educational Research and Innovation, OECD Publishing, Paris, https://doi.org/10.1787/62212c37-en. 29 Getting creative in Indonesia. https://theaseanpost.com/article/getting-creative-indonesia 30 https://artbonus.gov.it 31 EY (2015).
| 13
ECONOMIC AND SOCIAL IMPACT OF CULTURAL AND CREATIVE SECTORS © OECD 2021
endeavours more affordable and accessible.32, 33 In Saudi Arabia, for example, a major programme is underway to create a digital repository of the nation’s culture, which is expected to enhance access to culture and cultural participation while fostering innovation and creativity. COVID-19 has accelerated digitalisation even further, as workers, organisations, and audiences have had to adapt to new ways of engaging with culture and creativity due to lockdowns and social distancing guidelines. For example, there has been a stark increase in the demand for online content, which has benefited streaming platforms for music, cinema and television. Many cultural institutions such as museums and theatres have also rapidly expanded efforts to digitise and provide online access, albeit not necessarily as a revenue-generating mechanism. This will likely bring about permanent changes in audience engagement and content provision models, creating new opportunities for innovation and growth going forward. However, digital access does not replace a live cultural experience or all the jobs that go with it, and questions remain about how revenues from streaming platforms are shared.
Cultural and creative sectors will continue to have a role to play as developers and testers of new technological solutions and experience formats in other sectors of social value. There are ample opportunities to experiment with a stronger integration between culture and welfare, health and wellbeing, social cohesion, and education policies. For example, museum efforts to outreach to their public through digital platforms as a result of COVID-19 could serve as a model for welfare and social services in fields such as telemedicine, elderly care, support to students in rural or isolated areas, and so on.
The sector still faces important challenges related to digital divides. Digital tools, infrastructure and skills are unequally distributed among the sector’s firms and workers, as well as consumers. Promoting policies that provide widespread broadband internet access beyond metropolitan areas, and make tools for digital creative production more accessible, many of which are cost prohibitive especially for small and mid-sized firms and early-career workers, are important. Partnerships between the public sector and technology companies could help facilitate digital access in CCS, such as they do in other sectors.34 Upgrading the digital skills of workers and firms in the sector is also crucial.
. . . supporting the green transition. . .
Culture and heritage can help promote more responsible, pro-social, and pro-environmental behaviours.35 For example, cultural participation favours better waste recycling.36 Artists in India are pioneering new approaches to the circular economy and sustainability by turning waste into artworks, as a way to invite both the industry and civil society to take a different stance toward environmental issues and social responsibility.37 In Brazil, artist collectives are engaged in art-based sustainability projects,
32 Swerdlow, J. L. (2008), “Audiences for the arts in the age of electronics” in S. J. Tepper & B. Ivey (Eds.), Engaging art: the next great transformation of America’s cultural life, Routledge, Abingdon. 33 Kulesz, O. (2020), Supporting culture in the digital age: Public report, IFACCA, Surrey Hills. https://ifacca.org/media/filer_public/30/b4/30b47b66-5649-4d11-ba6e-20d59fbac7c5/supporting_culture_in_the_digital_age_-_public_report_-_english.pdf 34 Kokalitcheva, K. & Fried, I. (2020). Tech companies partner with public sector to take on coronavirus. AXIOS. www.axios.com/tech-companies-public-sector-coronavirus-62b8622a-291c-4f86-a3c2-eda462912fd0.html 35 Quaglione D. et al. (2017), “Exploring additional determinants of energy-saving behavior: The influence of individuals’ participation in cultural activities”, Energy Policy, Vol. 108, pp. 503-511. 36 Crociata A., M. Agovino, P.L. Sacco (2015), “Recycling waste: Does culture matter?” Journal of Behavioral and Experimental Economics, Vol. 55, pp. 40-47. 37 Prasher, K. (2019), “These Indian Artists are Turning Waste Into Art”, The Weather Channel, https://weather.com/en-IN/india/news/news/2019-07-23-these-indian-artists-are-turning-waste-into-art (accessed 7

14 |
ECONOMIC AND SOCIAL IMPACT OF CULTURAL AND CREATIVE SECTORS © OECD 2021
which involve the civil society in transformational social actions, often with a strong focus on the Amazon.38
Beyond behavioural changes, cultural and creative sectors can help push the frontier on new green business models and approaches, including in the social economy. This includes creative reuse of objects and goods or supporting expansion of the circular economy. Cultural and creative sectors also contribute to environmentally friendly planning, infrastructure and mobility. The EU’s New European Bauhaus is one such example of how these links are gaining visibility. Indigenous practices for land preservation are another example.
. . . as well as new models of culture-led local development
While the pandemic has caused an unprecedented downturn in international tourism, it has also sparked innovations that will likely last over the longer-term.39 Evidence suggests that new models of creative tourism can deliver considerable added value, increase tourism demand and diversify tourism supply.40 Innovations in digital and virtual tourism offer opportunities to promote “hybrid” tourism, the preservation of cultural heritage and more sustainable tourism models. Increased digital attractiveness of destinations is also likely to translate into increased tourism demand, as well as the distribution of this demand to a wider range of locations and attractions. However, small businesses will face particular challenges due to their limited capacity to invest in large technological upgrades to keep up with the demands and changed consumer expectations of post-pandemic tourism.
Smartly managed culture-led regeneration strategies can help revive towns, villages and urban neighbourhoods. While the contribution of culture to urban regeneration has been widely recognised for decades, in some cases it has also amplified gentrification and led to the displacement of disadvantaged residents.41 Despite tourism’s clear potential as a driver for positive change, in recent years, some large cities and popular destinations have suffered from rapid or unplanned tourism growth. This can lead to congestion, degradation of local services and quality of life for residents, and threats to the environmental and social sustainability of natural and cultural assets.42 A socially sustainable approach to local development can leverage culture’s role to not only attract new residents and tourists, but also in improving the quality of life for existing residents.43 For example, the Confederation of Indian Industry is promoting an art- and culture-based approach to urban place-making in India as a way to strengthen identity and
June 2021). 38 Ostendorf, Y. (2019), “The Top 10 Most Exciting Art/Sustainability Initiatives in Brazil”, Artists & Climate Change. Building earth connections, https://artistsandclimatechange.com/2019/05/07/top-10-most-pioneering-art-sustainability-initiatives-in-brazil/ (accessed 8 June 2021). 39 OECD (2021), G20 Rome Guidelines for the future of tourism. OECD Report to G20 Tourism Working Group. OECD Publishing, Paris. https://www.g20.org/wp-content/uploads/2021/05/G20-Rome-guidelines-for-the-future-of-tourism_OECD-report-to-G20-TWG_CLEAN-COVER.pdf.
40 OECD (2014), Tourism and the Creative Economy, OECD Studies on Tourism, OECD Publishing, Paris, https://doi.org/10.1787/9789264207875-en. 41 OECD (2005) Culture and Local Development, OECD Publishing, Paris. 42OECD (2020b), OECD Tourism Trends and Policies 2020, OECD Publishing, Paris, https://doi.org/10.1787/6b47b985-en. 43 OECD/ICOM (2019), "Culture and local development: maximising the impact: A guide for local governments, communities and museums", OECD Local Economic and Employment Development (LEED) Papers, No. 2019/07, OECD Publishing, Paris, https://doi.org/10.1787/9a855be5-en.

| 15
ECONOMIC AND SOCIAL IMPACT OF CULTURAL AND CREATIVE SECTORS © OECD 2021
social cohesion in local communities and to promote attractiveness.44 In 2020, despite the pandemic, the Heritage Commission of Saudi Arabia launched thirty seven projects to revive and regenerate, through culture, heritage villages and sites across all regions of the country.
COVID-19 has sparked creative rethinking of some of these traditional models of local development and urban regeneration. The rapid increase of teleworking puts into question the longer-term vitality of central business districts in large cities, whilst positioning high amenity as well as some small and rural locations as potential hubs for attracting highly skilled professionals. Recovery funds and public investment packages also provide a unique opportunity to experiment with new local development strategies and policies that address these challenges and opportunities more systematically. Culture may play a key role both in the creative rethinking and transformation of central business districts as well as small urban and rural areas looking to attract new residents.
The benefits of a strong cultural sector go far beyond economic impacts: culture makes our societies healthier, happier and more inclusive
Evidence continues to grow on the health and well-being benefits. . .
The connections culture has with health and well-being are increasingly recognised at the research, clinical and policy levels. Evidence suggests that cultural participation positively affects both life expectancy and quality of life, even after controlling for factors such as income, education, or health status. A 2019 World Health Organisation review identified a key role for the arts in preventing illness and promoting health, as well as managing and treating illnesses throughout the lifespan.45 There are also encouraging results from experiments on how cultural activities can mitigate the negative effects of neurodegenerative diseases such as Alzheimer’s or Parkinson’s disease for patients, and support better coping by caregivers and families.46 Experiments are already in progress in many countries. For example, “culture by prescription” programmes prescribe cultural experiences (e.g., visiting a museum), including as complementary interventions. Cultural engagement is also part of active ageing policies.47 Further support for these types of systematic experiments, as well cross-sector professional training to combine cultural skills with those related to nursing, medical or social services, can help further build on this potential.
. . . as well as greater opportunities for social cohesion. . .
In addition to creating demand for cultural goods, cultural participation can also be a tool for social inclusion and building local social capital. Culture can help people overcome social barriers and establish meaningful social relationships. Culture can also address the roots of social hostility towards
44 PwC (2018), Transforming urban India: Art and culture to play a vital role, Confederation of Indian Industry, https://www.pwc.in/assets/pdfs/publications/2018/transforming-urban-india.pdf. 45 Fancourt, D. & Finn, S., Health Evidence Network Synthesis Report 67. What is the evidence on the role of the arts in improving health and well-being? A scoping review, WHO Regional Office for Europe, Copenhagen. https://apps.who.int/iris/bitstream/handle/10665/329834/9789289054553-eng.pdf 46 Pereira A.P.S. et al (2019), “Music therapy and dance as gait rehabilitation in patients with Parkinson disease: A review of evidence”, Journal of Geriatric Psychiatry and Neurology, Vol. 32, pp. 49-56; Osman S.E., V. Tischler, & J. Schneider (2016), “‘Singing for the brain’: A qualitative study exploring the health and well-being benefits of singing for people with dementia and their carers”, Dementia, Vol. 15, pp. 1326-1339. 47 Fancourt & Finn (2019); Jacobsen, S.L., H. N. Lund & R.L. Bertelsen (2018), “Music as an integral part of ‘Culture by prescription’”, in Music and Public Health, Springer, Cham, https://doi.org/10.1007/978-3-319-76240-1_13.
16 |
ECONOMIC AND SOCIAL IMPACT OF CULTURAL AND CREATIVE SECTORS © OECD 2021
people of different backgrounds. Culture has proven effective in this regard, even in extreme cases of connecting or reconciling people from ethnic groups in permanent, armed conflict.48 Ensuring diversity of the cultural offer is also essential for inclusion of diverse population groups. Cultural engagement can help increase levels of self-confidence, which is particularly relevant in the prevention of school dropouts or desistance from crime.49 Lockdowns and social distancing measures brought even more awareness to the impact of arts and culture on well-being, including how arts and culture can help address social isolation and exclusion. Recognising these impacts, Saudi Arabia undertook in 2020 a major survey of cultural participation, which will inform future public cultural policies aimed at overcoming social barriers and promoting wellbeing through culture. In Indonesia the Arts Development Company, funded by the British Council of Indonesia, is developing a pilot program on the arts as a major platform for the development of new social enterprise projects. These projects seek to promote community well-being, with special emphasis on people with disabilities.50
. . . and inclusion, including through education
Culture also has a role to play in increasing educational performance, including for disadvantaged groups. Research suggests that cultural participation can improve educational performance generally,51 and that formal and non-formal arts education and cultural participation can lead to the development of critical thinking, social and emotional skills (e.g. communication and collaboration).52 However, across G20 countries with available data, the share of time spent in compulsory general lower secondary education in arts in 2019 varied widely across countries, such as 4% in Australia or 13% in Italy.53 OECD work on creative thinking suggests that it can improve a range of other skills and abilities, from metacognitive capacities to inter- and intra-personal and problem-solving skills, as well as support identity development, academic achievement, future career success and social engagement.54 Creativity and critical thinking skills will become increasingly in-demand in the labour market, particularly in light of automation and digitalisation.55
48 UNESCO-World Bank (2018), Culture in city reconstruction and recovery: position paper. 49 OECD/ICOM (2019), "Culture and local development: maximising the impact: A guide for local governments, communities and museums", OECD Local Economic and Employment Development (LEED) Papers, No. 2019/07, OECD Publishing, Paris, https://doi.org/10.1787/9a855be5-en. 50 Horstman, R. (n.d.), “Art activist's discussion in Bali launches landmark entrepreneurial program for disabled”, The Jakarta Post, https://www.thejakartapost.com/life/2019/07/06/art-activists-discussion-in-bali-launches-landmark-entrepreneurial-program-for-disabled.html (accessed 8 June 2021). 51 M. Guhn, S.D. Emerson, & P. Gouzouasis (2020). “A population-level analysis of associations between school music participation and academic achievement”, Journal of Educational Psychology, Vol.112/2, pp. 308-328. 52 Winner, E., T. Goldstein and S. Vincent-Lancrin (2013), Art for Art's Sake?: The Impact of Arts Education, Educational Research and Innovation, OECD Publishing, Paris https://doi.org/10.1787/9789264180789-en. 53 Data only available for Australia, Canada, France, Germany, Italy, Japan, South Korea, Mexico, Turkey, and the Russian Federation. OECD (2020), "Instruction time per subject in compulsory general lower secondary education. (2014 and 2019): As a percentage of total compulsory instruction time, in public institutions", in Teachers, the learning environment and the organisation of schools, OECD Publishing, Paris, https://doi.org/10.1787/6c0b1846-en. 54 OECD (2019), PISA 2021 Creative Thinking Framework (Third draft), OECD Publishing, Paris. https://www.oecd.org/pisa/publications/PISA-2021-creative-thinking-framework.pdf. 55https://www.oecd-ilibrary.org/docserver/62212c37-en.pdf?expires=1622711910&id=id&accname=ocid84004878&checksum=98012376B417B5CBCE1E639D5B8DCE79 Vincent-Lancrin, S., et al. (2019).

| 17
ECONOMIC AND SOCIAL IMPACT OF CULTURAL AND CREATIVE SECTORS © OECD 2021
Cultural engagement can be important in improving people’s sense of self-worth and motivation to invest in their intellectual curiosity and willingness to learn. For instance, Chinese schools are increasingly promoting educational projects on intangible cultural heritage as a way to boost intellectual curiosity and sensorimotor skills.56 This could be particularly important for students from disadvantaged backgrounds. A more inclusive cultural participation policy initiative addressing such subjects could positively affect school performance and attendance.57 However, the links between cultural participation and school performance is mediated by a number of factors, including the family environment and more generally socio-economic status.58
Accelerated digitalisation will reinforce the relationship between culture and education. Lockdowns and social distancing measures have boosted the development of digital educational platforms and ed-tech innovation. Growing forms of digital “edutainment” could include educational games, but also new platforms that integrate various elements of interactive learning, group exchange and co-creation of content. The gaming industry could become an important partner for government and schools while the digital platforms of cultural institutions could be also used more strategically as educational resources to complement physical access to these spaces.
Efforts are also needed to make the sector itself more inclusive, for example for women, ethnic minorities and those with migrant backgrounds. In 2019, the proportion of women in EU-27 cultural employment (47.7 %) was slightly higher than the average share of women in employment across the whole of the economy (45.9 %).59 However, women comprised only 21% of all directors, writers, producers, executive producers, editors, and cinematographers working on the top 100 grossing films in 2020.60 In one survey of diversity of art museums in the United States, it was found that while 61% of museum staff were women only 46% of directors were women.61 Other work in the United Kingdom has found that while representation of Black, Asian and ethnic minorities in creative sectors is growing, they remain underrepresented compared to the demographics of the places where these sectors are concentrated.62
56 China Plus (2019), “Schools give students hands-on experience of China's cultural heritage”, China Plus, http://chinaplus.cri.cn/news/china/9/20190314/261290.html (accessed 8 June 2021). 57 Jaschke A.C., H. Honing & E.J.A. Scherder (2018), “Longitudinal analysis of music education on executive functions in primary school children,” Frontiers in Neuroscience Vol. 12, p. 103. 58 M. Willekens, & J. Lievens (2014). “Family (and) culture: The effect of cultural capital within the family on the cultural participation of adolescents”, Poetics, Vol.42, pp. 98-113. 59 Eurostat (2020), “Culture statistics – Cultural employment”, Eurostat. Statistics explained. https://ec.europa.eu/eurostat/statistics-explained/index.php?title=Culture_statistics_-_cultural_employment (accessed 4 June 2021). 60 Lauzen, M.M. (2021), The Celluloid Ceiling: Behind-the-Scenes Employment of Women on the Top U.S. Films of 2020, Center for the Study of Women in Television and Film, San Diego State University, San Diego, CA. https://womenintvfilm.sdsu.edu/wp-content/uploads/2021/01/2020_Celluloid_Ceiling_Report.pdf. 61 Schonfeld R., & M. Westermann. Art Museum Staff Demographic Survey, Andrew W. Mellon Foundation, New York, NY. Retrieved from: https://mellon.org/programs/arts-and-cultural-heritage/art-history-conservation-museums/demographic-survey. 62 Easton, E. (2015), Creative Diversity : the state of diversity in the UK’s creative industries and what we can do about it, Creative Industries Federation, London; MOBO Awards. https://www.creativeindustriesfederation.com/sites/default/files/2017-06/30183-CIF%20Access%20&%20Diversity%20Booklet_A4_Web%20(1)(1).pdf.

18 |
ECONOMIC AND SOCIAL IMPACT OF CULTURAL AND CREATIVE SECTORS © OECD 2021
Future policy directions
The scale and scope of cultural policies is not uniform across countries. For G20 countries with available data, public expenditures on recreation, culture and religion vary from USD 20 per capita to just over USD 500 per capita (see Figure 6).
Figure 6. Total government expenditure on recreation, culture, and religion
G20 countries with available data, 2018 or latest year available
Note: Data for China and Russia are from 2017, and 2015, respectively. Source: OECD-UCLG World Observatory on Subnational Government Finance and Investment.
Regardless of the country, policy frameworks to leverage the full potential of cultural and creative sectors remain underdeveloped. This implies a need for policymakers to consider:
• Viewing culture as an economic and social investment, not simply a cost;
• Culture proofing a range of policies to create a level playing field for creative professionals and firms in terms of access to employment, innovation and business support measures;
• Mainstreaming culture as an integral part of wider policy agendas, such as social cohesion, innovation, health and well-being, the environment and sustainable local development;
• Improving internationally comparable statistics and the evidence base on the scale, scope and impacts of cultural and creative sectors, both as a driver of economic growth but also well-being, social cohesion and sustainability; and
• Building the capacity of national and local governments to integrate culture into broader economic and social development strategies, in line with the Sustainable Development Goals.
0
100
200
300
400
500
600
Per c
apita
USD
PPP

| 19
ECONOMIC AND SOCIAL IMPACT OF CULTURAL AND CREATIVE SECTORS © OECD 2021
Data for this note was drawn from a variety of sources including OECD databases and United Nations Conference on Trade and Development Statistics (UNCTAD STAT). As there is no single, internationally agreed definition of cultural and creative sectors and limited data availability at more detailed levels, there are variations across indicators in which types of activities, goods and services are included. In some cases, this may lead to underestimating the relevant indicator (e.g. employment, value added, and trade performance), while in others, it may lead to overestimating (e.g. public and household expenditures). Further details for each of the indicators are provided below.
Annex Table 1. Indicator sources
Indicator Source Note/link Share of employment OECD (2020), Culture shock:
COVID-19 and the cultural and creative sectors
Data is primarily drawn from Eurostat’s Regional Structural Business Statistics database and then supplemented by national sources in order to add data on missing subsectors. https://www.oecd.org/coronavirus/policy-responses/culture-shock-covid-19-and-the-cultural-and-creative-sectors-08da9e0e
Share of value added OECD.stat, National Accounts Database, Use, Value added and its components, GFCF and assets by activity
https://stats.oecd.org/Index.aspx?DataSetCode=SNA_TABLE30#
Total government expenditure on recreation, culture, and religion
World Observatory on Subnational Government Finance and Investment (SNG-WOFI)
https://www.sng-wofi.org/data/
Household expenditure on recreation and culture
OECD.stat, National Accounts Database, Final consumption expenditure of households
https://stats.oecd.org/Index.aspx?DataSetCode=SNA_TABLE5#
Creative goods exports and imports United Nations Conference on Trade and Development (UNCTAD)
https://unctadstat.unctad.org/wds
Employment and value added
For employment and value added purposes, specific divisions from manufacturing (section C), services of information and communication (section J), and art, entertainment and recreation (section R) from the International Standard Industrial Classification (ISIC) are considered to be part of the cultural and creative sectors:
• C18: Printing and reproduction of recorded media • J58: Publishing activities • J59: Motion picture, video and television programme production, sound recording and music
publishing activities • J60: Programming and broadcasting activities • R90: Creative, arts and entertainment activities • R91: Libraries, archives, museums and other cultural activities
Annex: Data sources and methodology

20 |
ECONOMIC AND SOCIAL IMPACT OF CULTURAL AND CREATIVE SECTORS © OECD 2021
The following cultural and creative sectors are not included in the estimates as information is not available at 3 or 4 digit level:
• M71.11: Architectural activities (Section M71 - Architectural and engineering activities; technical testing and analysis)
• M74.1: Specialised design activities, e.g. fashion, industrial, graphic and interior designs (Section M74: Other professional, scientific and technical activities)
• P85.52: Cultural education (Section P85 – Education)
As detailed data were not available for these sub-categories, these figures underestimate cultural employment and value added. In addition, as these data do not account for creative workers in other sectors (e.g. designers in the automotive industry) or volunteer employment.
Value added data for the sub-sector “creative, arts and entertainment activities” had to be imputed for France, Germany, Italy, Turkey, United Kingdom, Brazil, and South Africa. Similarly, data for the sub-sector “libraries, archives, museums and other cultural activitie” also had to be imputed for the same countries as well as Australia and Canada. Since South Korea, Mexico, and the United States had a complete set of value added indicators for the creative and cultural sub-sectors, the value added for the “creative, arts and entertainment activities”, and “libraries, archives, museums and other cultural activities” sub-sectors were expressed as combined shares of the arts, entertainment and recreation sector, and then these shares were used to impute the missing values for the remaining countries.
Annex Table 2. Cultural and creative sector employment and value added indicators, G20 countries
Share of employment Share of value added Year % Year %
Argentina N/A N/A Australia 2019 2.1 2017 1.2 Brazil N/A 2018 0.8 Canada 2018 1.5 2017 1.5 China N/A N/A France 2017 1.6 2017 2.1 Germany 2017 1.2 2017 1.9 India N/A N/A Indonesia N/A N/A Italy 2017 1.5 2017 1.4 Japan 2016 1.5 N/A South Korea 2018 1.9 2018 1.2 Mexico 2013 1.5 2013 0.7 Russia N/A N/A Saudi Arabia N/A N/A South Africa N/A 2017 1.3 Turkey 2017 1.0 2012 1.1 United Kingdom 2017 1.8 2018 2.7 United States 2017 1.4 2019 3.0
Source: OECD.stat, National Accounts Database, Use, value added, and its components, GFCF and assets by activity
| 21
ECONOMIC AND SOCIAL IMPACT OF CULTURAL AND CREATIVE SECTORS © OECD 2021
Public and household expenditures
Public expenditures are based on OECD’s Classification of the Functions of Government (COFOG), and were obtained from OECD-UCLG World Observatory on Subnational Government Finance and Investment. The COFOG category of “recreation, culture and religion” was used, which includes:
• Recreational and sporting services
• Cultural services
• Broadcasting and publishing services
• Religious and other community services
• R&D recreation, culture and religion
• Recreation, culture and religion not otherwise categorised
As detailed data was not available for these sub-categories, only the broader category, these figures likely overestimate public expenditures on culture.
Household expenditure data were drawn from the OECD database on Final consumption expenditure of households. The category of “recreation and culture” was used, which includes:
• Audio-visual, photographic and information processing equipment
• Other major durables for recreation and culture
• Other recreational items and equipment, gardens and pets
• Recreational and cultural services
• Newspapers, books and stationery
• Package holidays
As detailed data was not available for these sub-categories, only the broader category, these figures likely overestimate final consumer expenditures on culture.

22 |
ECONOMIC AND SOCIAL IMPACT OF CULTURAL AND CREATIVE SECTORS © OECD 2021
Annex Table 3. Cultural and creative sector expenditure indicators, G20 countries
Year Total government expenditure on recreation, culture and religion (per
capita USD PPP)
Year Share of household expenditure on
recreation and culture (%)
Argentina N/A N/A Australia 2018 374 2019 9.6 Brazil 2018 28 N/A Canada 2018 376 2019 7.9 China 2017 66 N/A France 2018 515 2019 7.9 Germany 2018 493 2019 10.9 India N/A N/A Indonesia 2018 20 N/A Italy 2018 326 2019 6.8 Japan 2018 159 2018 7.7 South Korea 2018 276 2019 7.4 Mexico N/A 2019 5.4 Russia 2015 101 2018 6.4 Saudi Arabia N/A N/A South Africa N/A 2014 4.2 Turkey 2018 208 2019 6.2 United Kingdom 2018 274 2019 11.2 United States 2018 148 2019 9.1
Note: Share of household expenditure on recreation and culture is based on consumption expenditure of households on the territory. Source: World Observatory on Subnational Government Finance and Investment (SNG-WOFI); OECD.stat, National Accounts Database, Government expenditure by function (COFOG); OECD.stat, National Accounts Database, Final consumption expenditure of households.
Trade
Trade performance indicators were obtained from UNCTAD STAT for the category of “creative goods”. Classification of goods is based on the Harmonized Commodity Description and Coding Systems (HS) which is an international system for the classification of products. At the international level, the HS system uses 6 digits to classify goods. Creative goods components and sub-components, as classified by the HS system (2012), include:
• Art crafts
o Carpets (570110, 570190, 570210, 570220, 570231, 570232, 570239, 570241, 570242, 570249, 570250, 570291, 570292, 570299, 570330)
o Celebration (950510, 950590, 950810)
o Other art crafts (442090, 670290, 701890, 960110, 960190, 960200)
o Paperware (480210)
o Wickerware (460121, 460122, 460129, 460192, 460193, 460194, 460199, 460211, 460212, 460219)
o Yarn (580430, 580500, 580610, 580620, 580631, 580632, 580639, 580640, 580810, 580890, 580900, 581010, 581091, 581092, 581099, 581100, 600240, 600290, 600310, 600320, 600330, 600340, 600390, 600410, 600490, 630232, 630240, 630411, 630491, 630800)

| 23
ECONOMIC AND SOCIAL IMPACT OF CULTURAL AND CREATIVE SECTORS © OECD 2021
• Audiovisuals
o Film (370610, 370690)
o CDs, DVDs, tapes (852329, 852341, 852349, 852380)
• Design
o Architecture (490600)
o Fashion (420211, 420212, 420221, 420222, 420231, 420232, 420292, 420310, 420329, 420330, 420340, 430310, 611710, 611780, 611790, 621410, 621420, 621430, 621440, 621490, 621510, 621520, 621590, 621710, 621790, 650400, 650500, 650699, 900410)
o Glassware (701310, 701322, 701333, 701341, 701342, 701391)
o Interior (441900, 481420, 481490, 570310, 570390, 570410, 570500, 580410, 580421, 580429, 590500, 691110, 691200, 691410, 821510, 821520, 821591, 940320, 940340, 940350, 940360, 940381, 940389, 940510, 940530)
o Jewellery (711311, 711319, 711320, 711411, 711419, 711420, 711610, 711620, 711711, 711719)
o Toys (950300, 950420, 950440, 950490)
• New media
o Recorded media (852321, 852351, 852352, 852359)
o Video games (950430, 950450)
• Performing arts
o Musical instruments (830610, 920110, 920120, 920190, 920210, 920290, 920510, 920590, 920600, 920710, 720790, 920810, 920890)
o Printed music (490400)
• Publishing
o Books (490110, 490191, 490199, 490300)
o Newspaper (480100, 490210, 490290)
o Other printed mater (490510, 490591, 490599, 490810, 490890, 490900, 491000, 491110)
• Visual arts
o Antiques (970400, 970500, 970600)
o Painting (970110, 970190, 970200)
o Photography (370510, 370590, 491191)
o Sculpture (392640, 442010, 691310, 691390, 830621, 830629, 970300)
As corresponding data on creative services was not available, these figures likely underestimate cultural and creative sectors’ trade performance. HS code descriptions are available from unctadstat.unctad.org/en/Classifications/DimHS2012Products_Creatives_Hierarchy.pdf

24 |
ECONOMIC AND SOCIAL IMPACT OF CULTURAL AND CREATIVE SECTORS © OECD 2021
Annex Table 4. Creative goods trade performance indicators, G20 countries
Year Creative goods exports (millions of
USD at current prices)
Creative goods imports (millions of
USD at current prices)
Net trade balance of creative goods
(millions of USD at current prices)
Creative goods exports as a share of national goods
exports (%)
Creative goods imports as a share of national goods
imports (%) Argentina 2015 93 808 -715 0.2 1.4 Australia 2015 1 011 8 144 -7 134 0.5 3.9 Brazil 2015 883 2 371 -1 488 0.5 1.4 Canada 2015 6 188 13 483 -7 294 1.5 3.1 China 2015 168 507 14 777 153 730 7.9 0.9 France 2015 34 446 41 452 -7 006 6.6 7.5 Germany 2015 25 882 182 25 700 2.0 0.0 India 2015 16 937 5 053 11 884 6.2 1.2 Indonesia 2014 5 157 1 467 3 690 2.9 0.9 Italy 2015 26 672 11 506 15 166 6.0 3.0 Japan 2015 6 631 18 122 -11 491 1.1 2.9 South Korea 2014 6 013 6 759 -746 1.0 1.3 Mexico 2015 5 447 6 671 -1 224 1.4 1.7 Russia 2015 1 572 4 551 -2 980 0.5 2.4 Saudi Arabia 2015 534 4 177 -3 643 0.3 2.6 South Africa 2015 501 1 480 -979 0.6 1.8 Turkey 2015 8 690 3 560 5 131 5.7 1.8 United Kingdom
2015 25 926 31 646 -5 720 5.9 5.1
United States 2015 40 504 105 741 -65 237 2.7 4.7
Source: United Nations Conference on Trade and Development (UNCTAD).