economic and social overview of latin america and caribbean · latin america (18 countries): ......
TRANSCRIPT

Economic and social overview of Latin America and Caribbean
Meeting of the Regional Coordination Mechanism for Latin America and the Caribbean - Santiago, 24 January 2013 Antonio Prado, Deputy Executive Secretary

Contents
• The region in the context of the global crisis:
recent trends in economic and social
development
• Long-run challenges to achieve structural
change for equality

Crises have traditionally cut deep into the social fabric in the region
LATIN AMERICA AND THE CARIBBEAN: COMPARISON OF PER CAPITA GDP AND POVERTY RATES, 1980-2011
Source: ECLAC, on the basis of specia tabulations of household surveys
Poverty GDP per capita

Source: Economic Commission for Latin America and the Caribbean (ECLAC), on the basis of special tabulations of household surveys
conducted in the respective countries.
a Data for urban areas in Argentina, Ecuador and Uruguay. Data for 2002 are from 2002 except for Brazil, El Salvador, Nicaragua, Paraguay
and Peru (2001), Argentina (2004) and Chile (2000). Data for 2011 are from 2011 except for Costa Rica, Nicaragua and the Plurinational State
of Bolivia (2009), El Salvador, Honduras and Mexico (2010) and Guatemala (2006). b Data for urban areas in Argentina. Data for 2010 refer to figures for 2009 in Brazil and Chile.
LATIN AMERICA (18 COUNTRIES): GINI COEFFICIENT, 2002-2011 AND 2010-2011
There has been a clear reduction in inequality since 2002, and this continued in 2011

This crisis current is different: a recession caused by a financial crisis arising from
private over indebtedness
• Recessions of this sort are longer and impact more heavily on output and employment.
• Recoveries are precarious and highly vulnerable to economic or financial volatility.
• Necessary private debt reduction takes place in periods of slack economic activity and asset value slippage.
• Deleveraging and recomposition of private savings make monetary stimulus measures less effective.
• Emerging economies and South-South trade have been key in global growth

Since the beginning of this crisis, Latin America and the Caribbean showed a certain resilience
Downside
Trade contraction, especially towards Europe and China
Adverse climate factors (soy)
Insufficient investment limited the growth capacity (supply)
Some exchange rate volatility (Brazil and Mexico)
Lower financial inflows to the region
Upside
GDP growth of 3.1% (above the global average of 2.2%) in 2012
Fall in unemployment (to 6.4%) and an increase in average wages
Accommodative monetary policy and continued reserve accumulation
Increased investment and consumption
Fiscal prudence

External context 2012
• Financial, fiscal and competiveness imbalances in the Euro area were associated with:
– A recession in the majority of the countries of the EZ, with economic growth of -0.5%
– A slow process of joint problem solving, although with the decision of the ECB to intervene under certain conditions
– Financial instability, though with improvements in the risk premiums in the EZ during the second half
• Slowdown in China, from 9.2% in 2011 to 7.7% in 2012
• Modest growth in the USA, between 1.8% and 2.1%
• Absence of shocks in the oil market

Global economic growth decelerated
GLOBAL GDP GROWTH BY REGION, 2010 – 2013 (in percentage)
Source: Economic Commission for Latin America and the Caribbean (ECLAC), based on UN/DESA. a/ Estimate. b/ Projection.
4.0
2.7
2.2 2.4
2.1
1.5
-0.5
0.3
2.4
1.8 2.1
1.7
6.0
4.3
3.1
3.8
7.7
5.7
4.7 5.1
10.3
9.2
7.7 7.9
4.5
-0.7
1.5
0.6
-2
0
2
4
6
8
10
12
2010 2011 2012 a/ 2013 b/
World Euro area United States Latin America and the Caribbean Developing economies China Japan

LATIN AMERICA AND THE CARIBBEAN: CONTRIBUTION TO REGIONAL GDP GROWTH BY COUNTRY, 2004 – 2012a
Regional GDP grew by 3.1% in 2012, above the global average (2.2%)
Source: Economic Commission for Latin America and the Caribbean (ECLAC), based on official figures. a Figures for 2012 correspond to estimations.
-3%
-2%
-1%
0%
1%
2%
3%
4%
5%
6%
7% 2
00
4
20
05
20
06
20
07
20
08
20
09
20
10
20
11
20
12
Brazil
Argentina
The Caribbean
Mexico
Central America
Rest of South America
Latin America and the Caribbean

LATIN AMERICA AND THE CARIBBEAN: GDP GROWTH RATES, 2012a (Percentages)
The majority of Latin America countries posted growth above 3.1% in 2012
Source: Economic Commission for Latin America and the Caribbean (ECLAC), based on official figures. a Estimate
-1.8
1.1
1.2
1.2
2.2
2.5
2.7
3.0
3.1
3.1
3.3
3.5
3.8
3.8
3.8
4.0
4.2
4.5
4.8
5.0
5.0
5.3
5.5
6.2
10.5
-4 -2 0 2 4 6 8 10 12
Paraguay
The Caribbean
Brazil
El Salvador
Argentina
Haiti
South America (10 countries)
Cuba
Latin America and the Caribbean
Latin America
Guatemala
Honduras
Dominican Republic
Mexico
Uruguay
Nicaragua
Central America (9 countries)
Colombia
Ecuador
Bolivia (Plur. St. of)
Costa Rica
Venezuela (Bol. Rep. of)
Chile
Peru
Panama

THE CARIBBEAN: GDP GROWTH RATES, 2012a (Percentages)
Growth in the Caribbean increased from 0.4% in 2011 to 1.1% in 2012
Source: Economic Commission for Latin America and the Caribbean (ECLAC), based on official figures. a Estimate
-0.8
-0.2
0.2
0.2
0.9
0.9
1.0
1.1
1.5
1.6
2.5
3.1
3.6
3.8
4.2
-2 -1 0 1 2 3 4 5
Saint Kitts and Nevis
Jamaica
Granada
Barbados
Saint Lucia
Antigua and Barbuda
Trinidad and Tobago
The Caribbean
Saint Vincent and the Grenadines
Dominica
Bahamas
Latin America and the Caribbean
Suriname
Guyana
Belize

Consumption continued to be the most important driver of growth
LATIN AMERICA: CONTRIBUTION TO GDP GROWTH, 2008 – 2012a
(As a percentage of GDP)
Source: Economic Commission for Latin America and the Caribbean (ECLAC), based on official figures. a Figures for 2012 correspond to estimations.
-4%
-2%
0%
2%
4%
6%
8%
10%
20
08
20
09
20
10
20
11
20
12
Private Consumption General Government Consumption Investment Net Exports GDP

The region’s investment coefficient has continued to grow persistently
LATIN AMERICA: GROSS FIXED CAPITAL FORMATION AS A PERCENTAGE OF GDP, 1980 – 2012a
(2005 constant dollars)
0%
5%
10%
15%
20%
25%
30% 1980
1981
1982
1983
1984
1985
1986
1987
1988
1989
1990
1991
1992
1993
1994
1995
1996
1997
1998
1999
2000
2001
2002
2003
2004
2005
2006
2007
2008
2009
2010
2011
2012
Source: Economic Commission for Latin America and the Caribbean (ECLAC), based on official figures. a Figures for 2012 correspond to estimations.

FDI inflows remained above 120 billion dollars
0
20,000
40,000
60,000
80,000
100,000
120,000
140,000
160,000
2008 2009 2010 2011 2012
Source: Economic Commission for Latin America and the Caribbean (ECLAC), based on official figures. a Figures for 2012 correspond to estimations.
LATIN AMERICA AND THE CARIBBEAN: FOREIGN DIRECT INVESTMENT INFLOWS, 2008 – 2012a (In millions of dollars)

Inflation slowed, with some exceptions
LATIN AMERICA AND THE CARIBBEAN: CONSUMER PRICE INDEX, Jan 2008 – Oct 2012 (Rate of change over twelve months)
0%
2%
4%
6%
8%
10%
12%
14%
16% Ja
nu
ary
Feb
ruar
y M
arch
A
pri
l M
ay
Jun
e Ju
ly
Au
gust
Se
pte
mb
er
Oct
ob
er
No
vem
be
r D
ecem
be
r Ja
nu
ary
Feb
ruar
y M
arch
A
pri
l M
ay
Jun
e Ju
ly
Au
gust
Se
pte
mb
er
Oct
ob
er
No
vem
be
r D
ecem
be
r Ja
nu
ary
Feb
ruar
y M
arch
A
pri
l M
ay
Jun
e Ju
ly
Au
gust
Se
pte
mb
er
Oct
ob
er
No
vem
be
r D
ecem
be
r Ja
nu
ary
Feb
ruar
y M
arch
A
pri
l M
ay
Jun
e Ju
ly
Au
gust
Se
pte
mb
er
Oct
ob
er
2009 2010 2011 2012
CPI Food Core

International reserves accumulation continued throughout the region, though at a slower rate than in 2011
GROSS INTERNATIONAL RESERVES, 2001 - 2012 (Millions of dollars and as a percentage of GDP)
Source: Economic Commission for Latin America and the Caribbean (ECLAC), based on official figures.
45,274
751
13,772
377,753
38,943
36,402
5,366 6,804
1,400
2,524
1,990
165,590
1,856 4,838
62,212
3,347
9,326
13,120
25,864
0%
10%
20%
30%
40%
50%
60%
October 2011 October 2012

INTERNATIONAL PRICE INDICES OF COMMODITIES AND MANUFACTURES, 2008-2012 (2005=100, three month moving average)
Source: Economic Commission for Latin America and the Caribbean (ECLAC), based on figures from the United Nations Conference on Trade and Development (UNCTAD) and the Netherlands Bureau for Economic Analysis (CPB).
Some decline in commodity prices, but with increased volatility
80
100
120
140
160
180
200
220
240
260
280
300
320
340
360
Ja
n-0
8
Ap
r-0
8
Ju
l-0
8
Oct-
08
Ja
n-0
9
Ap
r-0
9
Ju
l-0
9
Oct-
09
Ja
n-1
0
Ap
r-1
0
Ju
l-1
0
Oct-
10
Ja
n-1
1
Ap
r-11
Ju
l-11
Oct-
11
Ja
n-1
2
Ap
r-1
2
Ju
l-1
2
Oct-
12
Food Tropical beverages
Oils and oilseeds Forestry and agricultural raw materials
Minerals and metals Energy
Manufactured goods

Exchange rate volatility increased in Brazil and Mexico, with a greater diversity in exchange-rate trajectories
NOMINAL EXCHANGE RATE, Jan 2008 – Nov 2012 (National currency per dollar, index 01/01/2008=100)
Source: Economic Commission for Latin America and the Caribbean (ECLAC), based on official figures.
80
90
100
110
120
130
140
150
01-0
1-2
008
01-0
3-2
008
01-0
5-2
008
01-0
7-2
008
01-0
9-2
008
01-1
1-2
008
01-0
1-2
009
01-0
3-2
009
01-0
5-2
009
01-0
7-2
009
01-0
9-2
009
01-1
1-2
009
01-0
1-2
010
01-0
3-2
010
01-0
5-2
010
01-0
7-2
010
01-0
9-2
010
01-1
1-2
010
01-0
1-2
011
01-0
3-2
011
01-0
5-2
011
01-0
7-2
011
01-0
9-2
011
01-1
1-2
011
01-0
1-2
012
01-0
3-2
012
01-0
5-2
012
01-0
7-2
012
01-0
9-2
012
01-1
1-2
012
Brazil Chile Colombia Mexico Peru

-200,000
-150,000
-100,000
-50,000
0
50,000
100,000
150,000
200,000
250,000
2008 2009 2010 2011 2012
Portfolio investment outflows Portfolio investment inflows
Other investment outflows Other investment inflows
Net financial flows (excl. net FDI and errors)
Although the trade channel was most affected, net financial flows to the region also declined
LATIN AMERICA AND THE CARIBBEAN: GROSS CAPITAL FLOWS, 2008 – 2012a
(In millions of dollars)
Source: Economic Commission for Latin America and the Caribbean (ECLAC), based on official figures. a Figures for 2012 correspond to estimations.
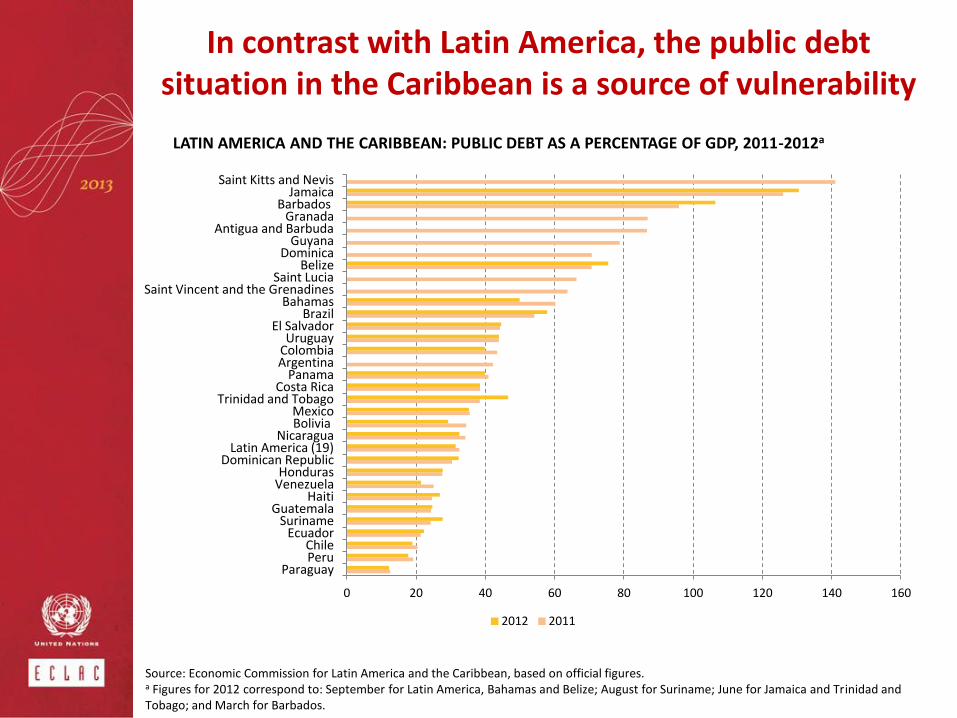
In contrast with Latin America, the public debt situation in the Caribbean is a source of vulnerability
LATIN AMERICA AND THE CARIBBEAN: PUBLIC DEBT AS A PERCENTAGE OF GDP, 2011-2012a
Source: Economic Commission for Latin America and the Caribbean, based on official figures. a Figures for 2012 correspond to: September for Latin America, Bahamas and Belize; August for Suriname; June for Jamaica and Trinidad and Tobago; and March for Barbados.
0 20 40 60 80 100 120 140 160
Paraguay Peru Chile
Ecuador Suriname
Guatemala Haiti
Venezuela Honduras
Dominican Republic Latin America (19)
Nicaragua Bolivia Mexico
Trinidad and Tobago Costa Rica
Panama Argentina Colombia Uruguay
El Salvador Brazil
Bahamas Saint Vincent and the Grenadines
Saint Lucia Belize
Dominica Guyana
Antigua and Barbuda Granada
Barbados Jamaica
Saint Kitts and Nevis
2012 2011

The rise in consumption reflected improved labour market conditions: unemployment fell (to 6.4%) and
wages increased
LATIN AMERICA AND THE CARIBBEAN: ECONOMIC GROWTH, INCREASE IN REAL AVERAGE WAGE AND VARIATION IN THE UNEMPLOYMENT RATE
Source: Economic Commission for Latin America and the Caribbean, (ECLAC), based on official figures.
e/ Estimate.
80.00
85.00
90.00
95.00
100.00
105.00
110.00
115.00
120.00
-4.00
-2.00
.00
2.00
4.00
6.00
8.00
10.00
12.00
2000 2001 2002 2003 2004 2005 2006 2007 2008 2009 2010 2011 2012 e/ Re
al A
vera
ge S
alar
y (I
nd
ex
20
00
= 1
00
)
Rat
es
(pe
rce
nta
ges)
Economic Growth Unemployment Rate (left axis) Real Average Wages (right axis)

CENTRAL AMERICA
MEXICO
CARIBBEAN
BRAZIL
4
5
6
7
8
9
10
2008 2009 2010 2011 2012 e/
Brazil Rest of South America (7 countries) Mexico Central America (3 countries) The Caribbean (3 countries)
REST OF SOUTH AMERICA
Evolution of unemployment by sub-region
URBAN UNEMPLOYMENT RATE, 2008 - 2012 (Percentage)
Source: Economic Commission for Latin America and the Caribbean, (ECLAC), based on official figures. e/ Estimate. For the Caribbean: First half of the year.

Salaried employment grew more than own-account work, although at a lower rate than in 2011
LATIN AMERICA: ECONOMIC GROWTH AND EMPLOYMENT DYNAMICS, 2000 - 2012 (Percentage)
Source: Economic Commission for Latin America and the Caribbean (ECLAC), based on official figures. a/ January-September
-2
-1
0
1
2
3
4
5
6
Salaried Employment Own Account Workers GDP

Formal employment increased, but in various countries at a slower pace
LATIN AMERICA: YEAR-ON-YEAR CHANGE OF FORMAL, SALARIED EMPLOYMENT (Percentage)
Source: Economic Commission for Latin America and the Caribbean (ECLAC), based on official figures. a/ January-September, except Argentina and Panama, whose data correspond to the period January-June; and Uruguay, January-August.
-5
-3
-1
1
3
5
7
9
Argentina Brazil Chile Costa Rica Mexico Nicaragua Panama Peru Uruguay
2009 2010 2011 2012 a/

LATIN AMERICA: POVERTY AND INDIGENCE, 1980-2012 a
(Percentages and millions of people)
Source: Economic Commission for Latin America and the Caribbean (ECLAC), on the basis of special tabulations of household surveys conducted
in the respective countries. a Estimate for 18 countries of the region plus Haiti. The figures above the bars refer to the percentage of total poor (indigents and non-indigent
poor). The figures for 2012 are projections.
Both poverty and indigence posted a fresh decline in 2011

LATIN AMERICA (7 COUNTRIES): ANNUAL VARIATION IN TOTAL INCOME PER CAPITA
AND INCOME SOURCE IN POOR HOUSEHOLDS,a 2010-2011 b
(Percentages)
Source: Economic Commission for Latin America and the Caribbean (ECLAC), on the basis of special tabulations of household
surveys conducted in the respective countries. a The percentage of the population analysed is the same for both periods and corresponds to the poverty rate for 2008 or nearest
previous year. b Corresponds to the period 2009-2011 in Brazil and Chile. c Urban areas.
Wages were the main driver of higher income in poor groups...

Source: Economic Commission for Latin America and the Caribbean (ECLAC), on the basis of special tabulations of household
surveys conducted in the respective countries.
a Urban areas.
LATIN AMERICA (18 COUNTRIES): FEMININITY INDEX OF POVERTY, 2011
… but gaps between women and men have been widening, leading to greater feminization
of poverty

Social public spending has kept rising as precentage of GDP
Fuente: Comisión Económica para América Latina y el Caribe (CEPAL), sobre la base de cifras oficiales.
11.3
3.1 2.7
4.4
1.2
17.9
4.9
3.7
7.9
1.6
0.0
2.0
4.0
6.0
8.0
10.0
12.0
14.0
16.0
18.0
20.0
Gasto social total Gasto en educación Gasto en salud Gasto en seguridad y asistencia social
Gasto en vivienda y otros
AMÉRICA LATINA Y EL CARIBE (21 PAÍSES): EVOLUTION OF SOCIAL SPENDING IN DIFFERENT ECTORS, 1990-1991 A 2008-2009.
(in percentage of GDP)
1990-1991 1994-1995 1998-1999
6.6 a/
1.8 a/
1.0 a/
3.5 a/
0.4 a/
Total social spending
Spending in education
Spending in health
Spending in social protection
Spending in housing and other

Balance, perspectives and challenges

In 2013, external demand will not be a source of dynamism
• European Union
– Solvency problems persist both in terms of public debt and in the financial system, as well as insufficient external adjustment
– Low growth and a possible recession in 2013
– Institutional changes (fiscal union and a unified banking supervisor) will take time
• United States:
– Liquidity will continue to expand
– Labour, housing and banking solvency indicators suggest possibilities of increased growth in 2013
– There remains a risk of the fiscal cliff
• China
– Indicators suggest growth similar to or greater than that of 2012: 7.9% in 2013 compared to 7.7% in 2012

But a slight uptick in growth is predicted for the region (3.8%) in 2013
LATIN AMERICA AND THE CARIBBEAN: CONTRIBUTION TO REGIONAL GDP GROWTH BY COUNTRY , 2004 - 2013
Source: Economic Commission for Latin America and the Caribbean (ECLAC), based on official figures. a/ Estimate b/ Projection
-3%
-2%
-1%
0%
1%
2%
3%
4%
5%
6%
7% 2
00
4
20
05
20
06
20
07
20
08
20
09
20
10
20
11
20
12
/a
20
13
/b
Brazil
Argentina
The Caribbean
Mexico
Central America
Rest of South America
Latin America and the Caribbean

LATIN AMERICA AND THE CARIBBEAN: GDP GROWTH RATES, 2013a (Percentages)
With a recovery in some countries and a small slowdown in others
Source: Economic Commission for Latin America and the Caribbean (ECLAC). a Projection
2.0
2.0
2.0
3.0
3.5
3.5
3.5
3.5
3.5
3.5
3.5
3.8
3.9
4.0
4.0
4.0
4.0
4.5
4.5
4.8
5.0
6.0
6.0
7.5
8.5
00 01 02 03 04 05 06 07 08 09
Venezuela (Bol. Rep. of) The Caribbean
El Salvador Dominican Republic
Argentina Guatemala Costa Rica
Cuba Ecuador
Honduras Mexico
Latin America and the Caribbean Central America (9 countries) South America (10 countries)
Brazil Uruguay
Latin America Colombia Nicaragua
Chile Bolivia (Plur. St. of)
Haiti Peru
Panama Paraguay

THE CARIBBEAN: GDP GROWTH RATES, 2013a (Percentage)
The Caribbean will also grow, at 2.0%, but vulnerabilities remain
Source: Economic Commission for Latin America and the Caribbean (ECLAC) a Projection
0.1
1.0
1.2
1.5
1.7
1.8
1.9
2.0
2.3
2.4
2.5
3.0
3.8
4.7
4.9
.0 1.0 2.0 3.0 4.0 5.0 6.0
Jamaica
Barbados
Granada
Saint Vincent and the Grenadines
Dominica
Saint Kitts and Nevis
Saint Lucia
The Caribbean
Belize
Antigua and Barbuda
Trinidad and Tobago
Bahamas
Latin America and the Caribbean
Suriname
Guyana
In the short term
The role of domestic demand (national and intra- regional) should be strengthened and expanded, in order to:
• Grow to achieve equality (through employment and wages)
• Enhance investment dynamics
• Avoid internal macroeconomic disequilibria (inflation or financial bubbles)
• And external disequilibria (increasing current account deficits)
• In the Caribbean: ensure fiscal consolidation, but with social protection
• Strengthen regional demand through intra-regional trade

Longer-term challenges: structural gaps to be closed
Inequality For the first time in
recent history there have been
advances in combating inequality
Investment Investment, at 23% of GDP, is insufficient for development
Productivity Closing the external
gap (with the technological
frontier) and the internal gap
(between sectors and actors)
Taxation Regressive tax systems; weak non-
contributory pillar
International linkages
Risk of “lock-in” of the export structure, with low value added and little investment
in technology
Environ-mental
sustainabi-lity
Move towards sustainable
production and consumption
patterns
• In order to move towards productive convergence, policymakers must look beyond the price boom: economic policies based on a relevant, long-term, sustainable vision at the macroeconomic, productive and territorial levels.
• To take advantage of the opportunities provided by the international context, exports must have a higher value added and knowledge content, with the focus on diversification of production, integration of sustainable production processes, re-evaluation of global and regional partnerships and strengthening open regionalism.
• Consensus on priorities and respective financing: a fiscal covenant with a redistributive impact – with access to innovation, job security and internalization of externalities.
• New equation: State-market-society.

AMÉRICA LATINA Y EL CARIBE: ESTRUCTURA DE LAS EXPORTACIONES POR NIVEL DE INTENSIDAD TECNOLÓGICA, 1981-2010 a
(En porcentajes del total)
Risk of lock-in based on static comparative advantages

LATIN AMERICA (18 COUNTRIES): STRUCTURAL HETEROGENEITY INDICATORS, AROUND 2009 (Percentages)
Productive structure and employment: concentrated in low-productivity sectors
Source: ECLAC, on the basis of R. Infante, “América Latina en el ‘umbral del desarrollo’. Un ejercicio de convergencia productiva”, Working Paper, No. 14, Santiago, Chile, June 2011, unpublished.

Access to financing for development for middle-income countries
• The focus on per capita income does not reflect the broad and multi-faceted nature of the development process
• ECLAC proposes an alternative approach based on structural gaps must be adopted
• This implies: • Focusing cooperation and financing towards
development, not only poverty reduction • Re-thinking the role and integration of middle
income countries in the system of regional cooperation
• New political dialogue at the global and regional levels

Strengthening the regional integration agenda
• Intraregional trade, development of value chains, investment and infrastructure
• Harnessing strategic opportunities with Asia, especially China
• Enhancing the regional financial architecture • Closer regional cooperation to tackle global
challenges (global governance, financing for development, Rio+20, development agenda beyond 2015).

ECLAC’s proposal: structural change for equality
Close economic and social gaps, both internal and external • Progress towards more knowledge-intensive activities • Reduction of production and territorial heterogeneity
Spread throughout the economic and social structure:
• Production and technology capabilities • Ample job opportunities and quality employment
• Social protection with universal access
• Environmental sustainability in the context of the technology revolution
Strengthen the role of the State as a guarantor of rights and driver of policies for sustainable economic and social development
