economic and strategy viewpoint - schroders - schroders · economic and strategy viewpoint august...
TRANSCRIPT

For professional investors and advisers only.
Economic and Strategy Viewpoint August 2019

Economic and Strategy Viewpoint August 2019 2
3 The fiscal fix?
– Recent moves in the US and UK show that fiscal policy is coming back into vogue as politicians try to boost growth whilst bond yields are low. It may be the best response to a world economy hampered by geopolitical risk and policy uncertainty.
– IMF analysis suggest that both countries have some scope to ease fiscal policy, although the US may have already used much already.
– Meanwhile, despite substantial fiscal space, the Eurozone has eschewed expansionary fiscal policy. This may change given the slowdown, but in the meantime the combination of loose money and tight fiscal policy is helping the euro win the currency war.
7 What lies behind the recent weakness in US inflation?
– The US economy continues to add jobs and unemployment is at its lowest for fifty years, but core inflation has surprised to the downside over the past three quarters.
– Our bottom-up approach reveals that, while cyclical inflation components are still responding to changes in economic activity, the slowdown in oil prices and in non-oil import prices have been responsible for the recent weakness in US core inflation.
12 Why weaker sterling has failed to turbocharge the UK economy
– Despite the sharp depreciation in the pound the UK has made little progress in "rebalancing its economy".
– Two reasons help explain why. First, UK productivity growth has been appalling, allowing unit labour costs to rise and erode the competitive gains from the fall in sterling. Second, most UK exports are produced by large multinationals that can price their goods and services in overseas markets. They have kept prices unchanged and boosted profits over export volumes.
– If the pound falls far enough, eventually exports will rise, but the costs in terms of higher inflation, lower purchasing power, and the destruction of the value of savings would be devastating.
Chart: Uncertainty over economic policy is high
Source: www.policyuncertainty.com, 26 July 2019.
Keith Wade Chief Economist and Strategist (44-20)7658 6296
Irene Lauro Economist (44-20)7658 4962
Azad Zangana Senior European Economist and Strategist (44-20)7658 2671
0
50
100
150
200
250
300
350
1997 2000 2003 2006 2009 2012 2015 2018
Index
Global Economic Policy Uncertainty Index Historical Average
Economic and Strategy Viewpoint August 2019 3
The fiscal fix “The E.U. and China will further lower interest rates and pump money into their systems, making it much easier for their manufacturers to sell product. In the meantime, and with very low inflation, our Fed does nothing – and probably will do very little by comparison. Too bad!”
President Trump on Twitter. 29 July 2019
The White House and Congress have reached a deal on the US debt ceiling which removes the threat of a debt default and allows for stronger federal spending. Meanwhile, the new UK prime minister, Boris Johnson, comes to power promising a "do or die" pledge to achieve Brexit, alongside significant tax cuts and spending increases. Fiscal policy is coming back into vogue.
The break-out of bipartisan co-operation in Washington comes as a pleasant surprise. We had expected a more difficult period of negotiation with the risk of no agreement. However, both parties were able to unify behind the bill and put an end to the sequester caps which have limited federal government spending since the 2011 Budget Control Act. It also means that there will be no major stand-off over the budget until after next year's presidential election.
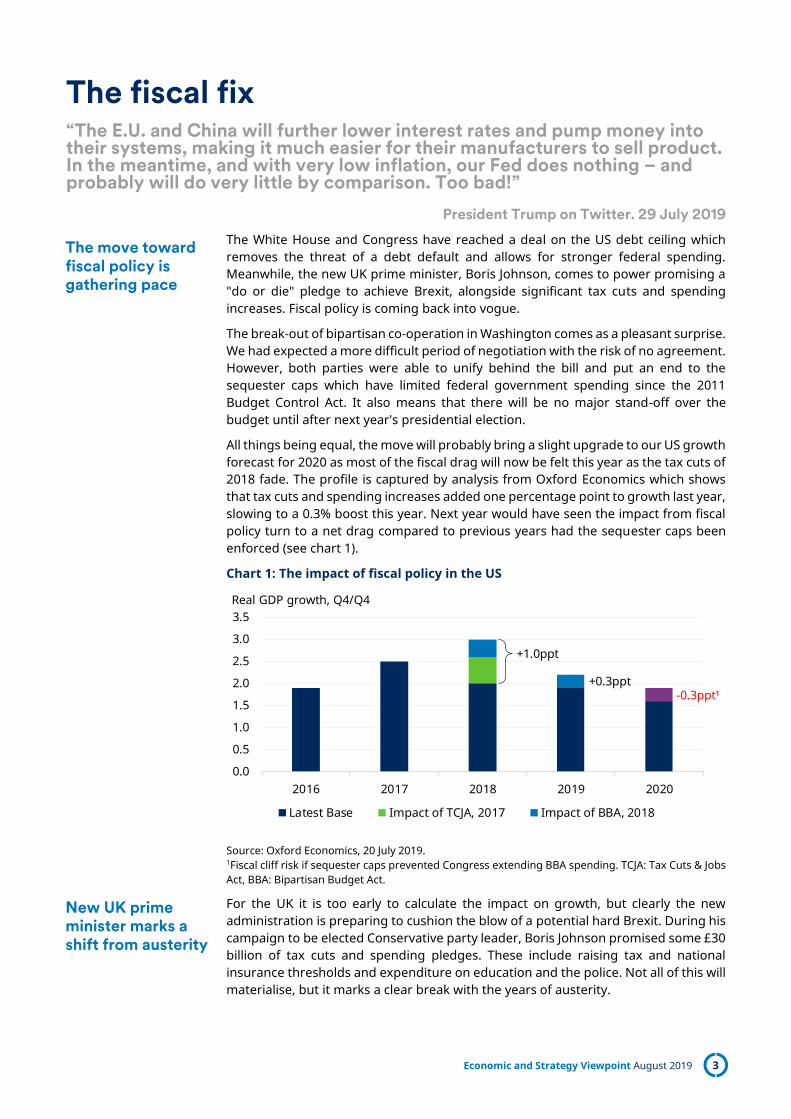
All things being equal, the move will probably bring a slight upgrade to our US growth forecast for 2020 as most of the fiscal drag will now be felt this year as the tax cuts of 2018 fade. The profile is captured by analysis from Oxford Economics which shows that tax cuts and spending increases added one percentage point to growth last year, slowing to a 0.3% boost this year. Next year would have seen the impact from fiscal policy turn to a net drag compared to previous years had the sequester caps been enforced (see chart 1).
Chart 1: The impact of fiscal policy in the US
Source: Oxford Economics, 20 July 2019. 1Fiscal cliff risk if sequester caps prevented Congress extending BBA spending. TCJA: Tax Cuts & Jobs Act, BBA: Bipartisan Budget Act.
For the UK it is too early to calculate the impact on growth, but clearly the new administration is preparing to cushion the blow of a potential hard Brexit. During his campaign to be elected Conservative party leader, Boris Johnson promised some £30 billion of tax cuts and spending pledges. These include raising tax and national insurance thresholds and expenditure on education and the police. Not all of this will materialise, but it marks a clear break with the years of austerity.
+1.0ppt
-0.3ppt¹+0.3ppt
0.0
0.5
1.0
1.5
2.0
2.5
3.0
3.5
2016 2017 2018 2019 2020
Real GDP growth, Q4/Q4
Latest Base Impact of TCJA, 2017 Impact of BBA, 2018
The move toward fiscal policy is gathering pace
New UK prime minister marks a shift from austerity

Economic and Strategy Viewpoint August 2019 4
In some respects the UK is well placed to provide a fiscal boost with the budget deficit down to 1.5% of GDP. However, the same cannot be said for the US where the deficit is approaching $1 trillion (5% of GDP). Whilst the US deficit was considerably higher only a few years ago, that was in the depths of the great recession in 2009, not approaching the top of the cycle ten years later (chart 2). An economy with the lowest level of unemployment for 50 years should be borrowing little, if anything. It would seem that much of today's US deficit is structural, rather than cyclical, with the recent deterioration coinciding with the tax cuts of 2018.
Chart 2: US budget deficit: projection for current fiscal year
FY is fiscal year. Source: Refinitiv Datastream, Consensus Economics, Schroders Economics Group. 23 July 2019.
The return of fiscal policy is being driven by political frustration with the pace of economic growth against a backdrop of low sovereign bond yields. Although the US economy is holding up and unemployment is low, the president has made no secret of his desire for stronger growth. For the UK, growth has been stuck at around 1% per annum since the Brexit referendum in 2016, well below the 2% pace achieved before the vote. In both economies, manufacturing is struggling against the slowdown in global trade.
Easier monetary policy will help, but interest rate cuts take time to feed through – up to twelve months on most estimates. Furthermore, it is debateable whether lower interest rates will address the headwind currently facing the world economy: the effect of economic uncertainty on spending decisions. Economic policy uncertainty1 is elevated (see chart on front page), causing business and households to delay spending on capital investment and big ticket items. See last month's Viewpoint for more on the drag from uncertainty.
In these circumstances, fiscal policy may be more effective at boosting growth. It directly injects money into the economy, particularly through higher government spending. The political appeal is strong, although in this case, fiscal policy becomes a solution to a problem of politicians' own making. The uncertainty has largely been created by the US-China trade wars and Brexit.
Meanwhile, tolerance of greater budget deficits has been facilitated by ultra low bond yields. It has been many years since governments feared the bond market "vigilantes" who could drive up the cost of borrowing on even a hint of fiscal easing. Today, with some $13 trillion of bonds on negative yields according to Bloomberg,
1The index captures three different measures of policy uncertainty. One component quantifies newspaper coverage of policy-related economic uncertainty. A second reflects the number of federal tax code provisions set to expire in future years. The third component uses disagreement among economic forecasters as a proxy for uncertainty. For more details see here.
-2,000
-1,500
-1,000
-500
0
-12
-10
-8
-6
-4
-2
0
2005 2007 2009 2011 2013 2015 2017 2019
$bn% GDP
RecessionBudget balance, current FY forecast, % GDPBudget balance, current FY forecast, $bn, rhs
Growth concerns and ultra low bond yields are driving the move toward fiscal policy
Economic and Strategy Viewpoint August 2019 5
investors are paying for the privilege to lend to the government. Against this backdrop it is not surprising that politicians are looking for a fiscal fix.
Finding fiscal space
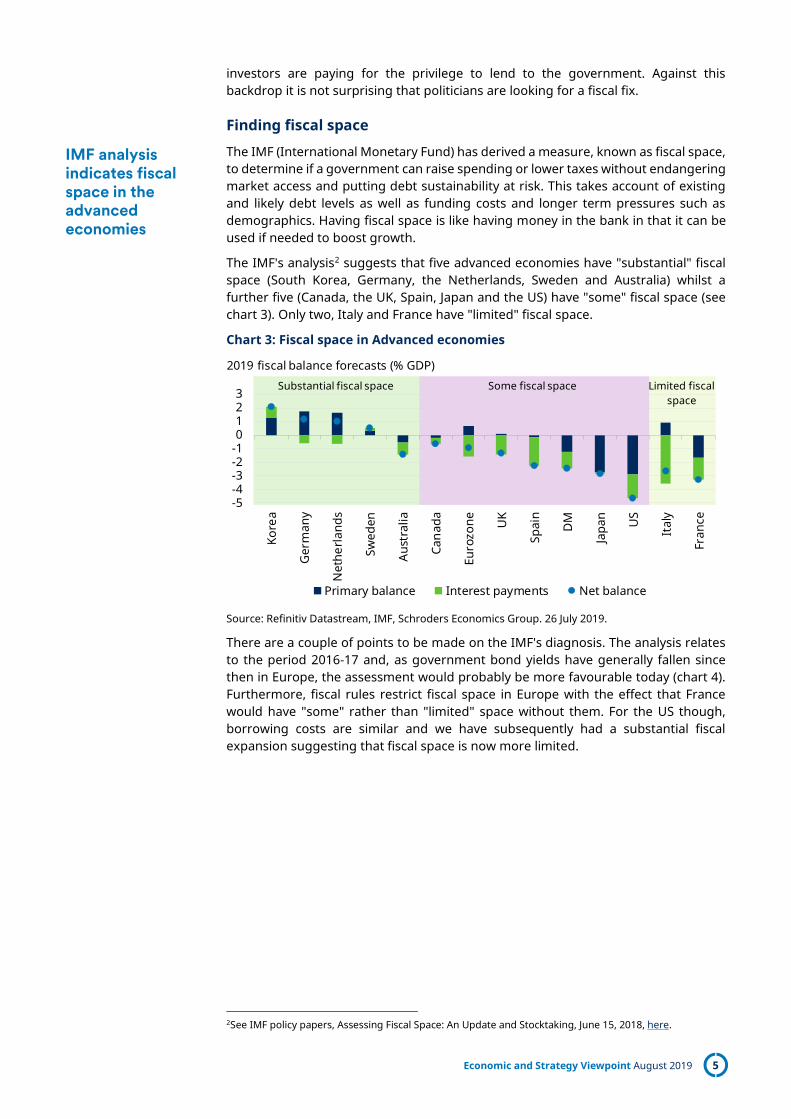
The IMF (International Monetary Fund) has derived a measure, known as fiscal space, to determine if a government can raise spending or lower taxes without endangering market access and putting debt sustainability at risk. This takes account of existing and likely debt levels as well as funding costs and longer term pressures such as demographics. Having fiscal space is like having money in the bank in that it can be used if needed to boost growth.
The IMF's analysis2 suggests that five advanced economies have "substantial" fiscal space (South Korea, Germany, the Netherlands, Sweden and Australia) whilst a further five (Canada, the UK, Spain, Japan and the US) have "some" fiscal space (see chart 3). Only two, Italy and France have "limited" fiscal space.
Chart 3: Fiscal space in Advanced economies
Source: Refinitiv Datastream, IMF, Schroders Economics Group. 26 July 2019.
There are a couple of points to be made on the IMF's diagnosis. The analysis relates to the period 2016-17 and, as government bond yields have generally fallen since then in Europe, the assessment would probably be more favourable today (chart 4). Furthermore, fiscal rules restrict fiscal space in Europe with the effect that France would have "some" rather than "limited" space without them. For the US though, borrowing costs are similar and we have subsequently had a substantial fiscal expansion suggesting that fiscal space is now more limited.
2See IMF policy papers, Assessing Fiscal Space: An Update and Stocktaking, June 15, 2018, here.
-5-4-3-2-10123
Kore
a
Ger
man
y
Net
herla
nds
Swed
en
Aust
ralia
Cana
da
Euro
zone U
K
Spai
n
DM
Japa
n US
Ital
y
Fran
ce
Primary balance Interest payments Net balance
2019 fiscal balance forecasts (% GDP)Substantial fiscal space Some fiscal space Limited fiscal
space
IMF analysis indicates fiscal space in the advanced economies

Economic and Strategy Viewpoint August 2019 6
Chart 4: Government borrowing costs: bond yields since 2016
Source: Refinitiv Datastream. 26 July 2019.
In the Eurozone, despite being given a green light from the IMF, there is not the same call for greater use of fiscal policy as in the US or UK. Germany and the Netherlands continue to run substantial budget surpluses and plan to do so in the future. This position reflects an aversion to debt and a different view on the effectiveness of government tax and spending policy. Tight fiscal policy also suits at present to help offset the European Central Bank's (ECB) loose monetary policy in those economies.
However, from a broader European perspective, an easing of fiscal policy in Germany, the Netherlands and even France would be helpful for the periphery. Especially now that the region is weakening again with the downturn in global manufacturing and trade. By doing so, they could augment the ECB's efforts to lift activity and help move the region away from negative interest rates.
ECB president Mario Draghi has made the above point and it will fall to his successor, Christine Lagarde, to move eurozone governments in this direction and take advantage of the regions fiscal space. One idea would be to fund infrastructure spending through ECB purchases of European Investment Bank bonds. Another would be a move toward a Eurozone bond, providing a facility for collective financing and creating a euro safe asset at the same time. However, such moves will take time to agree and a fiscal fix for the region looks a distant prospect at present.
In the meantime a tight fiscal/loose money stance is keeping the euro weak against the US dollar where policy is more of the tight money/loose fiscal variety. To president Trump's frustration, this is helping the Europeans win the currency war.
-1
0
1
2
3
4
2016 2017 2018 2019
10 year sovereign bond yields, %
US Treasury Italian BTP UK Gilt German Bund Japanese JGB
Despite substantial fiscal space the Eurozone has eschewed fiscal policy
Economic and Strategy Viewpoint August 2019 7
What lies behind the recent weakness in US inflation? “Despite low unemployment and solid overall growth, inflation pressures remain muted…cyclical and structural headwinds have made achieving our inflation targets a challenge”
Fed Chair Jerome Powell, 16 July 2019
US inflation has been stubbornly low since the end of the financial crisis. Even with the US economy “in a very good place” according to Federal Reserve (Fed) chair Jerome Powell, the Fed is easing the policy rate for the first time in more than a decade. In his Senate appearance on 11 July, Powell noted that economic worries, reflected in recent business confidence data, are mounting and that the global economy continues to show signs of weakness. While easier monetary conditions might help extend the current US business cycle, the Fed's concerns about inflation are also weighing on the future path of interest rates.
The US economy is experiencing the longest expansion in history, with real GDP rising at an annualised pace of 3.2% in the first quarter of 2019. Economic growth decelerated to 2.1% in the second quarter, but real GDP growth continued to come in above expectations thanks to stronger-than-expected consumer spending. The labour market remains solid and continues to gain strength, as the unemployment rate is at just 3.7%, close to its lowest level in almost 50 years. A tight labour market usually leads to stronger demand for goods and services. Recent higher-than-expected figures for retail sales confirm that the American consumer is in good shape, with ‘core’ retail sales – excluding automobiles, gasoline, building materials and food services – jumping 0.7% month-on-month (m/m) in June after an upwardly revised 0.6% increase in May.
As a result of demand outpacing supply, firms can increase prices for the goods and services they sell. This is the basic mechanism underlying the standard economic relationship known as the Phillips curve. However, even with the closing of the US output gap, fiscal stimulus and trade tariffs – all factors that should intensify upward pressure on prices – the US economy has not experienced a boost in inflation. Since peaking at 2.4% year-on-year (y/y) in July 2018, core CPI, that strips out volatile food and energy prices, has continued to trend lower, averaging 2.0% y/y in the first half of 2019.
During a press conference in early May, Fed Chair Jerome Powell said that low inflation could be explained by transitory factors, including investment management fees, apparel prices and air fares. Some economists believe that structural factors, such as technological changes and globalisation are behind the inflation slowdown and have contributed to the breakdown in the Phillips curve.
The recent weakness in inflation was not expected
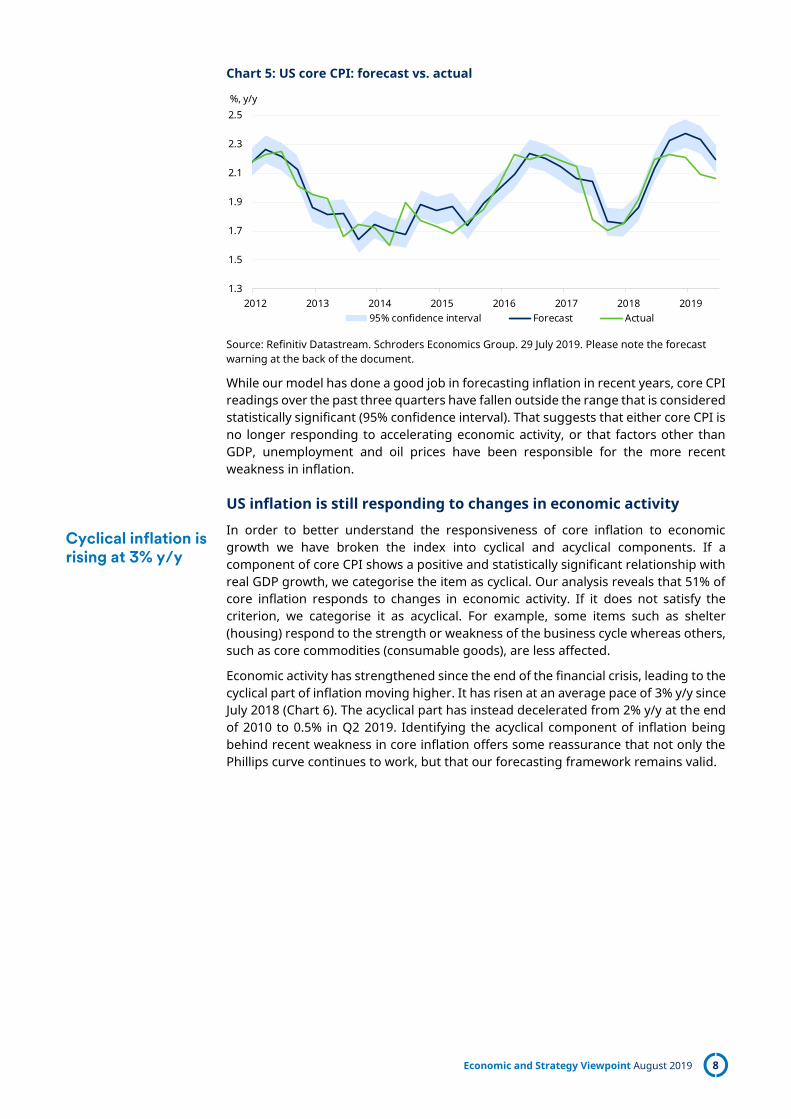
According to our forecasting model, core inflation has been lower than predicted since peaking in Q3 2018 (chart 5). Our core CPI forecasting model builds on the economic relationship that changes in domestic economic activity feed through into price pressure. As such, lagged real GDP growth and unemployment represent the pillars of our forecasting model. Oil prices are also taken into account because they drive prices for transportation services, and therefore have a statistically significant indirect effect on core CPI.
The US labour market remains tight
But inflation is not picking up
Core CPI readings outside the 95% confidence interval for the past three quarters
Economic and Strategy Viewpoint August 2019 8
Chart 5: US core CPI: forecast vs. actual
Source: Refinitiv Datastream. Schroders Economics Group. 29 July 2019. Please note the forecast warning at the back of the document.
While our model has done a good job in forecasting inflation in recent years, core CPI readings over the past three quarters have fallen outside the range that is considered statistically significant (95% confidence interval). That suggests that either core CPI is no longer responding to accelerating economic activity, or that factors other than GDP, unemployment and oil prices have been responsible for the more recent weakness in inflation.
US inflation is still responding to changes in economic activity
In order to better understand the responsiveness of core inflation to economic growth we have broken the index into cyclical and acyclical components. If a component of core CPI shows a positive and statistically significant relationship with real GDP growth, we categorise the item as cyclical. Our analysis reveals that 51% of core inflation responds to changes in economic activity. If it does not satisfy the criterion, we categorise it as acyclical. For example, some items such as shelter (housing) respond to the strength or weakness of the business cycle whereas others, such as core commodities (consumable goods), are less affected.
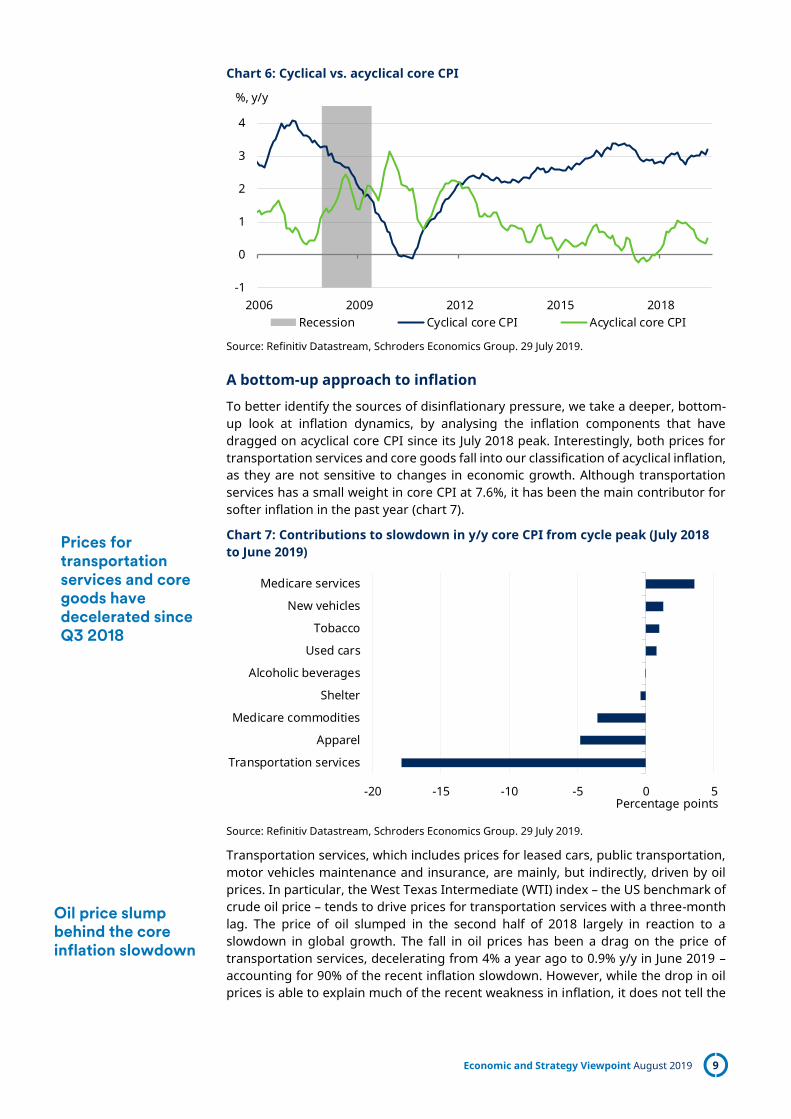
Economic activity has strengthened since the end of the financial crisis, leading to the cyclical part of inflation moving higher. It has risen at an average pace of 3% y/y since July 2018 (Chart 6). The acyclical part has instead decelerated from 2% y/y at the end of 2010 to 0.5% in Q2 2019. Identifying the acyclical component of inflation being behind recent weakness in core inflation offers some reassurance that not only the Phillips curve continues to work, but that our forecasting framework remains valid.
1.3
1.5
1.7
1.9
2.1
2.3
2.5
2012 2013 2014 2015 2016 2017 2018 2019
%, y/y
95% confidence interval Forecast Actual
Cyclical inflation is rising at 3% y/y
Economic and Strategy Viewpoint August 2019 9
Chart 6: Cyclical vs. acyclical core CPI
Source: Refinitiv Datastream, Schroders Economics Group. 29 July 2019.
A bottom-up approach to inflation
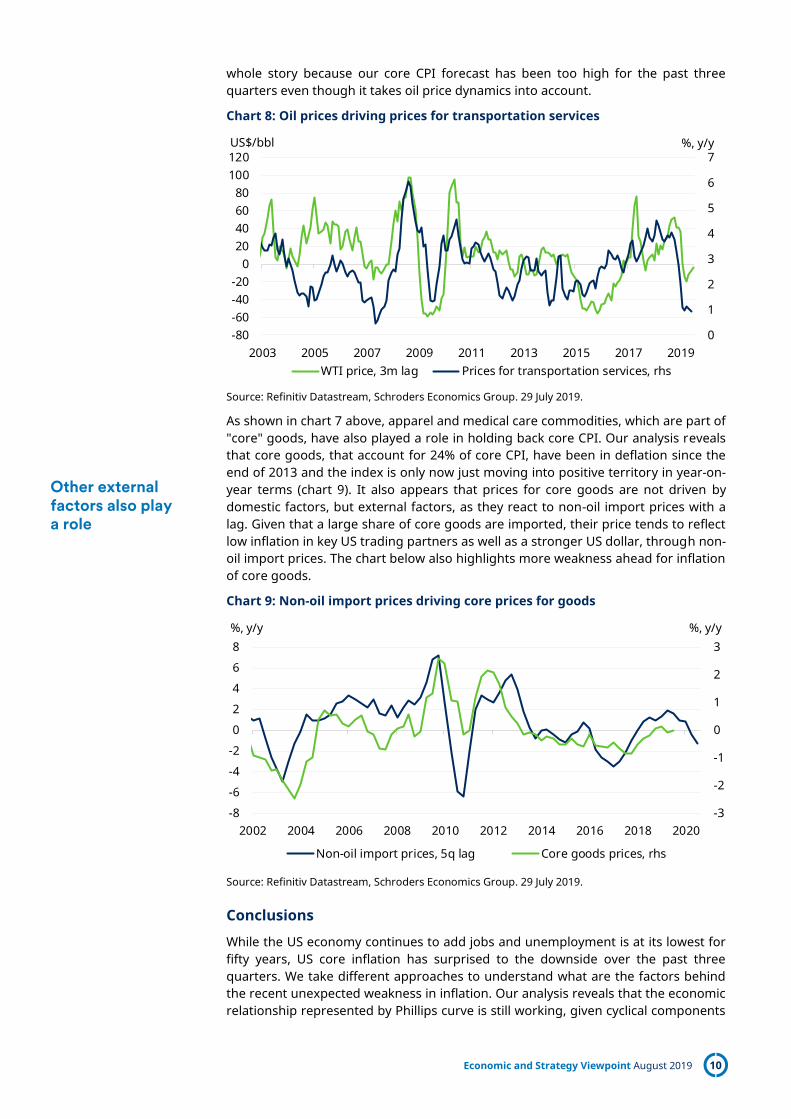
To better identify the sources of disinflationary pressure, we take a deeper, bottom-up look at inflation dynamics, by analysing the inflation components that have dragged on acyclical core CPI since its July 2018 peak. Interestingly, both prices for transportation services and core goods fall into our classification of acyclical inflation, as they are not sensitive to changes in economic growth. Although transportation services has a small weight in core CPI at 7.6%, it has been the main contributor for softer inflation in the past year (chart 7).
Chart 7: Contributions to slowdown in y/y core CPI from cycle peak (July 2018 to June 2019)
Source: Refinitiv Datastream, Schroders Economics Group. 29 July 2019.
Transportation services, which includes prices for leased cars, public transportation, motor vehicles maintenance and insurance, are mainly, but indirectly, driven by oil prices. In particular, the West Texas Intermediate (WTI) index – the US benchmark of crude oil price – tends to drive prices for transportation services with a three-month lag. The price of oil slumped in the second half of 2018 largely in reaction to a slowdown in global growth. The fall in oil prices has been a drag on the price of transportation services, decelerating from 4% a year ago to 0.9% y/y in June 2019 – accounting for 90% of the recent inflation slowdown. However, while the drop in oil prices is able to explain much of the recent weakness in inflation, it does not tell the
-1
0
1
2
3
4
2006 2009 2012 2015 2018
%, y/y
Recession Cyclical core CPI Acyclical core CPI
-20 -15 -10 -5 0 5
Transportation services
Apparel
Medicare commodities
Shelter
Alcoholic beverages
Used cars
Tobacco
New vehicles
Medicare services
Percentage points
Prices for transportation services and core goods have decelerated since Q3 2018
Oil price slump behind the core inflation slowdown
Economic and Strategy Viewpoint August 2019 10
whole story because our core CPI forecast has been too high for the past three quarters even though it takes oil price dynamics into account.
Chart 8: Oil prices driving prices for transportation services
Source: Refinitiv Datastream, Schroders Economics Group. 29 July 2019.
As shown in chart 7 above, apparel and medical care commodities, which are part of "core" goods, have also played a role in holding back core CPI. Our analysis reveals that core goods, that account for 24% of core CPI, have been in deflation since the end of 2013 and the index is only now just moving into positive territory in year-on-year terms (chart 9). It also appears that prices for core goods are not driven by domestic factors, but external factors, as they react to non-oil import prices with a lag. Given that a large share of core goods are imported, their price tends to reflect low inflation in key US trading partners as well as a stronger US dollar, through non-oil import prices. The chart below also highlights more weakness ahead for inflation of core goods.
Chart 9: Non-oil import prices driving core prices for goods
Source: Refinitiv Datastream, Schroders Economics Group. 29 July 2019.
Conclusions
While the US economy continues to add jobs and unemployment is at its lowest for fifty years, US core inflation has surprised to the downside over the past three quarters. We take different approaches to understand what are the factors behind the recent unexpected weakness in inflation. Our analysis reveals that the economic relationship represented by Phillips curve is still working, given cyclical components
0
1
2
3
4
5
6
7
-80-60-40-20
020406080
100120
2003 2005 2007 2009 2011 2013 2015 2017 2019
%, y/yUS$/bbl
WTI price, 3m lag Prices for transportation services, rhs
-3
-2
-1
0
1
2
3
-8
-6
-4
-2
0
2
4
6
8
2002 2004 2006 2008 2010 2012 2014 2016 2018 2020
%, y/y%, y/y
Non-oil import prices, 5q lag Core goods prices, rhs
Other external factors also play a role

Economic and Strategy Viewpoint August 2019 11
of core CPI are rising as economic slack diminishes. Moreover, by taking a deeper bottom-up look at inflation dynamics, we realise that there are mainly two forces that are dragging on the acyclical components of core inflation. Lower oil prices are weighing on inflation through prices for transportation services, while a stronger dollar and subdued inflation in key US trading partners are dragging on prices for core goods.
Given their significant impact, we incorporate non-oil import prices into our forecasting model. The new model estimates that core inflation will rise at an average pace of 2.2% this year as well as in 2020. Contained inflation, combined with our outlook for a sluggish economy, is not likely to prevent the Fed from cutting interest rates, especially given the debate over allowing inflation to overshoot late in the cycle. We expect the Fed to make another move in September and to provide more stimulus next year given the headwinds facing the economy.
Economic and Strategy Viewpoint August 2019 12
Why weaker sterling has failed to turbocharge the UK economy3 “Analysts predict that in the event of a no deal [Brexit], sterling could fall by over 20%. Is this such a bad thing?...Our goods will become 20% more competitive on the global market…”
Former Brexit Secretary David Davis, February 2019
According to the former governor of the Bank of England, Lord Mervyn King, the depreciation in sterling was a "welcome change", as it would help "rebalance the UK economy". Those comments were in reference to the depreciation in sterling since the Brexit referendum, yet since then, the UK has not made much progress in improving its trade position, and it has certainly not seen any boost to GDP growth.
Sterling is once again under pressure, with a further depreciation expected should the UK leave the EU without a deal. Some commentators continue to believe that weaker sterling can help the economy, but we disagree.
Poor trade performance
The fall in sterling was supposed to rejuvenate British industry. The UK's exports would become cheaper to overseas buyers, and would therefore boost demand and sales. Faster growth in exports would boost the economy, along with job creation and wages.
Between the end of 2015 and the end of the first quarter of 2019, trade weighted sterling fell 12.1%. Over this period, the manufacturing sector as a share of the total value added of the economy has risen from 10.02% to 10.07%. As a share of total employment, manufacturing has risen from 7.69% to 7.70%. Hardly the rebalancing some had hoped for.
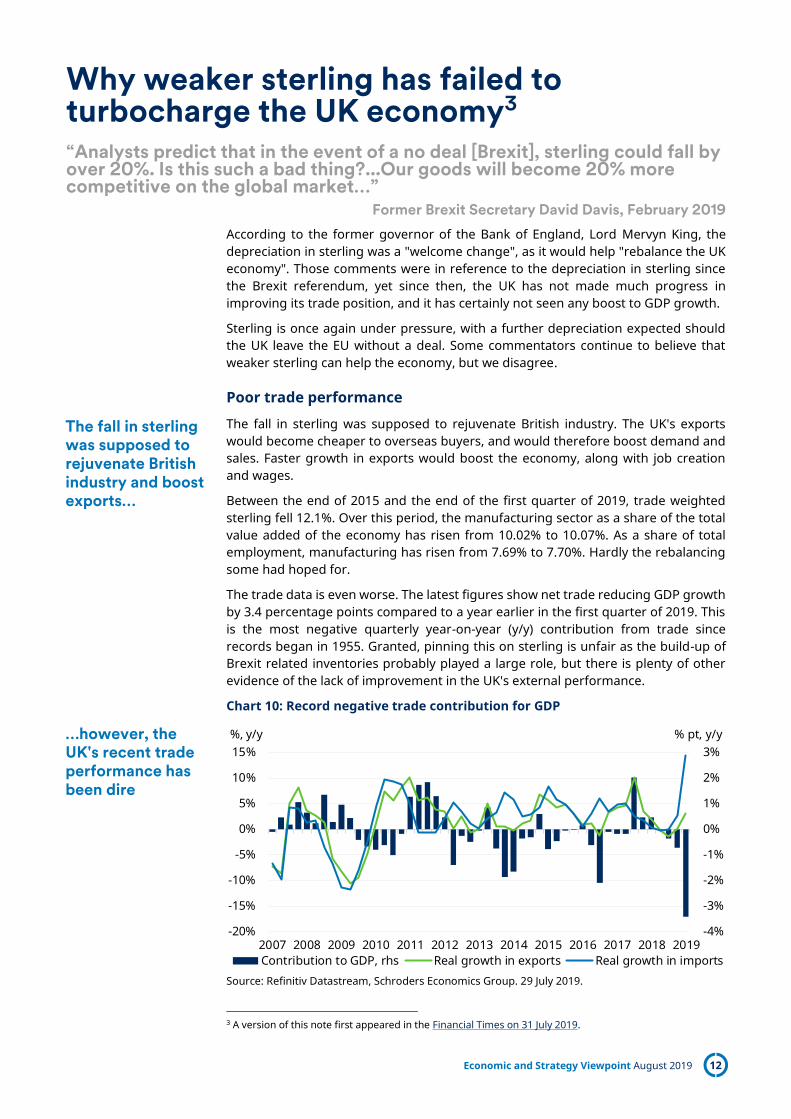
The trade data is even worse. The latest figures show net trade reducing GDP growth by 3.4 percentage points compared to a year earlier in the first quarter of 2019. This is the most negative quarterly year-on-year (y/y) contribution from trade since records began in 1955. Granted, pinning this on sterling is unfair as the build-up of Brexit related inventories probably played a large role, but there is plenty of other evidence of the lack of improvement in the UK's external performance.
Chart 10: Record negative trade contribution for GDP
Source: Refinitiv Datastream, Schroders Economics Group. 29 July 2019.
3 A version of this note first appeared in the Financial Times on 31 July 2019.
-4%
-3%
-2%
-1%
0%
1%
2%
3%
-20%
-15%
-10%
-5%
0%
5%
10%
15%
2007 2008 2009 2010 2011 2012 2013 2014 2015 2016 2017 2018 2019Contribution to GDP, rhs Real growth in exports Real growth in imports
%, y/y % pt, y/y
The fall in sterling was supposed to rejuvenate British industry and boost exports…
…however, the UK's recent trade performance has been dire

Economic and Strategy Viewpoint August 2019 13
A standard trade model, like those used by the Bank of England or the IMF, would rely on several key drivers to explain the volume of exports. The currency is certainly one of those variables, but the most important by far is either GDP growth or domestic demand growth in a country's export markets. A simple weighted average of GDP growth using the UK's export shares will do. This variable tends to be between three to five times more powerful in explaining growth in exports than the currency. This suggests that when examining the success of a nation's export performance, we also have to take into account global growth, or more commonly used, global trade. Has the UK managed to take a bigger slice of the world trade cake?
Since 2000, the volume of global exports has almost doubled, while the UK's export volumes have risen by almost two-thirds (chart 11). The UK's share of global exports has therefore fallen, despite trade weighted sterling falling 29% over the same period.
Chart 11: UK exports fail to keep up with global exports growth
Source: Refinitiv Datastream, Schroders Economics Group. 29 July 2019.
To highlight how poor the UK's performance has been, we can compare it to France, which saw its total exports rise by a similar magnitude (71%), but crucially, French exporters had to endure a 23% appreciation in the trade weighted euro over the same period. Meanwhile, more competitive Germany managed to more than double its exports (139%).
It's not all about the currency
Currency moves do, over the long-term, impact the external performance of a nation. However, there are two additional factors to consider when explaining the UK's dismal performance.
The first is the competitiveness of the labour market. The UK has long been known for having one of the most flexible labour markets in the world. Ease of hiring, firing, change of contract, and even importing foreign talent is well regarded. Despite this, it has not been able to keep up with regards to its productivity growth, and has therefore allowed the cost of labour per unit of output (or unit labour costs) to rise versus its competitors.
For example, and as mentioned earlier, trade weighted sterling has fallen by 29% since January 2000, while trade weighted euro has risen by 23%. Despite this wide gulf, the performance of both the UK's and Germany's real effective exchange rates has almost been the same over this period. The real effective exchange rate is the nominal trade weighted exchange rate, but adjusted for unit labour costs. Therefore, the similar performance here tells us that the advantage the UK had achieved
193
174
129
80
100
120
140
160
180
200
00 01 02 03 04 05 06 07 08 09 10 11 12 13 14 15 16 17 18 19
Index (100 = January 2000)
Global exports (vol) UK exports (vol) Trade weighted sterling (inverted)
Despite a 29% depreciation since 2000, the UK's export market share of world trade has fallen
Currencies are important, but so is productivity growth and the competitiveness of the labour market

Economic and Strategy Viewpoint August 2019 14
by devaluing sterling has largely been lost (against Germany) due to poor labour market performance.
The second factor to consider is whether exporters have pricing power in foreign markets. Most of the value of the UK's total exports is generated by a small proportion of firms that are concentrated in a few sectors. They tend to be large multi-national companies that are protected by patents and intellectual property. A good example would be GlaxoSmithKline – a global top 10 pharmaceutical company, that has the ability to price its drugs in foreign markets.
As sterling has depreciated, many British exporters that have had the ability to control the price of their goods and services overseas have simply left their prices unchanged and become more profitable in sterling terms. This is great for investors, but less so for the economy in real terms, as without the increase in exports, part of the expected benefit from the currency depreciation is lost.
Of course, there are still many British exporters that simply produce and sell homogenous goods, and have to take the price dictated by international markets. But we believe that the multi-nationals with pricing power dominate the UK's exporters. Official data shows that there is a close relationship between the inflation rate of UK export prices in sterling and the inverse change in trade weighted sterling (chart 12 below).
Chart 12: Sterling export price inflation vs. trade weighted sterling
Source: Thomson Reuters Datastream, Schroders Economics Group. 26 July 2019.
As mentioned above, if sterling depreciates far enough, eventually, the UK will be able to compete. Individuals and companies will choose to export rather than serve the domestic economy. However, a much larger depreciation would be needed, along with labour costs not increasing to erode the competitive advantage.
The cost of such a depreciation in terms of higher inflation, lower purchasing power, and the destruction of the value of savings would be devastating.
-20%
-15%
-10%
-5%
0%
5%
10%
15%-15%
-10%
-5%
0%
5%
10%
15%
20%
04 05 06 07 08 09 10 11 12 13 14 15 16 17 18 19
Exports price inflation Trade weighted sterling, rhs (inverted)
3m, y/y 3m, y/y
Many large multinationals have kept their prices unchanged despite sterling's depreciation…
…boosting profits over the volume of exports

Economic and Strategy Viewpoint August 2019 15
Schroders Economics Group: Views at a glance Macro summary – August 2019 Key points Baseline
– After expanding by 3.3% in 2018, global growth is expected to moderate to 2.8% in 2019 and 2.6% in 2020. Inflation is forecast to decline to 2.6% this year after 2.7% in 2018 and then rise to 2.7% in 2020. Meanwhile we expect the US and China to sign a trade deal in December, although the impact of actions so far will still be felt in 2019 and 2020.
– US growth is forecast to slow to 2.6% in 2019 and 1.5% in 2020. Following recent statements from the Fed we now expect two rate cuts this year in July and September. As US fiscal stimulus fades and the economy slows, the Fed is forecast to cut rates twice more in 2020 after ending quantitative tightening in September 2019.
– Eurozone growth is forecast to moderate from 2% in 2018 to 1.2% in 2019 as the full effects from the US-China trade war and Brexit hit European exporters. Inflation is expected to remain under 2%, with higher energy price inflation in 2018 replaced by higher core inflation in 2019. The ECB has ended QE and is expected to keep interest rates on hold through 2020.
– UK growth is likely to remain constant at 1.4% this year, unchanged from 2018. Assuming that a Brexit deal with the EU passes parliament in Q4 ahead of a transition period that preserves the status quo of single market and customs union membership, growth is expected to remain at 1.4% in 2020. Inflation is expected to fall to 2% in 2019 thanks to an expected rise in sterling, but stronger quarterly growth is expected to push inflation up to 2.3% in 2020. Meanwhile, the BoE is expected to hike once in 2020 (to 1.00%).
– Growth in Japan should fall to 0.9% in 2019 from 1.1% in 2018, however the path of activity should be volatile owing to the consumption tax hike in October this year. A slow recovery should follow resulting in 0.2% growth in 2020. We do not expect the BoJ to alter yield curve control as inflation remains well under 2% in our forecast horizon.
– Emerging market economies should slow to 4.4% in 2019 after 4.8% in 2018, but pick-up slightly to 4.6% in 2020. We are optimistic that for most of the BRIC economies’ domestic factors can outweigh global problems in 2020. China benefits from an easing of trade tensions with the US, but against a backdrop of secular decline the PBoC should continue to ease.
Risks
– Risks are tilted toward deflation with the highest individual risk going on the US recession 2020 scenario where the economy proves more fragile than expected as fiscal stimulus is withdrawn. We also see a risk of an escalation in the US-China dispute with the US extending the trade war to Europe.
Chart: World GDP forecast
Source: Schroders Economics Group, May 2019. Please note the forecast warning at the back of the document.
3.24.0
5.0 4.8 5.3 5.3
2.5
-0.6
4.93.7
2.8 3.0 3.2 3.2 2.73.3 3.3 2.8 2.6
-3-2-10123456
2002 2003 2004 2005 2006 2007 2008 2009 2010 2011 2012 2013 2014 2015 2016 2017 2018 2019 2020
Contributions to World GDP growth (y/y)
US Europe Japan Rest of advanced BRICS Rest of emerging World
Forecast
Economic and Strategy Viewpoint August 2019 16
Schroders Baseline Forecast
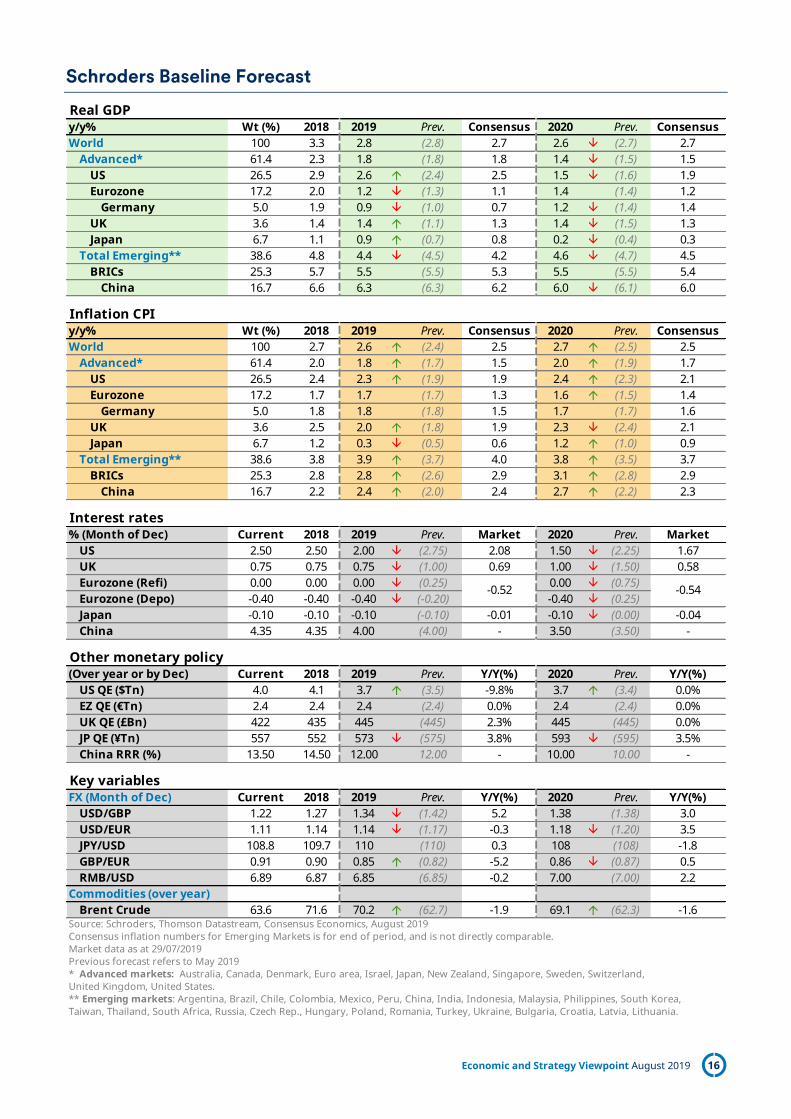
Real GDPy/y% Wt (%) 2018 2019 Prev. Consensus 2020 Prev. ConsensusWorld 100 3.3 2.8 (2.8) 2.7 2.6 (2.7) 2.7
Advanced* 61.4 2.3 1.8 (1.8) 1.8 1.4 (1.5) 1.5US 26.5 2.9 2.6 (2.4) 2.5 1.5 (1.6) 1.9Eurozone 17.2 2.0 1.2 (1.3) 1.1 1.4 (1.4) 1.2
Germany 5.0 1.9 0.9 (1.0) 0.7 1.2 (1.4) 1.4UK 3.6 1.4 1.4 (1.1) 1.3 1.4 (1.5) 1.3Japan 6.7 1.1 0.9 (0.7) 0.8 0.2 (0.4) 0.3
Total Emerging** 38.6 4.8 4.4 (4.5) 4.2 4.6 (4.7) 4.5BRICs 25.3 5.7 5.5 (5.5) 5.3 5.5 (5.5) 5.4
China 16.7 6.6 6.3 (6.3) 6.2 6.0 (6.1) 6.0
Inflation CPI y/y% Wt (%) 2018 2019 Prev. Consensus 2020 Prev. ConsensusWorld 100 2.7 2.6 (2.4) 2.5 2.7 (2.5) 2.5
Advanced* 61.4 2.0 1.8 (1.7) 1.5 2.0 (1.9) 1.7US 26.5 2.4 2.3 (1.9) 1.9 2.4 (2.3) 2.1Eurozone 17.2 1.7 1.7 (1.7) 1.3 1.6 (1.5) 1.4
Germany 5.0 1.8 1.8 (1.8) 1.5 1.7 (1.7) 1.6UK 3.6 2.5 2.0 (1.8) 1.9 2.3 (2.4) 2.1Japan 6.7 1.2 0.3 (0.5) 0.6 1.2 (1.0) 0.9
Total Emerging** 38.6 3.8 3.9 (3.7) 4.0 3.8 (3.5) 3.7BRICs 25.3 2.8 2.8 (2.6) 2.9 3.1 (2.8) 2.9
China 16.7 2.2 2.4 (2.0) 2.4 2.7 (2.2) 2.3
Interest rates % (Month of Dec) Current 2018 2019 Prev. Market 2020 Prev. Market
US 2.50 2.50 2.00 (2.75) 2.08 1.50 (2.25) 1.67UK 0.75 0.75 0.75 (1.00) 0.69 1.00 (1.50) 0.58Eurozone (Refi) 0.00 0.00 0.00 (0.25) 0.00 (0.75)Eurozone (Depo) -0.40 -0.40 -0.40 (-0.20) -0.40 (0.25)Japan -0.10 -0.10 -0.10 (-0.10) -0.01 -0.10 (0.00) -0.04China 4.35 4.35 4.00 (4.00) - 3.50 (3.50) -
Other monetary policy(Over year or by Dec) Current 2018 2019 Prev. Y/Y(%) 2020 Prev. Y/Y(%)
US QE ($Tn) 4.0 4.1 3.7 (3.5) -9.8% 3.7 (3.4) 0.0%EZ QE (€Tn) 2.4 2.4 2.4 (2.4) 0.0% 2.4 (2.4) 0.0%UK QE (£Bn) 422 435 445 (445) 2.3% 445 (445) 0.0%JP QE (¥Tn) 557 552 573 (575) 3.8% 593 (595) 3.5%China RRR (%) 13.50 14.50 12.00 12.00 - 10.00 10.00 -
Key variablesFX (Month of Dec) Current 2018 2019 Prev. Y/Y(%) 2020 Prev. Y/Y(%)
USD/GBP 1.22 1.27 1.34 (1.42) 5.2 1.38 (1.38) 3.0USD/EUR 1.11 1.14 1.14 (1.17) -0.3 1.18 (1.20) 3.5JPY/USD 108.8 109.7 110 (110) 0.3 108 (108) -1.8GBP/EUR 0.91 0.90 0.85 (0.82) -5.2 0.86 (0.87) 0.5RMB/USD 6.89 6.87 6.85 (6.85) -0.2 7.00 (7.00) 2.2
Commodities (over year)Brent Crude 63.6 71.6 70.2 (62.7) -1.9 69.1 (62.3) -1.6
Consensus inflation numbers for Emerging Markets is for end of period, and is not directly comparable.
United Kingdom, United States.** Emerging markets: Argentina, Brazil, Chile, Colombia, Mexico, Peru, China, India, Indonesia, Malaysia, Philippines, South Korea,Taiwan, Thailand, South Africa, Russia, Czech Rep., Hungary, Poland, Romania, Turkey, Ukraine, Bulgaria, Croatia, Latvia, Lithuania.
-0.52 -0.54
Source: Schroders, Thomson Datastream, Consensus Economics, August 2019
Market data as at 29/07/2019Previous forecast refers to May 2019* Advanced markets: Australia, Canada, Denmark, Euro area, Israel, Japan, New Zealand, Singapore, Sweden, Switzerland,
Economic and Strategy Viewpoint August 2019 17
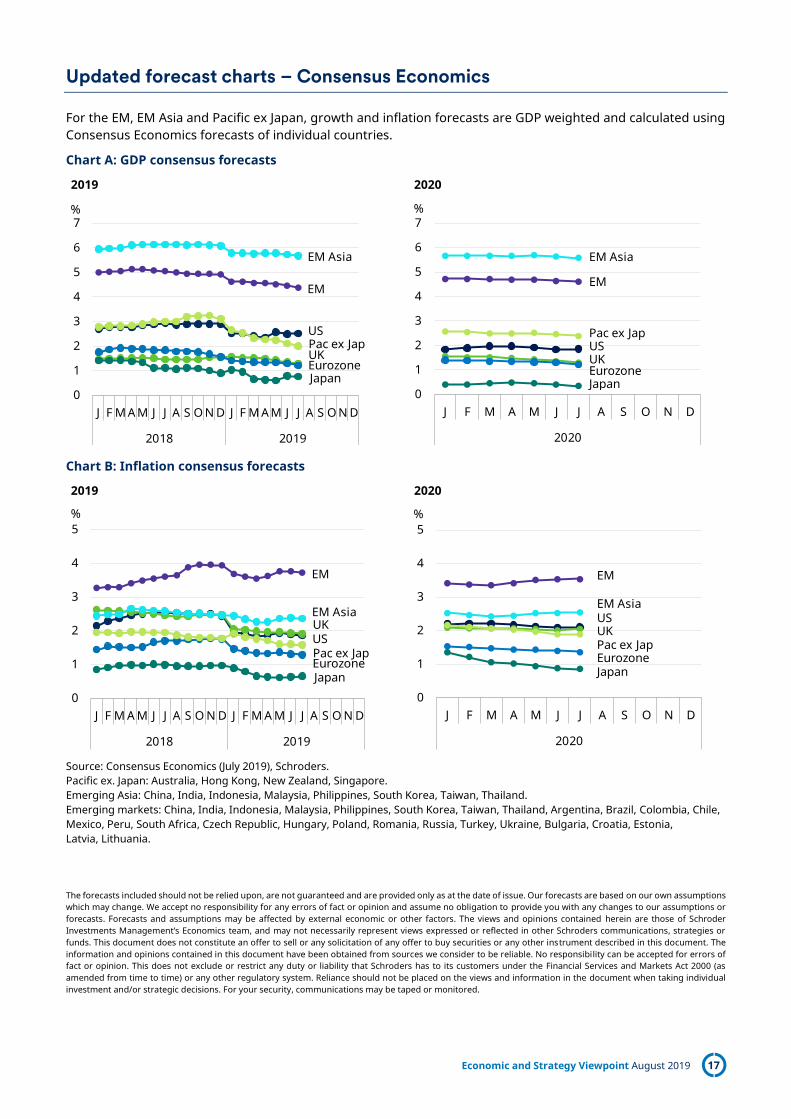
Updated forecast charts – Consensus Economics
For the EM, EM Asia and Pacific ex Japan, growth and inflation forecasts are GDP weighted and calculated using Consensus Economics forecasts of individual countries.
Chart A: GDP consensus forecasts
2019 2020
Chart B: Inflation consensus forecasts
2019 2020
Source: Consensus Economics (July 2019), Schroders. Pacific ex. Japan: Australia, Hong Kong, New Zealand, Singapore. Emerging Asia: China, India, Indonesia, Malaysia, Philippines, South Korea, Taiwan, Thailand. Emerging markets: China, India, Indonesia, Malaysia, Philippines, South Korea, Taiwan, Thailand, Argentina, Brazil, Colombia, Chile, Mexico, Peru, South Africa, Czech Republic, Hungary, Poland, Romania, Russia, Turkey, Ukraine, Bulgaria, Croatia, Estonia, Latvia, Lithuania. The forecasts included should not be relied upon, are not guaranteed and are provided only as at the date of issue. Our forecasts are based on our own assumptions which may change. We accept no responsibility for any errors of fact or opinion and assume no obligation to provide you with any changes to our assumptions or forecasts. Forecasts and assumptions may be affected by external economic or other factors. The views and opinions contained herein are those of Schroder Investments Management’s Economics team, and may not necessarily represent views expressed or reflected in other Schroders communications, strategies or funds. This document does not constitute an offer to sell or any solicitation of any offer to buy securities or any other instrument described in this document. The information and opinions contained in this document have been obtained from sources we consider to be reliable. No responsibility can be accepted for errors of fact or opinion. This does not exclude or restrict any duty or liability that Schroders has to its customers under the Financial Services and Markets Act 2000 (as amended from time to time) or any other regulatory system. Reliance should not be placed on the views and information in the document when taking individual investment and/or strategic decisions. For your security, communications may be taped or monitored.
0
1
2
3
4
5
6
7
J F M A M J J A S O N D J F M A M J J A S O N D
2018 2019
%
EM
EM Asia
Pac ex JapUK
Japan
US
Eurozone
0
1
2
3
4
5
6
7
J F M A M J J A S O N D
2020
%
EM
EM Asia
Pac ex Jap
UK
Japan
US
Eurozone
0
1
2
3
4
5
J F M A M J J A S O N D J F M A M J J A S O N D
2018 2019
%
EM
EM Asia
Pac ex Jap
UK
Japan
US
Eurozone
0
1
2
3
4
5
J F M A M J J A S O N D
2020
%
EM
EM Asia
Pac ex JapUK
Japan
US
Eurozone

Schroder Investment Management Limited
1 London Wall Place, London, EC2Y 5AU Tel: + 44(0) 20 7658 6000
schroders.com
@Schroders Important information: This document is intended to be for information purposes only and it is not intended as promotional material in any respect. The material is not intended as an offer or solicitation for the purchase or sale of any financial instrument. The material is not intended to provide, and should not be relied on for, accounting, legal or tax advice, or investment recommendations. Information herein is believed to be reliable but Schroders does not warrant its completeness or accuracy. No responsibility can be accepted for errors of fact or opinion. Reliance should not be placed on the views and information in the document where taking
individual investment and/or strategic decisions. Past performance is not a reliable indicator of future results, prices of shares and income from them may fall as well as rise and investors may not get back the amount originally invested. Schroders has expressed its own views in this document and these may change. Issued by Schroder Investment Management Limited, 1 London Wall Place, London, EC2Y 5AU, which is authorised and regulated by the Financial Conduct Authority. For your security, communications may be taped or monitored. EU04102.